Embed Size (px)
Citation preview
Franskston 66kV Circuit Breaker
Replacement Planning Report
Project Specification Planning Report
Expected Publication - November 2020
Planning Report (prepared in advance to support AusNet Services TRR Submission) 2
Important notice
Purpose
AusNet Services has prepared this document to provide information about potential limitations in
the Victorian transmission network and options that could address these limitations.
Disclaimer
This document may or may not contain all available information on the subject matter this
document purports to address. The information contained in this document is subject to review
and may be amended any time.
To the maximum extent permitted by law, AusNet Services makes no representation or warranty
(express or implied) as to the accuracy, reliability, or completeness of the information contained
in this document, or its suitability for any intended purpose. AusNet Services (which, for the
purposes of this disclaimer, includes all of its related bodies corporate, its officers, employees,
contractors, agents and consultants, and those of its related bodies corporate) shall have no
liability for any loss or damage (be it direct or indirect, including liability by reason of negligence
or negligent misstatement) for any statements, opinions, information or matter (expressed or
implied) arising out of, contained in, or derived from, or for any omissions from, the information
in this document.
Planning Report (prepared in advance to support AusNet Services TRR Submission) 3
Executive summary
Responsibility AusNet Transmission Group (AusNet Services) as a Transmission Network Service Provider (TNSP) in the state of Victoria has the ownership, operation, and maintenance responsibility for Frankston Terminal Station (FTS). TNSP obligations include maintaining a safe working environment for staff and contractors, maintaining the quality, reliability, and security of customer supplies, and preventing operating and maintenance costs from escalating to inefficient levels.
Emerging Constraints Some of the 66kV circuit breakers at FTS are in a poor condition with an increasing risk of failure. Condition assessments indicate that these assets are approaching the end of their technical lives. The emerging service constraints are:
• Health and safety risks presented by a possible explosive failure of instrument transformers or circuit breakers;
• Security of supply risks presented by a failure of the seven 66kV circuit breakers;
• Collateral plant damage risks presented by an explosive failure of an instrument transformer or circuit breaker bushing;
• Environmental risks associated with explosive asset failures.
Economic Option This planning study considers credible options to address the service constraints and to meet the long-term planning requirements for FTS outlined in the Victorian Annual Planning Report1 (VAPR) and Transmission Connection Planning Report2 (TCPR). The options that have been assessed are:
• Business as usual to define the baseline risk;
• Run to failure and replace assets upon failure;
• Staged replacement of assets
The most economic option to address the emerging constraints at FTS is a selective (staged) replacement of critical circuit breakers. This option involves some network reconfiguration and addresses all emerging risks. This option has the lowest present value cost ($2.5 M) and is consistent with the future development plans for FTS. The economic timing for project completion is before Summer 2024/25 with an estimated total capital cost of $2.3 M.
1 Victorian Annual Planning Report, 2019 2 Transmission connection planning report, 2017
Planning Report (prepared in advance to support AusNet Services TRR Submission) 2
Table of Contents
1. Purpose ................................................................................................... 4
2. Regulatory Obligations and Customer Requirements ............................................... 5
3. Background ............................................................................................... 6
4. Planning Considerations ................................................................................ 7
4.1. Planning Responsibilities ............................................................................ 7
4.2. Demand Forecast ..................................................................................... 7
4.3. Future Planning Requirements ...................................................................... 7
5. Asset Condition .......................................................................................... 8
6. Emerging constraints ................................................................................... 9
6.1. Safety and Environmental Hazards ................................................................. 9
6.1.1. Circuit Breakers .................................................................................... 9
6.2. Safety, Plant Collateral Damage and Environmental Risk Cost ................................. 9
7. Options to Address Risks ..............................................................................10
8. Evaluation of Options ..................................................................................11
8.1. Option 1: Business as Usual ........................................................................11
8.2. Option 2: Run to fail ................................................................................11
8.3. Option 3: Stage replacement of assets ...........................................................12
8.4. Present Value Analysis ..............................................................................12
8.5. Economic Option and Economic Timing ..........................................................12
8.6. Sensitivity Studies ...................................................................................13
9. Scope of Work ..........................................................................................14
Appendix A - Asset condition framework ..............................................................15
Figures
Figure 1 – Victorian Transmission Network ................................. 6
Tables
Table 1 – Condition Score and Remaining Service Potential ..... 8
Table 2 – Asset Information .......................................................... 8
Planning Report (prepared in advance to support AusNet Services TRR Submission) 3
Table 3 – Economic Assessment of Options – Base case assumptions 12
Table 4 – Economic Assessment of Options – Sensitivity Study13
Table 5 - Condition scores framework ....................................... 15
Planning Report (prepared in advance to support AusNet Services TRR Submission) 4
1. Purpose This planning report outlines asset condition, asset failure risks and network development plans
relevant to FTS for the planning period from 2022/23 to 2026/27. It provides an analysis of viable
options to address the identified risks and maintain the efficient delivery of electrical energy from
FTS consistent with the National Electricity Rules (NER) and stakeholder’s requirements. It also
summarizes the scope, delivery schedule and expenditures associated with the most economical
solution to emerging constraints.
Planning Report (prepared in advance to support AusNet Services TRR Submission) 5
2. Regulatory Obligations and Customer Requirements
This planning report acknowledges AusNet Services’ obligations as a TNSP under the National Electricity Rules with particular emphasis on: Clause 6A.6.7 of the National Electricity Rules3 requires AusNet Services to propose capital expenditures necessary to: “(1) meet or manage the expected demand for prescribed transmission services over that
period;
(2) comply with all applicable regulatory obligations or requirements associated with the
provision of prescribed transmission services;
(3) to the extent that there is no applicable regulatory obligation or requirement in
relation to:
(i) the quality, reliability, or security of supply of prescribed transmission services; or
(ii) the reliability or security of the transmission system through the supply of
prescribed transmission services,
to the relevant extent:
(iii) maintain the quality, reliability, and security of supply of prescribed transmission
services; and
(iv) maintain the reliability and security of the transmission system through the supply
of prescribed transmission services; and
(4) maintain the safety of the transmission system through the supply of prescribed
transmission services.”
The Electricity Safety Act (section 98(a)) requires AusNet Services to “design, construct, operate, maintain and decommission its supply network to minimise the hazards and risks, so far as is practicable, to the safety of any person arising from the supply network; having regard to the:
a) severity of the hazard or risk in question; and
b) state of knowledge about the hazard or risk and any ways of removing or mitigating the
hazard or risk; and
c) availability and suitability of ways to remove or mitigate the hazard or risk; and
d) cost of removing or mitigating the hazard or risk”.
3 National Electricity Rules, Sep 2020
Planning Report (prepared in advance to support AusNet Services TRR Submission) 6
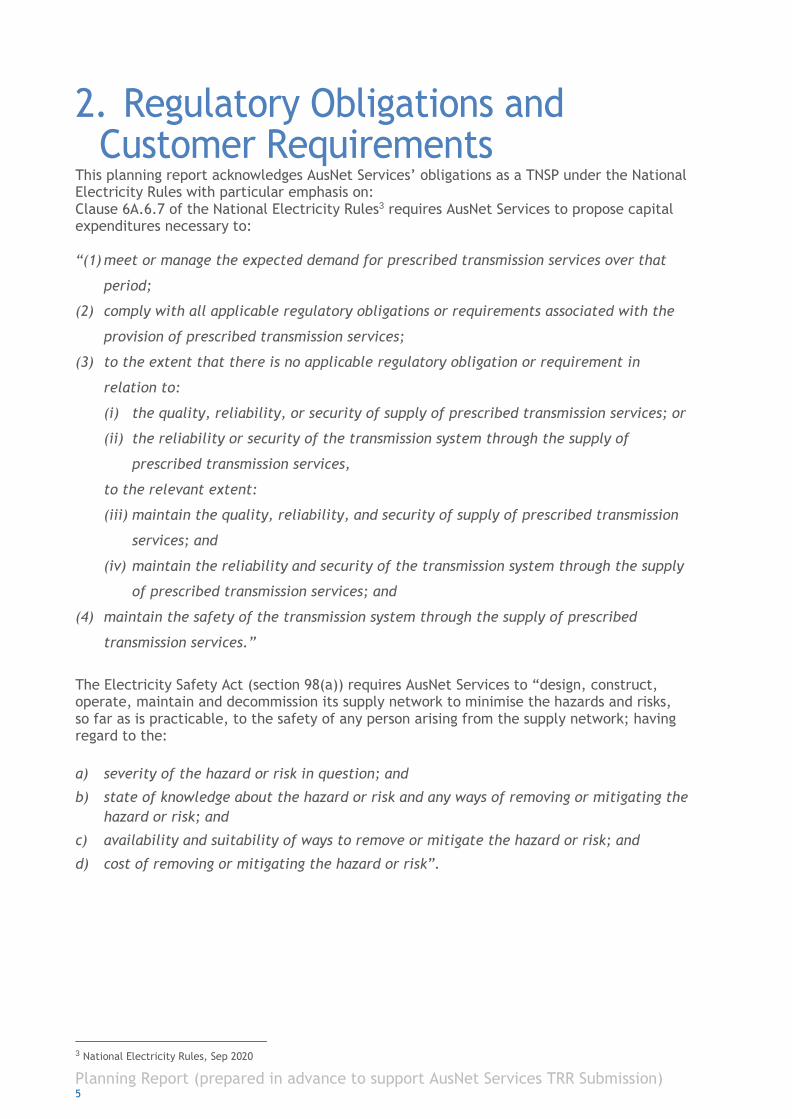
3. Background Frankston Terminal Station (FTS) is located in central eastern Victoria and supplies approximately
100,000 customers in the area including Frankston and Mornington Peninsula. The location of FTS
in the Victorian grid is shown in Figure 1.
Figure 1 – Victorian Transmission Network
The terminal station forms an integral part of the Victorian transmission network and has 220kV
connection via Cranbourne (CBTS) terminal station. The FTS station consists of 66kV switchyard
and protection and control room only.
The terminal station was established in 1968 as an integral part of the power network in the
Mornington Peninsula area. It has had several projects and additions completed on it over the years
of its service. Notably, recently it had a civil infrastructure upgrade to the security fences ,
replacement of the fire hydrant equipment, and replacement of the DC supply system is currently
in progress.
Planning Report (prepared in advance to support AusNet Services TRR Submission) 7
4. Planning Considerations
4.1. Planning Responsibilities The augmentation responsibility for FTS lies with the Australian Energy Market Operator (AEMO)
for the shared transmission network and with the distributors and AusNet Services for the
transmission connection assets and replacement planning.
4.2. Demand Forecast The rate of growth in summer and winter peak demand at FTS 66kV has been low in recent years,
and demand is forecast to continue increasing slowly, averaging around 0.7% per annum for the
10-year planning horizon.
The 2019 Joint DB Transmission Connection Planning Report noted that there is no energy at risk
under 50th percentile or 10th percentile loading conditions for the summer period for the next ten
years. There is therefore not expected to be any need for augmentation over the ten-year planning
period.
4.3. Future Planning Requirements Any significant asset replacements at FTS must consider the longer-term shared network and
connection network development plans of other parties to ensure individual decisions will not
compromise security of supply or impede economic future capacity augmentation.
.
As noted in the section above there is no energy at risk forecast for the next ten years and there
are therefore no future plans to augment the capacity of the station.
Planning Report (prepared in advance to support AusNet Services TRR Submission) 8
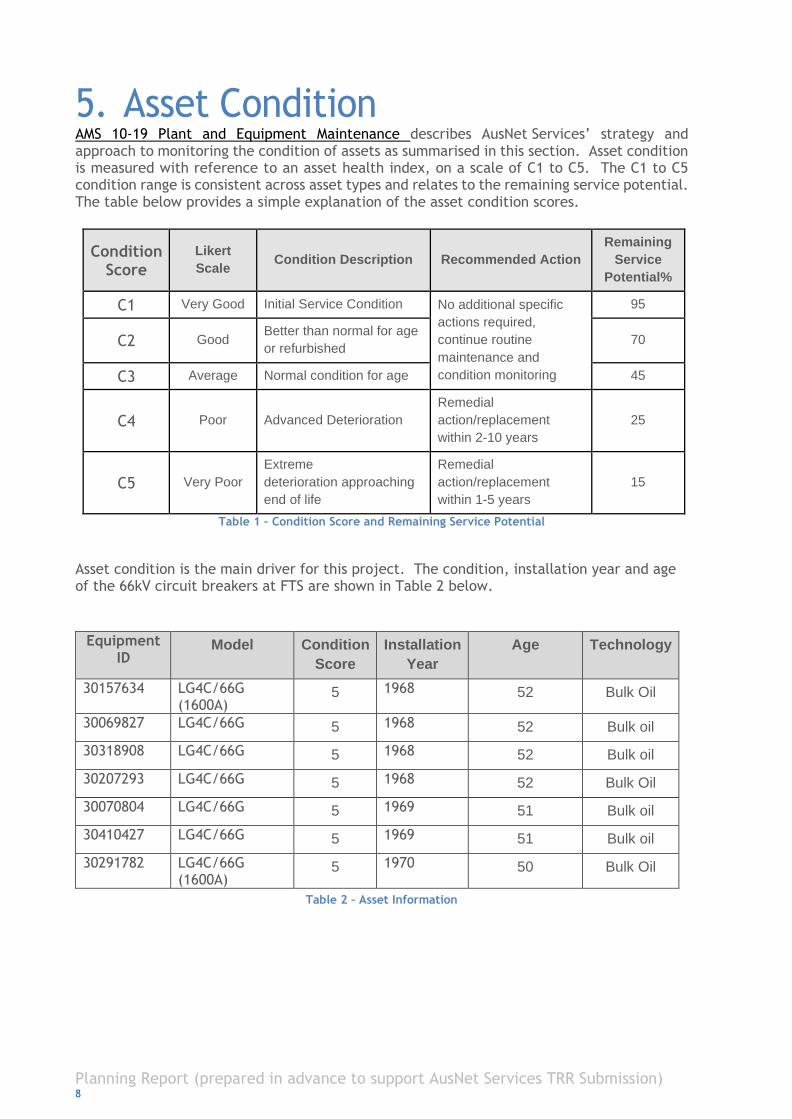
5. Asset Condition AMS 10-19 Plant and Equipment Maintenance describes AusNet Services’ strategy and approach to monitoring the condition of assets as summarised in this section. Asset condition is measured with reference to an asset health index, on a scale of C1 to C5. The C1 to C5 condition range is consistent across asset types and relates to the remaining service potential. The table below provides a simple explanation of the asset condition scores.
Condition Score
Likert
Scale Condition Description Recommended Action
Remaining
Service
Potential%
C1 Very Good Initial Service Condition No additional specific
actions required,
continue routine
maintenance and
condition monitoring
95
C2 Good Better than normal for age
or refurbished 70
C3 Average Normal condition for age 45
C4 Poor Advanced Deterioration
Remedial
action/replacement
within 2-10 years
25
C5 Very Poor
Extreme
deterioration approaching
end of life
Remedial
action/replacement
within 1-5 years
15
Table 1 – Condition Score and Remaining Service Potential
Asset condition is the main driver for this project. The condition, installation year and age of the 66kV circuit breakers at FTS are shown in Table 2 below.
Equipment ID
Model Condition
Score
Installation
Year
Age Technology
30157634 LG4C/66G (1600A)
5 1968 52 Bulk Oil
30069827 LG4C/66G 5 1968 52 Bulk oil
30318908 LG4C/66G 5 1968 52 Bulk oil
30207293 LG4C/66G 5 1968 52 Bulk Oil
30070804 LG4C/66G 5 1969 51 Bulk oil
30410427 LG4C/66G 5 1969 51 Bulk oil
30291782 LG4C/66G (1600A)
5 1970 50 Bulk Oil
Table 2 – Asset Information
Planning Report (prepared in advance to support AusNet Services TRR Submission) 9
6. Emerging constraints The key service constraints and monetised risk identified for the aging and deteriorated assets at
FTS are described in this section.
6.1. Safety and Environmental Hazards
6.1.1. Circuit Breakers As described in AMS 10-54 - Circuit Breakers, there is asbestos containing material found in older
bulk oil circuit breakers such as 66kV AEI LG4C circuit breakers in arc chutes, covers and panels
used in control cubicles. Asbestos material has the potential to cause harm to the safety and health
of people and the environment. Certain control measures have to be adopted when it is required
to modify or removing asbestos as per HSP-05-05-1 guideline. The are several circuit breakers in
FTS that have asbestos materials contained within them.
6.2. Safety, Plant Collateral Damage and Environmental
Risk Cost The Electricity Safety Act requires AusNet Services to design, construct, operate, maintain, and decommission its supply network to minimize hazards and risks, so far as is practicable, to the safety of any person arising from the supply network. In practice this means safety risk should be proactively managed until the cost becomes disproportionate to the benefits. With respect to the management of safety risks that may cause a single fatality amongst a crew of workers; application of the principle of “as low as reasonably practicable” indicates costs in excess of $20 Million may be disproportionate. The following assumptions were used to calculate the monetised safety, plant collateral damage and environmental hazards presented by the plant described in Section 7.1; consistent with the methodology described in AMS 10-24 Victorian Electricity Transmission Network – Asset Renewal Planning Guideline:
• An explosive failure or oil fire could injure or kill workers on site with an economic
consequence cost of $20 Million;
• Plant that contains large volumes of oil poses an environmental risk with an average
consequence cost of $30k per event;
• Transformer with oil that contains poly-chlorinated biphenyls (PCB) poses an
environmental risk with an average consequence cost of $100k per event;
• Plant collateral damage, including consequent supply outages, is on average $1.0
Million per event.
The likelihood of the above hazards occurring at FTS have been calculated from the major failure rates in the circuit breaker reliability centred maintenance (RCM) models and the CIGRE research into the probability of explosion and fire associated with major plant failures4.
4 Cigre Final Report of the 2004 – 2007 International Enquiry on Reliability of High Voltage Equipment.
Planning Report (prepared in advance to support AusNet Services TRR Submission) 10
7. Options to Address Risks The following options have been assessed to address the increasing community risk at FTS:
• Business as usual. This option is included in the option analysis to define the
baseline risk and to quantify the potential benefits of options that address the
baseline risk
• Run to failure and replace assets upon failure
• Staged replacement of assets
Refurbishment option was not considered as there is asbestos containing material in the circuit
breakers and they would need to be replaced safely, to get rid of asbestos material.
Planning Report (prepared in advance to support AusNet Services TRR Submission) 11
8. Evaluation of Options An economic cost-benefit assessment is used to assess and rank the economic efficiency of the
network options listed in Section 8. The option analysis considers key aspects like operating cost
versus capital cost trade-offs, security of supply risk during the construction phase of the project,
economic merits of a staged replacement and the future augmentation plans for FTS.
A “Business as usual” option (Option 1) has been included in the option analysis to presents the
baseline risk. It illustrates whether deferment of asset replacement presents an economical option
or whether the risk has reached a level that needs to be addressed during the 2022 to 2027
regulatory period. Option 2 is a reactive asset replacement option. Options 3 involve proactive
replacement of deteriorated and failure prone equipment based on the assessed risk of an asset
failure.
The economic analysis allows comparison of the economic cost and benefits of each option to rank
the options and to determine the economic timing of the preferred option. It quantifies the
capital, operation and maintenance, and risk cost for each option. The risk cost includes safety,
security of supply, environmental and collateral damage risks at FTS. The robustness of the
economic evaluation is tested for three discount rates, a sensitivity analysis of the forecast plant
failure rates, different demand growth scenarios and different VCR rates.
Each of the identified options for FTS is evaluated based on the incremental benefits it delivers in
the following areas:
• Reduction in health and safety risk due to plant explosive failures;
• Reduction in supply risk due to unplanned outages;
• Reduction in environmental risk due to insulating oil spillage;
• Reduction in collateral plant damage risk due to explosive plant failures;
• Reduction in operation and maintenance cost, including network losses.
8.1. Option 1: Business as Usual The baseline risk at FTS, defines the economic cost for the “Business as Usual” option for the period
until 2026/27. The Present Value of the risk cost, assuming a flat risk profile after 2026/27, is
more than $5.2 M5. This suggests that a business as usual approach would not be an economical
option or a prudent management strategy for the assets at FTS.
The progressive reduction in reliability of supply and increase in safety risk are inconsistent with
AusNet Services’ obligations under the National Electricity Rules. Recurring asset failures are
furthermore inconsistent with the requirements of the Electricity Safety Act and AusNet Services’
accepted Electricity Safety Management Scheme.
This option is used in the economic evaluation as a reference to measure the economic benefits of
options that mitigate the identified risks at FTS and to ascertain the economical time6 for a
particular option to proceed.
8.2. Option 2: Run to fail This option involves replacing assets upon failure, which poses a significant risk to the community. The community costs that would result from applying an asset management strategy to only replace an asset after the asset has failed is as follows:
5 This is a conservative assumption as the risk cost is more likely to increase as a result of deteriorating plant condition and consequent failure rates, and demand growth. 6 “Do Nothing” is the default option until the year when the annual benefits (reduction in risk cost and operating cost) of the most economical option exceed the annual cost.
Planning Report (prepared in advance to support AusNet Services TRR Submission) 12
• $10.2 M for a circuit breaker failure.
Some of the plant (CB porcelain bushings) at FTS also presents a safety risk should they fail explosively. This risk cannot be managed with a “run to failure” strategy as it would involve workers replacing failed equipment in a switchyard containing other equipment known to be in a deteriorated condition with a potentially hazardous mode of failure. This type of safety risk is valued at $20 M as a person/s could be injured or killed following an explosive failure. This is assumed based on information gathered from legal. Unplanned replacement of assets after a failure occurred is furthermore an inefficient asset replacement strategy for terminal stations due to the significant higher cost (project mobilisation and demobilisation) of emergency replacements. Recurring unplanned outages associated with a series of asset failures is inconsistent with the requirements of the Electricity Safety Act, AusNet Services’ accepted Electricity Safety Management Scheme7 and the National Electricity Rules8. This option is hence only used for modelling purposes.
8.3. Option 3: Stage replacement of assets This option includes replacing the seven 66kV circuit breakers. Whilst being careful to remove the
circuit breakers due to the potential of asbestos containing materials within the circuit breakers.
This will allow the new 66KV circuit breakers to replace the very poor condition old circuit
breakers.
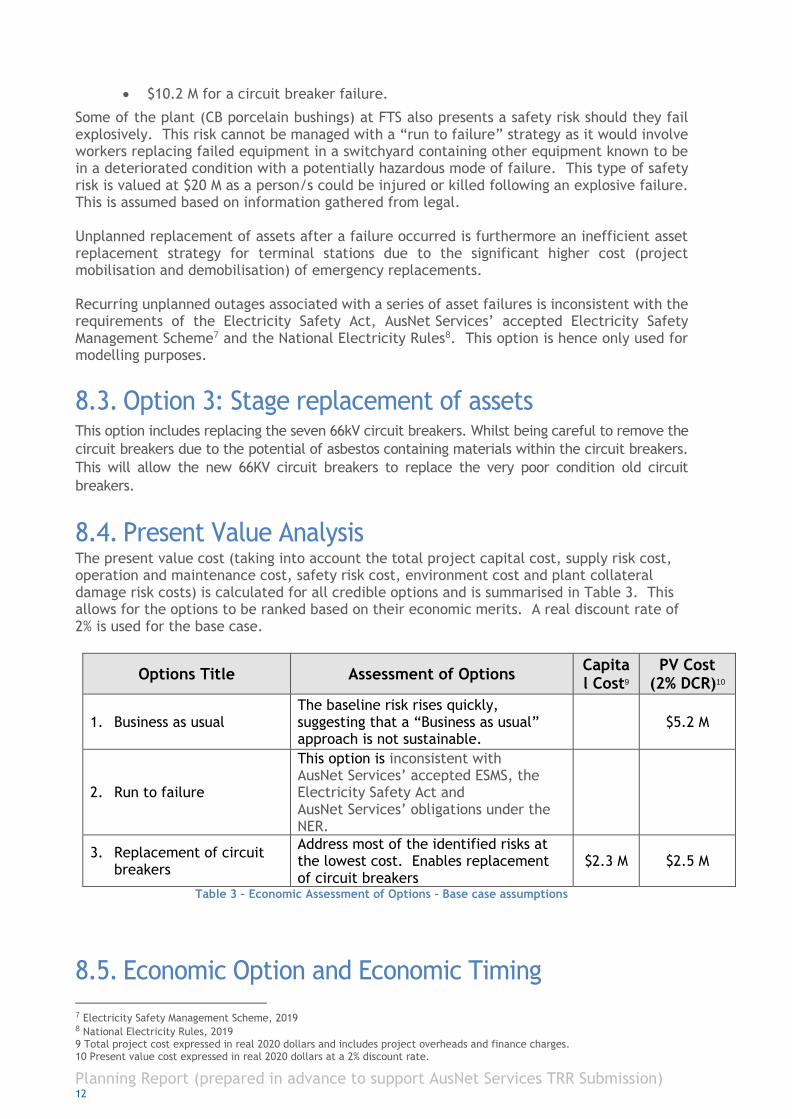
8.4. Present Value Analysis The present value cost (taking into account the total project capital cost, supply risk cost, operation and maintenance cost, safety risk cost, environment cost and plant collateral damage risk costs) is calculated for all credible options and is summarised in Table 3. This allows for the options to be ranked based on their economic merits. A real discount rate of 2% is used for the base case.
Options Title Assessment of Options Capital Cost9
PV Cost (2% DCR)10
1. Business as usual The baseline risk rises quickly, suggesting that a “Business as usual” approach is not sustainable.
$5.2 M
2. Run to failure
This option is inconsistent with AusNet Services’ accepted ESMS, the Electricity Safety Act and AusNet Services’ obligations under the NER.
3. Replacement of circuit breakers
Address most of the identified risks at the lowest cost. Enables replacement of circuit breakers
$2.3 M $2.5 M
Table 3 – Economic Assessment of Options – Base case assumptions
8.5. Economic Option and Economic Timing
7 Electricity Safety Management Scheme, 2019 8 National Electricity Rules, 2019 9 Total project cost expressed in real 2020 dollars and includes project overheads and finance charges. 10 Present value cost expressed in real 2020 dollars at a 2% discount rate.
Planning Report (prepared in advance to support AusNet Services TRR Submission) 13
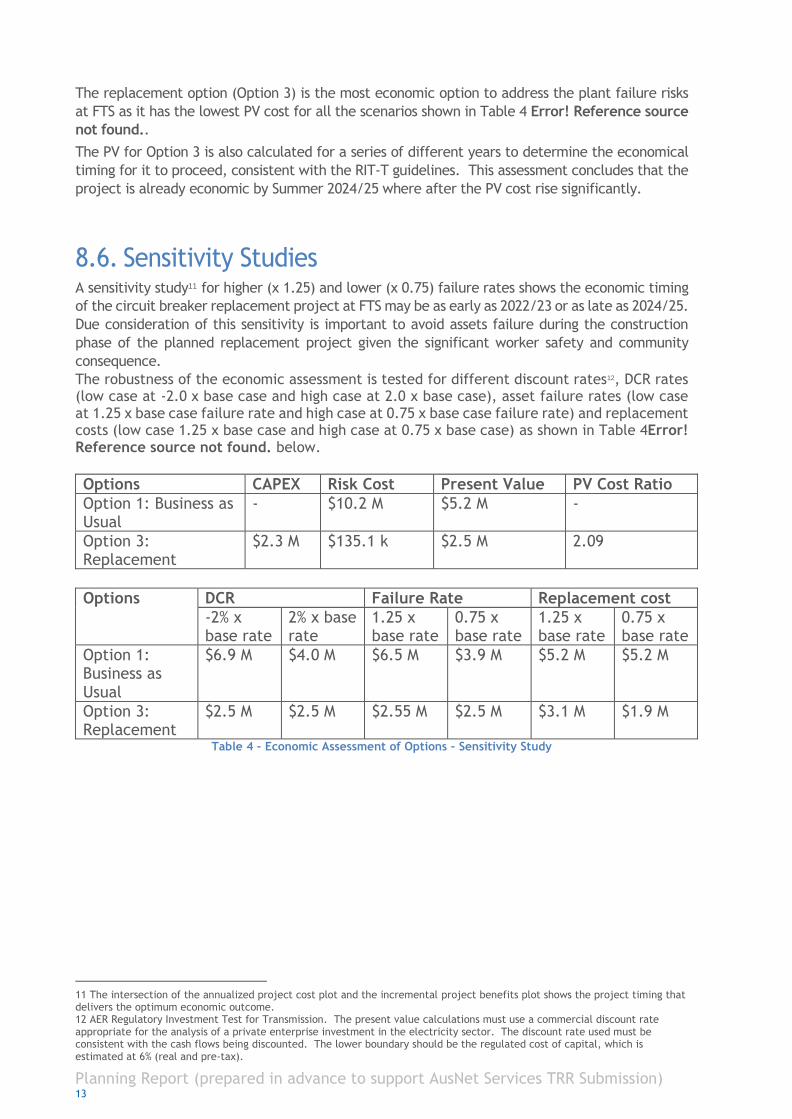
The replacement option (Option 3) is the most economic option to address the plant failure risks
at FTS as it has the lowest PV cost for all the scenarios shown in Table 4 Error! Reference source
not found..
The PV for Option 3 is also calculated for a series of different years to determine the economical
timing for it to proceed, consistent with the RIT-T guidelines. This assessment concludes that the
project is already economic by Summer 2024/25 where after the PV cost rise significantly.
8.6. Sensitivity Studies A sensitivity study11 for higher (x 1.25) and lower (x 0.75) failure rates shows the economic timing
of the circuit breaker replacement project at FTS may be as early as 2022/23 or as late as 2024/25.
Due consideration of this sensitivity is important to avoid assets failure during the construction
phase of the planned replacement project given the significant worker safety and community
consequence.
The robustness of the economic assessment is tested for different discount rates12, DCR rates (low case at -2.0 x base case and high case at 2.0 x base case), asset failure rates (low case at 1.25 x base case failure rate and high case at 0.75 x base case failure rate) and replacement costs (low case 1.25 x base case and high case at 0.75 x base case) as shown in Table 4Error! Reference source not found. below.
Options CAPEX Risk Cost Present Value PV Cost Ratio
Option 1: Business as Usual
- $10.2 M $5.2 M -
Option 3: Replacement
$2.3 M $135.1 k $2.5 M 2.09
Options DCR Failure Rate Replacement cost
-2% x base rate
2% x base rate
1.25 x base rate
0.75 x base rate
1.25 x base rate
0.75 x base rate
Option 1: Business as Usual
$6.9 M $4.0 M $6.5 M $3.9 M $5.2 M $5.2 M
Option 3: Replacement
$2.5 M $2.5 M $2.55 M $2.5 M $3.1 M $1.9 M
Table 4 – Economic Assessment of Options – Sensitivity Study
11 The intersection of the annualized project cost plot and the incremental project benefits plot shows the project timing that delivers the optimum economic outcome. 12 AER Regulatory Investment Test for Transmission. The present value calculations must use a commercial discount rate appropriate for the analysis of a private enterprise investment in the electricity sector. The discount rate used must be consistent with the cash flows being discounted. The lower boundary should be the regulated cost of capital, which is estimated at 6% (real and pre-tax).
Planning Report (prepared in advance to support AusNet Services TRR Submission) 14
9. Scope of Work The high-level scope of work for the preferred solution (Option 3) includes:
• Replace the seven 66kV circuit breakers
• Replace one instrument transformer
• Secondary replacement
Planning Report (prepared in advance to support AusNet Services TRR Submission) 15
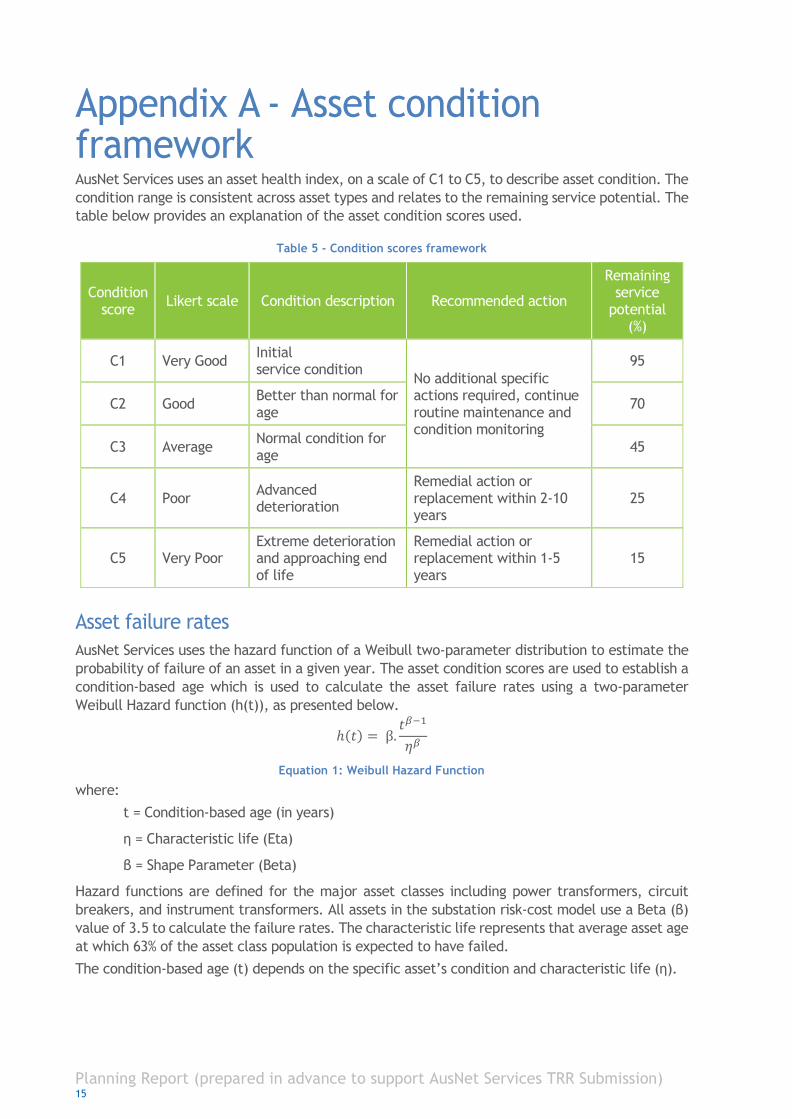
Appendix A - Asset condition framework AusNet Services uses an asset health index, on a scale of C1 to C5, to describe asset condition. The
condition range is consistent across asset types and relates to the remaining service potential. The
table below provides an explanation of the asset condition scores used.
Table 5 - Condition scores framework
Condition score
Likert scale Condition description Recommended action
Remaining service
potential (%)
C1 Very Good Initial service condition
No additional specific actions required, continue routine maintenance and condition monitoring
95
C2 Good Better than normal for age
70
C3 Average Normal condition for age
45
C4 Poor Advanced deterioration
Remedial action or replacement within 2-10 years
25
C5 Very Poor Extreme deterioration and approaching end of life
Remedial action or replacement within 1-5 years
15
Asset failure rates
AusNet Services uses the hazard function of a Weibull two-parameter distribution to estimate the
probability of failure of an asset in a given year. The asset condition scores are used to establish a
condition-based age which is used to calculate the asset failure rates using a two-parameter
Weibull Hazard function (h(t)), as presented below.
ℎ(𝑡) = β.𝑡𝛽−1
𝜂𝛽
Equation 1: Weibull Hazard Function
where:
t = Condition-based age (in years)
η = Characteristic life (Eta)
β = Shape Parameter (Beta)
Hazard functions are defined for the major asset classes including power transformers, circuit
breakers, and instrument transformers. All assets in the substation risk-cost model use a Beta (β)
value of 3.5 to calculate the failure rates. The characteristic life represents that average asset age
at which 63% of the asset class population is expected to have failed.
The condition-based age (t) depends on the specific asset’s condition and characteristic life (η).


![[XLS] Energy Account Upload... · Web view66KV Mandal 66KV Khavad 66KV Kanz 66KV Chharodi 66KV Jhakhwada 132KV Dhandhuka Import from PGVCL Export to PGVCL Import from MGVCL Export](https://img.pdfslide.net/doc/110x75/5abf5f6c7f8b9a7e418e1355/xls-energy-account-uploadweb-view66kv-mandal-66kv-khavad-66kv-kanz-66kv-chharodi.jpg)