Embed Size (px)
Citation preview

2018
Data Science for Fraud Detection TECHNICAL REPORT ARIS PAPADOPOULOS – 2018

1 Aris Papadopoulos – 2018 | DATA SCIENCE FOR FRAUD DETECTION
Table of Contents
INTRODUCTION ..................................................................................................................................................... 2 1. CONTEXT: FRAUDULENT PATTERNS.............................................................................................................. 3 2. FILES, ETL, TOOLS AND DATA PRE-PROCESSING............................................................................................ 5 3. A FIRST LOOK INTO THE DATASET ................................................................................................................ 6 4. EXPLORING AND EXPLAINING THE DATASET ................................................................................................ 9
4.1 AMOUNT (IN GBP) ..........................................................................................................................................10 4.2 PRIOR FEATURES..............................................................................................................................................11 4.3 ALL OTHER FEATURES ........................................................................................................................................13 4.4 FURTHER INVESTIGATION AND FEATURE ENGINEERING ...............................................................................................19 4.5 VALUABLE FEATURES THAT ARE NOT AVAILABLE WITH THIS DATASET ..............................................................................19
5. IDENTIFYING FRAUDSTERS ..........................................................................................................................20 5.1 HIGH AMOUNT FRAUD RISK - POTENTIAL ID-THEFT AND ONE-HIT FRAUD ........................................................................20 5.2 REPEATING OFFENDERS AND CHARGEBACK FRAUD ....................................................................................................22
6. A MACHINE LEARNING APPROACH..............................................................................................................24 7. A HIGH-LEVEL FRAUD DETECTION PLATFORM .............................................................................................25
KYC LAYER ..........................................................................................................................................................25 THE TECHNOLOGY LAYER .........................................................................................................................................28 THE PREDICTIVE MODELING LAYER .............................................................................................................................28 THE CHAT-BOT OR VIRTUAL ASSISTANT ........................................................................................................................29

2 Aris Papadopoulos – 2018 | DATA SCIENCE FOR FRAUD DETECTION
Introduction Exciting times, amazing future! Innovative Fintech companies disrupt banking, transforming how we think about it and bringing unprecedented customer-centricity and security to financial services. Customers have embraced these new products and the most successful Fintech companies acquire new customers at an explosive rate. Consequently, scaling fast presents with challenges in many directions. Fighting financial crime is a prominent one such direction. The good news is of course that Fintech can leverage its arsenal of new technology to fight back. In this report, I will explore some of them. © 2018 Aris Papadopoulos, all rights reserved.

3 Aris Papadopoulos – 2018 | DATA SCIENCE FOR FRAUD DETECTION
1. Context: Fraudulent Patterns Online and mobile financial crime takes many forms and continuously evolves, following closely technology advances. A non-exhaustive typology includes the following patterns in order of potentially increasing risk and impact: Chargebacks
Patterns:
• The users are generally the legitimate owners of the card. This type of fraud is called “friendly fraud”.
• They may claim that: § They did not make the charge, § Their account was abused, § they did not receive the services/goods or § they received damaged goods
Due Diligence:
• On a strategic level, work with partners to build data partnerships. Build horizontal chargeback alerts based on data across merchants.
• Hot lists: Block users with consecutive returns or chargebacks. • Warm lists: Store users with frequent returns or chargebacks. When frequent becomes
consecutive, move them to the hot list. • For the transaction dispute and the not-authorised cases: Include extra steps that make
the dispute more difficult: Card security (CV and CVV2), consumer authentication (extra pin/info required for the transaction to go through, e.g 3D secure, verified by Visa etc.), out-of-pocket checks (asking for historical information that usually only the legit user might know).
• For the non-receipt case: Check signature on delivery if accessible (for non-receipt claim). Stolen card details
Patterns:
• One-hit one merchant: The fraudsters have obtained the card details and attempt one expensive purchase at one merchant.
• One-hit multiple merchants: The fraudsters have obtained the card details and attempt one expensive purchase at multiple merchants.
§ In these two similar types, we frequently observe: § High amount transactions, § Billing/shipping address mismatches § Drop-off shipping addresses.
• Repeat offenders with morphing: Many purchases with fast or slow change of attached details.
§ Billing shipping address mismatches and drop-off shipping addresses. Due Diligence:
• If there is a mobile application installed on a trusted device, examine the location information of the trusted device and compare it with the geolocation of the device used for the purchase, if available. For example, if the trusted device appears to be at a different place at the time the transaction takes place (or close to the time of transaction) from the device through which the transaction was made, this is a flag.

4 Aris Papadopoulos – 2018 | DATA SCIENCE FOR FRAUD DETECTION
• Examine the shipping address: E.g. unusual shipping (particular to profile patterns with a billing mismatch), or drop-off points (generally suspicious).
• Examine the buying patterns for the particular user (e.g. the transactions might concern products, services or times that are not consistent with the user’s past behavior) as well as the normal buying patterns for the particular goods whenever available. Examine user amount patterns.
• Examine basic user information: email username (e.g. no vowel email addresses) and email domain (e.g. temporary emails), phone number (validity).
• Examine the credibility and location of the merchant. • Examine card information and card level association to users: Tier (standard/premium),
address, expiry date. The number of cards used with the particular device may also help. An unusually high number of cards used can be indicative of suspect behaviour, in combination with velocity and time sequence analysis.
• Device and network information. Brand, platform (mobile, web etc.), system as well as network information, proxy and type of proxy for obfuscation, VPN etc.
§ Device fingerprinting can identify individual devices (i.e. provides granularity beyond the Network and IP address). I will discuss it in more detail next.
• For the morphing attack, examine velocity of card and information submitted with the purchase.
• For the morphing attack, examine velocity of change of this information and particularly the name (which is otherwise not a good data point for investigating fraud).
• Reverse address and phone verification. • For the one-hit attack, examine unusually high amounts for the user. • For the one-hit multiple merchants attack, examine cross-merchant velocity of card. • For the stolen card details fraud, traditional ways include card security code (CV and
CVV2) and consumer authentication (extra pin/info required for the transaction to go through, e.g. 3D secure, verified by Visa etc.).
• Cross check with freight forwarder databases. Stolen cards
Patterns:
• As in the stolen card details case and in addition: § Convenience fraud, i.e. services (without delivery of goods), e.g. gas stations etc.
• May initially attempt to charge a small amount in order to test whether the card is active.
§ ATM fraud
Account take-over: Stolen identity and card details
Patterns:
• Maxing the cards. Multiple purchases sometimes similar or the same expensive items (smartphones, laptops etc.) with one shipping address.
• Multiple accounts, one shipping address. Due diligence:
• Address, email and phone verification (check whether they match what the issuing bank has).
• Reverse email and phone lookup: Third party systems that return the persons associated with this email and phone.

5 Aris Papadopoulos – 2018 | DATA SCIENCE FOR FRAUD DETECTION
• As previously, card security (CV, CVV2) and consumer authentication (3D secure, verified by Visa etc.).
• Credit check (does the info provided match the info in the credit check?) and out-of-pocket questions (questions with data from the credit check).
• Personally-set security questions. • Electronic identity authentication. It verifies info such as name, address, phone, date of
birth, social security, national identity card, passport etc. • As above, geolocation of purchasing device vs trusted device with app installed. • Device fingerprinting: device associated to user id. • Confirm legitimate owner of the trusted device: Biometrics: Face scan and touch id. • For the account take over scenario with a stolen and hacked device, we can make two-
factor authentication available optionally, should the users want to enable it. • Examine accounts that come with the same address. • For the case of a stolen and hacked trusted device, we can add optional two-factor
authentication with a threshold. Bearing in mind that the malicious parties in today’s real-time financial landscape can be increasingly innovative, we will explore the provided dataset in this context.
2. Files, ETL, Tools and Data Pre-Processing The files provided as a database dump are the following:
• transactions.csv: Contains approximately 700,000 card transactions. • users.csv: Contains attributes of approximately 10,000 anonymised users. • fraudsters.csv: Contains the anonymized IDs of approximately 300 identified fraudsters. • currency_details.csv: Contains currency exchange rates. • countries.csv: Contains country code information.
No private and/or sensitive information on the users and cards is included. We load them the following dataframes:
We will be using Python 2 (current version) with Jupyter Notebook and the following libraries:
• Pandas for data operations • Pandas_ply for a clearer pipelining syntax. API link: https://pythonhosted.org/pandas-ply/#api-
reference • Plotly for interactive graphs: https://plot.ly • Scikit-Learn for the Machine Learning part: https://scikit-learn.org/stable • Tableau for fast dataset visualization.

6 Aris Papadopoulos – 2018 | DATA SCIENCE FOR FRAUD DETECTION
These are the ETL steps we will be using:
§ /raw: The raw dataset as extracted. No processing is done on these files, they are there in case we needed to retrieve the original dataset.
§ /input: A copy of the dataset which is used as the input to Python. § /processed: Cleaned, processed and possibly helper/temporary files go here. § /output: The output files.
In the process, I joined and flattened the files for convenience. In any case, flat extracts are increasingly a reality with NoSQL databases, so it is not an unrealistic setup. A standard pattern in a big data landscape is a NoSQL, buckets or other storage on the cloud with a data warehouse on top and a business user access layer (such as Qlik, Looker, Tableau etc.) to expose the analytics as well as a possible SQL on the side for core structured data (and possibly for logging and auditing). The dataset is noisy (not cleansed). The pre-processing steps involve among other steps:
• The transaction amount in the raw files is denominated in integers at the lowest unit, based on the given currency. e.g. 5000 GBP => 50 GBP (because the lowest unit in GBP is a penny, with 100 pence = 1 GBP). Calculation of the transaction amount in humanly readable format and in one currency (GBP) from the currency related files, using the exponent and exchange rates.
• Cleansing of data fields, e.g. making the country codes consistent (country codes are given in multiple formats) and getting rid of corrupt data, using one of the country code schemes wherever possible. Further standardisation can be achieved of course using external resources.
• Joining, merging, sorting, hashing and other manipulations of the data frames as required (see comments in the code).
For all the details around the pre-processing steps, see the code as provided in the Github repo.
3. A First Look into the Dataset Here are the features of the users set after the pre-processing steps.
Instructions by the data provider:

7 Aris Papadopoulos – 2018 | DATA SCIENCE FOR FRAUD DETECTION
• The kyc column indicates the status of the user's identity verification process. • The terms_version column indicates the user's current version of the mobile application.
The rest remains to be explored. We can add the fraud field by merging with the fraudsters file.
Here are the features of the transactions set after the pre-processing steps:
Instructions by the data provider for this file:
• Amount is denominated in integers at the lowest unit. e.g. 5000 GBP => 50 GBP (because the lowest unit in GBP is a penny, w/ 100 pence = 1 GBP)
• entry_method is only relevant for card transactions (CARD_PAYMENT, ATM); you may ignore it for other transactions. The values are:
misc - unknown

8 Aris Papadopoulos – 2018 | DATA SCIENCE FOR FRAUD DETECTION
chip - chip on card mags - magstripe on card manu - manual entry of card details cont - contactless/tap mcon - special case of magstripe & contactless
• source is associated with an external party used for handling this type of transaction. The rest, remains to be explored. We added the following two fields:
• InGBP is a calculated field we added which contains the amount converted in GBP. • Fraud: Boolean flag that Indicates if the transaction belongs to an identified fraudster by looking
into the fraudster file. We can use Pandas_ply to run SQL-like queries in a clean way. For example, if we want to examine the users whose first transaction was a completed transaction of more than 10 GBP, we can first join the previous dataframes on user_id (see the Github repo for the details) and then run the following cells:
Here is a synopsis of the response:

9 Aris Papadopoulos – 2018 | DATA SCIENCE FOR FRAUD DETECTION
4. Exploring and Explaining the Dataset
The first feature to examine is the amount (converted in GBP) and how fraud breaks into normal and large amounts. According to the previous conversation, there are two important types of fraud that are connected with fraudulent transactions involving large amounts: Id theft and one-hit.
Then, there is an array of interesting features, two of which deserve to be discussed next: KYC and the state of the transaction (which is the authorization response by the issuing bank).
The reason is that a knowledgeable agent or system has made an informed decision to flag them. In Bayesian statistics terms, this is a prior.
That been said, priors do not equal to truth. For example, a failed identification may be the result of bad photos or the user not providing the needed information for reasons other than fraudulent intentions. Similarly, a transaction may be declined as a result of insufficient funds, a rules-based system falling behind and using naïve rules. However, the combination of high non-complete transaction state and KYC metrics is a strong indication and a good starting point. We will treat them as such in order to build a baseline algorithm.
Finally, we will explore all remaining features and will try a Machine Learning approach as potential extensions in the sections to follow.

10 Aris Papadopoulos – 2018 | DATA SCIENCE FOR FRAUD DETECTION
4.1 Amount (in GBP) Our anti-fraud strategy should be prioritized on the basis of the potential exposure and end financial impact. This is why the amount (normalized in one currency -here we chose GBP) deserves to be discussed first. Let’s draw a line in the sand for the transaction amount in GBP and examine how transactions break above and below it: the threshold of 1,000 GBP. The following graphs show two main observations:
1. The percentage of transactions associated with identified fraudsters (coloured with orange) within high amount transactions (>1,000 GBP) is more than 10%. The corresponding percentage for the lower amount transactions is just 2%. From a data science perspective, the distribution of values within each feature is generally revealing of the feature’s predictive power. If there is fluctuation in the percentage of identified frauds across buckets (different values of a feature), the feature is predictive and the buckets with the highest percentages of fraud are significant. In this sense higher amounts (more than 1,000GBP) are more suspect than lower amounts. In this case, of-course we have to bear in mind that we only have tags for one class.
2. While only 0.1% of the transactions have an amount of 1,000GBP or more, the total amount they represent sums up to 40% of the whole transactions amount. In the second sub-graph the accumulated amount is shown as a bar chart and corresponds to the left y-axis and the number of transactions is marked with black disks and correspond to the right y-axis.

11 Aris Papadopoulos – 2018 | DATA SCIENCE FOR FRAUD DETECTION
4.2 Prior features
The reason is that a knowledgeable agent or system has made an informed decision to flag them. In Bayesian statistics terms, this is a prior.
The graphs in this section are created with the Plotly Python framework (see the associated Jupyter Notebook in the Github repo, the graphs are interactive when you run the notebook). They show the breakdown of the kyc feature and the state feature into their values and the corresponding distributions of identified fraudsters (highlighted with orange tones).
Let’s unpack the states of transactions in more detail and explain some choices in the algo:
• Declined transactions: Declining is a possible result of the authorization process by the issuing bank and can potentially be because of the following reasons:
• Insufficient credit • Fraud • System error or time out
Hence, a declined transaction is a good indication of risky behavior: Even if the reason is not directly fraud, insufficient credit might be due to maxing a card (which is consistent with id-theft).
The combination of failed KYC and a high number and rate of declined transactions is very suspect of fraud. A combination of pending KYC and high number of transactions is also very suspect, particularly in the light of the higher rate of fraudsters in pending KYC status (see graphs below).

12 Aris Papadopoulos – 2018 | DATA SCIENCE FOR FRAUD DETECTION
• Reverted transactions:
Transaction reversal can be because of the following reasons:
• Transaction cancelled by the customer before the delivery of goods. • Return of goods and refund. Use and return of digital goods can be abused. • Chargebacks in which users claim that they did not authorize the transaction, they did not
receive the goods, or they received damaged goods. The customer is the legitimate owner of the card.
KYC is less relevant in this case, as this is "friendly fraud", users are the likely owners of the card they are using, and so KYC identification processes are less relevant.
• Cancelled transactions: They are not many, so the users with many cancelled ones are covered by the set of the users with many denied.
• Failed transactions: Imposing the KYC filter (pending and failed) excludes such transactions as well. The reasons of failure are unclear with the given dataset and might be due to system failures etc.

13 Aris Papadopoulos – 2018 | DATA SCIENCE FOR FRAUD DETECTION
Reverted and declined transactions seem to show some correlation, the rest of the combinations though seem to be uncorrelated or even negatively correlated.
4.3 All other features
Except from the amount, the transaction state and the KYC feature, which were discussed previously, here are the findings in summary on significant features which should all be included in a comprehensive solution. The complete analysis is provided next. Most findings about significant features support intuitions.
1. Younger users (age<30) appear to be riskier. At the same time, the dynamic ages of 25-35 show the highest adoption. See graph 5.

14 Aris Papadopoulos – 2018 | DATA SCIENCE FOR FRAUD DETECTION
2. Great Britain, Lithuania and Romania appear to be risky user geographies. In contrast France and Poland appear to be safe. See graphs 6 and 7.
3. Accounts that have been created during night hours (22pm – 4am) appear to be riskier. See graph 9. Time zones are not provided, so caution is required (assumption: local time).
4. On the transactions level, except the state, which is already discussed, the type and entry methods are significant (and there might be some correlation between them). The manual entry method and the bank transfer and ATM types are more prone to fraud, but the card payment type is dominant in terms of numbers. Note that the analysis of the transaction level features assumes that all transactions by fraudsters are fraudulent, since there are no transaction level tags and this introduces an error.
5. Merchant country and merchant category are also significant.
Details on features
In the following charts, orange denotes identified fraudsters and blue users that have not been identified as such, which does not obviously automatically render them legitimate in this exercise (so the semantics of the “False” flag from now on is unknown, not legitimate). The percentage of users that have been flagged as fraudsters is 2.91%, which is quite high. Any feature that includes dimensions whose value vary a lot from this ratio, can be predictive. Wherever the fluctuation of the distribution true/false across the examined dimension is noticeable, the feature that corresponds to the dimension is candidate to be significant to predictive power. There is an exception to this: Features that are highly correlated/dependent to other predictive features, do not add to the predictability, in contrast they may compromise the model by introducing overfitting. One such example is the source feature which is associated to the type of the transaction (e.g. ATM). Users features:
1. Country phone code cardinality [Not significant]: The reason it is not significant despite its strong flux is that It correlates with the country feature, which we will maintain.

15 Aris Papadopoulos – 2018 | DATA SCIENCE FOR FRAUD DETECTION
2. User state [Not to use]: All users that have been identified as fraudsters are set to locked. It cannot be used for training.
3. Has email [Not significant]: 3.10% of the users with a registered email are fraudsters. This is very close to the 2.91% of fraudsters in the overall population, so we do not expect this variable to have predictive power.
4. Terms version [Not of use]: The users with the latest version as well as the ones with the version of Jan 2017 have zero identified users among them.
5. Age representation (Birth year) [Significant]: This chart shows the percentage of identified fraudsters within each birth year bucket (corresponding to the left y-axis). There is an uptrend showing that the percentage of identified fraudsters among younger users is higher compared to older users. The total number of users within the dataset for each year is also shown as a black line (corresponding to the right y-axis), showing an expected higher adoption in the dynamic ages of approx. 25-35.

16 Aris Papadopoulos – 2018 | DATA SCIENCE FOR FRAUD DETECTION
6. Geographical representation (Country) [Very Significant]: The country of the users that have not been identified as fraudsters. In order of representation: Great Britain, France, Poland, Lithuania and Ireland.
7. Geographical representation of fraudsters (Country continued): Countries with higher risk: Great
Britain: The percentage of fraudsters (surface of GB orange area) over other countries vs its corresponding percentage of general users (surface of GB blue area in previous graph) is approximately double. Lithuania is second in fraudsters percentage vs fourth in general users. Romania is third in fraudsters percentage vs ninth in general users. In contrast France and Poland appear to be of low risk as they represent lower percentages within the fraudster compared to the general group.

17 Aris Papadopoulos – 2018 | DATA SCIENCE FOR FRAUD DETECTION
8. User created date by year and month [Not significant]: Once again the bar chart (left y-axis) break
downs the fraudsters vs other users, this time per month. It would be a surprise if anything interesting had come up here, since there is no obvious reason why a month would be riskier than others. Nevertheless, I performed the standard temporal exploration steps just in case some cycle comes up. The black line (corresponding to the right y-axis) shows an uptrending acquisition of users. As expected. I repeated the same analysis per day of the month etc.
9. User created by hour of the day [Very Significant under assumptions]: This one is interesting. Users joining during the night appear to be riskier (bar chart, left y-axis), which is intuitive (approx.

18 Aris Papadopoulos – 2018 | DATA SCIENCE FOR FRAUD DETECTION
6% of fraudulent representation during night hours vs 2.91% in the general user population). We have to note though that we do not have time zone information. It is tempting to think that this is the user’s local time. Also, as expected, the number of users that join (black trend line, right y-axis) during night hours is significantly lower.
10. Failed sign-in attempts [Not significant]: Insignificant samples outside zero attempts. Transaction features:
With the assumptions that: • All transactions by fraudsters are fraudulent, • The distribution of fraudsters that is identified is representative of the actual population of
fraudsters vs legit users which both introduce an error, the following transaction level features appear to be significant, as expected:
19 Aris Papadopoulos – 2018 | DATA SCIENCE FOR FRAUD DETECTION
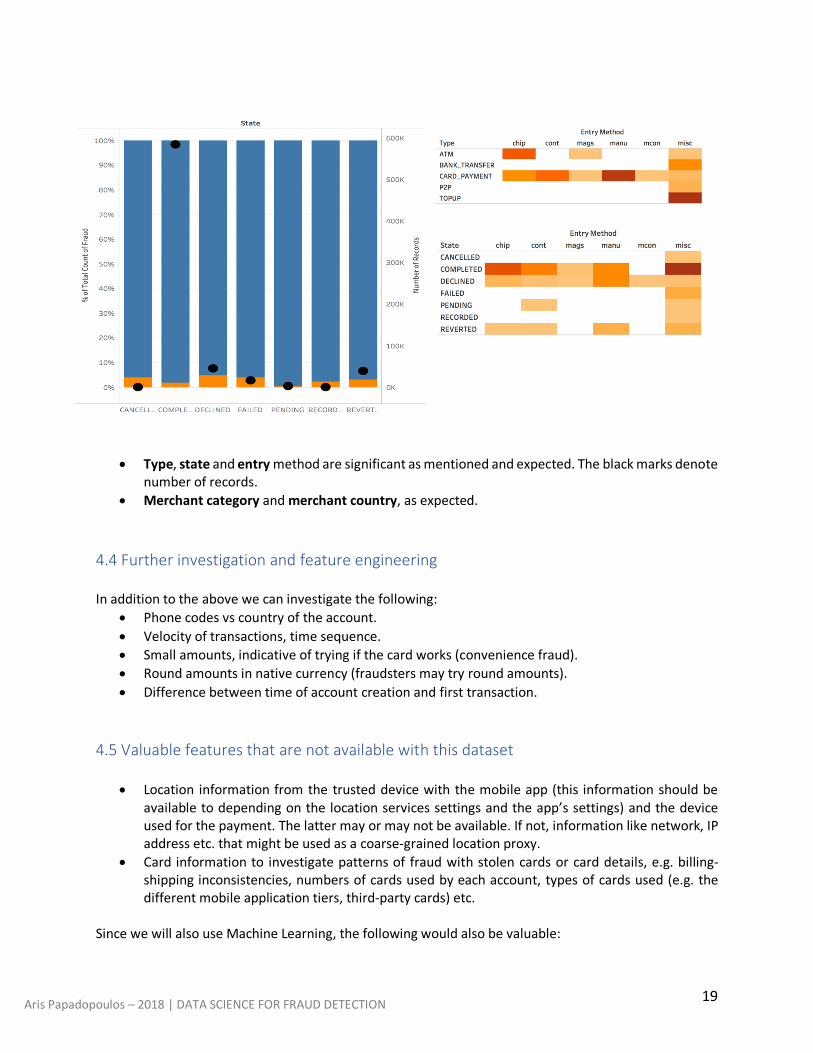
• Type, state and entry method are significant as mentioned and expected. The black marks denote number of records.
• Merchant category and merchant country, as expected. 4.4 Further investigation and feature engineering In addition to the above we can investigate the following:
• Phone codes vs country of the account. • Velocity of transactions, time sequence. • Small amounts, indicative of trying if the card works (convenience fraud). • Round amounts in native currency (fraudsters may try round amounts). • Difference between time of account creation and first transaction.
4.5 Valuable features that are not available with this dataset
• Location information from the trusted device with the mobile app (this information should be available to depending on the location services settings and the app’s settings) and the device used for the payment. The latter may or may not be available. If not, information like network, IP address etc. that might be used as a coarse-grained location proxy.
• Card information to investigate patterns of fraud with stolen cards or card details, e.g. billing-shipping inconsistencies, numbers of cards used by each account, types of cards used (e.g. the different mobile application tiers, third-party cards) etc.
Since we will also use Machine Learning, the following would also be valuable:

20 Aris Papadopoulos – 2018 | DATA SCIENCE FOR FRAUD DETECTION
• Tags of positively identified legitimate users in order to train a more powerful two-class ML classifier (e.g. a Deep Neural Network or XGBoost) or even better transaction level tagging for both fraudulent and legitimate transactions, as the one-class SVM classifier did not work well.
5. Identifying Fraudsters We will now describe baseline methods to identify high-risk users, based on the typology presented in section 1 and the predictive potential of the features, as discussed in section 4 and more specifically 4.1 and 4.2.
5.1 High amount fraud risk - Potential ID-theft and one-hit fraud
Let’s first get all high amount transactions sorted. Here is the query and the head of the result set:
We will calculate the total and the mean transaction amount per user. Sorting on the total amount gives us the following results. All the users with high total amounts and country GB must be checked for fraud. Here are the top-10 users with the highest total amounts:

21 Aris Papadopoulos – 2018 | DATA SCIENCE FOR FRAUD DETECTION
Now, if we sort on the mean amount per transaction, exclude any user existing in the previous list and select the top-10, we get the following table:

22 Aris Papadopoulos – 2018 | DATA SCIENCE FOR FRAUD DETECTION
Of these users, the five ones with a count of high amounts equaling 1 should be checked for one-hit one merchant fraud. The remaining five ones with a count of high amounts larger than 1 should be checked for one-hit multiple merchant fraud.
It is interesting to observe the bottom of the 1,000+ GBP list. We find plenty of perfect round 1,000GBP transactions with limited hits (for feature engineering, round amounts in native currency could be predictive):
Let’s now turn to the prior features: Authorisation state and KYC. An algorithm to detect the top-10 riskiest users based on these features follows. 5.2 Repeating offenders and chargeback fraud
We are now turning our attention to the kyc and state of the transaction (which is the authorization response by the issuing bank) features. As discussed in section 4, the reason is that a knowledgeable agent or system has made an informed decision to flag them. In Bayesian statistics terms, this is a prior. We are presenting a simple outlier detection algorithm, to determine users with high numbers of declined and reverted transactions. What declined and reverted transactions mean, has been explained in section 4.2. The algorithm allows you to tune the number of standard deviations away from the mean that determine outliers, based on the number and user rate of declined and reverted transactions. Here, we use 2.5 standard deviations, as it results in approximately 10 outliers with the given dataset. It then selects the declined-based outliers with the a non-positive kyc. Finally, it fills in the remaining positions in the list of ten with the reverted-based outliers, irrespectively of their kyc status, as the kyc status is irrelevant for “friendly fraud”.
High level algorithm description:
1. Start with the prior features State (S) and KYC. 2. Use the following metrics for each user:
a. SA: Number of Txs with State A, where A is D for Declined or R for Reverted.
23 Aris Papadopoulos – 2018 | DATA SCIENCE FOR FRAUD DETECTION
b. RSA: Ratio of Txs with State A, over total number of the individual user’s transactions. 3. The way to determine whether the S and RS metrics are high for each user: If a metric is more
than X standard deviations from the mean across users, it is high. X is the algorithm’s “hyperparameter”.
a. You can tune X according to the wanted number of users in the output (here it is 10). I use X=2.5 stds to pinpoint 10 users, which is a very logical value for outlier detection.
4. Select the set of users who are not in the fraudsters file. Call them TBC. 5. From the TBC users, select those with high SD OR high RSD (one or both high Declined metrics).
Logic: This is a more permissive policy to selecting users, as the assumption is that the type of fraud it targets (stolen cards or card info) has a more direct impact on business (if you are not the merchant, as the liability for chargebacks is on the merchants).
a. Of them select the users with KYC Failed or Pending. Call these users Set1. 6. From the TBC users that are not in Set1, select those with high SR AND high RSR (both high
Reverted metrics). Logic: This is a less permissive policy, as the assumption is that the type of fraud it targets (chargeback fraud) has more indirect impact if you are not the merchant (e.g. brand credibility). It may affect the merchant, the payments gateway, the network etc. Call these users Set2.
a. No need to check KYC in this case as this is “friendly” fraud, the user is likely to have passed the ID checks.
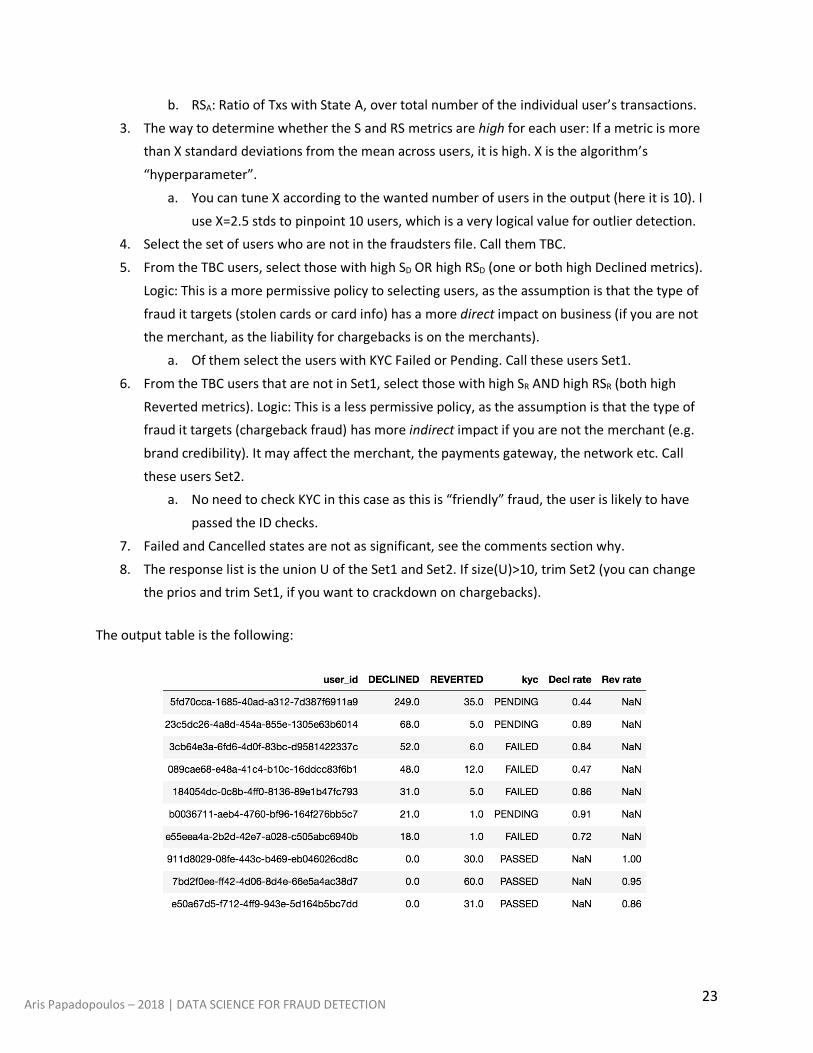
7. Failed and Cancelled states are not as significant, see the comments section why. 8. The response list is the union U of the Set1 and Set2. If size(U)>10, trim Set2 (you can change
the prios and trim Set1, if you want to crackdown on chargebacks).
The output table is the following:

24 Aris Papadopoulos – 2018 | DATA SCIENCE FOR FRAUD DETECTION
This is just a baseline algorithm. More predictive features within the given dataset can be introduced in this baseline algorithm by extending the framework to include these features as follows:
§ If the feature is categorical, use it as a filter for the values of interest, similar to KYC. § If it is numerical, use the X standard deviations to determine thresholds for inclusion.
Comments on the assumptions:
• The algorithm presented allows to flex the mix of different types of fraud detectable by tuning
the parameter: threshold of standard deviation.
Comment on the Metrics:
• In principle, ratios are better metrics than absolute numbers because they impose a comparison. As mentioned, we used both absolute numbers and rates to determine suspicious behaviours. For chargebacks the ratio over all transactions per user is particularly important.
6. A Machine Learning Approach The advantages of using Machine Learning for fraud detection are plenty. ML algorithms provide with:
• Analysis of unparalleled precision for all the features and their combinations out of the box. Compared to my baseline algorithm for example, ML would discover the most predictive combinations of important features.
• Powerful optimization where otherwise one must empirically determine tradeoffs. • Bias containment when new patterns of fraud arise. • Reduced need for human agent intervention in certain parts of the process.
Today, a wide array of problems is solved by just two classification algorithms: XGBoost and Deep Neural
Networks. Deep Neural Networks in particular even remove the need for feature engineering. In our case however, we only have the tags for the one class, namely the fraudsters, and we are unsure about the other, the legitimate users. This situation calls for special handling. More particularly, I used a Support Vector Machine (SVM), a classification algorithm that neighbours to unsupervised learning clustering. SVMs draw maximal margins between the two classes, allowing the maximal space for the error introduced by not having tags for the legit class without being affected. For this reason, it is the first algorithm of choice for one-class classification problems such as the one at hand. I used the Python Machine Learning framework Scikit-Learn which provides with a library implementation of the one-class SVM for classification of similar/different objects. Given one class, this of fraudsters, the aim is to classify which users are similar to the ones tagged as fraudsters and which are different. The relevant resources of the library I used follow:
• https://scikit-learn.org/stable/auto_examples/svm/plot_oneclass.html • https://scikit-learn.org/stable/modules/generated/sklearn.svm.OneClassSVM.html

25 Aris Papadopoulos – 2018 | DATA SCIENCE FOR FRAUD DETECTION
Unfortunately, the algorithm did not perform well as it was very sensitive to the included features (high variance), returned very different results for different ways of tuning and was not accurate when fitted on 200 of the tagged fraudsters to predict the rest known 100 (with bagging and cross validation). I will persist on this approach, but the initial results were negative. High level description:
• This is a multiple instance learning: We have data on two levels (users and transactions), and tags on the higher level (users). To incorporate transaction level features, we can use transactions summary statistics per user in order to work on the user level (where we have the tags). For more, see here: https://en.wikipedia.org/wiki/Multiple_instance_learning
• Stratified split of the training/test • Oversample minority class and/or undersample majority class when training. U/S can be
optimized by clustering so as to minimize loss of info. Similarly, clustering can be used with O/S to produce synthetic instances. For example see here: https://imbalanced-learn.readthedocs.io/en/stable/auto_examples/over-sampling/plot_comparison_over_sampling.html
• Use bagging, to optimize the model. The implementation details and results of this approach will be released with the next version of this report. The next step would be sequence analysis with Markov chains which can model the probability of fraud attempts given previous transactions or with Recurrent Neural Networks. This would enhance the static view of individual transactions that a classifier provides with dynamic modelling, based on history.
7. A High-Level Fraud Detection Platform In this section, we will describe a high-level architecture and strategy for an anti-crime platform product based on the previous discussion in this report. A great product however is customer-centric, hence this discussion is subject to known good Lean and Agile product practices. Please refer to the graph shown in the following page.
KYC layer The KYC component enables a number of user authentication methods. It consists of a user on-boarding part including the methods utilized when a new user applies for a card and a due diligence component which involves methods utilised when a card is suspected to be compromised. I have opted for a light-weight user on-boarding experience and so I include two methods: an electronic user authentication service (which can be third party or in-house) and biometrics such as a picture taken with the mobile device within the app and the touch-id (which can remain on the OS level, outside the app). The due diligence component involves further investigation methods that can be manual or automatic, e.g.:

26 Aris Papadopoulos – 2018 | DATA SCIENCE FOR FRAUD DETECTION
• Credit check: third party service such as Experian, Equifax etc., • Reverse email and phone lookups, which might be integrated in the electronic user auth service, • Out-of-pocket questions based on the credit check and user set security questions, some of which
can be asked by a chatbot within the app, • Two factor authentication which can help if there is a suspected stolen and hacked mobile device
for the account take-over scenario, • User scoring: The platform includes a powerful predictive analytics layer which I will describe next,
however we might want to include a scoring method which can be used by human agents for due diligence, as the results by models such as neural networks are not easily interpretable, i.e. it is not always easy to understand why a neural network or other classifier decided the way it did.


The scoring mechanism would involve the features that the neural net has identified as significant, only in a more linear, humanly interpretable way.
The technology layer The tech layer involves the following methods:
• Device fingerprinting (discussed in detail in section 4). The fingerprint can be used in the following two ways:
o Fingerprint of the device used for the purchases. o Fingerprint of a device that uses stolen cards to top up pre-paid cards so that both the
account and the device are flagged. • Geolocation of devices can be determined through GPS services or indirectly through IP address
and network information. For indirect geolocation through IP address, proxy piercing might be needed for obfuscated IPs.
• Lists: o Flagged devices and users. o Hot and warm lists for “friendly fraud” such as user satisfaction and chargeback fraud.
The predictive modeling layer The predictive modeling layer includes an ensemble of powerful models as follows:
• A neural network, dense or deep, depending on the data at hand. A neural network outputs the probability of a class, in this case a new fraudulent or legitimate transaction, given previously seen instances during its training. Furthermore, we can train a neural net for multi-class classification to distinguish between the different types of fraud as well, as discussed previously in this report (e.g. id-theft, stolen card with morphing or one-hit attacks, chargebacks etc.). Neural nets have the following advantages in the context of fraud detection, over other classifier algorithms:
o Enhanced predictive power o Inline training, which means they can improve with each new instance added
incrementally, without having to perform a complete re-training of the model. • A user profiler based on clustering algorithms to account for “segment-of-one” user patterns,
whenever we need an analysis of a specific user’s patterns (such as the ones discussed in section 4, response to question 2b).
• A velocity/sequence analyser, which can be based on a recursive neural network or a Markov chain, to add the time domain in our analysis (the neural net above is looking into transactions in isolation),
• An anomaly detector, to spot and weigh in unusual conditions which might help the neural networks to adapt faster to new types of fraud.
• A Reinforcement Learning model takes autonomous actions, e.g. blocking and unblocking cards and accounts, based on the findings of the previous models, minimizing and even eliminating the need for any human intervention.

29 Aris Papadopoulos – 2018 | DATA SCIENCE FOR FRAUD DETECTION
The chat-bot or virtual assistant The chatbot or virtual assistant can be thought of as the front line of the KYC layer and can perform out-of-pocket or user set questions etc., as well as non-fraud related, generic customer service operations. Depending on the probability and the potential impact a number of possibilities can materialize:
§ In the worst case (high probability and potential impact of fraud), the card is paused and the user is alerted within the app. If needed, s/he is asked to provide with information relevant to resolving the situation using the chatbot or virtual assistant within the app.
§ An anti-crime forensics agent receives an alert and a custom report created by the AI-driven platform, summarizing all the most important points he needs to have in order to perform due diligence. The strategy should be to minimize the involvement of human agents, as the predictive models are more powerful and cheaper.
§ If the situation is not resolved, the user can be transferred to a human operations agent, prioritized based on the assessment described above. Again, the strategy should be to minimize the involvement of human agents, as the predictive models are more powerful and cheaper. If we retain a minimum number of agents, the platform allows them to work with a prioritized list of items and have all the needed information available within the tool, including the chatbot dialogue. The experience for the user is seamless, s/he is not aware of the transfer from a machine to a human.
§ Findings are fed back into the AI-driven platform for the purpose of training the models with all the latest data. Neural nets are online ML algorithms, so each new batch of datapoints can be integrated nearly real-time, without having to rebuild all models.
A virtual war room and control panel exposing:
§ Predictive models which show projections of all important financials, like revenue channels, insurance, exposure, anticipated fraud etc. in the next period.
§ Important levers that can steer the system according to the predictions and business strategy. § Operational analytics, e.g. performance of agents, customer satisfaction etc. § Streamlines due diligence.