Embed Size (px)
Citation preview
1
FREDERICK S. PARDEE CENTER
FOR INTERNATIONAL FUTURES
EXPLORE UNDERSTAND SHAPE
In Support of the United Nations Development
Programme
Bureau for Policy Programme Support
Sustainable Development Goals Report: Moldova 2030
September 8th, 2017
2
Executive Summary
Despite impressive progress since independence, Moldova today faces development challenges
driven by a combination of interwoven factors, particularly an aging demographic and acute
governance issues. Many of the decisions made by policymakers today will determine
Moldova’s long-term development trajectory, be it a narrative of continuing growth and
prosperity, or one of economic stagnation and isolation. This report assesses Moldova’s
development trajectory in the context of the United Nations (UN) Sustainable Development
Goals (SDGs) out to the year 2030 under four scenarios.
Moldova is a small, landlocked Eastern European country between Ukraine and Romania. A
lower-middle income country with a gross domestic product (GDP) of around $8.3 billion in
2016, Moldova is one of the poorest countries in Europe and yet it has made impressive
developmental progress since independence from the Soviet bloc in the early 1990s.1 GDP
growth rates have averaged around 4 percent over the past five years. Since 1990, life
expectancy has grown from around 67 years to 71 years in 2015. Infant mortality rates have
fallen from around 30 per thousand in 1990 to 13 per thousand in 2015. Basic services including
electricity access, clean water and sanitation, healthcare, and education have expanded
considerably. GDP per capita (at purchasing power parity), a rough proxy for basic income, has
grown from around $2,600 in 1995 to $4,740 in 2015. Moldova’s overall GDP has grown from
$4.5 billion in 1995 to around $8.3 billion in 2016.2
The 17 SDG’s, with a horizon out to 2030, represent the latest iteration of development targets,
goals, and aspirations set forth by the global community to promote sustainable development and
economic growth. The SDGs are designed to build on achievements made under the Millennium
Development Goals (MDGs) between 2000 and 2015, which focused on reducing extreme
poverty and promoting gender, inclusiveness, and good governance. The SDGs represent an
important element of Moldova’s current development framework and national planning process.
This report uses the International Futures (IFs) Current Path scenario to examine development
trends in Moldova out to 2030. IFs is an integrated assessment platform that relies on over 4,000
historical data series to produce forecasts for 186 countries out to the year 2100.3 IFs is
developed and maintained by the Frederick S. Pardee Center for International Futures at the
Josef Korbel School of International Studies at the University of Denver. IFs comprises models
of systems across: agriculture, demographics, economics, education, energy, environment,
finance, governance, health, infrastructure, international politics, and technology. An integrated
assessment model, the models listed above are interconnected, allowing users to simulate policy
interventions in one area and explore the resulting impacts in another.
Using IFs we create three alternative futures, or scenarios (designed in consultation with the
UNDP Bureau for Policy Programme Support, and the regional and country UNDP missions) to
explore policy trade-offs and assess Moldova’s ability to meet various SDG targets by 2030.
This report is part of a broader partnership between the Pardee Center and UNDP to analyze
prospects for meeting the SDGs across a number of countries. In support of this effort, we have
built an SDG Dashboard.4
3
The three scenarios are: i) Resilient Moldova (commonly referred to in this document as
“Resilience”), ii) Improved Governance, and iii) an Integrated Push. Resilient Moldova
stimulates an expansion in infrastructure access with a particular focus on water and sanitation
and information and communication technology (ICT); health sector improvements including
reductions in noncommunicable disease, and interventions to improve education access.
Improved Governance simulates a package of policies to improve transparency, reduce
corruption, increase effectiveness, promote economic freedom, and promote greater
inclusiveness. The Integrated Push packages the inputs of the first two scenarios explore
combined effects.
There are several conclusions from this analysis worth emphasizing up front. First, the
development trajectory of Moldova will be heavily shaped by demographic trends. Moldova is
facing twin challenges of high emigration and an aging demographic. On one hand, Moldova’s
recent GDP growth has been at least partially driven by remittances, which amounted to over 1.2
billion USD in 2015, and have fueled household consumption. But along the IFs Current Path
Moldova emigration is forecast to slow, and remittances are unlikely to play as significant a role
in growth, suggesting recent growth patterns are unsustainable. On the other hand, high
emigration rates, coupled with a declining fertility rate have seen Moldova’s population decline
since 1990 and it is forecast to continue declining from 4 million in 2015 to around 3.7 million
by 2030. These factors have contributed to a “greying” of Moldova’s population. By 2030 close
to 18 percent of the population could be 65 years or older. There are a number of implications
from this trend, most notably the impact on labor and economic growth. Moldova’s labor force
has declined from 1.7 million in 1990 to 1.2 million in 2015 and is forecast to continue declining
to 1.07 million by 2030. Additionally, Moldova has some of the lowest labor force participation
rates in the world,5 rates have declined from around 41 percent in 1990 to 31 percent in 2014.
Secondly, much like demographics, the future of Moldova will be deeply influenced by trends in
governance. Recent external commentary and analysis on Moldova has expressed deepening
concern over corruption, effectiveness, and the influence of business on politics, coupled with
deepening divisions over socioeconomic lines. The Governance scenario explores potential
impacts from improved governance. This scenario results in a significant positive impact on
GDP per capita in 2030, resulting in a per capita output that is roughly 5.7 percent larger in 2030
than along the Current Path. As expected, this scenario also has the largest direct impact on
governance capacity and quality.
Third, this analysis demonstrates there is no universal solution for broad-based national
development. Outcomes achieved depend heavily on the definition and metrics used to define
“development.” For instance, the Resilience Scenario has the greatest positive impact on a
number of important health and nutrition outcomes including child malnutrition, infant and under
five mortality rates, and death rate from noncommunicable diseases. These improvements in
human development mean that under the Resilience scenario, Moldova’s elderly population
increases from 17.8 percent of the population in 2030 in the Current Path to 18.2 percent.
Resilience has comparatively less impact than governance on GDP per capita and poverty rates
by 2030. This is in part because the interventions modeled in the Resilience scenario, particularly

4
those that expand education, improve infrastructure access, and benefit health are long-term
interventions that have limited impact on this horizon to 2030. Expanding education takes time
to move students through the school system and expand average education levels. Infrastructure
investments have high upfront costs and face time consuming construction processes. This is not
meant to discount their importance for Moldova’s development, simply to emphasize some of the
policy tradeoffs. An “Integrated Push” across development sectors results in a more significant
impact on a number of indicators than the more narrow policy packages. The results presented
here emphasize the need for integrated thinking across policy priorities.
Current Path 2015
Current Path 2030
Resilience 2030
Governance 2030
Combined 2030
Household Consumption Billion USD
7.2 9.6 9.9 10.4 10.7
Adult Education Average years
10.1 10.3 10.7 10.4 10.8
Gross Domestic Product Billion USD
8.0 12.9 13.3 14.1 14.5
GDP per Capita (at PPP) Thousand USD
4.7 7.0 7.1 7.4 7.5
Government Revenue Billion USD
3.1 6.0 6.1 6.4 6.7
Human Development Indicator
Index
0.7 0.7 0.8 0.7 0.8
Life Expectancy Years
71.5 73.3 74.4 73.4 74.5
Population 65 and Older Percent of total
population 9.9 17.8 18.2 17.8 18.2
Figure 1: Effects of different scenarios on selected metrics of success in 2015 and 2030 for Moldova. Darker colors represent a more ‘positive’ outcome.
Meeting the targets established by the SDGs requires an understanding of long-term
development trends and the associated policy tradeoffs in an environment of finite resources.
This report seeks to equip readers with a picture of Moldova’s development trajectory across
important areas of human, social, and physical development in the context of specific SDG goals
and targets. It explores tradeoffs among different interventions and their differential impact on
development outcomes in Moldova to 2030.
5
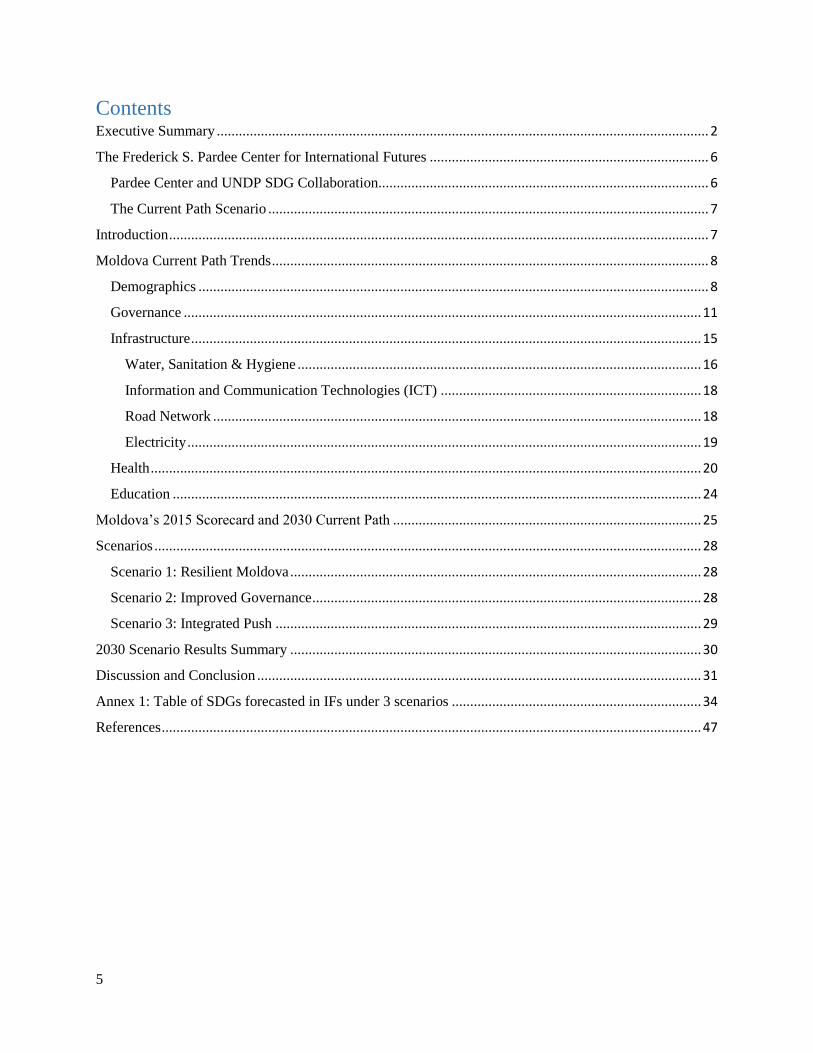
Contents Executive Summary ...................................................................................................................................... 2
The Frederick S. Pardee Center for International Futures ............................................................................ 6
Pardee Center and UNDP SDG Collaboration.......................................................................................... 6
The Current Path Scenario ........................................................................................................................ 7
Introduction ................................................................................................................................................... 7
Moldova Current Path Trends ....................................................................................................................... 8
Demographics ........................................................................................................................................... 8
Governance ............................................................................................................................................. 11
Infrastructure ........................................................................................................................................... 15
Water, Sanitation & Hygiene .............................................................................................................. 16
Information and Communication Technologies (ICT) ....................................................................... 18
Road Network ..................................................................................................................................... 18
Electricity ............................................................................................................................................ 19
Health ...................................................................................................................................................... 20
Education ................................................................................................................................................ 24
Moldova’s 2015 Scorecard and 2030 Current Path .................................................................................... 25
Scenarios ..................................................................................................................................................... 28
Scenario 1: Resilient Moldova ................................................................................................................ 28
Scenario 2: Improved Governance .......................................................................................................... 28
Scenario 3: Integrated Push .................................................................................................................... 29
2030 Scenario Results Summary ................................................................................................................ 30
Discussion and Conclusion ......................................................................................................................... 31
Annex 1: Table of SDGs forecasted in IFs under 3 scenarios .................................................................... 34
References ................................................................................................................................................... 47
6
The Frederick S. Pardee Center for International Futures
The Frederick S. Pardee Center for International Futures is based at the Josef Korbel School of
International Studies at the University of Denver. The Pardee Center specializes in helping
governments, international organizations, and private sector organizations frame uncertainty and
think strategically about the future. The Pardee Center focuses on exploring past development
trends, understanding the complex inter-relationships that drive development outcomes, and
shaping policies that communicate and achieve a clear development strategy.
International Futures (IFs) is a free and open-source quantitative tool for thinking about long-
term futures. The platform helps users to understand dynamics within and across global systems,
and to think systematically about potential trends, development goals and targets. While no
software can reliably predict the future, IFs forecasts — which are calculated using data and a
mix of quantitative modelling approaches — offer a broad and transparent way to think about the
tradeoffs in policymaking.
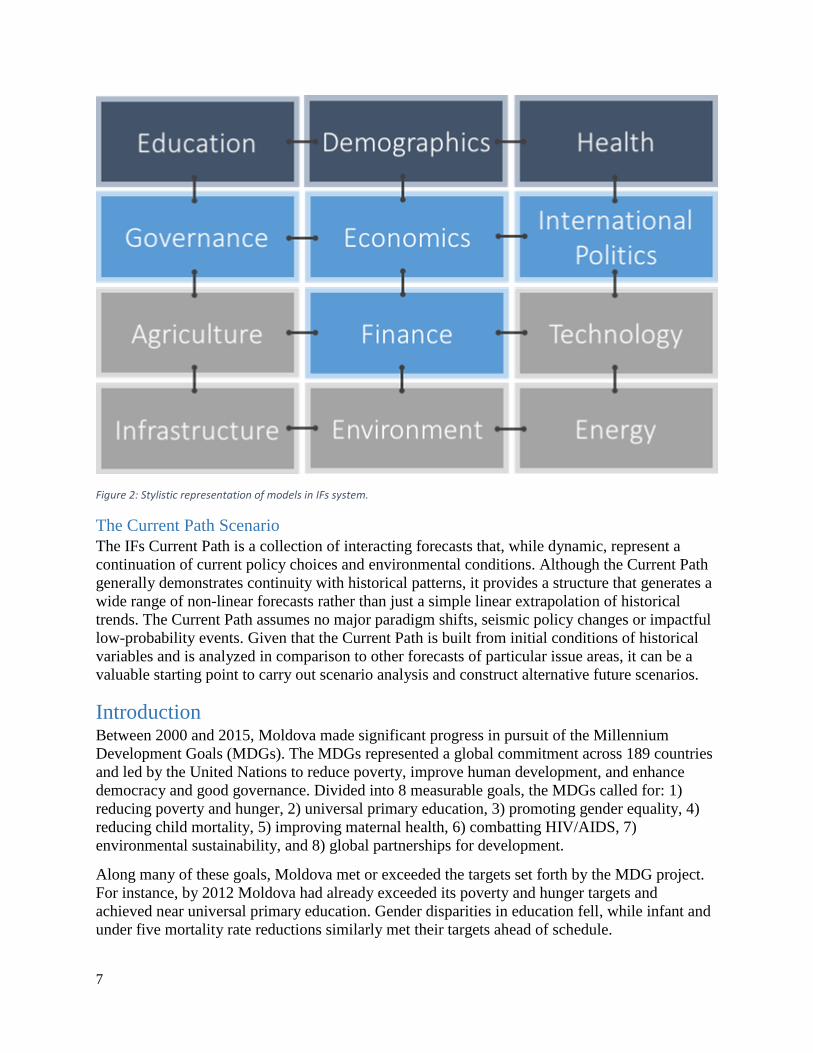
There are three main avenues for analysis in IFs: historical data analysis (cross-sectional and
longitudinal) of more than 4,000 series, Current Path analysis (how dynamic global systems
seem to be developing), and alternative scenario development (exploring if-then statements about
the future). To do this, IFs integrates relationships across 186 countries and 12 core systems,
including: agriculture, demographics, economics, education, energy, environment, finance,
governance, health, infrastructure, international politics, and technology. The sub-models for
each system are dynamically connected, so IFs can simulate how changes in one system may
lead to changes across all others. As a result, IFs endogenizes more variables and relationships
from a wider range of key development systems than any other model in the world.
IFs is developed by The Frederick S. Pardee Center for International Futures, based at the Josef
Korbel School of International Studies at the University of Denver in Colorado, USA. It was
originally created by Professor Barry B. Hughes. Learn more about IFs or download the tool for
free at pardee.du.edu.
Pardee Center and UNDP SDG Collaboration This report is part of a broader, long-term collaboration between the Pardee Center and UNDP to
assess SDG attainment and prospects across a variety of countries using IFs. These reports will
feed into the country-level MAPS analysis. The Pardee Center is also currently working with
UNDP Mexico and UNDP Brazil. As part of this collaboration, the Pardee Center has developed
a new SDG dashboard in IFs that shows Current Path forecasts for SDG indicators for 186
countries and the prospects for meeting those targets at the country level. While not every SDG
indicator is forecast in IFs, Pardee has also pulled in over 200 data series that align directly with
every SDG indicator across the 17 major SDG goals. This allows users to see a current (2015)
value for every SDG indicator in all 186 countries. For more information on the SDG dashboard
and instructions on its use see our wiki here.
7
Figure 2: Stylistic representation of models in IFs system.
The Current Path Scenario
The IFs Current Path is a collection of interacting forecasts that, while dynamic, represent a
continuation of current policy choices and environmental conditions. Although the Current Path
generally demonstrates continuity with historical patterns, it provides a structure that generates a
wide range of non-linear forecasts rather than just a simple linear extrapolation of historical
trends. The Current Path assumes no major paradigm shifts, seismic policy changes or impactful
low-probability events. Given that the Current Path is built from initial conditions of historical
variables and is analyzed in comparison to other forecasts of particular issue areas, it can be a
valuable starting point to carry out scenario analysis and construct alternative future scenarios.
Introduction Between 2000 and 2015, Moldova made significant progress in pursuit of the Millennium
Development Goals (MDGs). The MDGs represented a global commitment across 189 countries
and led by the United Nations to reduce poverty, improve human development, and enhance
democracy and good governance. Divided into 8 measurable goals, the MDGs called for: 1)
reducing poverty and hunger, 2) universal primary education, 3) promoting gender equality, 4)
reducing child mortality, 5) improving maternal health, 6) combatting HIV/AIDS, 7)
environmental sustainability, and 8) global partnerships for development.
Along many of these goals, Moldova met or exceeded the targets set forth by the MDG project.
For instance, by 2012 Moldova had already exceeded its poverty and hunger targets and
achieved near universal primary education. Gender disparities in education fell, while infant and
under five mortality rate reductions similarly met their targets ahead of schedule.
8
Despite these achievements, progress toward overall achievement of the MDGs remained
uneven. The third Moldova MDG report released in 2012 highlighted enduring issues around
gender equality, particularly for women entering the labor force, or moving into political life.
Moreover, Moldova has faced persistent challenges in reducing the burden of HIV/AIDS and
other infectious diseases and thus meeting targets set forth under MDG Goal 6. Under MDG 7,
access to clean water and sanitation remains a challenge; much of the infrastructure is in poor
condition or not functional. Post-MDG planning processes that fed into the development of the
national development plan "Moldova 2020" identified priority areas around economic growth
and education, social development and gender inclusivity, and health and environmental issues.
Building on the success of the MDGs, in 2015 the UN launched the Sustainable Development
Goals (SDGs), a set of 17 global development goals with a time horizon of 2030. These goals
represent a central aspect of the policy planning and development funding process for Moldova
over the next 13 years. It is therefore important to give policymakers a sense of the current status
and prospects for Moldova to achieve the targets defined by the SDGs.
This brief is organized around four major areas of analysis: i) trends across key issue areas out to
2030, ii) a scorecard describing the state of Moldova’s progress with respect to the SDGs in 2015
and Current Path scores of forecasted variables in 2030, iii) descriptions of scenario interventions
and summary output, and iv) discussion of the results and conclusions. The trends explored in
the first section are particularly highlighted because they are foundational areas of Moldova’s
development and feed directly into the scenarios constructed for this report, which were designed
in consultation with the UNDP Bureau for Policy Programme Support and the regional and
country UNDP mission. The following section begins by examining Moldova’s historical and
future development trajectory along five key areas: demographics, governance, infrastructure,
health, and education. For context, Moldova’s trends are frequently compared with regional
scores across neighboring countries using the UN Eastern Europe country grouping.6
Moldova Current Path Trends
Demographics
The population of Moldova peaked in 1992 at 4.4 million and has steadily declined to just over 4
million in 2015. Outward migration and low fertility rates have been the primary drivers of this
population decline, and the IFs Current Path forecasts these trends to continue. The population is
forecast to drop to around 3.7 million in 2030. Moldova’s fertility rate (total children per
women) dropped from nearly 2.6 children per woman in 1985 to 1.2 in 2015, further contributing
to population decline in Moldova. Fertility rates are forecast to remain below replacement rate
(2.1) out to 2030.7
Migration has been another important driver of demographic patterns in Moldova. Between 1990
and 2015, Moldova’s experienced high levels of emigration; its net immigration rate (immigrants
minus emigrants) fluctuated between -0.5 and -1.5 percent of the population.
Large-scale emigration of the level Moldova has experienced is a double-edged sword. On one
hand, the Moldovan diaspora has contributed significant remittance flows back into the
economy. In 2015, total remittances amounted to approximately 1.2 billion USD, in a country
with a GDP of 8.3 billion USD. Between 2000 and 2008, remittances as a percent of GDP grew
9
from 3.3 percent up to 27 percent in 2008, and have fluctuated between 22 and 27 percent of
GDP over the past five years (World Bank, 2017b). These are among the highest remittance to
GDP ratios in the world. Remittance flows have become a valuable source of foreign exchange
currency and have helped boost economic growth through direct impacts on household
consumption. Since 2010, Moldova has averaged GDP growth of around 5 percent annually,
helped in large part by remittances.
These trends may not continue, with implications for economic growth. Emigration, which grew
during the 1990s and peaked during the early 2000s, have fallen to much lower levels today. Net
migration grew from approximately -0.5 percent of the population in 1990 to close to -1.5
percent in 2000, before reaching an estimated 0.4 percent in 2015. The IFs Current Path
population forecasts assume a steady net emigration equivalent to approximately 0.3 percent of
the population across the forecast horizon.8 As a result, along the IFs Current Path household
consumption from remittances is forecast to remain below levels seen in previous decades,
raising questions over whether the reason period of buoyant growth is sustainable.
Economic growth is also threatened by the composition of the emigrant population. Widespread
emigration of skilled labor can result in a phenomenon called “brain drain,” or the migration of
highly skilled labor in search of a higher standard of living, higher wages, or access to better
professional opportunities (Dodani & LaPorte, 2005; IRES (UCLouvain), Belgium & Docquier,
2014; OECD, 2008). A significant portion of emigrants are “skilled,” that is they have (at least)
an undergraduate education. A 2012 OECD study showed that 37% of Moldovans aged 15 to 24
would leave if presented with the right opportunity (Tejada, Varzari, & Porcescu, 2013).
Significant brain drain can be a detriment to development because it reduces the stock of human
capital and may distort domestic employment. It also removes an important source of taxable
income, further restricting the government’s ability to provide services (OECD, 2007).
Continuing emigration combined with low fertility rates will accelerate a population “greying” in
Moldova, potentially slowing economic growth and placing significant strain on pensions and
social welfare (World Bank, 2017a). In 2015, 10 percent of the population (400,000 people) was
of retirement age (65+) in Moldova.9 Along the Current Path, by 2030 this will rise to nearly 18
percent of the population (660,000 people). In 2015 pension spending accounted for
approximately 9 percent of Moldova’s GDP. For context, Japan, one of the oldest societies in the
world, spent close to 10 percent of its GDP on pensions in 2015. Accelerated population aging
will only require more government resources to be devoted to pensions and social welfare.
Box 1: Forecasting Demographics in IFs
Condensed from (Barry B. Hughes, 2014: 3-4)
The population model of IFs uses the cohort component analysis approach of many population models, including
the studies done by the United Nations. The approach relies upon age, fertility, and mortality distributions for
each country/region with 22 cohorts: one for infants, 20 of five-year size, and one for all individuals of age 100 or
older.
The dominant population formulation is a simple addition of births at the bottom of the cohort distribution,
subtraction of deaths from each population cohort, and advance of people to the next cohort over time.
10
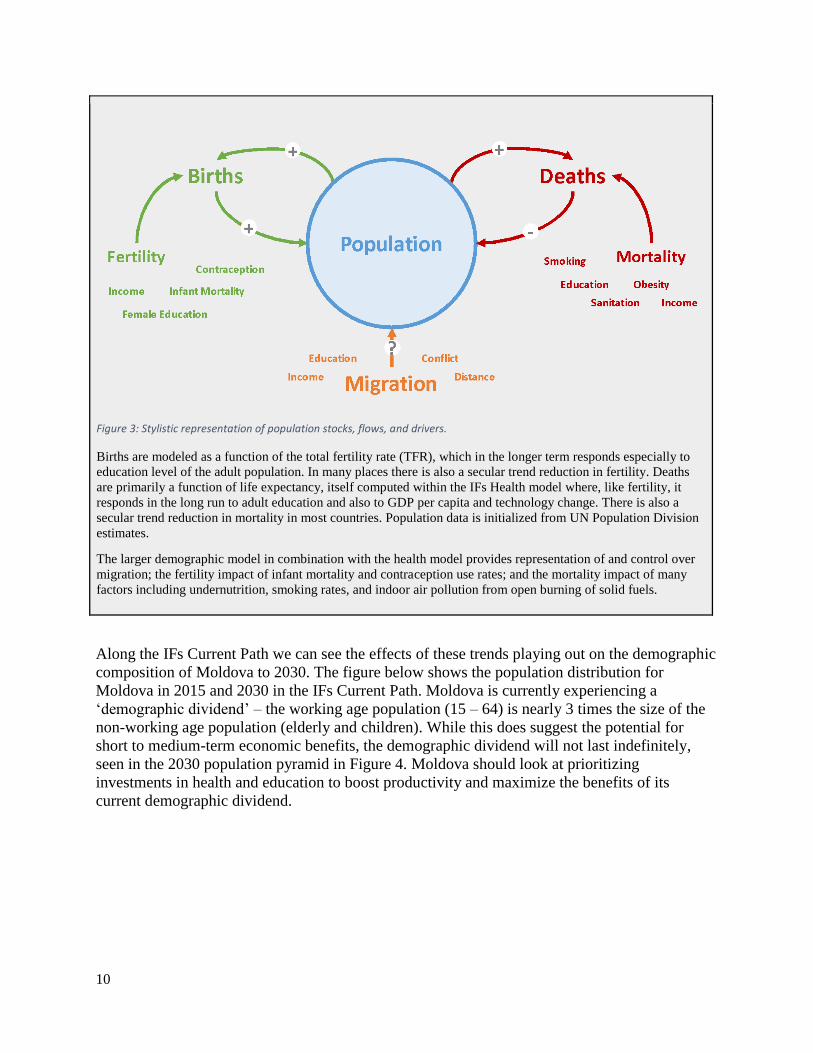
Figure 3: Stylistic representation of population stocks, flows, and drivers.
Births are modeled as a function of the total fertility rate (TFR), which in the longer term responds especially to
education level of the adult population. In many places there is also a secular trend reduction in fertility. Deaths
are primarily a function of life expectancy, itself computed within the IFs Health model where, like fertility, it
responds in the long run to adult education and also to GDP per capita and technology change. There is also a
secular trend reduction in mortality in most countries. Population data is initialized from UN Population Division
estimates.
The larger demographic model in combination with the health model provides representation of and control over
migration; the fertility impact of infant mortality and contraception use rates; and the mortality impact of many
factors including undernutrition, smoking rates, and indoor air pollution from open burning of solid fuels.
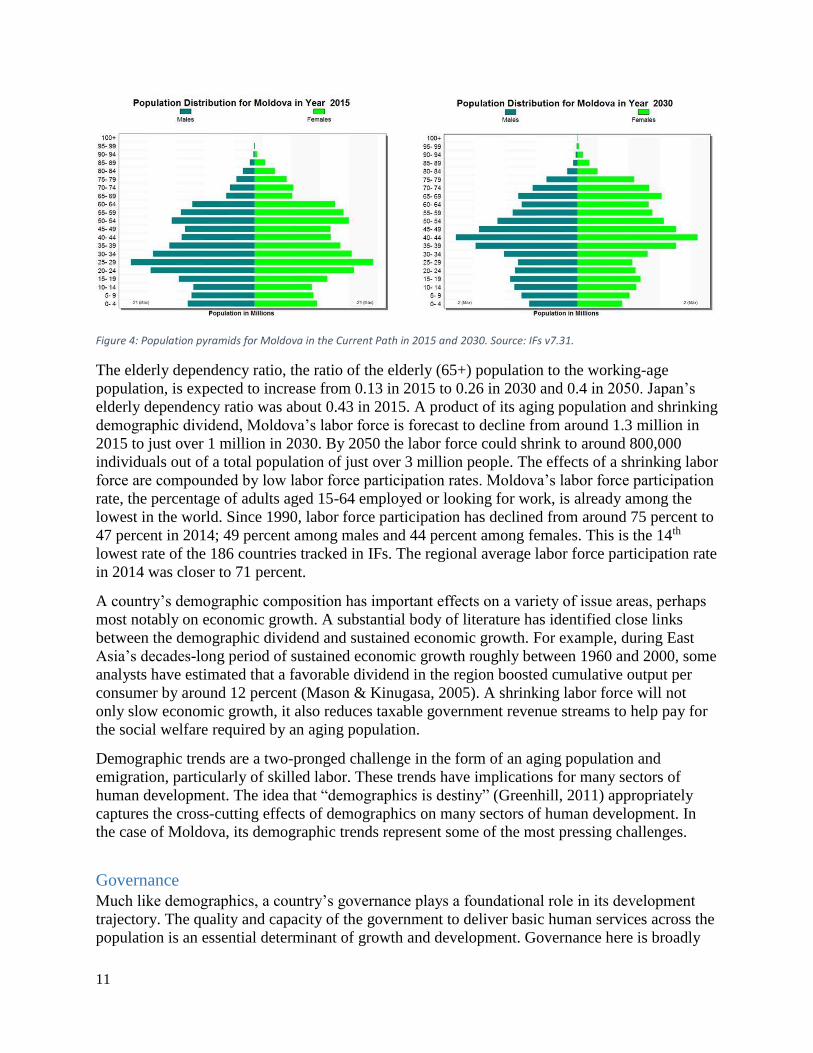
Along the IFs Current Path we can see the effects of these trends playing out on the demographic
composition of Moldova to 2030. The figure below shows the population distribution for
Moldova in 2015 and 2030 in the IFs Current Path. Moldova is currently experiencing a
‘demographic dividend’ – the working age population (15 – 64) is nearly 3 times the size of the
non-working age population (elderly and children). While this does suggest the potential for
short to medium-term economic benefits, the demographic dividend will not last indefinitely,
seen in the 2030 population pyramid in Figure 4. Moldova should look at prioritizing
investments in health and education to boost productivity and maximize the benefits of its
current demographic dividend.
11
Figure 4: Population pyramids for Moldova in the Current Path in 2015 and 2030. Source: IFs v7.31.
The elderly dependency ratio, the ratio of the elderly (65+) population to the working-age
population, is expected to increase from 0.13 in 2015 to 0.26 in 2030 and 0.4 in 2050. Japan’s
elderly dependency ratio was about 0.43 in 2015. A product of its aging population and shrinking
demographic dividend, Moldova’s labor force is forecast to decline from around 1.3 million in
2015 to just over 1 million in 2030. By 2050 the labor force could shrink to around 800,000
individuals out of a total population of just over 3 million people. The effects of a shrinking labor
force are compounded by low labor force participation rates. Moldova’s labor force participation
rate, the percentage of adults aged 15-64 employed or looking for work, is already among the
lowest in the world. Since 1990, labor force participation has declined from around 75 percent to
47 percent in 2014; 49 percent among males and 44 percent among females. This is the 14th
lowest rate of the 186 countries tracked in IFs. The regional average labor force participation rate
in 2014 was closer to 71 percent.
A country’s demographic composition has important effects on a variety of issue areas, perhaps
most notably on economic growth. A substantial body of literature has identified close links
between the demographic dividend and sustained economic growth. For example, during East
Asia’s decades-long period of sustained economic growth roughly between 1960 and 2000, some
analysts have estimated that a favorable dividend in the region boosted cumulative output per
consumer by around 12 percent (Mason & Kinugasa, 2005). A shrinking labor force will not
only slow economic growth, it also reduces taxable government revenue streams to help pay for
the social welfare required by an aging population.
Demographic trends are a two-pronged challenge in the form of an aging population and
emigration, particularly of skilled labor. These trends have implications for many sectors of
human development. The idea that “demographics is destiny” (Greenhill, 2011) appropriately
captures the cross-cutting effects of demographics on many sectors of human development. In
the case of Moldova, its demographic trends represent some of the most pressing challenges.
Governance
Much like demographics, a country’s governance plays a foundational role in its development
trajectory. The quality and capacity of the government to deliver basic human services across the
population is an essential determinant of growth and development. Governance here is broadly
12
conceived of as the “way society manages itself,” and the dynamic interactions between civil
society, the population, and government institutions (Hughes, Joshi, Moyer, Sisk, & Solórzano,
2014:4).
Box 2. Forecasting Governance in IFs
Taken from (Hughes et al., 2014:4)
Governance in IFs is conceptualized and forecast along three major transitions broadly in line with tenets of
modernization theory, namely: a security transition, a capacity transition, and an inclusion transition.
The security transition begins with the movement from anarchy to sovereignty as states consolidate territory,
establish a monopoly on the legitimate use of force, and achieve international recognition by other states. The
security transition is focused on maintaining stability and reducing internal conflict within a bounded territorial
area as states begin to develop administrative capacity.
The capacity transition follows the development and professionalization of the state bureaucracy and the ability
of the state to administer to the territory it controls. Developing governance capacity requires things like an
effective public administration, a system of taxation and revenue generation, a legitimate system of laws and rules
applied equally and a professional military and police force. These elements help the state deliver public services.
The final transition is towards one of inclusion. The process of moving toward inclusive governance includes free
movement of information, association, pluralistic decision-making, and a cooperative political culture.
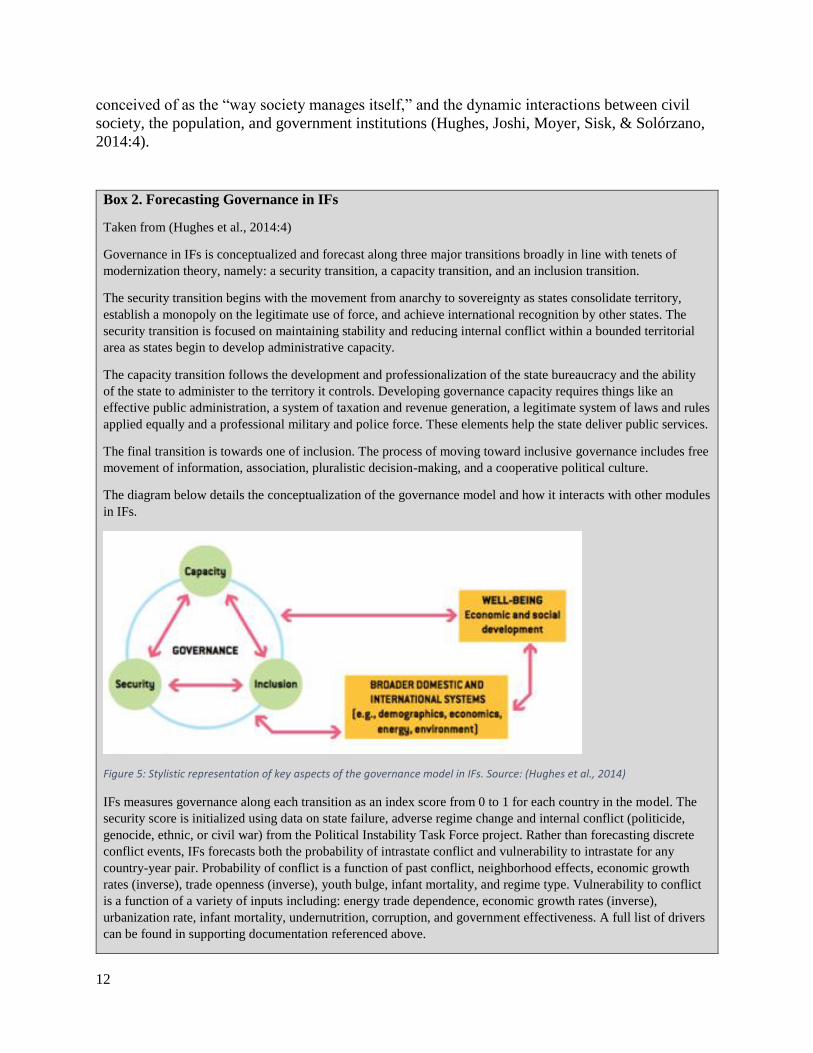
The diagram below details the conceptualization of the governance model and how it interacts with other modules
in IFs.
Figure 5: Stylistic representation of key aspects of the governance model in IFs. Source: (Hughes et al., 2014)
IFs measures governance along each transition as an index score from 0 to 1 for each country in the model. The
security score is initialized using data on state failure, adverse regime change and internal conflict (politicide,
genocide, ethnic, or civil war) from the Political Instability Task Force project. Rather than forecasting discrete
conflict events, IFs forecasts both the probability of intrastate conflict and vulnerability to intrastate for any
country-year pair. Probability of conflict is a function of past conflict, neighborhood effects, economic growth
rates (inverse), trade openness (inverse), youth bulge, infant mortality, and regime type. Vulnerability to conflict
is a function of a variety of inputs including: energy trade dependence, economic growth rates (inverse),
urbanization rate, infant mortality, undernutrition, corruption, and government effectiveness. A full list of drivers
can be found in supporting documentation referenced above.
13
The capacity index is forecasted as a function of government revenue and corruption. Government revenue
(percent of GDP) comes from World Bank and OECD data, while corruption data are taken from Transparency
International’s Corruption Perceptions Index.
The inclusion index is conceived as a broad set of variables including regime type (level of democratic
governance) and gender empowerment. Regime type data is initialized from the Polity Project’s 11-point
democracy scale data, while Gender Empowerment is initialized from UN Gender Empowerment Measure.
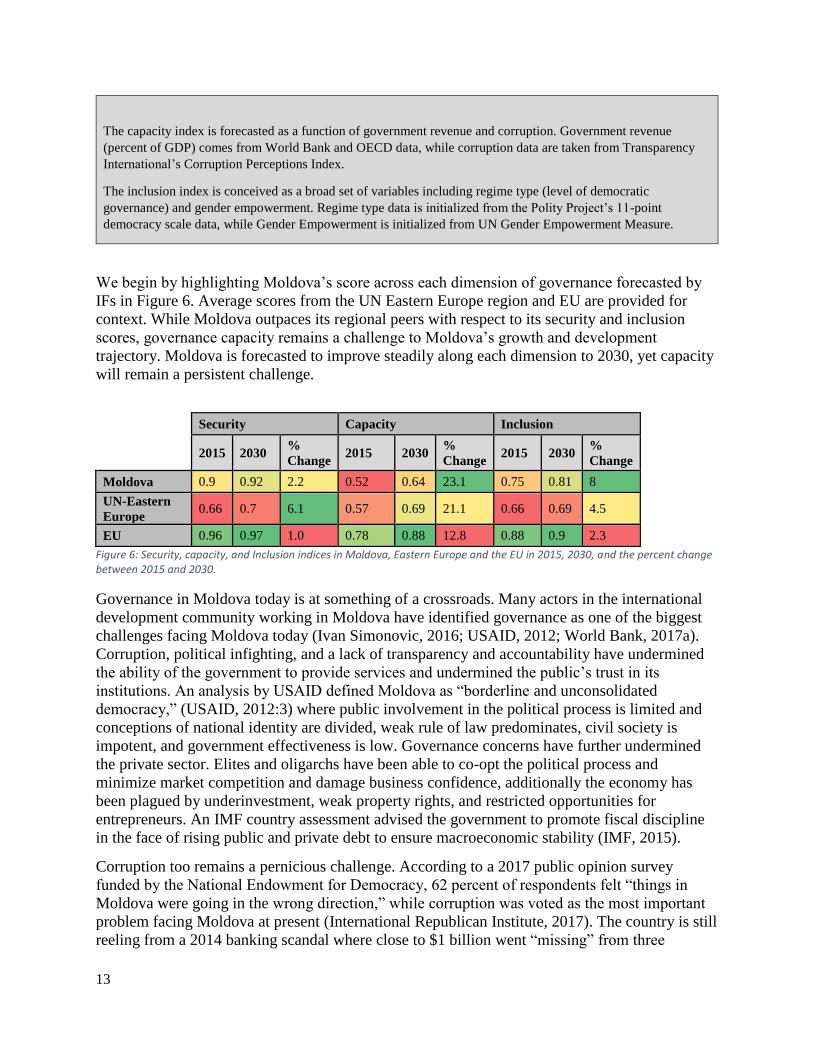
We begin by highlighting Moldova’s score across each dimension of governance forecasted by
IFs in Figure 6. Average scores from the UN Eastern Europe region and EU are provided for
context. While Moldova outpaces its regional peers with respect to its security and inclusion
scores, governance capacity remains a challenge to Moldova’s growth and development
trajectory. Moldova is forecasted to improve steadily along each dimension to 2030, yet capacity
will remain a persistent challenge.
Security Capacity Inclusion
2015 2030 %
Change 2015 2030
%
Change 2015 2030
%
Change
Moldova 0.9 0.92 2.2 0.52 0.64 23.1 0.75 0.81 8
UN-Eastern
Europe 0.66 0.7 6.1 0.57 0.69 21.1 0.66 0.69 4.5
EU 0.96 0.97 1.0 0.78 0.88 12.8 0.88 0.9 2.3
Figure 6: Security, capacity, and Inclusion indices in Moldova, Eastern Europe and the EU in 2015, 2030, and the percent change between 2015 and 2030.
Governance in Moldova today is at something of a crossroads. Many actors in the international
development community working in Moldova have identified governance as one of the biggest
challenges facing Moldova today (Ivan Simonovic, 2016; USAID, 2012; World Bank, 2017a).
Corruption, political infighting, and a lack of transparency and accountability have undermined
the ability of the government to provide services and undermined the public’s trust in its
institutions. An analysis by USAID defined Moldova as “borderline and unconsolidated
democracy,” (USAID, 2012:3) where public involvement in the political process is limited and
conceptions of national identity are divided, weak rule of law predominates, civil society is
impotent, and government effectiveness is low. Governance concerns have further undermined
the private sector. Elites and oligarchs have been able to co-opt the political process and
minimize market competition and damage business confidence, additionally the economy has
been plagued by underinvestment, weak property rights, and restricted opportunities for
entrepreneurs. An IMF country assessment advised the government to promote fiscal discipline
in the face of rising public and private debt to ensure macroeconomic stability (IMF, 2015).
Corruption too remains a pernicious challenge. According to a 2017 public opinion survey
funded by the National Endowment for Democracy, 62 percent of respondents felt “things in
Moldova were going in the wrong direction,” while corruption was voted as the most important
problem facing Moldova at present (International Republican Institute, 2017). The country is still
reeling from a 2014 banking scandal where close to $1 billion went “missing” from three

14
different state banks. The National Bank of Moldova was forced to bail out the banks to protect
depositors, but the cost to public finances was as much as one eighth of GDP (Tim Whewell,
2015). Recent trends in corruption are worrying. According to the Worldwide Governance
Indicators project from the World Bank, Moldova fell from the 30th percentile down to the 20th
percentile in its “control of corruption” between 2005 and 2015.
IFs measures and forecasts government transparency (considered here the absence of corruption)
with data initialized from the Corruptions Perceptions Index from Transparency International, a
government watchdog. In 2015, Moldova was ranked 117th (out of 186 countries) with respect to
its level of government transparency. IFs forecasts Moldova's level of transparency to improve
gradually; although by 2030 it is forecast only to be ranked 107th, roughly the level of
transparency in Indonesia today.
IFs also forecasts levels of government effectiveness, initialized using data from the World
Bank's Worldwide Governance Indicators project. Government effectiveness captures the quality
of public services, the civil service, the policy formulation process, and the government's
commitment to these policies (World Bank, 2016). In 2015 Moldova's government effectiveness
score was ranked 108th in the world. While its effectiveness score is forecast to improve across
the horizon, Moldova's ranking is forecast to fall to 110 by 2030. Regionally, Moldova has
higher score than only Belarus and Ukraine in terms of both government effectiveness.
Box 3: Transnistria and Governance Security in Moldova
Transnistria is a landlocked, self-proclaimed state situated along Moldova’s border with Ukraine. Conflict
between Transnistria and the Republic of Moldova broke out for several months following the dissolution of the
Soviet Union in 1992, resulting in a ceasefire agreement which has held until the present day. Transnistria is
considered a special autonomous territorial unit within the Republic of Moldova and operates its own political
and economic system. Today the relationship between Transnistria and Moldova is considered a frozen conflict,
which has contributed to Transnistria’s development challenges. As a result of its political status and largely self-
imposed isolation, Transnistria suffers from lower levels of human development and worsening economic
conditions relative to the rest of the country. Much of the population living in Transnistria does not benefit from
the same services available to Moldovans living in other parts of the country, resulting in a widening
development gap between both areas.
The IFs system has no separate modeling capacity for Transnistria and considers the region to be part of the
Republic of Moldova. The data and variables used in this report include Transnistria as part of the analysis.
Given its status as a frozen conflict, the level of intrastate conflict resulting from the Transnistria situation is low,
and many underlying drivers of instability are low-risk in Moldova. The population is aging and young people are
emigrating abroad in search of work, according to the World Bank the formal unemployment rate was between 4
and 5 percent in 2014, lower than the rate among many regional counterparts including Belarus (5.9), Russia
(5.1), Hungary (7.8) and Poland (9.2), and urbanization has slowed in recent years, with less than half of the
population residing in an urban area. Thus, along the IFs Current Path Moldova scores relatively well on
governance security and the prospects for conflict are forecast to remain low.
Governance will likely remain a central issue across the horizon of the SDG’s. Much recent
commentary and reporting on Moldova has reflected deepening concerns over the current state of
the country’s governance. The 2016 Freedom House index, which measures civic and political
freedom globally, designates Moldova as “partly free,” due to concerns over worsening
government effectiveness, corruption, and influence of business on politics. In March 2016 the
15
UN Assistant Secretary-General for Human Rights made a 4-day visit to the country. His report
voiced concerns with deep divisions along ethnic, religious, gender, political, linguistic, and
income lines, widespread corruption, and “paralysis in governance” (Ivan Simonovic, 2016).
Many future scenarios around Moldova’s path toward achieving the SDG’s depends upon
managing and improving domestic governance.
Infrastructure
Infrastructure, defined as “the system of public works of a country, state, or region and the
resources (such as the personnel, buildings, or equipment) required to complete an activity”
(Rothman, 2014), is an essential foundation for development and the backbone of any developed
economy (Ascher & Krupp, 2010). Strong infrastructure enables the rapid transmission of goods,
services, people, energy and information; it acts as an enabling factor for growth and
development.
The IFs platform measures and forecasts the stock of infrastructure (i.e. the physical amount) and
access rates across the population to that infrastructure. Infrastructure forecasts are grouped
around four core areas: water and sanitation (WASH), information and communication
technology (ICT), roads, and electricity.
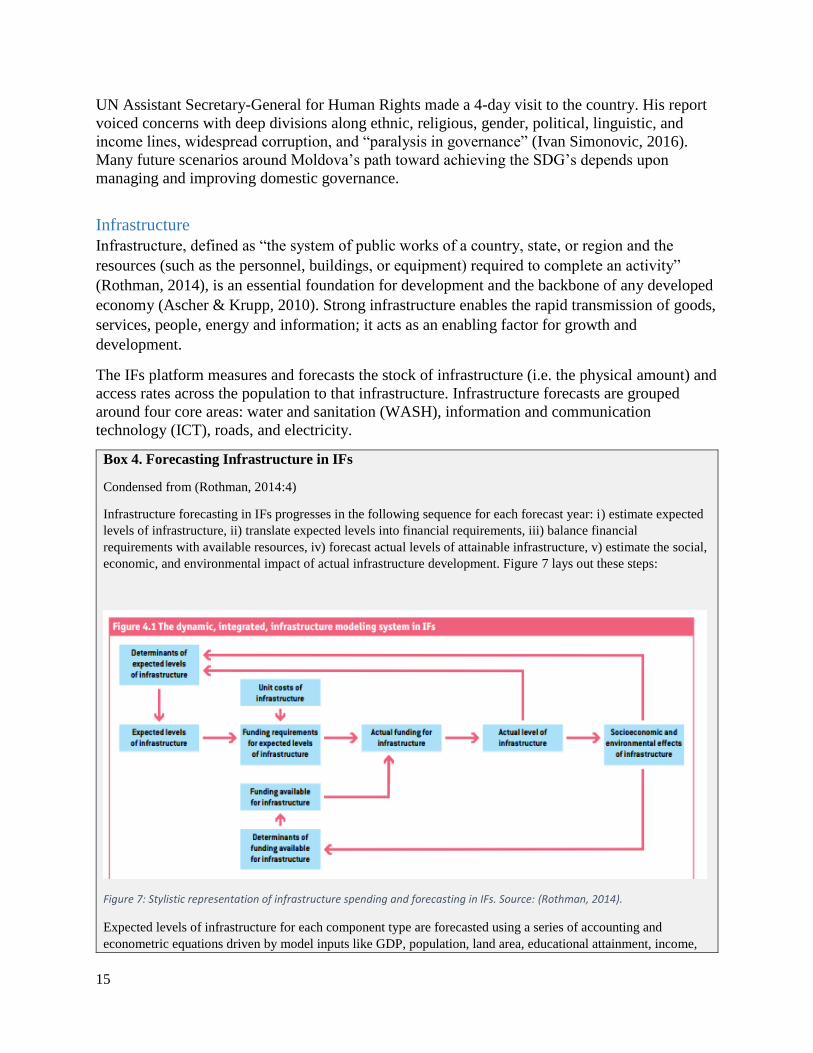
Box 4. Forecasting Infrastructure in IFs
Condensed from (Rothman, 2014:4)
Infrastructure forecasting in IFs progresses in the following sequence for each forecast year: i) estimate expected
levels of infrastructure, ii) translate expected levels into financial requirements, iii) balance financial
requirements with available resources, iv) forecast actual levels of attainable infrastructure, v) estimate the social,
economic, and environmental impact of actual infrastructure development. Figure 7 lays out these steps:
Figure 7: Stylistic representation of infrastructure spending and forecasting in IFs. Source: (Rothman, 2014).
Expected levels of infrastructure for each component type are forecasted using a series of accounting and
econometric equations driven by model inputs like GDP, population, land area, educational attainment, income,
16
poverty levels and governance. Expected infrastructure is translated into financial requirements for funding based
on costs for both new infrastructure and maintenance of existing. Financial requirements are then translated into
financing resources available in conjunction with the IFs government finance model. Government finance
balances government domestic revenue and foreign aid across costs on transfers (pensions and social welfare) and
direct government spending. IFs models spending across broad categories of defense, education, health, research
and development, basic infrastructure, and other infrastructure (airports, ports, railroads), and other (residual
category). The financing requirements are then balanced against expected levels of infrastructure to determine the
actual infrastructure development in that year.
Water, Sanitation & Hygiene
IFs water access forecasts are initialized using data from the Joint Monitoring Program (JMP) on
water and sanitation, published by UNICEF and the WHO. IFs water is classified according to
the following 1) piped water, 2) other improved services (e.g. boreholes, tubewells, protected
wells and springs, packaged water) 3) unimproved services (e.g. surface water, unprotected wells
and spring).
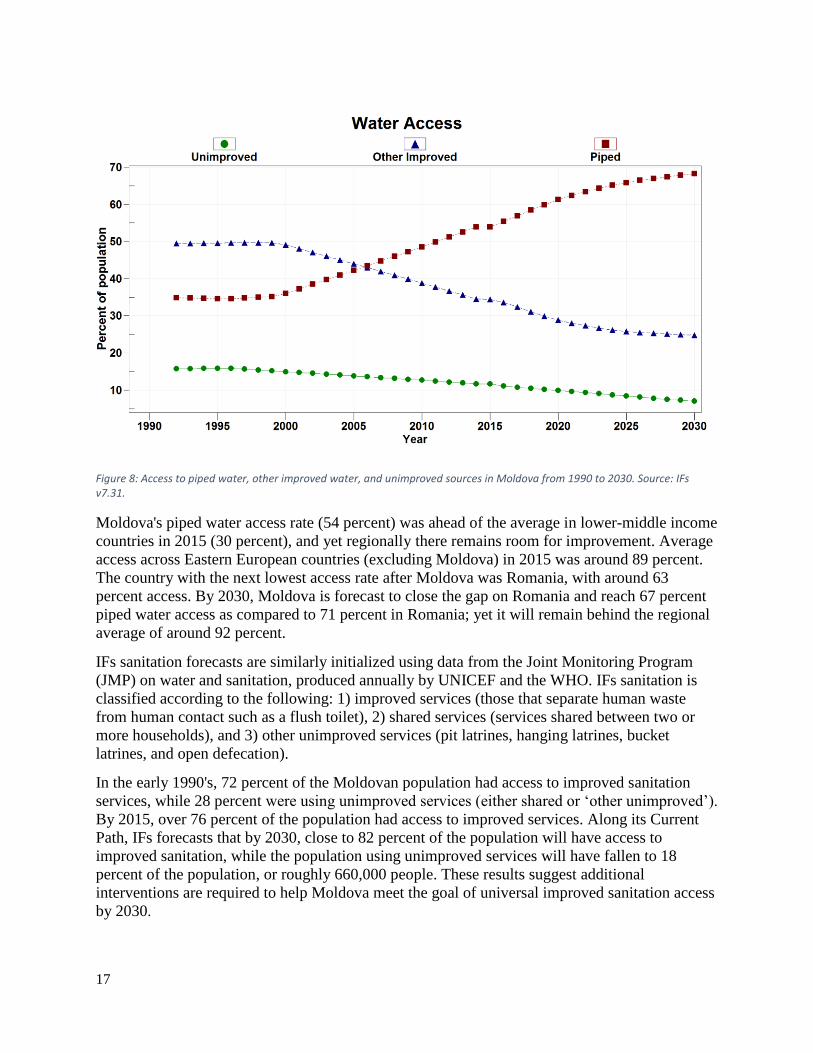
Since the early 1990s, the percent of the population connected to piped water in Moldova has
grown steadily from 35 percent to nearly 54 percent in 2015. At the same time the share of the
population using other improved services fell from 49 percent to 34 percent, while those with
unimproved access fell from around 16 percent to 12 percent. Yet, despite this progress, access
to unimproved water sources in Moldova is still the highest among Eastern European countries
and along its Current Path Moldova is not forecast to meet targets set out by the SDGs. By 2030,
an estimated 67 percent of the population (roughly 2.5 million people) will get their water from
piped services, but as much as 8 percent of the population, over 300,000 people, will still rely on
unimproved sources. By 2030, the level of access to piped water in Moldova could increase to
reach the current levels in Ukraine.
17
Figure 8: Access to piped water, other improved water, and unimproved sources in Moldova from 1990 to 2030. Source: IFs v7.31.
Moldova's piped water access rate (54 percent) was ahead of the average in lower-middle income
countries in 2015 (30 percent), and yet regionally there remains room for improvement. Average
access across Eastern European countries (excluding Moldova) in 2015 was around 89 percent.
The country with the next lowest access rate after Moldova was Romania, with around 63
percent access. By 2030, Moldova is forecast to close the gap on Romania and reach 67 percent
piped water access as compared to 71 percent in Romania; yet it will remain behind the regional
average of around 92 percent.
IFs sanitation forecasts are similarly initialized using data from the Joint Monitoring Program
(JMP) on water and sanitation, produced annually by UNICEF and the WHO. IFs sanitation is
classified according to the following: 1) improved services (those that separate human waste
from human contact such as a flush toilet), 2) shared services (services shared between two or
more households), and 3) other unimproved services (pit latrines, hanging latrines, bucket
latrines, and open defecation).
In the early 1990's, 72 percent of the Moldovan population had access to improved sanitation
services, while 28 percent were using unimproved services (either shared or ‘other unimproved’).
By 2015, over 76 percent of the population had access to improved services. Along its Current
Path, IFs forecasts that by 2030, close to 82 percent of the population will have access to
improved sanitation, while the population using unimproved services will have fallen to 18
percent of the population, or roughly 660,000 people. These results suggest additional
interventions are required to help Moldova meet the goal of universal improved sanitation access
by 2030.
18
As with clean water, Moldova's access rates (76 percent) are significantly ahead of the average
across other lower-middle income countries (52 percent in 2015). And yet, improved sanitation
access in Moldova lags many of its regional neighbors. In 2015, an average of 91 percent of the
regional population (excluding Moldova) had access to improved sanitation in 2015, which is
forecasted to reach 94 percent by 2030. Within Eastern Europe, IFs forecasts that by 2030
Moldova will have a smaller percentage of its population connected to improved sanitation than
many of its regional neighbors, including Ukraine (98 percent), Bulgaria (90 percent), Belarus
(97 percent) and Slovakia (98 percent). Notably however, Moldova's access rates will still
outpace its lower-middle income peers, who are forecasted to reach an average of 80 percent
improved access by 2030.
Information and Communication Technologies (ICT)
ICT is measured and modeled in IFs using subscription rates (per 100 people). IFs models four
types of ICT: fixed telephone lines, fixed broadband, mobile telephone, and mobile broadband.
Growth in ICT hardware is driven primarily as a function of GDP, population, regulatory quality,
and urbanization rates, and data used to initialize ICT access comes from the International
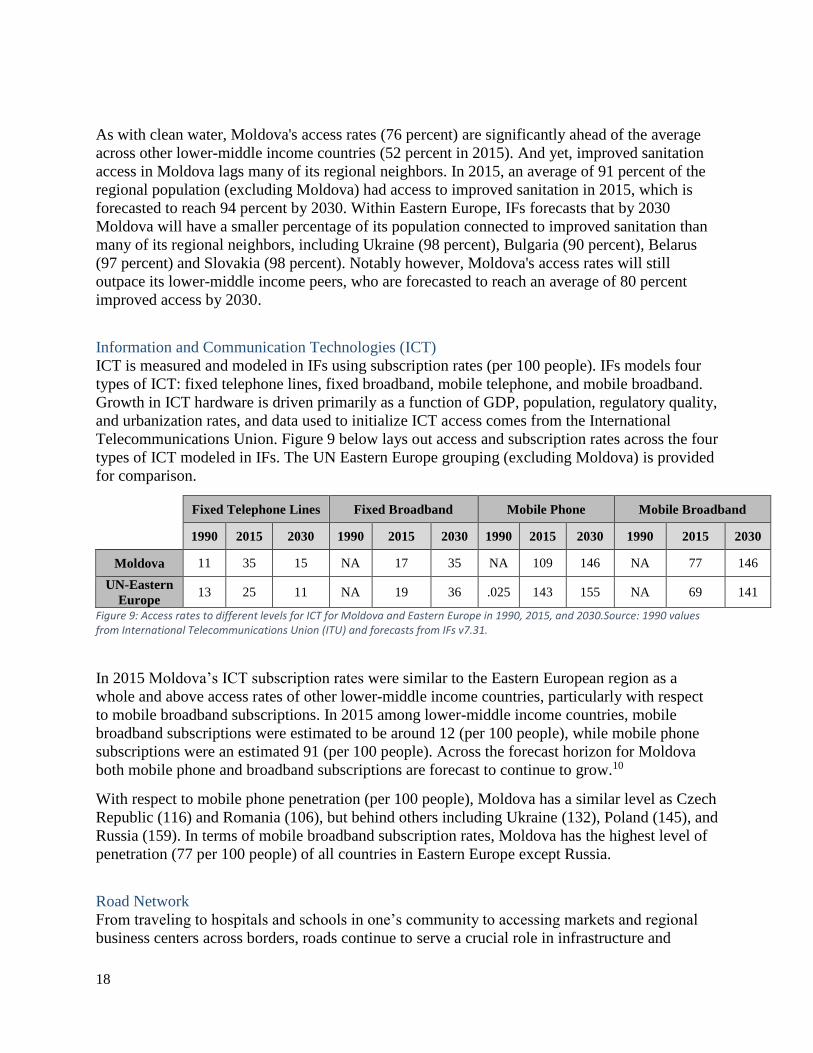
Telecommunications Union. Figure 9 below lays out access and subscription rates across the four
types of ICT modeled in IFs. The UN Eastern Europe grouping (excluding Moldova) is provided
for comparison.
Fixed Telephone Lines Fixed Broadband Mobile Phone Mobile Broadband
1990 2015 2030 1990 2015 2030 1990 2015 2030 1990 2015 2030
Moldova 11 35 15 NA 17 35 NA 109 146 NA 77 146
UN-Eastern
Europe 13 25 11 NA 19 36 .025 143 155 NA 69 141
Figure 9: Access rates to different levels for ICT for Moldova and Eastern Europe in 1990, 2015, and 2030.Source: 1990 values from International Telecommunications Union (ITU) and forecasts from IFs v7.31.
In 2015 Moldova’s ICT subscription rates were similar to the Eastern European region as a
whole and above access rates of other lower-middle income countries, particularly with respect
to mobile broadband subscriptions. In 2015 among lower-middle income countries, mobile
broadband subscriptions were estimated to be around 12 (per 100 people), while mobile phone
subscriptions were an estimated 91 (per 100 people). Across the forecast horizon for Moldova
both mobile phone and broadband subscriptions are forecast to continue to grow.10
With respect to mobile phone penetration (per 100 people), Moldova has a similar level as Czech
Republic (116) and Romania (106), but behind others including Ukraine (132), Poland (145), and
Russia (159). In terms of mobile broadband subscription rates, Moldova has the highest level of
penetration (77 per 100 people) of all countries in Eastern Europe except Russia.
Road Network
From traveling to hospitals and schools in one’s community to accessing markets and regional
business centers across borders, roads continue to serve a crucial role in infrastructure and

19
human development. In 2015, Moldova had an estimated 12,900 total kilometers of road (all
surfaces), and boasted approximately 3,180 kilometers of road per person, and approximately 3.9
kilometers per hectare. An estimated 86 percent of the total road network is paved, which
equates to roughly 2,737 kilometers of paved road per person and 3.9 kilometers per thousand
hectares.
The Figure below outlines how Moldova’s road network compares to its regional peers. Ukraine
and Belarus have the next lowest rates of GDP per capita after Moldova in the region. The Czech
Republic and Slovakia have the highest GDP per capita in the region. The European Union is
included as for comparison across more advanced economies.
Country/Group Paved Roads per Capita
(thousand KM per person)
Paved Roads per Hectare
(KM per thousand hectares)
1995 2015 2030 1995 2015 2030
Moldova 2.9 3.2 3.8 3.8 3.9 4.3
Ukraine 3.4 3.8 4.4 3.0 2.9 3.1
Belarus NA 9.4 10.1 NA 4.4 4.5
Czech Republic NA 12.5 12.7 NA 17.1 17.6
Slovakia 7.9 8.0 8.8 8.8 9.1 9.8
European Union 7.4 12 12.8 8.5 14.4 15.4
Figure 10: Road density per hectare and per person in Moldova and selected other Easter European countries in 1995, 2015, and 2030. Source: data from
The Figure provides a national picture of road density and access in the region. Moldova has
among the lowest road density per capita in the region. While it is higher than Bulgaria (not
shown), its per capita density is lower than both Ukraine and Belarus, countries with the next
closest GDP per capita in the region after Moldova. Moreover, compared against average road
density figures from the European Union, Moldova has less than 30 percent the road network of
the EU average. Rural areas are almost certainly disproportionately underserved. The rural
access index (RAI), which measures the percentage of the population living within 2 kilometers
of an all-weather road, shows that Moldova has historically had some of the lowest levels of
access in the region. In 2003 Moldova’s RAI score was 66, compared with close to 100 in
Bulgaria, Hungary, Poland, and Czech Republic. Only Belarus and Ukraine had lower levels of
rural road access.11
Electricity
According to data taken from the World Development Indicators, by 2013 Moldova had reached
100 percent electricity access across the population. Access rates grew from around 89 percent in
rural areas in 1990 and 95 percent in urban areas to reach 100 percent by 2012.
20
Health
Moldova’s health sector has seen commendable improvement since independence in the early
1990s. Life expectancy is increasing, malnutrition is decreasing, and mortality and morbidity
rates from both communicable diseases has fallen. And yet, challenges remain. The third UNDP
MDG report for Moldova (Valeriu Prohnitchi, Valentina Bodrug-Lungu, Arcadie Astrahan, &
Valentin Cibotaru, 2013) pointed out that with respect to MDG 6: Combat HIV/AIDS,
tuberculosis, and other diseases, it was “not possible” to meet any targets in Moldova by 2015.
Incidence rates for tuberculosis have averaged 140 (per 100,000 population) between 1990 and
2015, among the highest rates in the region (World Bank, 2017b). HIV/AIDS incidence rates
have grown from around 2 per 100,000 in 1995 to around 20 per 100,000 in 2015 (World Health
Organization & Regional Office for Europe, 2016). Nevertheless, while incidence rates have
grown, mortality from tuberculosis and HIV/AIDs is relatively low. According to (UNAIDS,
2015) and the WHO, there were less than 1000 deaths from AIDS in 2015 and just over 300
deaths from tuberculosis in 2013. The mortality impact of tuberculosis and HIV/AIDS remains
low.
Instead, under pressure from an aging population, an increasingly large burden of disease will
come from noncommunicable diseases. Government healthcare budgets and health budgets will
need to adapt to meet the growing fiscal burden. This section aims to provide a snapshot of the
Moldovan health sector and suggests attention needs to focus on the noncommunicable burden
across the forecast horizon.
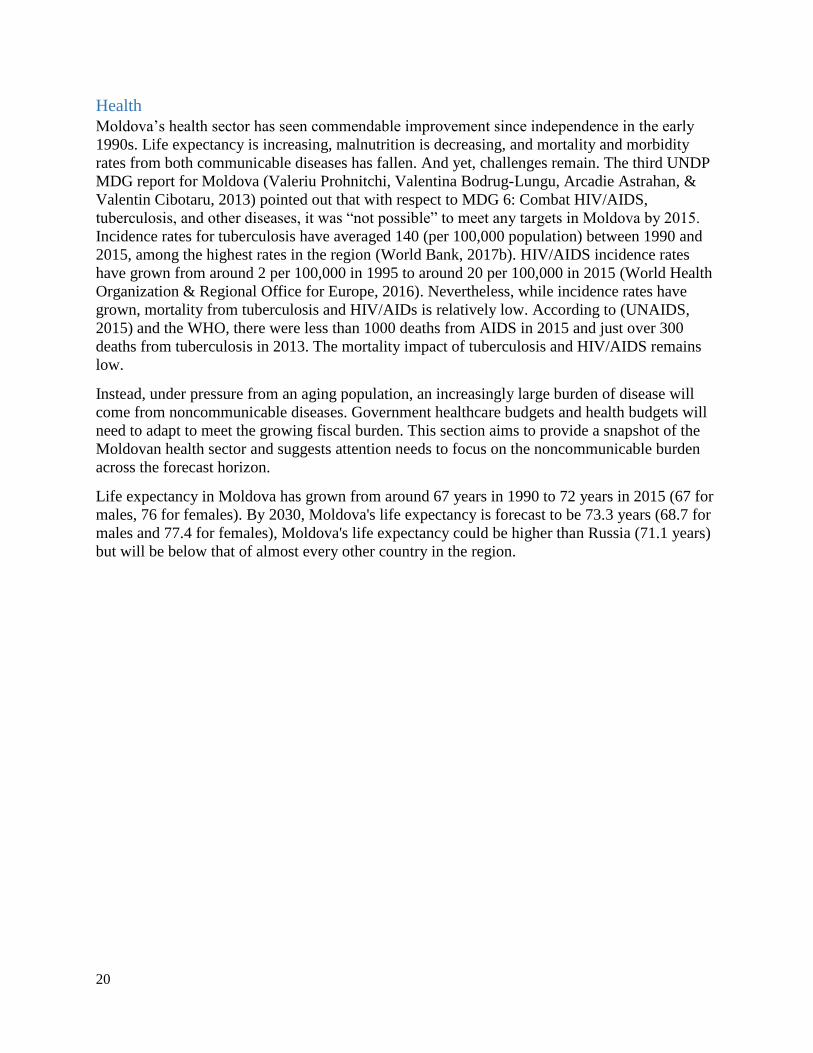
Life expectancy in Moldova has grown from around 67 years in 1990 to 72 years in 2015 (67 for
males, 76 for females). By 2030, Moldova's life expectancy is forecast to be 73.3 years (68.7 for
males and 77.4 for females), Moldova's life expectancy could be higher than Russia (71.1 years)
but will be below that of almost every other country in the region.
21
Figure 11: Life expectancy for Eastern European countries from 1990 to 2030. Source: historical data from UNPD's World Population Prospects 2017 revision, forecast from IFs v7.31.
Box 5: Forecasting Health Outcomes in IFs
Condensed from (Hughes, Kuhn, Peterson, Rothman, & Solórzano, 2011)
IFs forecasts morbidity and mortality for 15 specific causes. These causes are grouped according to the WHO’s
International Classification for Disease structure: communicable (infectious) diseases, noncommunicable
diseases, and accidents. Accidents is further broken down into traffic fatalities, unintentional injuries or death,
and intentional injuries or death (murder, suicide, etc.). Data on mortality/morbidity for each of these causes is
taken from the WHO Global Burden of Disease Project. The GBD project forecasts mortality and morbidity
across hundreds of unique causes; for parsimony and forecasting purposes IFs consolidates data from the GBD
into 15 specific causes: HIV/AIDS, diarrhea, respiratory infection, malaria, cancer, respiratory disease, diabetes,
cardiovascular disease, digestive, mental health, other communicable disease, other noncommunicable disease,
traffic accidents, intentional injuries, and unintentional injuries.
Mortality and morbidity rates are forecast using a distal and proximate driver structure in the model. Distal
drivers are those that change over a long period of time and are associated with the social determinants of health.
They are systemic and draw from sectors outside the immediate purview of health. Examples of these drivers
include levels of education, levels of income and technology. The Global Burden of Disease (GBD) identified
income levels, education and technological progress as proxies that drive the incidence and prevalence of disease
distally (Murray & Lopez, 1996). IFs uses these proxies as distal drivers to forecast health outcomes.
Proximate drivers affect the burden of disease more directly. IFs makes use of childhood undernutrition, the Body
Mass Index (BMI), access to water and sanitation, and climate change as proximate drivers when forecasting
disease mortality and health outcomes (Hughes et al., 2011). IFs also forecasts various demographic, economic
22
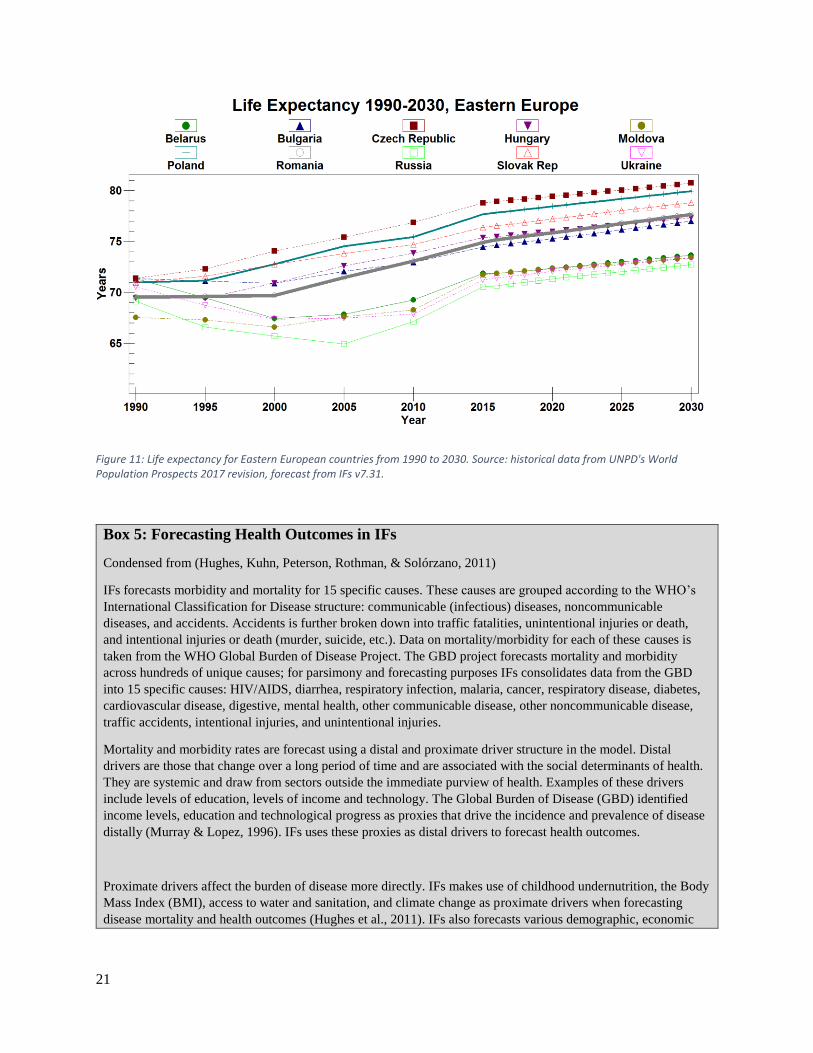
and socio-political outcomes of reduction in disease mortality. Below is a simple diagrammatic description of the
drivers of disease in IFs:
Figure 12: Distal and proximate drivers in the International Futures (IFs) health model. Source: (Hughes et al., 2011; Narayan & Donnenfeld, 2016).
Moldova has seen a substantial decline in infant mortality rates since the fall of the Soviet Union
in the 1990s. According to data from the UN Population Division, between 1990 and 2015,
Moldova's infant mortality rate fell from 30.1 per thousand live births to an estimated 13.5 per
thousand. Infant mortality rates are well below the average for other lower-middle income
countries in 2015 (38 per thousand live births).
To put these numbers into regional context, the average infant mortality rate across the UN
Eastern Europe sub-regional grouping (excluding Moldova) was around 6.9 in 2015, about half
the infant mortality rate in Moldova. Moldova's infant mortality rate of 13.5 in 2015 is higher
than any of its regional neighbors: Romania (8.2), Ukraine (8.1), Bulgaria (7.8), Russia (7.8),
Slovakia (5.5), Hungary (4.6), Poland (4.3), Belarus (3.3) and Czech Republic (2.4) (UN DESA,
2017).
Thus it would seem there remains room for improvement. Along the IFs Current Path forecast,
Moldova's infant mortality rate is forecast to continue declining from 13.5 in 2015 to around 10.8
by 2030. This represents a decline of around 20 percent across the forecast horizon and suggests
that Moldova will reach its nationalized SDG target of 10 per thousand live births shortly after
2030. In comparison, by 2030 the regional average is forecast to have fallen to 6 per thousand
live births. Even by 2030 Moldova will possibly still have the highest infant mortality rate in the
region.
Moldova’s disease burden is heavily tilted towards noncommunicable diseases. These represent a
category of disease that tends to progress more slowly and persist for long periods of time.
Rather than being passed through infectious agents, noncommunicable diseases are the product
of lifestyle, genetic, and environmental factors (Forouzanfar et al., 2016). They may be caused
by rapid urbanization, unhealthy lifestyles and lack of physical exercise, and population aging.
Rising noncommunicable burdens require the development of “horizontal” health systems
capable of providing general services and reducing prevailing health concerns rather than
“vertical” systems which focus on treatment of particular diseases (e.g. malaria treatment
strategies in Africa) (Elzinga, 2005; Narayan & Donnenfeld, 2016).
23
In 2015, noncommunicable diseases accounted for 10.2 deaths per 1,000; along the Current Path
by 2030 the noncommunicable death rate is forecast to rise to 12.4 deaths per 1,000. By contrast,
the 2015 death rate from communicable disease was 0.7 deaths per 1,000 and injuries accounted
for roughly 0.6 deaths per 1,000. The death rate from communicable disease is expected to
decrease to 0.5 per thousand by 2030 and injuries is forecast to remain around the same level
along the Current Path to 2030.
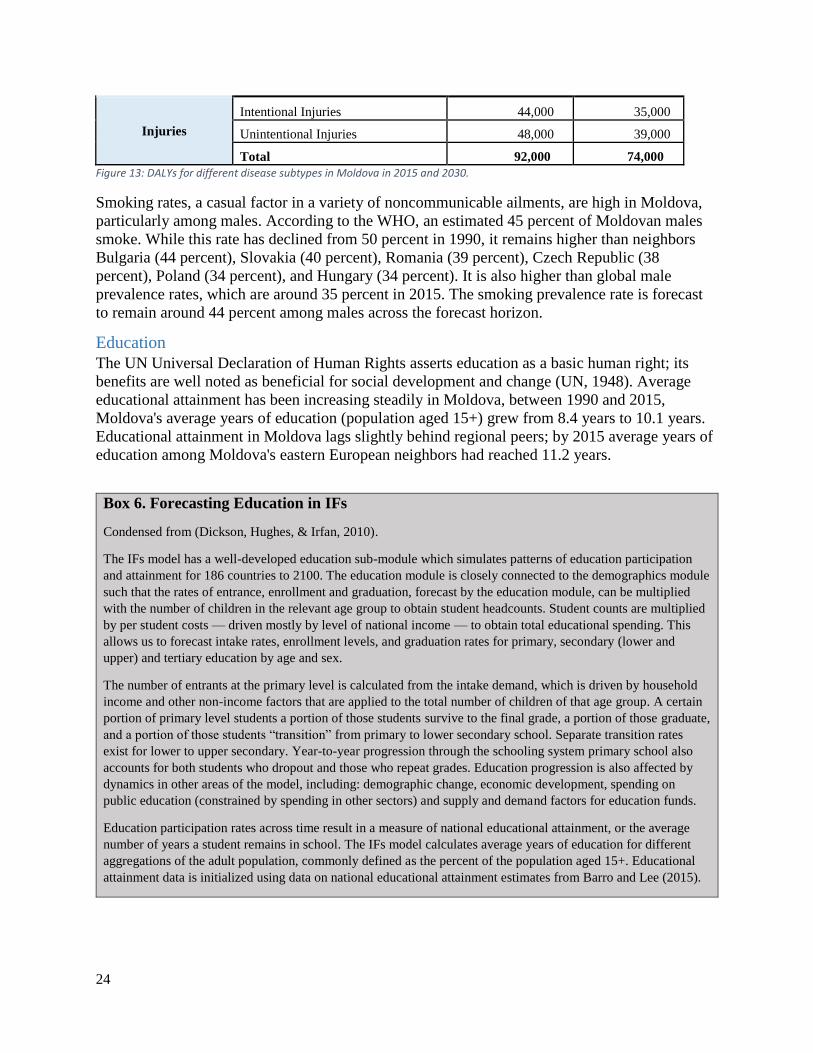
To provide a clearer picture of the forecasted disease burden in Moldova, Figure 13 depicts the
disability-adjusted life years (in millions) in 2015 and 2030 for each forecasted cause of death in
IFs. Disability-adjusted life years, or DALYs, are calculated as the sum of years of life lost to
premature death from disease or injury and years of life lost to disability or injury that renders a
person unable to work in a fully productive capacity. DALYs represent a population-wide
measure of a country’s disease burden; a perfectly healthy population would have zero DALYs.
Developed by the WHO Global Burden of Disease Project, they provide a quantifiable
measurement of health (both mortality and morbidity) that can be compared across countries and
time.
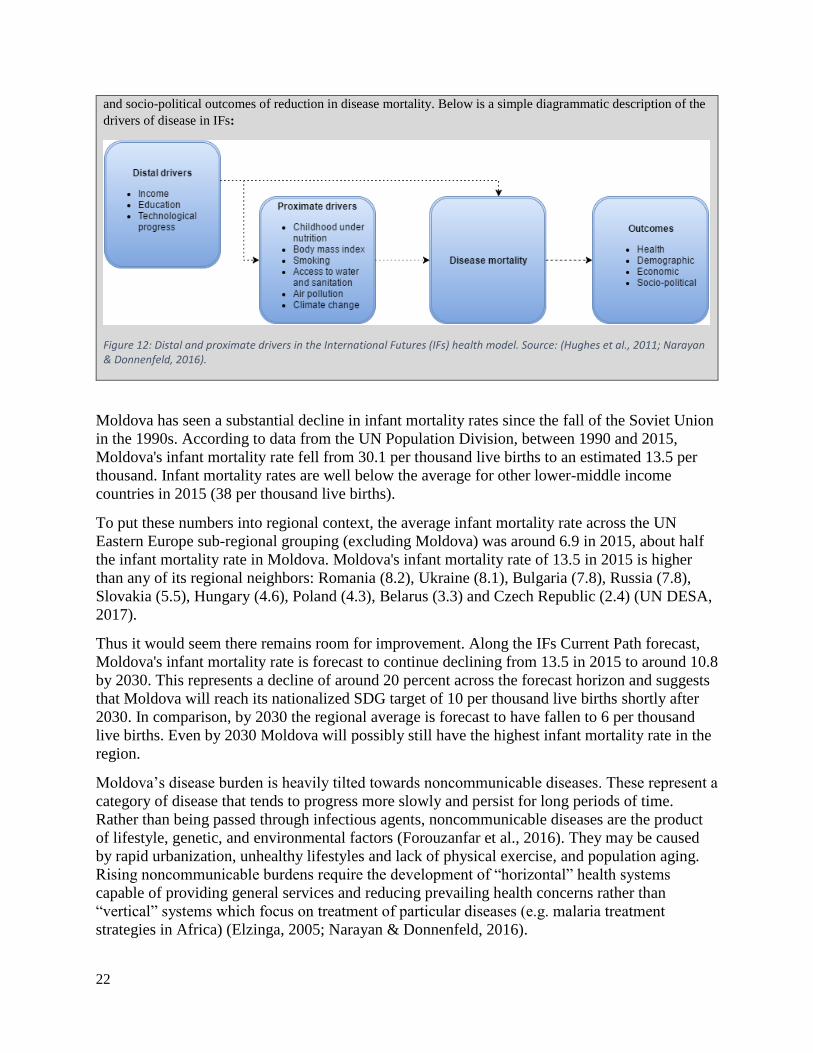
In 2015, noncommunicable disease accounted for approximately 83 percent of total DALYs in
Moldova, while communicable disease accounted for just over 11 percent. Among forecasted
noncommunicable diseases, cardiovascular disease is responsible for the highest level number of
DALYs (36 percent of noncommunicable DALYs), other noncommunicable diseases account for
17 percent of the communicable burden.12 In 2015 DALYs from HIV/AIDS accounted for
approximately 41 percent of DALYs from communicable disease, but less than 5 percent of total
DALYs. Moldova’s health outcomes are forecasted to improve across the horizon and overall
DALYs will decline (see table). Even with forecasted improvements, noncommunicable disease
will play a significant role. By 2030, morbidity from noncommunicable diseases could account
for 87 percent of DALYs in Moldova.
Total DALYS (Thousands of Years)
2015 2030
Communicable
Disease
HIV/AIDS 73,000 52,000
Diarrhea 500 300
Malaria - -
Respiratory Infections 40,000 26,000
Other Communicable Diseases 63,000 34,000
Total 176,500 112,300
NonCommunicable
Disease
Cancer 170,000 178,000
Cardiovascular disease 470,000 510,000
Diabetes 30,000 32,000
Digestive Diseases 163,000 168,000
Respiratory Disease 35,000 41,000
MentalHealth 160,000 149,000
Other Noncommunicable Diseases 277,000 222,000
Total 1,305,000 1,300,000
24
Injuries
Intentional Injuries 44,000 35,000
Unintentional Injuries 48,000 39,000
Total 92,000 74,000
Figure 13: DALYs for different disease subtypes in Moldova in 2015 and 2030.
Smoking rates, a casual factor in a variety of noncommunicable ailments, are high in Moldova,
particularly among males. According to the WHO, an estimated 45 percent of Moldovan males
smoke. While this rate has declined from 50 percent in 1990, it remains higher than neighbors
Bulgaria (44 percent), Slovakia (40 percent), Romania (39 percent), Czech Republic (38
percent), Poland (34 percent), and Hungary (34 percent). It is also higher than global male
prevalence rates, which are around 35 percent in 2015. The smoking prevalence rate is forecast
to remain around 44 percent among males across the forecast horizon.
Education
The UN Universal Declaration of Human Rights asserts education as a basic human right; its
benefits are well noted as beneficial for social development and change (UN, 1948). Average
educational attainment has been increasing steadily in Moldova, between 1990 and 2015,
Moldova's average years of education (population aged 15+) grew from 8.4 years to 10.1 years.
Educational attainment in Moldova lags slightly behind regional peers; by 2015 average years of
education among Moldova's eastern European neighbors had reached 11.2 years.
Box 6. Forecasting Education in IFs
Condensed from (Dickson, Hughes, & Irfan, 2010).
The IFs model has a well-developed education sub-module which simulates patterns of education participation
and attainment for 186 countries to 2100. The education module is closely connected to the demographics module
such that the rates of entrance, enrollment and graduation, forecast by the education module, can be multiplied
with the number of children in the relevant age group to obtain student headcounts. Student counts are multiplied
by per student costs — driven mostly by level of national income — to obtain total educational spending. This
allows us to forecast intake rates, enrollment levels, and graduation rates for primary, secondary (lower and
upper) and tertiary education by age and sex.
The number of entrants at the primary level is calculated from the intake demand, which is driven by household
income and other non-income factors that are applied to the total number of children of that age group. A certain
portion of primary level students a portion of those students survive to the final grade, a portion of those graduate,
and a portion of those students “transition” from primary to lower secondary school. Separate transition rates
exist for lower to upper secondary. Year-to-year progression through the schooling system primary school also
accounts for both students who dropout and those who repeat grades. Education progression is also affected by
dynamics in other areas of the model, including: demographic change, economic development, spending on
public education (constrained by spending in other sectors) and supply and demand factors for education funds.
Education participation rates across time result in a measure of national educational attainment, or the average
number of years a student remains in school. The IFs model calculates average years of education for different
aggregations of the adult population, commonly defined as the percent of the population aged 15+. Educational
attainment data is initialized using data on national educational attainment estimates from Barro and Lee (2015).

25
Education is a slow-moving system; it takes years to enroll and move children through the school
system in order to grow the national stock of education. Along its Current Path, IFs forecasts
average education to reach 10.3 years in 2030.
Increasing educational attainment across the population requires interventions to expand access
and encourage children to remain in school. In IFs, the education system is modeled as a
pipeline, where students flow sequentially through each level of education from primary to
tertiary. This pipeline is useful for identifying potential bottlenecks in the system.
From the table below, it appears that close to 90 percent of primary school students entering
grade one survive to the final grade at the primary level. Moldova is forecast to reach 100
percent primary school survival by 2030. Moreover, along its Current Path it appears Moldova
will achieve a lower secondary graduation rate of 93 percent by 2030, thus remaining on track to
reach its nationalized target of 90 percent graduation by 2030.
The education table however does reveal that Moldova experiences a bottleneck at the upper
secondary level. In 2015, total enrollment was estimated at 85 percent, but only 41 percent of
students that enrolled in upper secondary school graduated. The graduation rate is higher among
females (47 percent) relative to males (36 percent). This bottleneck looks even more pronounced
when compared against upper secondary graduation rates in the region: 75 percent for males and
74 percent for females. There also appear to be challenges at the tertiary level; enrollment in
2016 was around 41 percent, but only 33 percent of those students graduated. By contrast,
tertiary graduation rates in the region were around 50 percent in 2015 (43 percent of males and
58 percent of females). These bottlenecks at the upper secondary and tertiary levels are forecast
to persist across the forecast horizon.
Primary
Enrollment
Primary
Completion
Rate
Lower
Secondary
Enrollment
Lower
Secondary
Graduation
Upper
Secondary
Enrollment
Upper
Secondary
Graduation
Tertiary
Enrollment
Tertiary
Graduation
2015
Moldova
Male 92.9 99.8 86.9 87.2 83.2 35.8 35.3 27.2
Moldova
Female 91.9 99.8 86.7 86 86 47.1 47.4 39.7
Moldova
Total 92.4 99.8 86.8 86.6 84.6 41.4 41.2 33.4
2030
Moldova
Male 100.7 100.0 97.1 94.3 82.4 52 41.5 34.6
Moldova
Female 100.4 100.0 96.7 93.9 87.2 60.3 55.4 45.4
Moldova
Total 100.6 100.0 97 94.1 84.7 56 48.3 39.8
Figure 14: Education enrolment, survival, and graduation rates for primary, lower secondary, upper secondary, and tertiary education levels in Moldova in 2015 and 2030. Source: Data from Barro-Lee and UIS, forecast from IFS v7.31. Note: enrollment rates can exceed 100 percent because this is a gross enrollment rate, which accounts for students of all ages entering a given level of education divided by the number of age-appropriate children.
Moldova’s 2015 Scorecard and 2030 Current Path
Table 15 below lays out Moldova’s 2015 scores along select SDG indicators and 2030 values
along the Current Path. It is designed to provide an overview of Moldova’s progress to date at

26
and establish progress towards meeting the SDGs. Many of these Current Path indicators helped
to inform the construction of the scenarios used in this report.
Description
Most Recent Data or
Estimate
Current Path 2030
Goal 1. End poverty in all its forms everywhere
Percentage of population below $3.10 (2011$ PPP) per day; Lognormal 1.1 0.4
Percent of the population living on less than $4.13 (2011 USD) per day 4.6 1.7
Percent of the population living on less than $5.73 (2011 USD) per day 15.6 7.3
Proportion of population living below the national poverty line; by sex and age; Rural 18.8
Proportion of population living below the national poverty line; by sex and age; Urban 8.2
Proportion of population living below the national poverty line; by sex and age; Total 11.4
Goal 2. End hunger, achieve food security and improved nutrition and promote sustainable agriculture
Percentage of undernourished population 1.5 1.3
Proportion of the rural population that has experienced moderate or severe food insecurity in the last year as measured on the Food Insecurity Experience Scale 12.7
Proportion of the urban population that has experienced moderate or severe food insecurity in the last year as measured on the Food Insecurity Experience Scale 11.9
Proportion of the population that has experienced moderate or severe food insecurity in the last year as measured on the Food Insecurity Experience Scale 12.5
Percentage of malnutrition (weight for height <-2 SD) among children under 5 2.2 2.2
Severe Acute Malnutrition (weight for height <-3 SD) among children under 5 0.5 0.5
Goal 3. Ensure healthy lives and promote well-being for all at all ages
Infant mortality rate in deaths per thousand newborns 13.5 10.8
Cardiovascular disease death rate per thousand 6.7 8.2
Smoking Rate - Total 24.3 24.9
Goal 4. Ensure inclusive and equitable quality education and promote lifelong learning opportunities for all
Primary education net enrollment rate - Total 91.0 99.9
Primary education gross enrollment rate - Total 92.4 100.6
Primary education gross completion rate - Total 99.8 105.9
Lower secondary education gross enrollment rate - Total 86.8 96.9

27
Lower secondary education graduation rate - Total 86.6 94.1
Upper secondary education gross enrollment rate - Total 84.6 84.7
Upper secondary education graduation rate - Total 41.4 56.0
Vocation as % of enrollment in all programs for upper secondary education - Total 43.5 43.7
Goal 5. Achieve gender equality and empower all women and girls
Percentage of ever-partnered women and girls aged 15-19 years who have experienced physical; sexual or psychological violence by a current or former intimate partner; in the previous 12 months 14.6
Proportion of women aged 20-24 years who were married or in a union before age 18 12.2
Percentage of seats held by women in national parliaments 20.8
Goal 6. Ensure availability and sustainable management of water and sanitation for all
Percentage of people with access to safe water 88.4 91.8
Percentage of people with access to sanitation services - Improved 76.4 81.4
Goal 7. Ensure access to affordable, reliable, sustainable and modern energy for all
Percentage of population with access to electricity - Total 100.0 100.0
Renewable energy as percentage of total final energy consumption 1.1 1.2
Goal 8. Promote sustained, inclusive and sustainable economic growth, full and productive employment and decent work for all
Annual growth rate of real GDP per capita 0.1 3.6
Percentage of the total labor force that is 15 years old and over and unemployed 4.9
Percentage of the total labor force that is 15 to 24 years old and unemployed 12.8
Proportion of youth not in education; employment or training (NEET); as a percentage of the total youth population 27.8
Goal 9. Build resilient infrastructure, promote inclusive and sustainable industrialization and foster innovation
Percentage of rural people living within two km of an all weather road 73.9 78.6
Connections per hundred people to fixed broadband technology 15.2 34.8
Goal 10. Reduce inequality within and among countries
Growth rates of household expenditure or income per capita among the bottom 40 per cent of the population 4.8
Goal 15. Protect, restore and promote sustainable use of terrestrial ecosystems, sustainably manage forests, combat desertification, and halt and reverse land degradation and halt biodiversity loss
Proportion of important sites for freshwater biodiversity that are covered by protected areas 10.8
Proportion of important sites for terrestrial biodiversity that are covered by protected areas 23.6
28
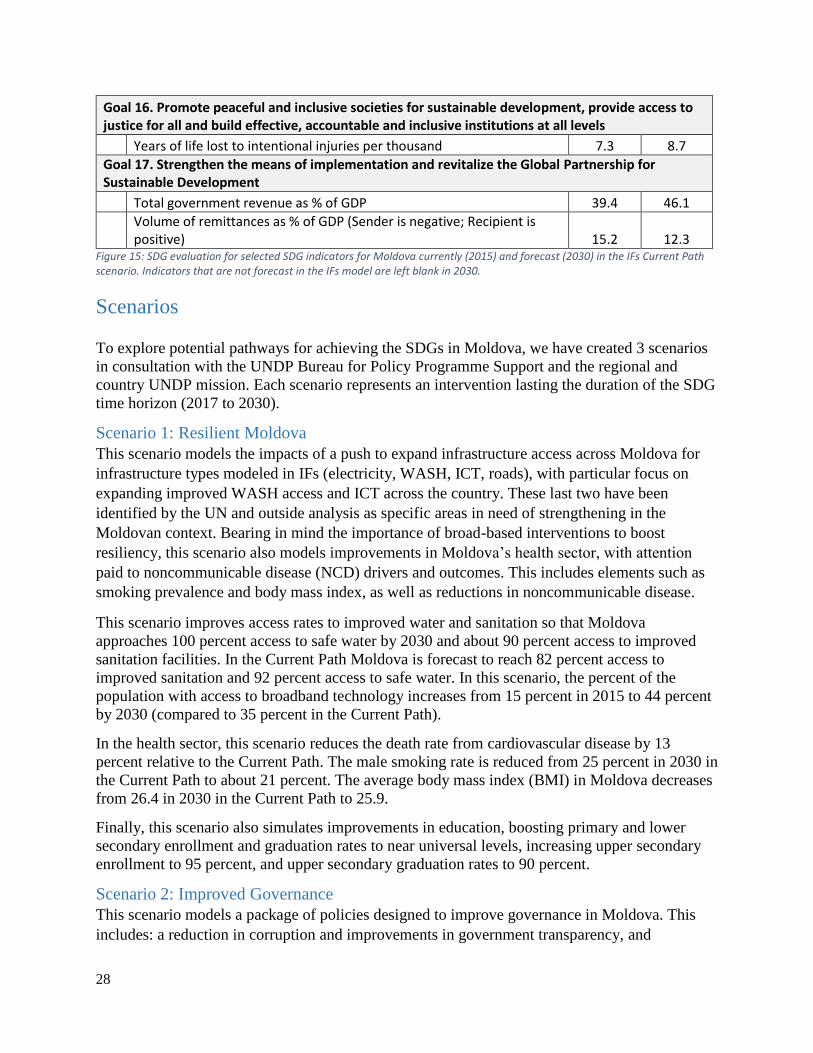
Goal 16. Promote peaceful and inclusive societies for sustainable development, provide access to justice for all and build effective, accountable and inclusive institutions at all levels
Years of life lost to intentional injuries per thousand 7.3 8.7
Goal 17. Strengthen the means of implementation and revitalize the Global Partnership for Sustainable Development
Total government revenue as % of GDP 39.4 46.1
Volume of remittances as % of GDP (Sender is negative; Recipient is positive) 15.2 12.3
Figure 15: SDG evaluation for selected SDG indicators for Moldova currently (2015) and forecast (2030) in the IFs Current Path scenario. Indicators that are not forecast in the IFs model are left blank in 2030.
Scenarios
To explore potential pathways for achieving the SDGs in Moldova, we have created 3 scenarios
in consultation with the UNDP Bureau for Policy Programme Support and the regional and
country UNDP mission. Each scenario represents an intervention lasting the duration of the SDG
time horizon (2017 to 2030).
Scenario 1: Resilient Moldova
This scenario models the impacts of a push to expand infrastructure access across Moldova for
infrastructure types modeled in IFs (electricity, WASH, ICT, roads), with particular focus on
expanding improved WASH access and ICT across the country. These last two have been
identified by the UN and outside analysis as specific areas in need of strengthening in the
Moldovan context. Bearing in mind the importance of broad-based interventions to boost
resiliency, this scenario also models improvements in Moldova’s health sector, with attention
paid to noncommunicable disease (NCD) drivers and outcomes. This includes elements such as
smoking prevalence and body mass index, as well as reductions in noncommunicable disease.
This scenario improves access rates to improved water and sanitation so that Moldova
approaches 100 percent access to safe water by 2030 and about 90 percent access to improved
sanitation facilities. In the Current Path Moldova is forecast to reach 82 percent access to
improved sanitation and 92 percent access to safe water. In this scenario, the percent of the
population with access to broadband technology increases from 15 percent in 2015 to 44 percent
by 2030 (compared to 35 percent in the Current Path).
In the health sector, this scenario reduces the death rate from cardiovascular disease by 13
percent relative to the Current Path. The male smoking rate is reduced from 25 percent in 2030 in
the Current Path to about 21 percent. The average body mass index (BMI) in Moldova decreases
from 26.4 in 2030 in the Current Path to 25.9.
Finally, this scenario also simulates improvements in education, boosting primary and lower
secondary enrollment and graduation rates to near universal levels, increasing upper secondary
enrollment to 95 percent, and upper secondary graduation rates to 90 percent.
Scenario 2: Improved Governance
This scenario models a package of policies designed to improve governance in Moldova. This
includes: a reduction in corruption and improvements in government transparency, and
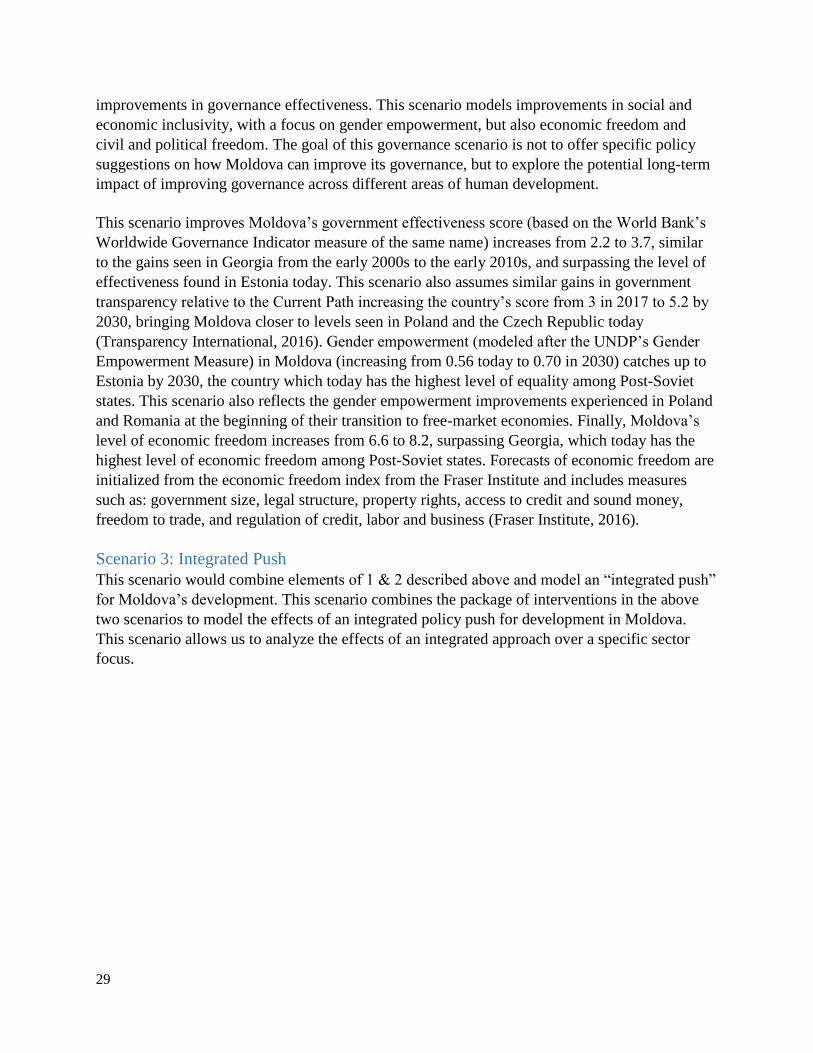
29
improvements in governance effectiveness. This scenario models improvements in social and
economic inclusivity, with a focus on gender empowerment, but also economic freedom and
civil and political freedom. The goal of this governance scenario is not to offer specific policy
suggestions on how Moldova can improve its governance, but to explore the potential long-term
impact of improving governance across different areas of human development.
This scenario improves Moldova’s government effectiveness score (based on the World Bank’s
Worldwide Governance Indicator measure of the same name) increases from 2.2 to 3.7, similar
to the gains seen in Georgia from the early 2000s to the early 2010s, and surpassing the level of
effectiveness found in Estonia today. This scenario also assumes similar gains in government
transparency relative to the Current Path increasing the country’s score from 3 in 2017 to 5.2 by
2030, bringing Moldova closer to levels seen in Poland and the Czech Republic today
(Transparency International, 2016). Gender empowerment (modeled after the UNDP’s Gender
Empowerment Measure) in Moldova (increasing from 0.56 today to 0.70 in 2030) catches up to
Estonia by 2030, the country which today has the highest level of equality among Post-Soviet
states. This scenario also reflects the gender empowerment improvements experienced in Poland
and Romania at the beginning of their transition to free-market economies. Finally, Moldova’s
level of economic freedom increases from 6.6 to 8.2, surpassing Georgia, which today has the
highest level of economic freedom among Post-Soviet states. Forecasts of economic freedom are
initialized from the economic freedom index from the Fraser Institute and includes measures
such as: government size, legal structure, property rights, access to credit and sound money,
freedom to trade, and regulation of credit, labor and business (Fraser Institute, 2016).
Scenario 3: Integrated Push
This scenario would combine elements of 1 & 2 described above and model an “integrated push”
for Moldova’s development. This scenario combines the package of interventions in the above
two scenarios to model the effects of an integrated policy push for development in Moldova.
This scenario allows us to analyze the effects of an integrated approach over a specific sector
focus.
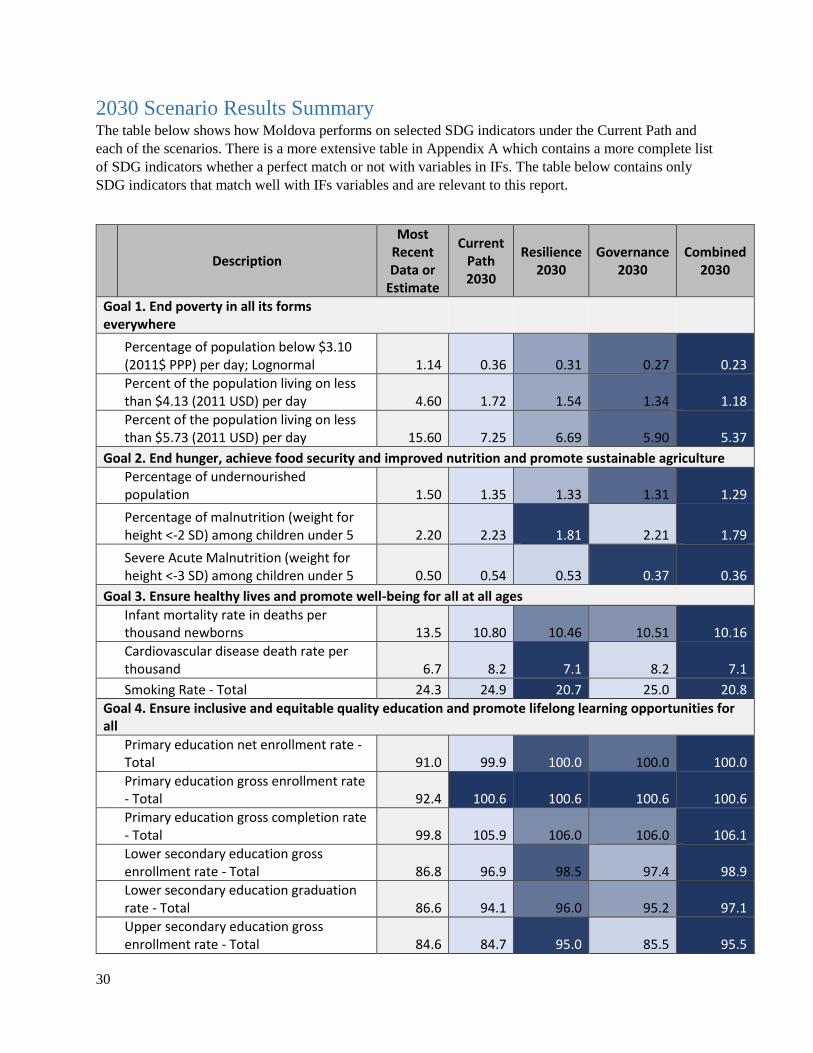
30
2030 Scenario Results Summary The table below shows how Moldova performs on selected SDG indicators under the Current Path and
each of the scenarios. There is a more extensive table in Appendix A which contains a more complete list
of SDG indicators whether a perfect match or not with variables in IFs. The table below contains only
SDG indicators that match well with IFs variables and are relevant to this report.
Description
Most Recent Data or
Estimate
Current Path 2030
Resilience 2030
Governance 2030
Combined 2030
Goal 1. End poverty in all its forms everywhere
Percentage of population below $3.10 (2011$ PPP) per day; Lognormal 1.14 0.36 0.31 0.27 0.23
Percent of the population living on less than $4.13 (2011 USD) per day 4.60 1.72 1.54 1.34 1.18
Percent of the population living on less than $5.73 (2011 USD) per day 15.60 7.25 6.69 5.90 5.37
Goal 2. End hunger, achieve food security and improved nutrition and promote sustainable agriculture
Percentage of undernourished population 1.50 1.35 1.33 1.31 1.29
Percentage of malnutrition (weight for height <-2 SD) among children under 5 2.20 2.23 1.81 2.21 1.79
Severe Acute Malnutrition (weight for height <-3 SD) among children under 5 0.50 0.54 0.53 0.37 0.36
Goal 3. Ensure healthy lives and promote well-being for all at all ages
Infant mortality rate in deaths per thousand newborns 13.5 10.80 10.46 10.51 10.16
Cardiovascular disease death rate per thousand 6.7 8.2 7.1 8.2 7.1
Smoking Rate - Total 24.3 24.9 20.7 25.0 20.8
Goal 4. Ensure inclusive and equitable quality education and promote lifelong learning opportunities for all
Primary education net enrollment rate - Total 91.0 99.9 100.0 100.0 100.0
Primary education gross enrollment rate - Total 92.4 100.6 100.6 100.6 100.6
Primary education gross completion rate - Total 99.8 105.9 106.0 106.0 106.1
Lower secondary education gross enrollment rate - Total 86.8 96.9 98.5 97.4 98.9
Lower secondary education graduation rate - Total 86.6 94.1 96.0 95.2 97.1
Upper secondary education gross enrollment rate - Total 84.6 84.7 95.0 85.5 95.5
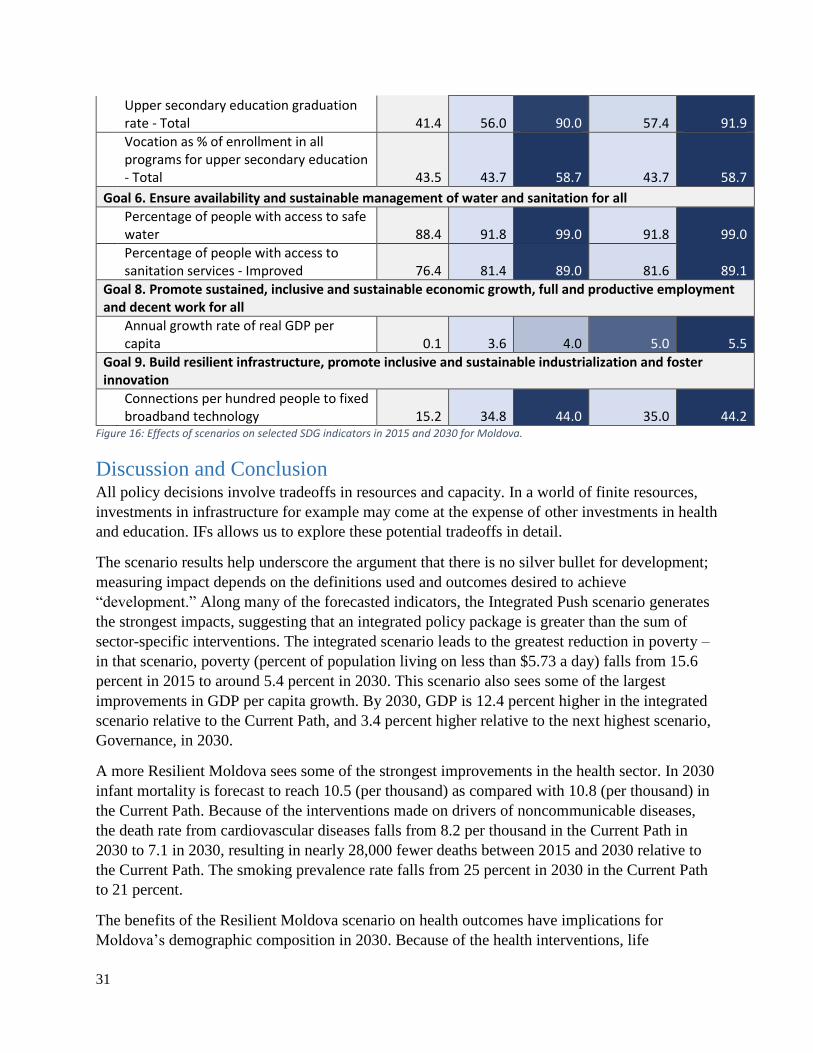
31
Upper secondary education graduation rate - Total 41.4 56.0 90.0 57.4 91.9
Vocation as % of enrollment in all programs for upper secondary education - Total 43.5 43.7 58.7 43.7 58.7
Goal 6. Ensure availability and sustainable management of water and sanitation for all
Percentage of people with access to safe water 88.4 91.8 99.0 91.8 99.0
Percentage of people with access to sanitation services - Improved 76.4 81.4 89.0 81.6 89.1
Goal 8. Promote sustained, inclusive and sustainable economic growth, full and productive employment and decent work for all
Annual growth rate of real GDP per capita 0.1 3.6 4.0 5.0 5.5
Goal 9. Build resilient infrastructure, promote inclusive and sustainable industrialization and foster innovation
Connections per hundred people to fixed broadband technology 15.2 34.8 44.0 35.0 44.2
Figure 16: Effects of scenarios on selected SDG indicators in 2015 and 2030 for Moldova.
Discussion and Conclusion All policy decisions involve tradeoffs in resources and capacity. In a world of finite resources,
investments in infrastructure for example may come at the expense of other investments in health
and education. IFs allows us to explore these potential tradeoffs in detail.
The scenario results help underscore the argument that there is no silver bullet for development;
measuring impact depends on the definitions used and outcomes desired to achieve
“development.” Along many of the forecasted indicators, the Integrated Push scenario generates
the strongest impacts, suggesting that an integrated policy package is greater than the sum of
sector-specific interventions. The integrated scenario leads to the greatest reduction in poverty –
in that scenario, poverty (percent of population living on less than $5.73 a day) falls from 15.6
percent in 2015 to around 5.4 percent in 2030. This scenario also sees some of the largest
improvements in GDP per capita growth. By 2030, GDP is 12.4 percent higher in the integrated
scenario relative to the Current Path, and 3.4 percent higher relative to the next highest scenario,
Governance, in 2030.
A more Resilient Moldova sees some of the strongest improvements in the health sector. In 2030
infant mortality is forecast to reach 10.5 (per thousand) as compared with 10.8 (per thousand) in
the Current Path. Because of the interventions made on drivers of noncommunicable diseases,
the death rate from cardiovascular diseases falls from 8.2 per thousand in the Current Path in
2030 to 7.1 in 2030, resulting in nearly 28,000 fewer deaths between 2015 and 2030 relative to
the Current Path. The smoking prevalence rate falls from 25 percent in 2030 in the Current Path
to 21 percent.
The benefits of the Resilient Moldova scenario on health outcomes have implications for
Moldova’s demographic composition in 2030. Because of the health interventions, life
32
expectancy increases from 73.3 in 2030 in the Current Path to 74.4 in Resilient Moldova. This
leads to an increase in the elderly population relative to the Current Path – from 660,000 in 2030
to over 680,000 in the Resilient scenario. That also translates into an increase in the portion of
government consumption dedicated to pensions relative to the Current Path.
The Improved Governance scenario leads to the greatest increase in GDP and GDP per capita by
2030, stimulated by interventions designed to improve governance effectiveness, reduce
corruption, and create a more transparent, and open economic environment. The Governance
scenario generates stronger returns to growth and productivity for two main reasons. First,
corruption and governance issues are some of Moldova’s most pressing roadblocks towards a
more inclusive and sustainable future. Secondly, improvements in governance translate to more
immediate impacts on growth than similar interventions explored under the Resilience scenario.
Whereas infrastructure, health and education interventions take time to mature and impact
productivity, the effects of reducing corruption, increasing transparency, and leveling the
economic playing field translate quickly into economic benefits. The scenario results support
these arguments. Under Improved Governance, by 2030 Moldovan GDP per capita (PPP)
reaches an estimated 7.4 thousand USD, as compared with 7 thousand in the Current Path. By
contrast, GDP per capita reaches only 7.1 thousand USD by 2030 under the Resilience scenario.
Moldova’s GDP is close to 5.8 percent larger in 2030 under Improved Governance reaching an
estimated 27.5 billion dollars.
This report has sought to unpack trends in Moldova’s development and policy tradeoffs in the
context of progress towards the SDGs. It is also important to acknowledge the limitations of the
IFs modeling effort and suggest areas of further potential research, particularly with respect to
Moldova’s demographic trends, which remain foundational to Moldova’s development
trajectory. Due to modeling limitations, we have not constructed scenarios around the possible
futures of migration and remittances in Moldova. Given the integrated nature of IFs,
demographic trends are implicitly tied into the scenario results discussed above. In the absence
of specific demographic scenarios, we want to highlight several important trends. Moldova’s
recent period of consumption-fueled GDP growth helped by remittances is not sustainable, as
emigration levels have been declining and are forecast to fall below the high levels seen in the
early 2000s. There may indeed be policies the Moldovan government can institute to continue to
attract remittances, but those policies are unlikely to compensate for declining emigration. It is
also important to highlight that emigration, coupled with declining fertility rates means
Moldova’s population will age out to 2030. Its current demographic dividend will decline and
the labor force is forecast to shrink by some 170,000 individuals between 2015 and 2030.
Moldova also has one of the lowest labor force participation rates in the world, one that has been
declining since independence in the early 1990s. Policies to stimulate labor force participation
would have significant impacts on economic growth and productivity.
Achievement of Moldovan SDGs targets will be shaped by policy choices made today. In many
sectors like infrastructure, health and education, Moldova outperforms its lower-middle income
peers. The current development context is facing headwinds in the form of structural
33
demographic and governance trends. This report has highlighted areas for intervention in
Moldova and the tradeoffs associated in order to help Moldova achieve the SDGs.
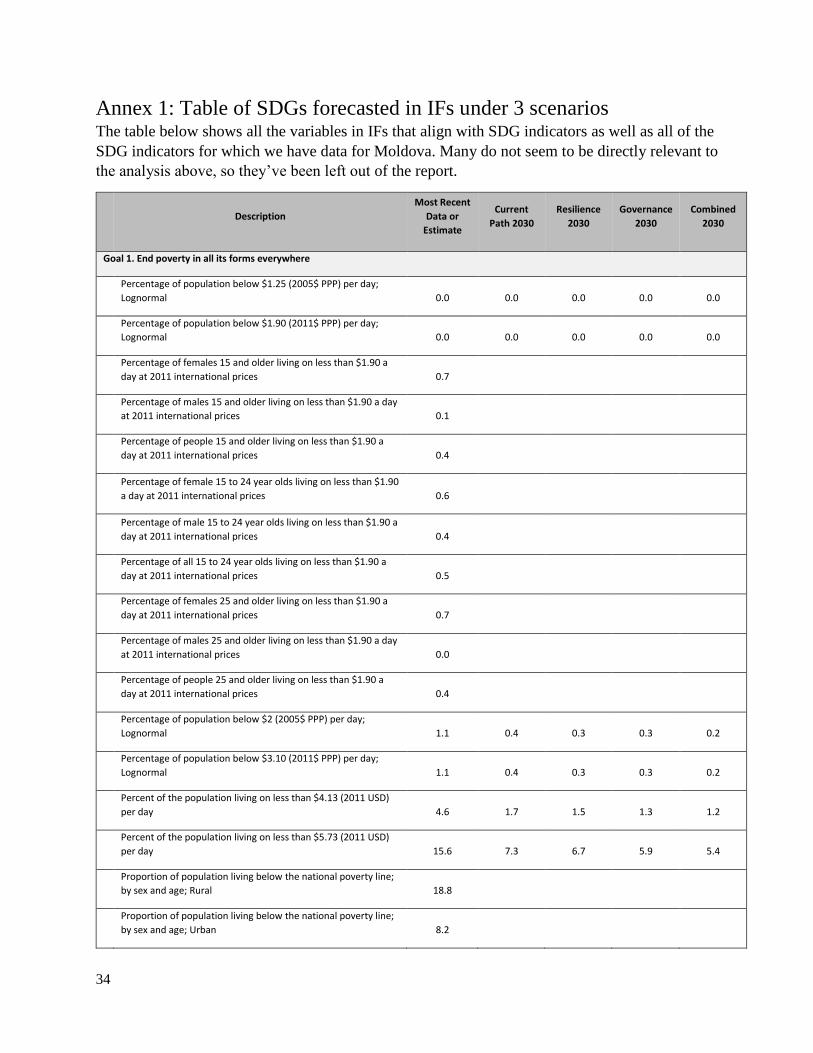
34
Annex 1: Table of SDGs forecasted in IFs under 3 scenarios The table below shows all the variables in IFs that align with SDG indicators as well as all of the
SDG indicators for which we have data for Moldova. Many do not seem to be directly relevant to
the analysis above, so they’ve been left out of the report.
Description
Most Recent
Data or
Estimate
Current
Path 2030
Resilience
2030
Governance
2030
Combined
2030
Goal 1. End poverty in all its forms everywhere
Percentage of population below $1.25 (2005$ PPP) per day;
Lognormal 0.0 0.0 0.0 0.0 0.0
Percentage of population below $1.90 (2011$ PPP) per day;
Lognormal 0.0 0.0 0.0 0.0 0.0
Percentage of females 15 and older living on less than $1.90 a
day at 2011 international prices 0.7
Percentage of males 15 and older living on less than $1.90 a day
at 2011 international prices 0.1
Percentage of people 15 and older living on less than $1.90 a
day at 2011 international prices 0.4
Percentage of female 15 to 24 year olds living on less than $1.90
a day at 2011 international prices 0.6
Percentage of male 15 to 24 year olds living on less than $1.90 a
day at 2011 international prices 0.4
Percentage of all 15 to 24 year olds living on less than $1.90 a
day at 2011 international prices 0.5
Percentage of females 25 and older living on less than $1.90 a
day at 2011 international prices 0.7
Percentage of males 25 and older living on less than $1.90 a day
at 2011 international prices 0.0
Percentage of people 25 and older living on less than $1.90 a
day at 2011 international prices 0.4
Percentage of population below $2 (2005$ PPP) per day;
Lognormal 1.1 0.4 0.3 0.3 0.2
Percentage of population below $3.10 (2011$ PPP) per day;
Lognormal 1.1 0.4 0.3 0.3 0.2
Percent of the population living on less than $4.13 (2011 USD)
per day 4.6 1.7 1.5 1.3 1.2
Percent of the population living on less than $5.73 (2011 USD)
per day 15.6 7.3 6.7 5.9 5.4
Proportion of population living below the national poverty line;
by sex and age; Rural 18.8
Proportion of population living below the national poverty line;
by sex and age; Urban 8.2
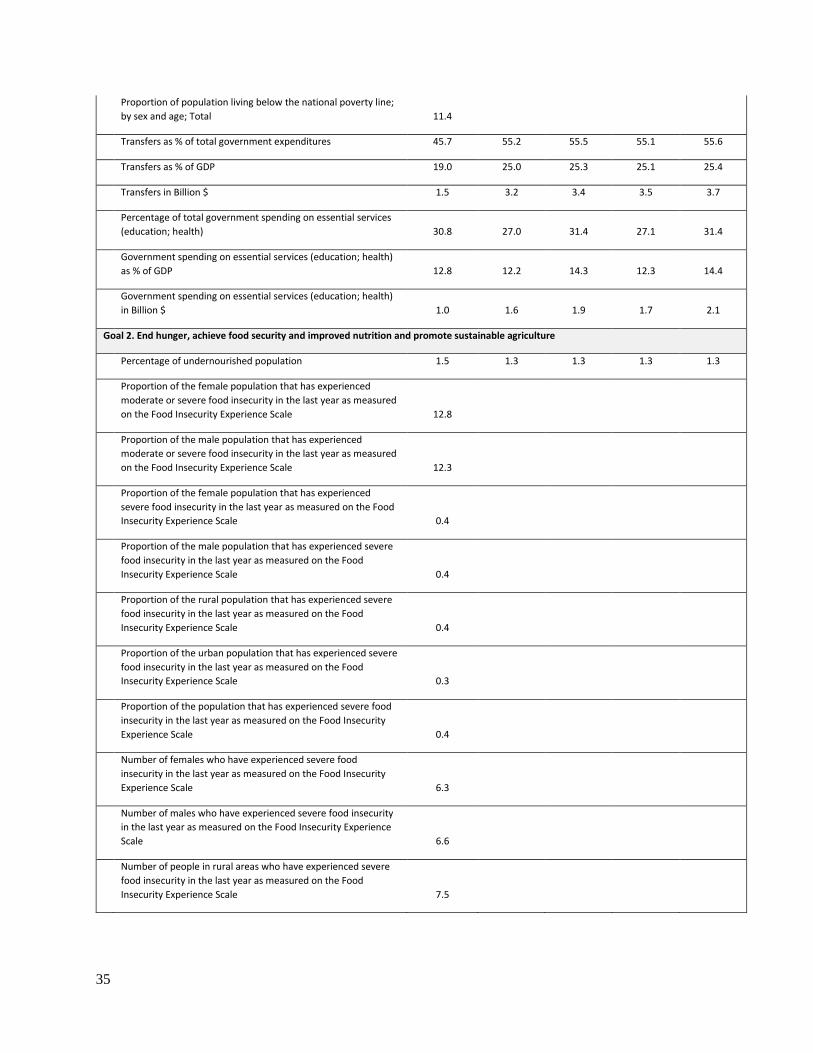
35
Proportion of population living below the national poverty line;
by sex and age; Total 11.4
Transfers as % of total government expenditures 45.7 55.2 55.5 55.1 55.6
Transfers as % of GDP 19.0 25.0 25.3 25.1 25.4
Transfers in Billion $ 1.5 3.2 3.4 3.5 3.7
Percentage of total government spending on essential services
(education; health) 30.8 27.0 31.4 27.1 31.4
Government spending on essential services (education; health)
as % of GDP 12.8 12.2 14.3 12.3 14.4
Government spending on essential services (education; health)
in Billion $ 1.0 1.6 1.9 1.7 2.1
Goal 2. End hunger, achieve food security and improved nutrition and promote sustainable agriculture
Percentage of undernourished population 1.5 1.3 1.3 1.3 1.3
Proportion of the female population that has experienced
moderate or severe food insecurity in the last year as measured
on the Food Insecurity Experience Scale 12.8
Proportion of the male population that has experienced
moderate or severe food insecurity in the last year as measured
on the Food Insecurity Experience Scale 12.3
Proportion of the female population that has experienced
severe food insecurity in the last year as measured on the Food
Insecurity Experience Scale 0.4
Proportion of the male population that has experienced severe
food insecurity in the last year as measured on the Food
Insecurity Experience Scale 0.4
Proportion of the rural population that has experienced severe
food insecurity in the last year as measured on the Food
Insecurity Experience Scale 0.4
Proportion of the urban population that has experienced severe
food insecurity in the last year as measured on the Food
Insecurity Experience Scale 0.3
Proportion of the population that has experienced severe food
insecurity in the last year as measured on the Food Insecurity
Experience Scale 0.4
Number of females who have experienced severe food
insecurity in the last year as measured on the Food Insecurity
Experience Scale 6.3
Number of males who have experienced severe food insecurity
in the last year as measured on the Food Insecurity Experience
Scale 6.6
Number of people in rural areas who have experienced severe
food insecurity in the last year as measured on the Food
Insecurity Experience Scale 7.5
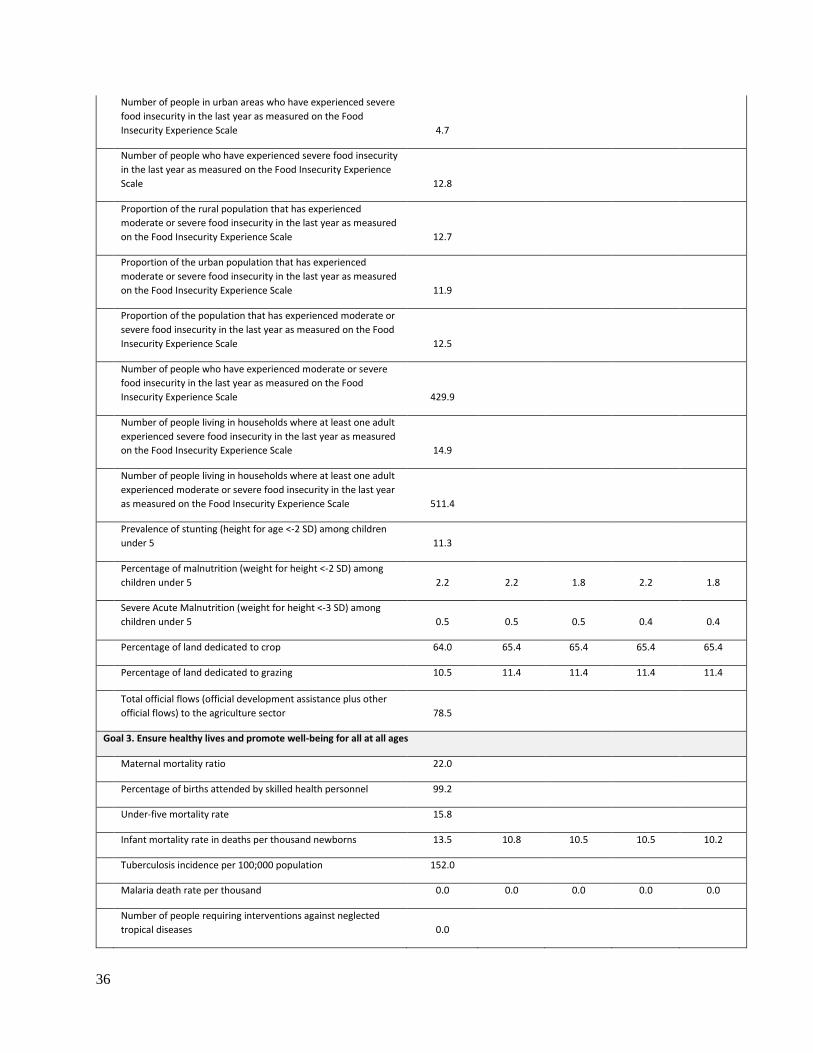
36
Number of people in urban areas who have experienced severe
food insecurity in the last year as measured on the Food
Insecurity Experience Scale 4.7
Number of people who have experienced severe food insecurity
in the last year as measured on the Food Insecurity Experience
Scale 12.8
Proportion of the rural population that has experienced
moderate or severe food insecurity in the last year as measured
on the Food Insecurity Experience Scale 12.7
Proportion of the urban population that has experienced
moderate or severe food insecurity in the last year as measured
on the Food Insecurity Experience Scale 11.9
Proportion of the population that has experienced moderate or
severe food insecurity in the last year as measured on the Food
Insecurity Experience Scale 12.5
Number of people who have experienced moderate or severe
food insecurity in the last year as measured on the Food
Insecurity Experience Scale 429.9
Number of people living in households where at least one adult
experienced severe food insecurity in the last year as measured
on the Food Insecurity Experience Scale 14.9
Number of people living in households where at least one adult
experienced moderate or severe food insecurity in the last year
as measured on the Food Insecurity Experience Scale 511.4
Prevalence of stunting (height for age <-2 SD) among children
under 5 11.3
Percentage of malnutrition (weight for height <-2 SD) among
children under 5 2.2 2.2 1.8 2.2 1.8
Severe Acute Malnutrition (weight for height <-3 SD) among
children under 5 0.5 0.5 0.5 0.4 0.4
Percentage of land dedicated to crop 64.0 65.4 65.4 65.4 65.4
Percentage of land dedicated to grazing 10.5 11.4 11.4 11.4 11.4
Total official flows (official development assistance plus other
official flows) to the agriculture sector 78.5
Goal 3. Ensure healthy lives and promote well-being for all at all ages
Maternal mortality ratio 22.0
Percentage of births attended by skilled health personnel 99.2
Under-five mortality rate 15.8
Infant mortality rate in deaths per thousand newborns 13.5 10.8 10.5 10.5 10.2
Tuberculosis incidence per 100;000 population 152.0
Malaria death rate per thousand 0.0 0.0 0.0 0.0 0.0
Number of people requiring interventions against neglected
tropical diseases 0.0
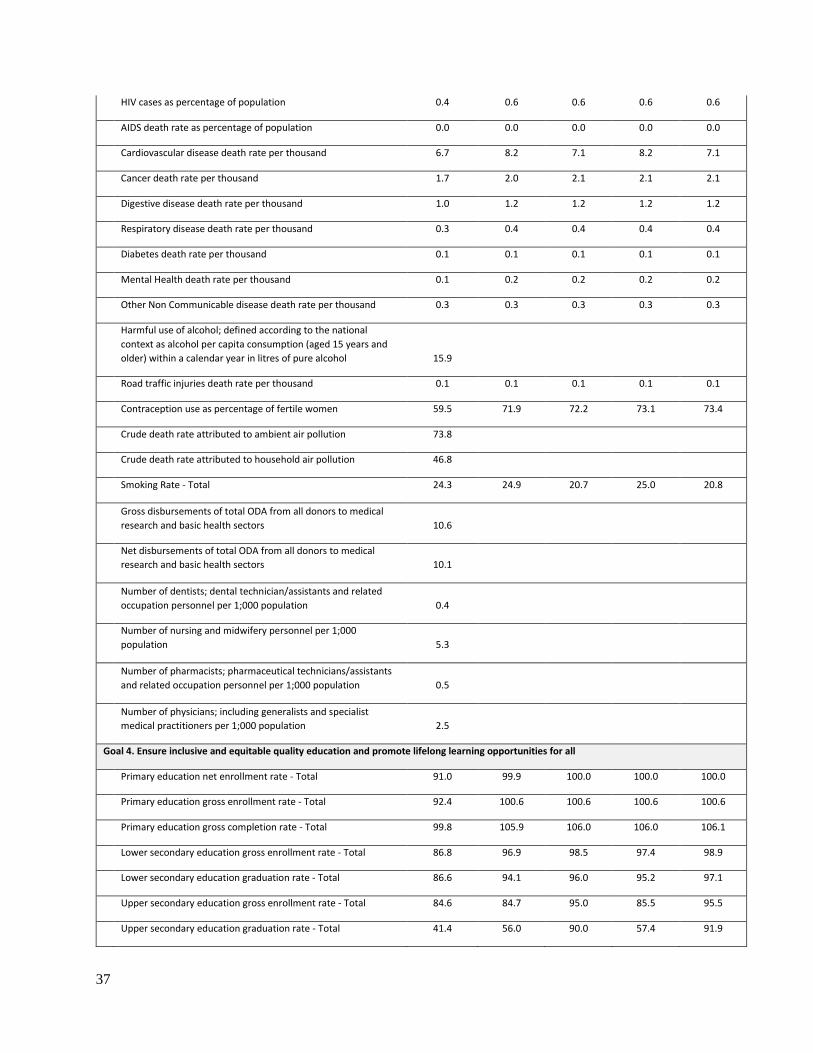
37
HIV cases as percentage of population 0.4 0.6 0.6 0.6 0.6
AIDS death rate as percentage of population 0.0 0.0 0.0 0.0 0.0
Cardiovascular disease death rate per thousand 6.7 8.2 7.1 8.2 7.1
Cancer death rate per thousand 1.7 2.0 2.1 2.1 2.1
Digestive disease death rate per thousand 1.0 1.2 1.2 1.2 1.2
Respiratory disease death rate per thousand 0.3 0.4 0.4 0.4 0.4
Diabetes death rate per thousand 0.1 0.1 0.1 0.1 0.1
Mental Health death rate per thousand 0.1 0.2 0.2 0.2 0.2
Other Non Communicable disease death rate per thousand 0.3 0.3 0.3 0.3 0.3
Harmful use of alcohol; defined according to the national
context as alcohol per capita consumption (aged 15 years and
older) within a calendar year in litres of pure alcohol 15.9
Road traffic injuries death rate per thousand 0.1 0.1 0.1 0.1 0.1
Contraception use as percentage of fertile women 59.5 71.9 72.2 73.1 73.4
Crude death rate attributed to ambient air pollution 73.8
Crude death rate attributed to household air pollution 46.8
Smoking Rate - Total 24.3 24.9 20.7 25.0 20.8
Gross disbursements of total ODA from all donors to medical
research and basic health sectors 10.6
Net disbursements of total ODA from all donors to medical
research and basic health sectors 10.1
Number of dentists; dental technician/assistants and related
occupation personnel per 1;000 population 0.4
Number of nursing and midwifery personnel per 1;000
population 5.3
Number of pharmacists; pharmaceutical technicians/assistants
and related occupation personnel per 1;000 population 0.5
Number of physicians; including generalists and specialist
medical practitioners per 1;000 population 2.5
Goal 4. Ensure inclusive and equitable quality education and promote lifelong learning opportunities for all
Primary education net enrollment rate - Total 91.0 99.9 100.0 100.0 100.0
Primary education gross enrollment rate - Total 92.4 100.6 100.6 100.6 100.6
Primary education gross completion rate - Total 99.8 105.9 106.0 106.0 106.1
Lower secondary education gross enrollment rate - Total 86.8 96.9 98.5 97.4 98.9
Lower secondary education graduation rate - Total 86.6 94.1 96.0 95.2 97.1
Upper secondary education gross enrollment rate - Total 84.6 84.7 95.0 85.5 95.5
Upper secondary education graduation rate - Total 41.4 56.0 90.0 57.4 91.9
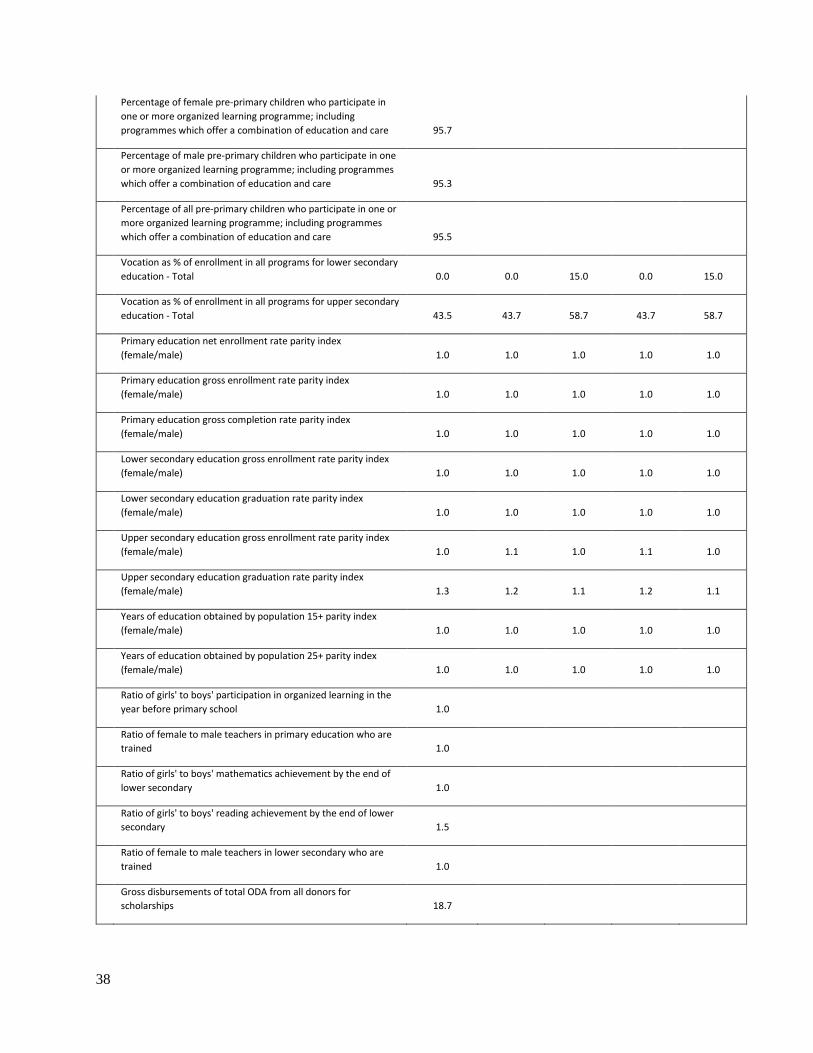
38
Percentage of female pre-primary children who participate in
one or more organized learning programme; including
programmes which offer a combination of education and care 95.7
Percentage of male pre-primary children who participate in one
or more organized learning programme; including programmes
which offer a combination of education and care 95.3
Percentage of all pre-primary children who participate in one or
more organized learning programme; including programmes
which offer a combination of education and care 95.5
Vocation as % of enrollment in all programs for lower secondary
education - Total 0.0 0.0 15.0 0.0 15.0
Vocation as % of enrollment in all programs for upper secondary
education - Total 43.5 43.7 58.7 43.7 58.7
Primary education net enrollment rate parity index
(female/male) 1.0 1.0 1.0 1.0 1.0
Primary education gross enrollment rate parity index
(female/male) 1.0 1.0 1.0 1.0 1.0
Primary education gross completion rate parity index
(female/male) 1.0 1.0 1.0 1.0 1.0
Lower secondary education gross enrollment rate parity index
(female/male) 1.0 1.0 1.0 1.0 1.0
Lower secondary education graduation rate parity index
(female/male) 1.0 1.0 1.0 1.0 1.0
Upper secondary education gross enrollment rate parity index
(female/male) 1.0 1.1 1.0 1.1 1.0
Upper secondary education graduation rate parity index
(female/male) 1.3 1.2 1.1 1.2 1.1
Years of education obtained by population 15+ parity index
(female/male) 1.0 1.0 1.0 1.0 1.0
Years of education obtained by population 25+ parity index
(female/male) 1.0 1.0 1.0 1.0 1.0
Ratio of girls' to boys' participation in organized learning in the
year before primary school 1.0
Ratio of female to male teachers in primary education who are
trained 1.0
Ratio of girls' to boys' mathematics achievement by the end of
lower secondary 1.0
Ratio of girls' to boys' reading achievement by the end of lower
secondary 1.5
Ratio of female to male teachers in lower secondary who are
trained 1.0
Gross disbursements of total ODA from all donors for
scholarships 18.7
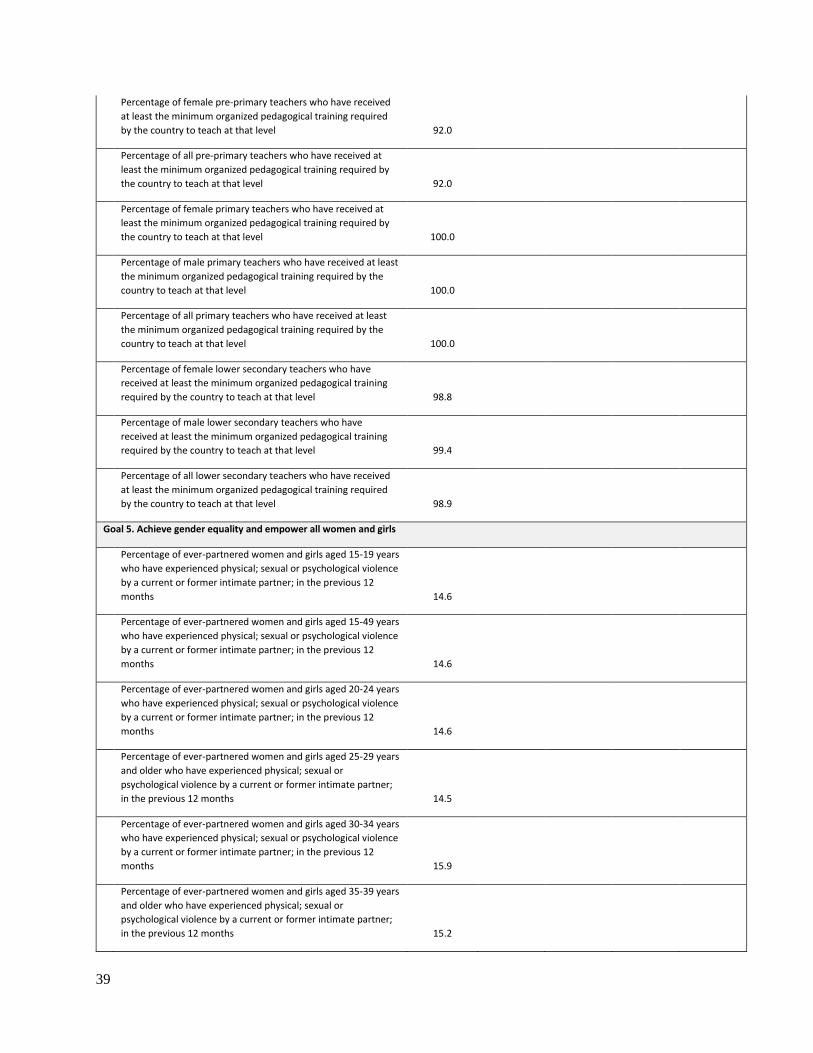
39
Percentage of female pre-primary teachers who have received
at least the minimum organized pedagogical training required
by the country to teach at that level 92.0
Percentage of all pre-primary teachers who have received at
least the minimum organized pedagogical training required by
the country to teach at that level 92.0
Percentage of female primary teachers who have received at
least the minimum organized pedagogical training required by
the country to teach at that level 100.0
Percentage of male primary teachers who have received at least
the minimum organized pedagogical training required by the
country to teach at that level 100.0
Percentage of all primary teachers who have received at least
the minimum organized pedagogical training required by the
country to teach at that level 100.0
Percentage of female lower secondary teachers who have
received at least the minimum organized pedagogical training
required by the country to teach at that level 98.8
Percentage of male lower secondary teachers who have
received at least the minimum organized pedagogical training
required by the country to teach at that level 99.4
Percentage of all lower secondary teachers who have received
at least the minimum organized pedagogical training required
by the country to teach at that level 98.9
Goal 5. Achieve gender equality and empower all women and girls
Percentage of ever-partnered women and girls aged 15-19 years
who have experienced physical; sexual or psychological violence
by a current or former intimate partner; in the previous 12
months 14.6
Percentage of ever-partnered women and girls aged 15-49 years
who have experienced physical; sexual or psychological violence
by a current or former intimate partner; in the previous 12
months 14.6
Percentage of ever-partnered women and girls aged 20-24 years
who have experienced physical; sexual or psychological violence
by a current or former intimate partner; in the previous 12
months 14.6
Percentage of ever-partnered women and girls aged 25-29 years
and older who have experienced physical; sexual or
psychological violence by a current or former intimate partner;
in the previous 12 months 14.5
Percentage of ever-partnered women and girls aged 30-34 years
who have experienced physical; sexual or psychological violence
by a current or former intimate partner; in the previous 12
months 15.9
Percentage of ever-partnered women and girls aged 35-39 years
and older who have experienced physical; sexual or
psychological violence by a current or former intimate partner;
in the previous 12 months 15.2

40
Percentage of ever-partnered women and girls aged 40-44 years
who have experienced physical; sexual or psychological violence
by a current or former intimate partner; in the previous 12
months 12.5
Percentage of ever-partnered women and girls aged 45-49 years
who have experienced physical; sexual or psychological violence
by a current or former intimate partner; in the previous 12
months 15.0
Proportion of women aged 20-24 years who were married or in
a union before age 15 0.4
Proportion of women aged 20-24 years who were married or in
a union before age 18 12.2
Average time women spend on household provision of care
services (e.g. childcare and care of sick; elderly; or disabled
household members) 2.2
Average time men spend on household provision of care
services (e.g. childcare and care of sick; elderly; or disabled
household members) 0.6
Average time women spend on provision of services for
household consumption (e.g. food preparation; dishwashing;
cleaning; childcare; and care of sick or elderly household
members) 19.0
Average time men spend on provision of services for household
consumption (e.g. food preparation; dishwashing; cleaning;
childcare; and care of sick or elderly household members) 10.3
Average time women spend on provision of non-care-related
services for household consumption (e.g. food preparation;
dishwashing; cleaning; and shopping) 16.8
Average time men spend on provision of non-care-related
services for household consumption (e.g. food preparation;
dishwashing; cleaning; and shopping) 9.7
Percentage of seats held by women in national parliaments 20.8
The proportion of females in the total number of persons
employed in senior and middle management positions 48.5
The proportion of females in the total number of persons
employed in managerial positions 48.3
Goal 6. Ensure availability and sustainable management of water and sanitation for all
Percentage of people with access to safe water 88.4 91.8 99.0 91.8 99.0
Percentage of people with access to sanitation services -
Improved 76.4 81.4 89.0 81.6 89.1
Percentage of people connected to wastewater collection
system 60.0 61.6 62.4 61.7 62.5
Percentage of people connected to wastewater treatment
system 60.0 61.5 61.7 61.6 62.0
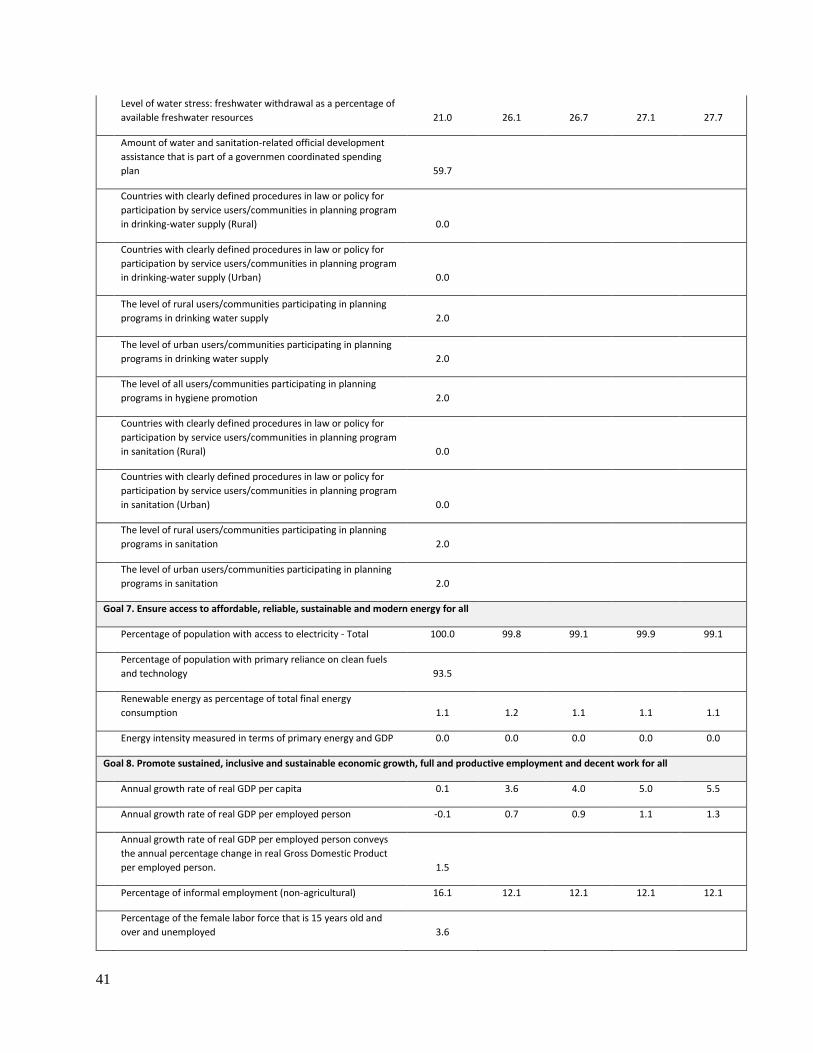
41
Level of water stress: freshwater withdrawal as a percentage of
available freshwater resources 21.0 26.1 26.7 27.1 27.7
Amount of water and sanitation-related official development
assistance that is part of a governmen coordinated spending
plan 59.7
Countries with clearly defined procedures in law or policy for
participation by service users/communities in planning program
in drinking-water supply (Rural) 0.0
Countries with clearly defined procedures in law or policy for
participation by service users/communities in planning program
in drinking-water supply (Urban) 0.0
The level of rural users/communities participating in planning
programs in drinking water supply 2.0
The level of urban users/communities participating in planning
programs in drinking water supply 2.0
The level of all users/communities participating in planning
programs in hygiene promotion 2.0
Countries with clearly defined procedures in law or policy for
participation by service users/communities in planning program
in sanitation (Rural) 0.0
Countries with clearly defined procedures in law or policy for
participation by service users/communities in planning program
in sanitation (Urban) 0.0
The level of rural users/communities participating in planning
programs in sanitation 2.0
The level of urban users/communities participating in planning
programs in sanitation 2.0
Goal 7. Ensure access to affordable, reliable, sustainable and modern energy for all
Percentage of population with access to electricity - Total 100.0 99.8 99.1 99.9 99.1
Percentage of population with primary reliance on clean fuels
and technology 93.5
Renewable energy as percentage of total final energy
consumption 1.1 1.2 1.1 1.1 1.1
Energy intensity measured in terms of primary energy and GDP 0.0 0.0 0.0 0.0 0.0
Goal 8. Promote sustained, inclusive and sustainable economic growth, full and productive employment and decent work for all
Annual growth rate of real GDP per capita 0.1 3.6 4.0 5.0 5.5
Annual growth rate of real GDP per employed person -0.1 0.7 0.9 1.1 1.3
Annual growth rate of real GDP per employed person conveys
the annual percentage change in real Gross Domestic Product
per employed person. 1.5
Percentage of informal employment (non-agricultural) 16.1 12.1 12.1 12.1 12.1
Percentage of the female labor force that is 15 years old and
over and unemployed 3.6

42
Percentage of the female labor force that is 15 to 24 years old
and unemployed 13.5
Percentage of the female labor force that is 25 years old and
over and unemployed 2.9
Percentage of the male labor force that is 15 years old and over
and unemployed 6.2
Percentage of the male labor force that is 15 to 24 years old and
unemployed 12.4
Percentage of the male labor force that is over 25 years old and
unemployed 5.5
Percentage of the total labor force that is 15 years old and over
and unemployed 4.9
Percentage of the total labor force that is 15 to 24 years old and
unemployed 12.8
Percentage of the total labor force that is 25 years old and over
and unemployed 4.2
Proportion of youth not in education; employment or training
(NEET); as a percentage of the total youth population 27.8
Proportion of young females not in education; employment or
training (NEET); as a percentage of the total youth population 25.2
Proportion of young males not in education; employment or
training (NEET); as a percentage of the total youth population 30.2
The number of children aged 5-17 years who are reported to
have been engaged in child labour in the past week divided by
the total number of children aged 5-17 in the population 8.4
The number of female children aged 5-17 years who are
reported to have been engaged in child labour in the past week
divided by the total number of children aged 5-17 in the
population 5.6
The number of male children aged 5-17 years who are reported
to have been engaged in child labour in the past week divided
by the total number of children aged 5-17 in the population 11.2
The number of children aged 5-17 years who are reported to
have been engaged in child labour in the past week divided by
the total number of children aged 5-17 in the population 50.0
The number of female children aged 5-17 years who are
reported to have been engaged in child labour in the past week
divided by the total number of children aged 5-17 in the
population 16.0
The number of male children aged 5-17 years who are reported
to have been engaged in child labour in the past week divided
by the total number of children aged 5-17 in the population 34.0
The frequency rates of fatal occupational injuries among female
employees 0.6

43
The frequency rates of fatal occupational injuries among male
employees 12.0
The frequency rates of fatal occupational injuries among total
employees 5.7
The frequency rates of non-fatal occupational injuries among
female employees 29.4
The frequency rates of non-fatal occupational injuries among
male employees 121.6
The frequency rates of non-fatal occupational injuries among
total employees 70.3
The percentage of adults (ages 15+) who report having an
account (by themselves or together with someone else) at a
bank or another type of financial institution or personally using
a mobile money service in the past 12 months 21.3
The number of automated teller machines (ATMs) per 100;000
adults 32.5
The number of commerical bank branches per 100;000 adults 10.0
The gross commitments of total Official Development
Assistance (ODA) from all recipients for aid for trade 71.5
The gross disbursements of total Official Development
Assistance (ODA) from all donors for aid for trade 71.5
The gross disbursements of total Official Development
Assistance (ODA) from all recipients for aid for trade 150.9
Goal 9. Build resilient infrastructure, promote inclusive and sustainable industrialization and foster innovation
Percentage of rural people living within two km of an all
weather road 73.9 78.6 78.6 79.1 79.1
Rail freights million ton-kilometer 959.0
Rail passenger-kilometers 181000000.0
Air freight 0.5
Air transport; passengers carried 1.0
The volume of mail carried by air transport 184906.0
The sum of the freight volumes reported for the air carriers in
terms of metric tonnes of cargo respectively 4280.0
The sum of the passenger reported for the air carriers in terms
of number of people respectively 4804.0
Manufacturing value added as a % of GDP 26.9 28.1 28.2 28.3 28.5
Manufacturing value added per capita 52.9 97.4 100.0 106.8 110.3
Manufacturing employment as a percentage of total
employment 13.3 13.3 13.3 13.3 13.3
The share of manufacturing employment in total employment 10.0
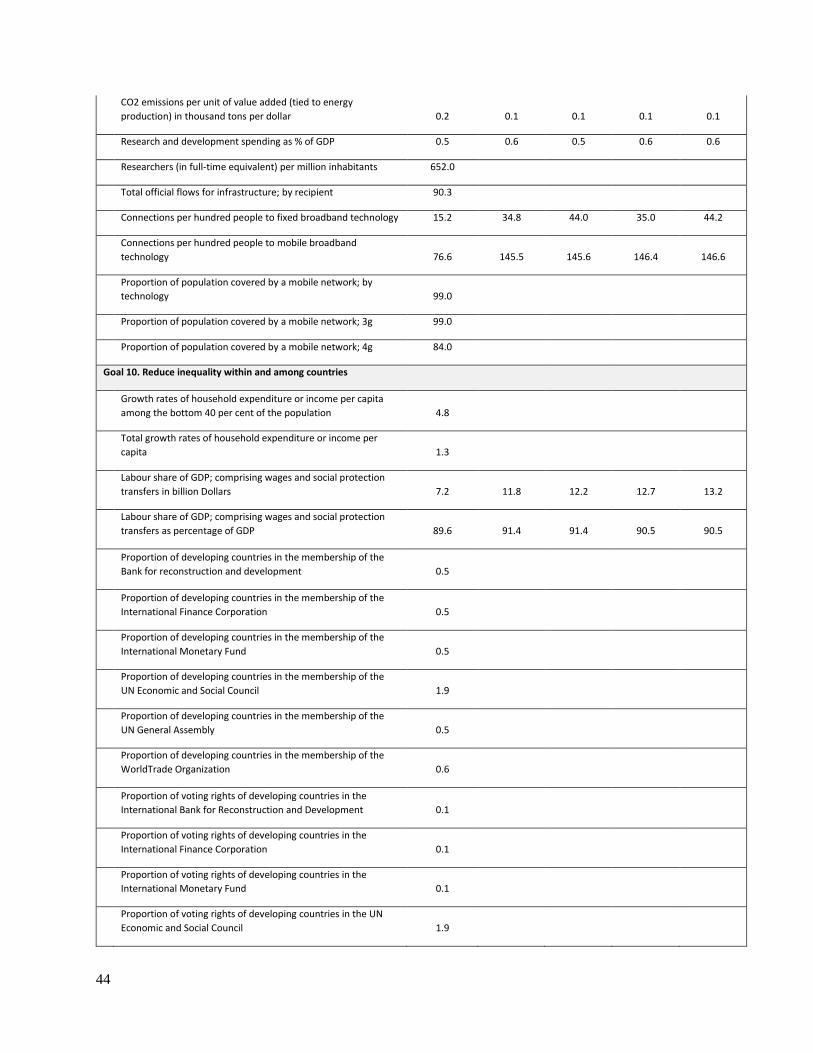
44
CO2 emissions per unit of value added (tied to energy
production) in thousand tons per dollar 0.2 0.1 0.1 0.1 0.1
Research and development spending as % of GDP 0.5 0.6 0.5 0.6 0.6
Researchers (in full-time equivalent) per million inhabitants 652.0
Total official flows for infrastructure; by recipient 90.3
Connections per hundred people to fixed broadband technology 15.2 34.8 44.0 35.0 44.2
Connections per hundred people to mobile broadband
technology 76.6 145.5 145.6 146.4 146.6
Proportion of population covered by a mobile network; by
technology 99.0
Proportion of population covered by a mobile network; 3g 99.0
Proportion of population covered by a mobile network; 4g 84.0
Goal 10. Reduce inequality within and among countries
Growth rates of household expenditure or income per capita
among the bottom 40 per cent of the population 4.8
Total growth rates of household expenditure or income per
capita 1.3
Labour share of GDP; comprising wages and social protection
transfers in billion Dollars 7.2 11.8 12.2 12.7 13.2
Labour share of GDP; comprising wages and social protection
transfers as percentage of GDP 89.6 91.4 91.4 90.5 90.5
Proportion of developing countries in the membership of the
Bank for reconstruction and development 0.5
Proportion of developing countries in the membership of the
International Finance Corporation 0.5
Proportion of developing countries in the membership of the
International Monetary Fund 0.5
Proportion of developing countries in the membership of the
UN Economic and Social Council 1.9
Proportion of developing countries in the membership of the
UN General Assembly 0.5
Proportion of developing countries in the membership of the
WorldTrade Organization 0.6
Proportion of voting rights of developing countries in the
International Bank for Reconstruction and Development 0.1
Proportion of voting rights of developing countries in the
International Finance Corporation 0.1
Proportion of voting rights of developing countries in the
International Monetary Fund 0.1
Proportion of voting rights of developing countries in the UN
Economic and Social Council 1.9
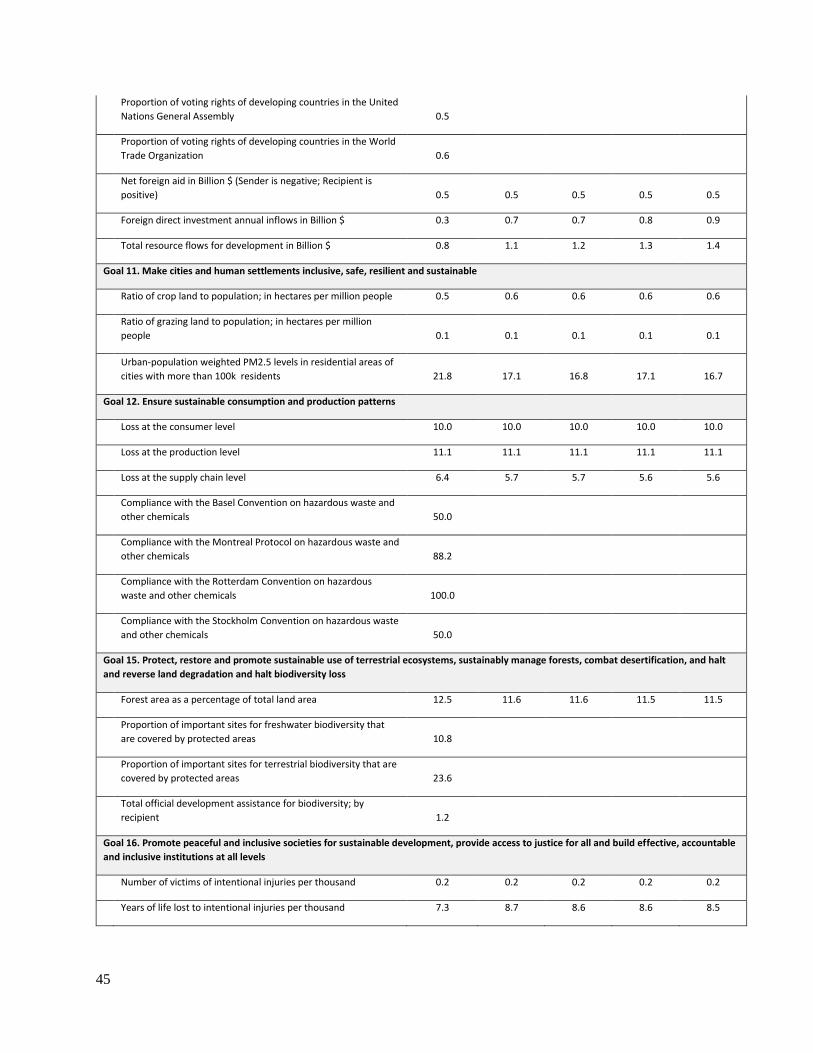
45
Proportion of voting rights of developing countries in the United
Nations General Assembly 0.5
Proportion of voting rights of developing countries in the World
Trade Organization 0.6
Net foreign aid in Billion $ (Sender is negative; Recipient is
positive) 0.5 0.5 0.5 0.5 0.5
Foreign direct investment annual inflows in Billion $ 0.3 0.7 0.7 0.8 0.9
Total resource flows for development in Billion $ 0.8 1.1 1.2 1.3 1.4
Goal 11. Make cities and human settlements inclusive, safe, resilient and sustainable
Ratio of crop land to population; in hectares per million people 0.5 0.6 0.6 0.6 0.6
Ratio of grazing land to population; in hectares per million
people 0.1 0.1 0.1 0.1 0.1
Urban-population weighted PM2.5 levels in residential areas of
cities with more than 100k residents 21.8 17.1 16.8 17.1 16.7
Goal 12. Ensure sustainable consumption and production patterns
Loss at the consumer level 10.0 10.0 10.0 10.0 10.0
Loss at the production level 11.1 11.1 11.1 11.1 11.1
Loss at the supply chain level 6.4 5.7 5.7 5.6 5.6
Compliance with the Basel Convention on hazardous waste and
other chemicals 50.0
Compliance with the Montreal Protocol on hazardous waste and
other chemicals 88.2
Compliance with the Rotterdam Convention on hazardous
waste and other chemicals 100.0
Compliance with the Stockholm Convention on hazardous waste
and other chemicals 50.0
Goal 15. Protect, restore and promote sustainable use of terrestrial ecosystems, sustainably manage forests, combat desertification, and halt
and reverse land degradation and halt biodiversity loss
Forest area as a percentage of total land area 12.5 11.6 11.6 11.5 11.5
Proportion of important sites for freshwater biodiversity that
are covered by protected areas 10.8
Proportion of important sites for terrestrial biodiversity that are
covered by protected areas 23.6
Total official development assistance for biodiversity; by
recipient 1.2
Goal 16. Promote peaceful and inclusive societies for sustainable development, provide access to justice for all and build effective, accountable
and inclusive institutions at all levels
Number of victims of intentional injuries per thousand 0.2 0.2 0.2 0.2 0.2
Years of life lost to intentional injuries per thousand 7.3 8.7 8.6 8.6 8.5

46
Years of living with disability due to intentional injuries per
thousand 1.4 1.6 1.6 1.6 1.6
Unsentenced detainees as a proportion of overall prison
population 21.5
Proportion of children under 5 years of age whose births have
been registered with a civil authority 99.6
The compliance of existing national human rights institutions
with the Principles relating to the Status of National Institutions 3.0
Goal 17. Strengthen the means of implementation and revitalize the Global Partnership for Sustainable Development
Percentage of domestic budget funded by domestic taxes 95.0 101.8 101.2 100.9 100.3
Total government revenue as % of GDP 39.4 46.1 46.2 45.8 45.9
Household taxes as % of GDP 7.2 10.4 10.5 10.5 10.5
Firm taxes as % of GDP 0.3 1.0 1.0 1.0 1.0
Indirect taxes (taxes on goods and services) as % of GDP 14.2 17.7 17.8 17.7 17.7
Social security and wellfare taxes as % of GDP 9.3 12.0 12.1 12.1 12.1
Net official development assitance as % of GDP (Sender is
negative; Recipient is positive) 6.0 3.5 3.5 3.3 3.2
Volume of remittances as % of GDP (Sender is negative;
Recipient is positive) 15.2 12.3 11.9 11.3 10.9
Debt service as percentage of exports of goods and services 12.9
Fixed Internet broadband subscriptions per 100 inhabitants 15.2 34.8 44.0 35.0 44.2
ICT Infrastructure Index 46.2 76.3 79.4 76.7 79.9
Percentage of individuals using the Internet 35.9
Dollar value of financial and technical assistance (including
through North-South; South-South and triangular cooperation)
committed to developing countries 31.6
Share of global exports (Percentage) 0.0 0.0 0.0 0.0 0.0

47
References Ascher, W., & Krupp, C. (Eds.). (2010). Physical Infrastructure Development. New York: Palgrave
Macmillan US. https://doi.org/10.1057/9780230107670
Barry B. Hughes. (2014). IFs Population Model Documentation. Pardee Center for International Futures,
Josef Korbel School of International Studies, University of Denver.
Dickson, J. R., Hughes, B., & Irfan, M. T. (2010). Advancing global education. [Denver] : Boulder : New
Delhi: Pardee Center for International Futures, University of Denver ; Paradigm Publishers ;
Oxford University Press.
Dodani, S., & LaPorte, R. E. (2005). Brain drain from developing countries: how can brain drain be
converted into wisdom gain? Journal of the Royal Society of Medicine, 98(11), 487–491.
Elzinga, G. (2005). Vertical-horizontal synergy of the health workforce. Bulletin of the World Health
Organization, 83(4), 242–243.
Forouzanfar, M. H., Afshin, A., Alexander, L. T., Anderson, H. R., Bhutta, Z. A., Biryukov, S., … Murray, C. J.
L. (2016). Global, regional, and national comparative risk assessment of 79 behavioural,
environmental and occupational, and metabolic risks or clusters of risks, 1990–2015: a
systematic analysis for the Global Burden of Disease Study 2015. The Lancet, 388(10053), 1659–
1724. https://doi.org/10.1016/S0140-6736(16)31679-8
Fraser Institute. (2016). Economic Freedom. Retrieved from
https://www.fraserinstitute.org/studies/economic-freedom
Greenhill, R. (2011, September 2). Demography is Density. Retrieved from
https://www.weforum.org/agenda/2011/09/demography-is-destiny/
48
Hughes, B. B., Joshi, D. K., Moyer, J. D., Sisk, T. D., & Solórzano, J. R. (2014). Strengthening Governance
Globally: Forecasting the next 50 Years (Vol. 5). Boulder, CO: Paradigm Publishers. Retrieved
from http://pardee.du.edu/sites/default/files/PPHP5ExecutiveSummary_0.pdf
Hughes, B. B., Kuhn, R., Peterson, C. M., Rothman, D. S., & Solórzano, J. R. (Eds.). (2011). Improving
global health: forecasting the next 50 years. Boulder, Colo: Paradigm Publishers.
IMF. (2015, December 1). Republic of Moldova: stadd report for the 2015 article IV consultation and
third post-program monitoring discussions-debt sustainability analysis.
International Republican Institute. (2017, February). Public Opinion Survey Residents of Moldova.
Retrieved from http://www.iri.org/sites/default/files/iri_moldova_poll_march_2017.pdf
IRES (UCLouvain), Belgium, & Docquier, F. (2014). The brain drain from developing countries. IZA World
of Labor. https://doi.org/10.15185/izawol.31
Ivan Simonovic. (2016, March 31). OHCHR | Moldova: A time of challenges and opportunities, says
senior Human Rights Official. Retrieved August 28, 2017, from
http://www.ohchr.org/EN/NewsEvents/Pages/DisplayNews.aspx?NewsID=18550&LangID=
E
Mason, A., & Kinugasa, T. (2005, June). East Asian Economic Development: Two Demographic Dividends.
East-West Center Working Papers. Retrieved from
http://www.eastwestcenter.org/fileadmin/stored/pdfs/ECONwp083.pdf
Murray, C. J., & Lopez, A. D. (1996). The global burden of disease: a comprehensive assessment of
mortality and disability from diseases, injuries, and risk factors in 1990 and projected to 2020:
summary. Retrieved from
http://apps.who.int/iris/bitstream/10665/41864/1/0965546608_eng.pdf
Narayan, K., & Donnenfeld, Z. (2016). Envisioning a healthy future-Africa’s shifting burden of disease.
Institute for Security Studies Papers, 2016(18), 1–36.
49
OECD (Ed.). (2007). Policy coherence for development 2007: migration and developing countries. Paris:
OECD.
OECD. (2008). The Brain Drain and Negative Social Effects: When is the Home Country Hurt? In Policy
Coherence for Development 2007 (pp. 65–78). Organisation for Economic Co-operation and
Development. Retrieved from http://www.oecd-ilibrary.org/content/chapter/9789264026100-
6-en
Rothman, D. S. (2014). Building global infrastructure: forecasting the next 50 yeas. Boulder, CO:
Paradigm Publishers.
Tejada, G., Varzari, V., & Porcescu, S. (2013). Scientific diasporas, transnationalism and home-country
development: evidence from a study of skilled Moldovans abroad. Southeast European and
Black Sea Studies, 13(2), 157–173. https://doi.org/10.1080/14683857.2013.789674
Tim Whewell. (2015, June 18). The great Moldovan bank robbery. BBC News. Retrieved from
http://www.bbc.com/news/magazine-33166383
Transparency International. (2016). Corruption Perceptions Index 2016. Retrieved February 10, 2017,
from https://www.transparency.org/news/feature/corruption_perceptions_index_2016
UN. (1948, December). Universal Declaration of Human Rights. Retrieved from
http://www.un.org/en/universal-declaration-human-rights/
UN DESA. (2017). World Population Prospects 2017. Retrieved from https://esa.un.org/unpd/wpp/
UNAIDS. (2015). HIV and AIDS estimates. Retrieved September 8, 2017, from
http://www.unaids.org/en/regionscountries/countries/republicofmoldova
USAID. (2012, December). An Analysis of the State of Democracy and Governance in Moldova. USAID.
Retrieved from
https://www.usaid.gov/sites/default/files/documents/1863/Moldova%20DG%20Analysis2012_
PUBLIC%2008-05-13.pdf
50
Valeriu Prohnitchi, Valentina Bodrug-Lungu, Arcadie Astrahan, & Valentin Cibotaru. (2013). The Third
Millennium Development Goals Report. Republic of Moldova. Government of the Republic of
Moldova and UN Agencies in Moldova.
World Bank. (2016, October). World Governance Indicators. Retrieved from
https://data.worldbank.org/data-catalog/worldwide-governance-indicators
World Bank. (2017a, April 17). Moldova: Reducing Poverty and Boosting Shared Prosperity [Text/HTML].
Retrieved August 24, 2017, from http://www.worldbank.org/en/results/2017/04/17/moldova-
reducing-poverty-and-boosting-shared-prosperity
World Bank. (2017b, July 1). World Development Indicators. Retrieved September 8, 2017, from
https://data.worldbank.org/data-catalog/world-development-indicators
World Health Organization, & Regional Office for Europe. (2016). Republic of Moldova: profile of health
and well-being. Copenhagen: World Health Organization, Regional Office for Europe.
1 2015 GDP data comes from the IMF’s World Economic Outlook. Last updated in June 2017. 2 GDP and GDP per capita measured using 2011 USD. 3 The IFs system has no separate modeling capacity for Transnistria and considers the region to be part of the
Republic of Moldova. The data and variables used in this report include Transnistria as part of the analysis. 4 More information on the SDG dashboard and instructions for use can be found on its wiki page here: <
http://pardee.du.edu/wiki/SDG_Dashboard> 5 Labor force participation rate as measured in the IFs model is the size of the labor force divided by the total
population. 6 This UN grouping includes the following countries: Belarus, Bulgaria, Czech Republic, Hungary, Moldova,
Poland, Romania, Russia, Slovakia, and Ukraine. 7 Total Fertility Rate data comes from the UN Population Division’s (UNPD) World Population Prospects (WPP)
2017 revision. 8 This is in line with the UNPD’s World Population Prospects (WPP) forecast (2012) revision. The 2015 and 2017
revision contain lower outward net migration forecasts. 9 Data comes from the UN Population Division’s (UNPD) World Population Prospects (WPP) 2017 revision. 10 Subscription saturation points for different ICT technologies differ across countries. Data from the International
Telecommunications Union show penetration rates for mobile phones that exceed 100 subscriptions per 100 persons
(e.g., approaching 200 in Hong Kong). At the same time, some countries (e.g., Denmark) seem to be reaching a
saturation level for fixed broadband well below 100 subscriptions per 100 persons. With this uncertainty in mind,
IFs saturates at 50 per 100 for fixed broadband and 150 per 100 for mobile technology. These data come from the
International Telecommunications Union (ITU) and were updated in August 2017. 11 The data comes from the World Bank’s Rural Access Index, a project that has been discontinued. 12 This disease category was taken from the World Health Organization Global Burden of Disease project and
reflects a residual category of deaths from noncommunicable disease that are not easily classified into any
traditional communicable disease category.


![Moldova’s export developments in 2017€¦ · Moldova’s export developments in 2017 Policy Briefing Series [PB/02/2018] German Economic Team 2Moldova Structure 1. Background 2](https://img.pdfslide.net/doc/110x75/5f06f7fa7e708231d41aa371/moldovaas-export-developments-in-2017-moldovaas-export-developments-in-2017.jpg)