Embed Size (px)
Citation preview
8/3/2019 Free Sample Plan1
http://slidepdf.com/reader/full/free-sample-plan1 1/41
8/3/2019 Free Sample Plan1
http://slidepdf.com/reader/full/free-sample-plan1 2/41
- C ONFIDENTIAL R EPORT - TABLE OF CONTENTS
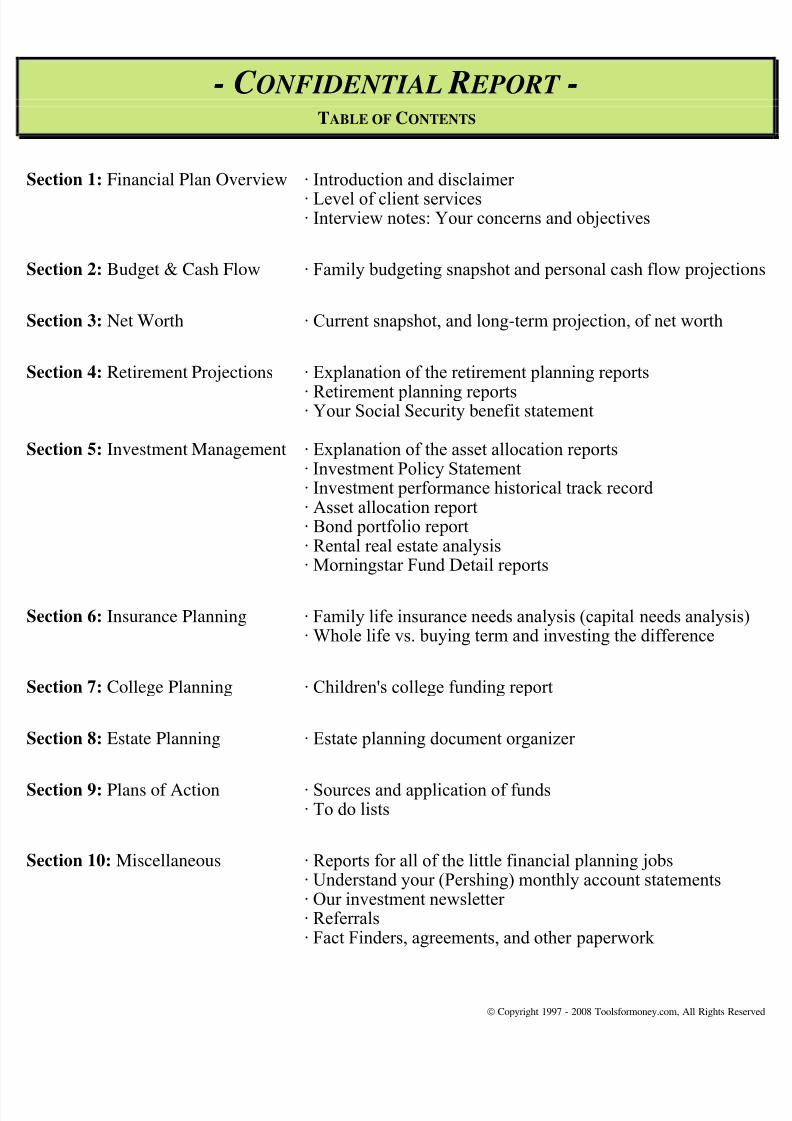
Section 1: Financial Plan Overview · Introduction and disclaimer · Level of client services · Interview notes: Your concerns and objectives
Section 2:Budget & Cash Flow · Family budgeting snapshot and personal cash flow projections
Section 3: Net Worth · Current snapshot, and long-term projection, of net worth
Section 4: Retirement Projections · Explanation of the retirement planning reports · Retirement planning reports
· Your Social Security benefit statement
Section 5: Investment Management · Explanation of the asset allocation reports · Investment Policy Statement · Investment performance historical track record · Asset allocation report · Bond portfolio report
· Rental real estate analysis · Morningstar Fund Detail reports
8/3/2019 Free Sample Plan1
http://slidepdf.com/reader/full/free-sample-plan1 3/41
- C ONFIDENTIAL R EPORT - FINANCIALPLAN INTRODUCTION
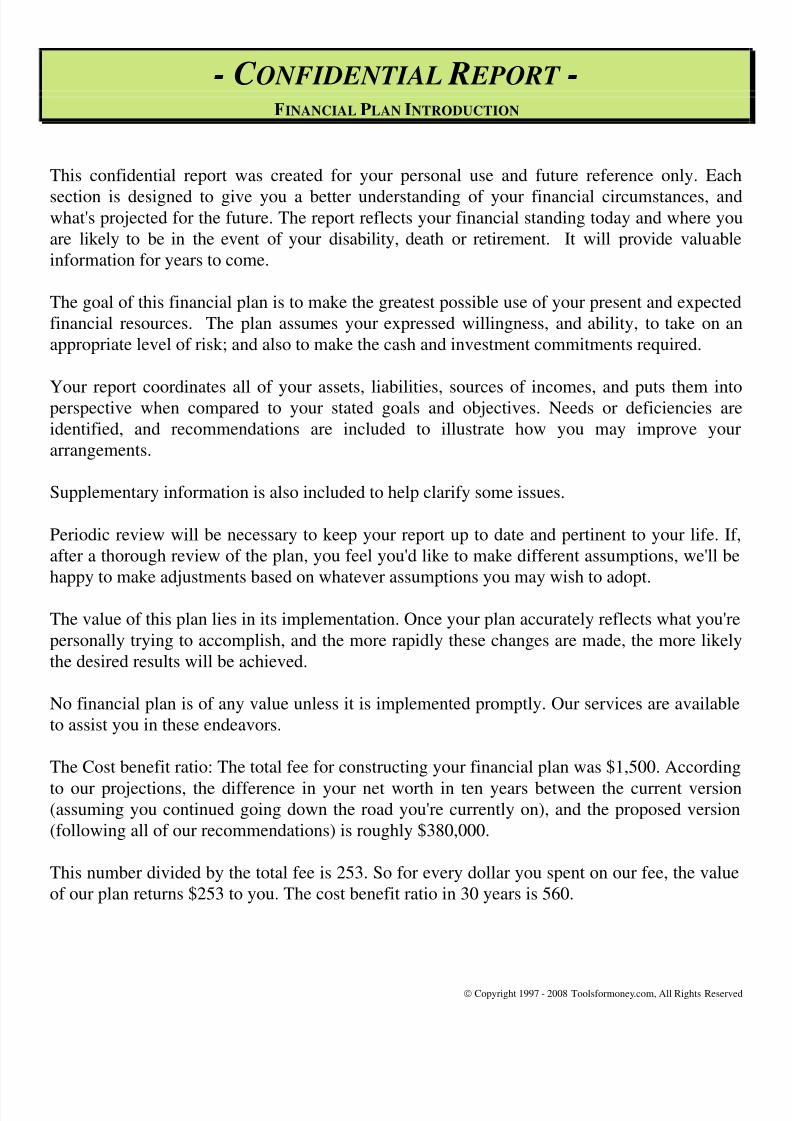
This confidential report was created for your personal use and future reference only. Eachsection is designed to give you a better understanding of your financial circumstances, andwhat's projected for the future. The report reflects your financial standing today and where youare likely to be in the event of your disability, death or retirement. It will provide valuableinformation for years to come.
The goal of this financial plan is to make the greatest possible use of your present and expectedfinancial resources. The plan assumes your expressed willingness, and ability, to take on anappropriate level of risk; and also to make the cash and investment commitments required.
Your report coordinates all of your assets, liabilities, sources of incomes, and puts them into
perspective when compared to your stated goals and objectives. Needs or deficiencies areidentified, and recommendations are included to illustrate how you may improve yourarrangements.
Supplementary information is also included to help clarify some issues.
Periodic review will be necessary to keep your report up to date and pertinent to your life. If,
after a thorough review of the plan, you feel you'd like to make different assumptions, we'll behappy to make adjustments based on whatever assumptions you may wish to adopt.
8/3/2019 Free Sample Plan1
http://slidepdf.com/reader/full/free-sample-plan1 4/41
- C ONFIDENTIAL R EPORT - Disclaimer
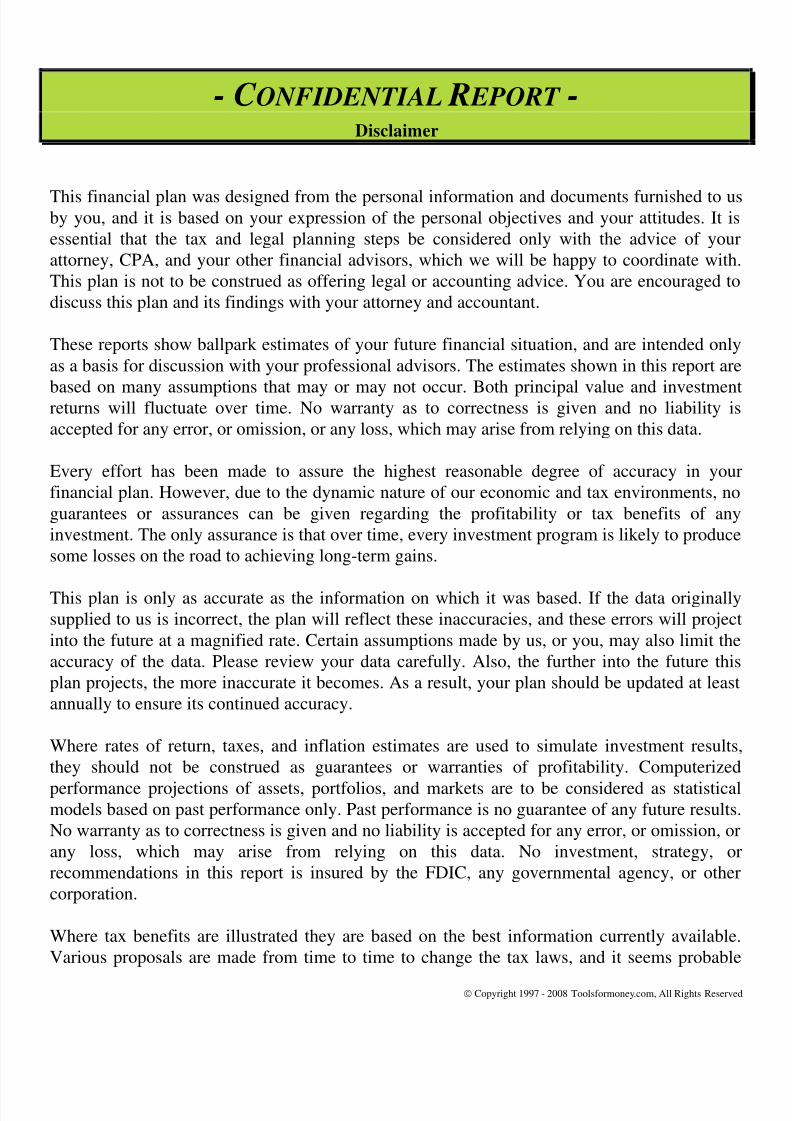
This financial plan was designed from the personal information and documents furnished to usby you, and it is based on your expression of the personal objectives and your attitudes. It isessential that the tax and legal planning steps be considered only with the advice of yourattorney, CPA, and your other financial advisors, which we will be happy to coordinate with.
This plan is not to be construed as offering legal or accounting advice. You are encouraged todiscuss this plan and its findings with your attorney and accountant.
These reports show ballpark estimates of your future financial situation, and are intended onlyas a basis for discussion with your professional advisors. The estimates shown in this report arebased on many assumptions that may or may not occur. Both principal value and investment
returns will fluctuate over time. No warranty as to correctness is given and no liability isaccepted for any error, or omission, or any loss, which may arise from relying on this data.
Every effort has been made to assure the highest reasonable degree of accuracy in yourfinancial plan. However, due to the dynamic nature of our economic and tax environments, noguarantees or assurances can be given regarding the profitability or tax benefits of anyinvestment. The only assurance is that over time, every investment program is likely to produce
some losses on the road to achieving long-term gains.
This plan is only as accurate as the information on which it was based. If the data originally
8/3/2019 Free Sample Plan1
http://slidepdf.com/reader/full/free-sample-plan1 5/41
8/3/2019 Free Sample Plan1
http://slidepdf.com/reader/full/free-sample-plan1 6/41
- C ONFIDENTIAL R EPORT -
LEVEL OF CLIENT SERVICES
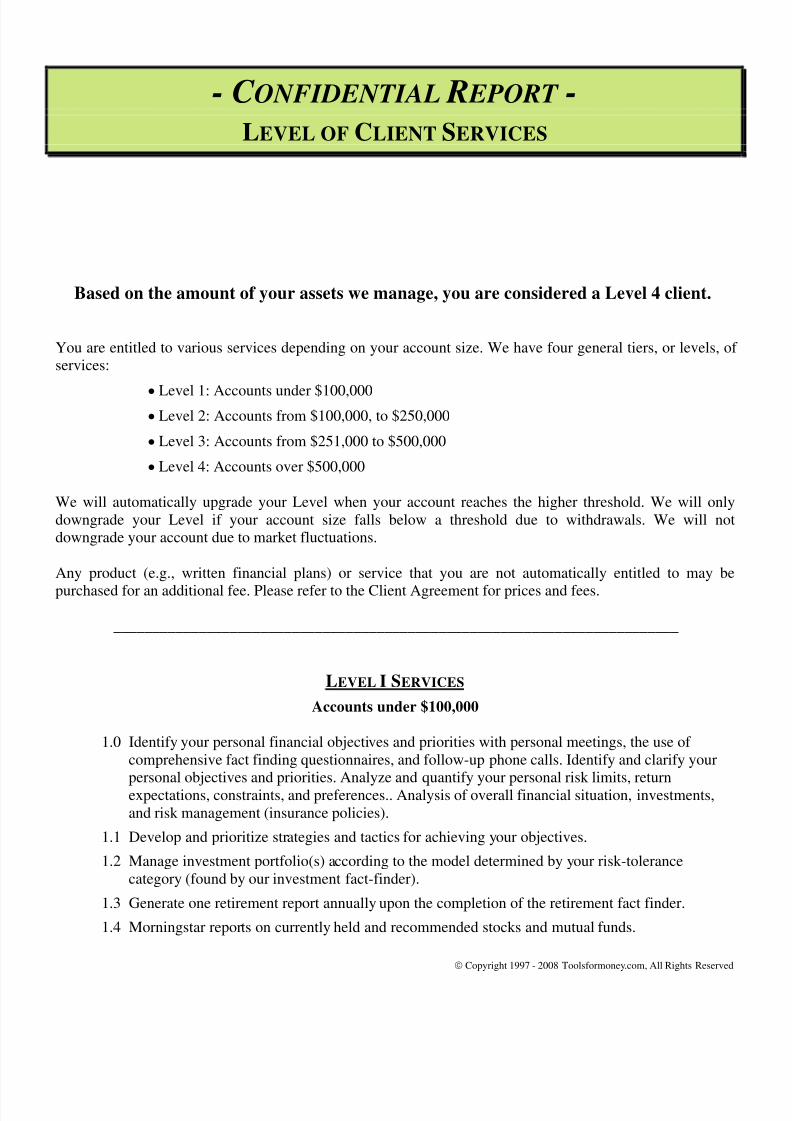
Based on the amount of your assets we manage, you are considered a Level 4 client.
You are entitled to various services depending on your account size. We have four general tiers, or levels, of services:
Level 1: Accounts under $100,000
Level 2: Accounts from $100,000, to $250,000
Level 3: Accounts from $251,000 to $500,000
Level 4: Accounts over $500,000
We will automatically upgrade your Level when your account reaches the higher threshold. We will onlydowngrade your Level if your account size falls below a threshold due to withdrawals. We will notdowngrade your account due to market fluctuations.
Any product (e.g., written financial plans) or service that you are not automatically entitled to may bepurchased for an additional fee. Please refer to the Client Agreement for prices and fees.
8/3/2019 Free Sample Plan1
http://slidepdf.com/reader/full/free-sample-plan1 7/41
8/3/2019 Free Sample Plan1
http://slidepdf.com/reader/full/free-sample-plan1 8/41
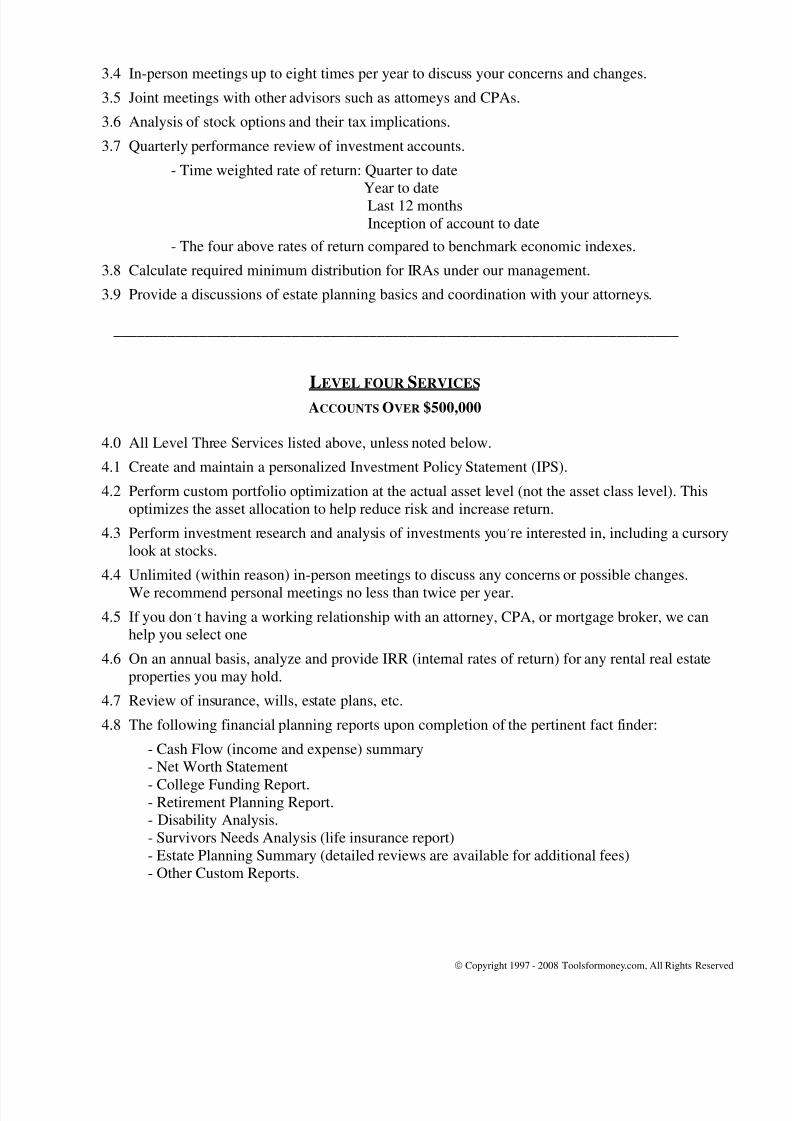
3.4 In-person meetings up to eight times per year to discuss your concerns and changes.
3.5 Joint meetings with other advisors such as attorneys and CPAs.
3.6 Analysis of stock options and their tax implications.
3.7 Quarterly performance review of investment accounts.
- Time weighted rate of return: Quarter to dateYear to dateLast 12 monthsInception of account to date
- The four above rates of return compared to benchmark economic indexes.
3.8 Calculate required minimum distribution for IRAs under our management.3.9 Provide a discussions of estate planning basics and coordination with your attorneys.
_________________________________________________________________________
LEVEL FOUR SERVICES
ACCOUNTS
OVER
$500,000
4.0 All Level Three Services listed above, unless noted below.
4.1 Create and maintain a personalized Investment Policy Statement (IPS).
4.2 Perform custom portfolio optimization at the actual asset level (not the asset class level). Thisoptimizes the asset allocation to help reduce risk and increase return.
4.3 Perform investment research and analysis of investments you’re interested in, including a cursory
look at stocks.4.4 Unlimited (within reason) in-person meetings to discuss any concerns or possible changes.
We recommend personal meetings no less than twice per year.

8/3/2019 Free Sample Plan1
http://slidepdf.com/reader/full/free-sample-plan1 9/41
8/3/2019 Free Sample Plan1
http://slidepdf.com/reader/full/free-sample-plan1 10/41
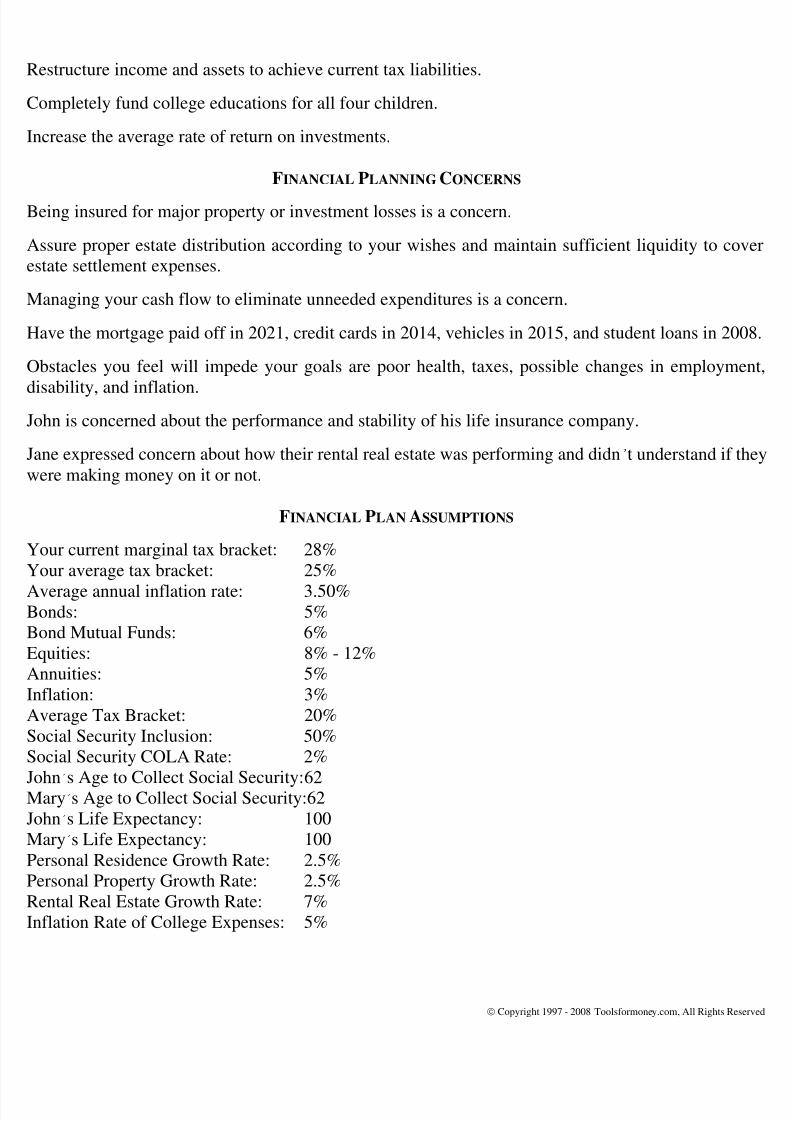
Restructure income and assets to achieve current tax liabilities.
Completely fund college educations for all four children.
Increase the average rate of return on investments.
FINANCIAL PLANNING CONCERNS
Being insured for major property or investment losses is a concern.
Assure proper estate distribution according to your wishes and maintain sufficient liquidity to coverestate settlement expenses.
Managing your cash flow to eliminate unneeded expenditures is a concern.
Have the mortgage paid off in 2021, credit cards in 2014, vehicles in 2015, and student loans in 2008.
Obstacles you feel will impede your goals are poor health, taxes, possible changes in employment,disability, and inflation.
John is concerned about the performance and stability of his life insurance company.
Jane expressed concern about how their rental real estate was performing and didn’t understand if they
were making money on it or not.
FINANCIAL PLAN ASSUMPTIONS
Your current marginal tax bracket: 28%Your average tax bracket: 25%Average annual inflation rate: 3.50%B d 5%
8/3/2019 Free Sample Plan1
http://slidepdf.com/reader/full/free-sample-plan1 11/41
FAMILY BUDGET AND CASH FLOW REPORT EXPLANATION
REAL WORLD PERSONAL FINANCIAL SOFTWARE 2130 9
thSt. W #166 Whitefish, MT 59912-4416 (406) 257-1182
MichealaFulford ,_ CFA [email protected] http://www.toolsformoney.com/
OVERVIEW OF THE BUDGETING AND CASH FLOW REPORTS
This text is to help you understand the overall concepts, and the technical details, of thefamily budgeting and cash flow reports that follow.
The data used to generate the reports came from a combination of fact finders, yourfinancial statements, assumptions, and estimates. These values change daily, so there willalways be a level of inaccuracy that can’t be avoided.
The budgeting reports have three major sections: Fixed expenses, variable expenses, anddebt payments. Fixed expenses are those that are relatively constant every month – likeinsurance premiums and cable TV bills. Variable expenses are those that vary greatly frommonth to month – like food, clothing, and entertainment. Debt payments show moneygoing to repay loans.
These three sections display their monthly totals at the bottom.
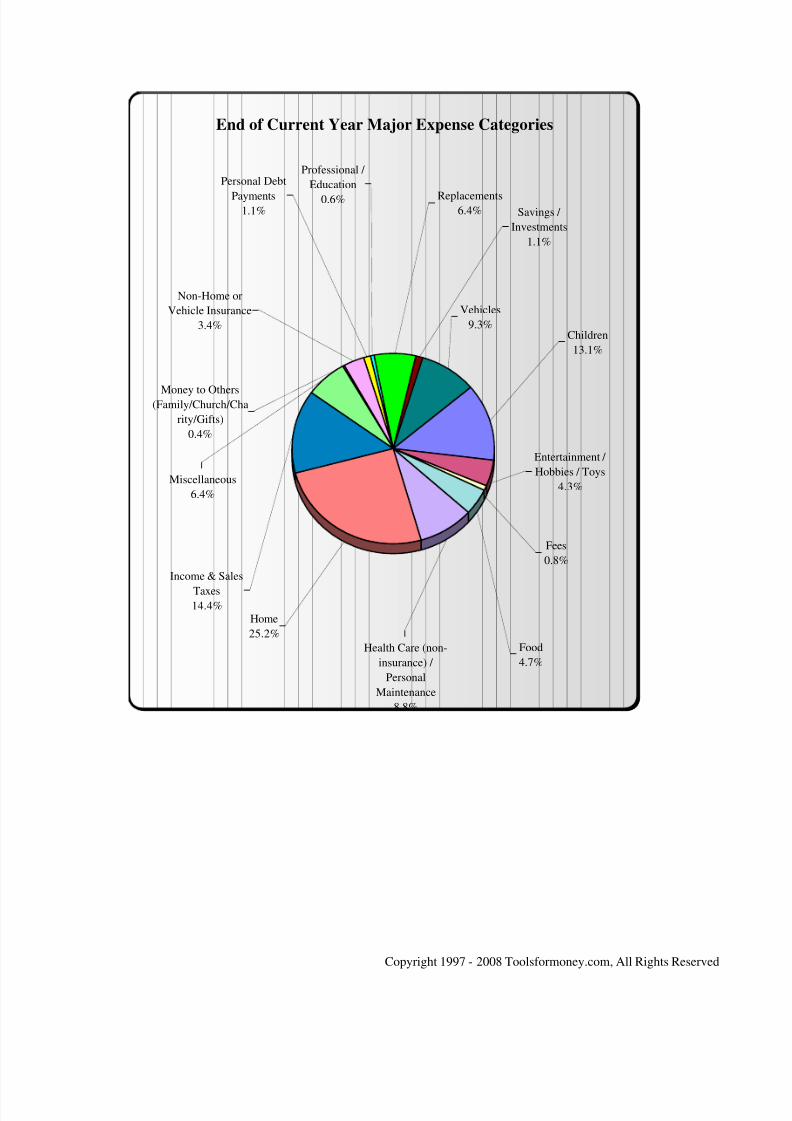
The chart, Snapshot of Major Expense Categories, helps in understanding what major
8/3/2019 Free Sample Plan1
http://slidepdf.com/reader/full/free-sample-plan1 12/41
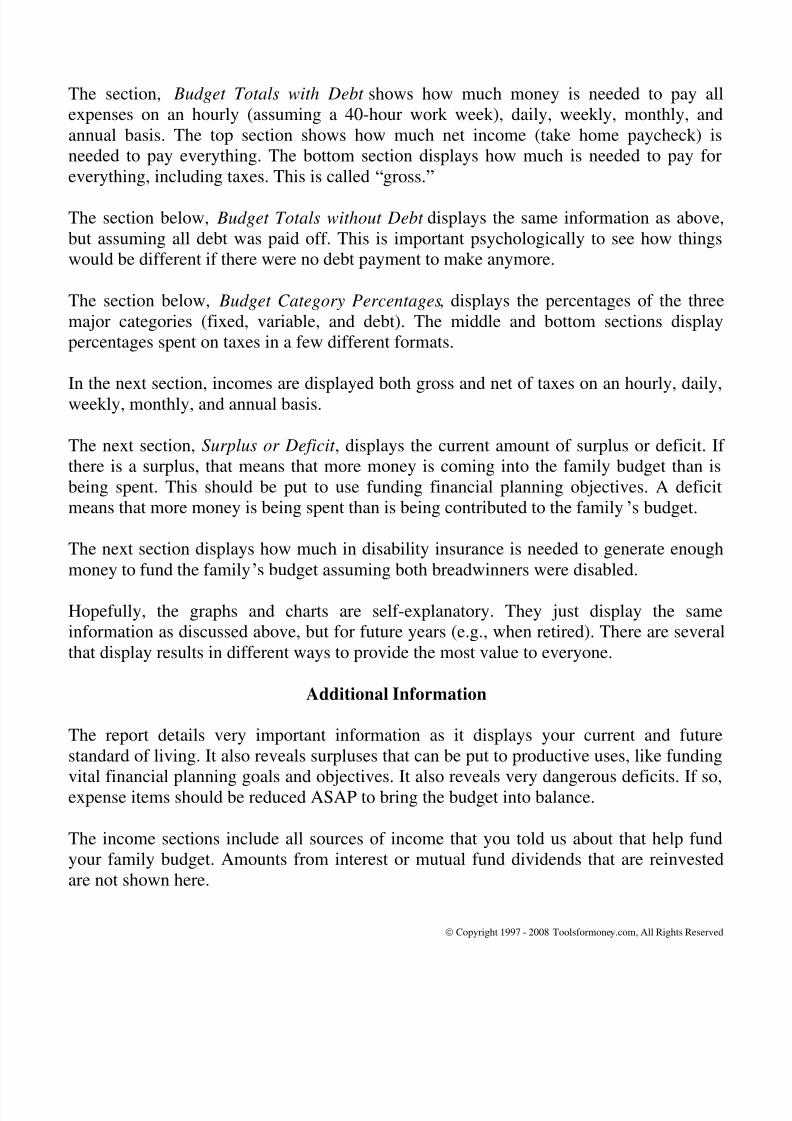
The section, Budget Totals with Debt shows how much money is needed to pay allexpenses on an hourly (assuming a 40-hour work week), daily, weekly, monthly, and
annual basis. The top section shows how much net income (take home paycheck) isneeded to pay everything. The bottom section displays how much is needed to pay foreverything, including taxes. This is called “gross.”
The section below, Budget Totals without Debt displays the same information as above,but assuming all debt was paid off. This is important psychologically to see how thingswould be different if there were no debt payment to make anymore.
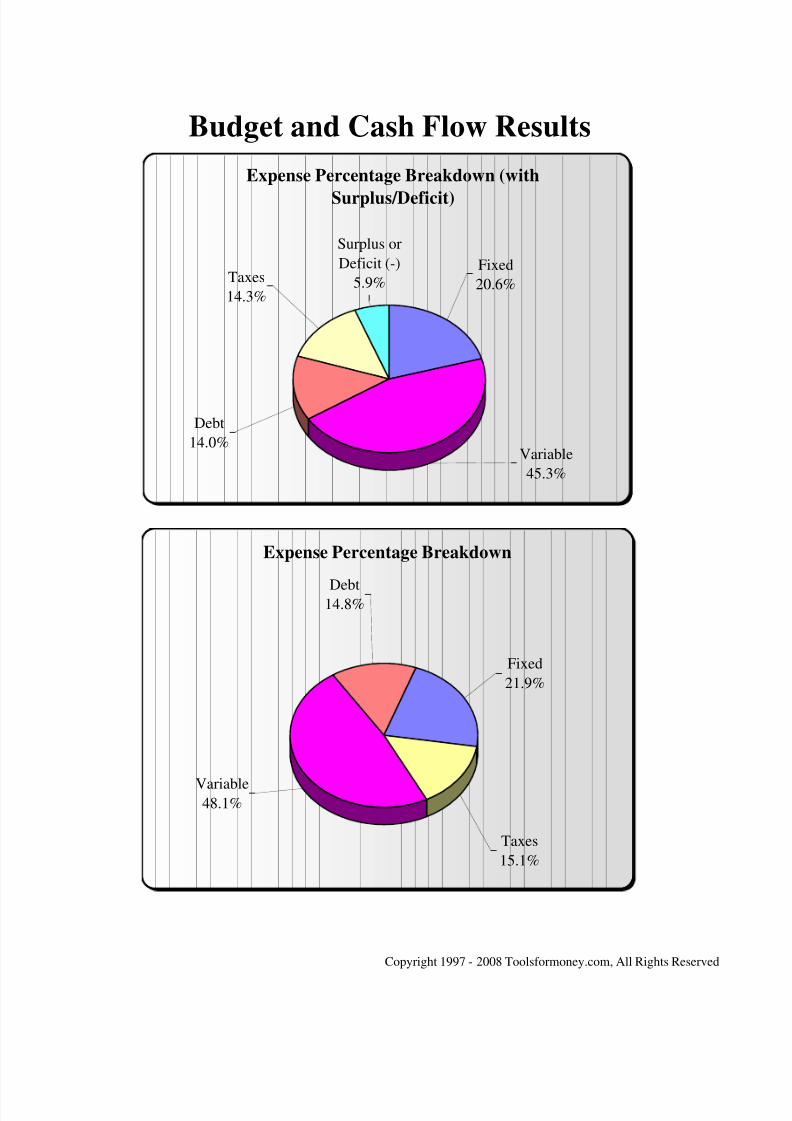
The section below, Budget Category Percentages, displays the percentages of the threemajor categories (fixed, variable, and debt). The middle and bottom sections displaypercentages spent on taxes in a few different formats.
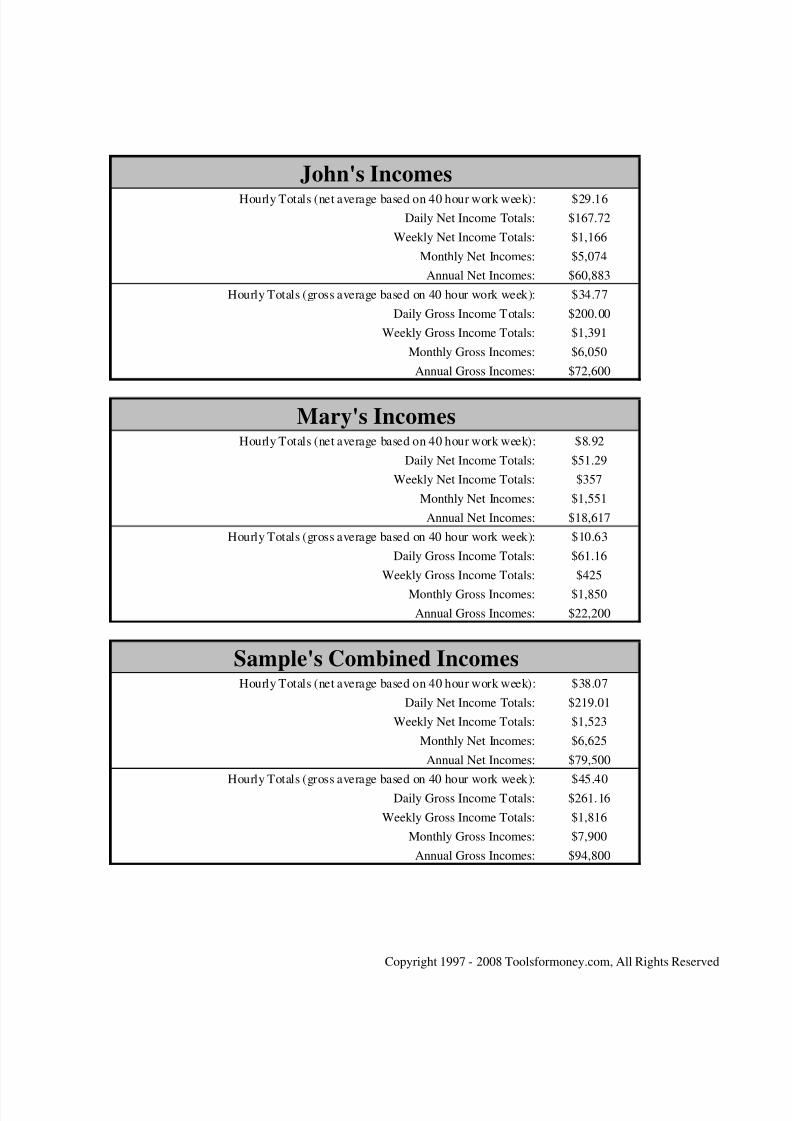
In the next section, incomes are displayed both gross and net of taxes on an hourly, daily,weekly, monthly, and annual basis.
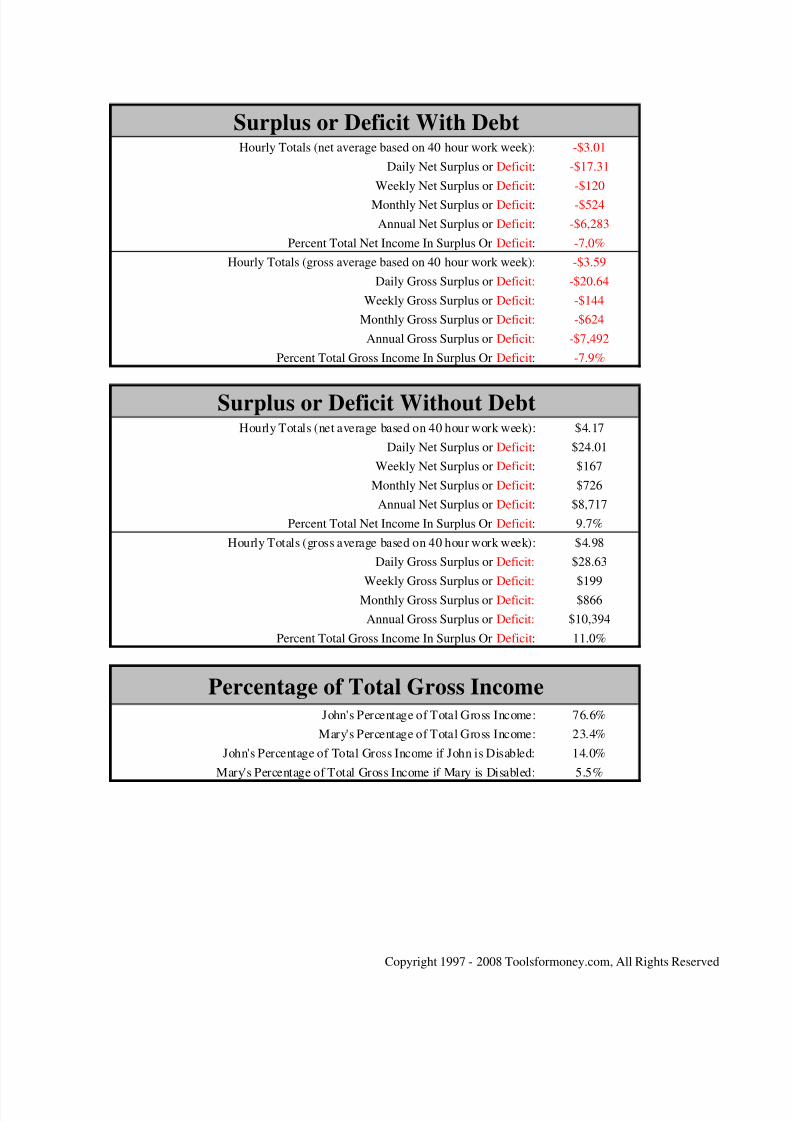
The next section, Surplus or Deficit , displays the current amount of surplus or deficit. If there is a surplus, that means that more money is coming into the family budget than isbeing spent. This should be put to use funding financial planning objectives. A deficitmeans that more money is being spent than is being contributed to the family’s budget.
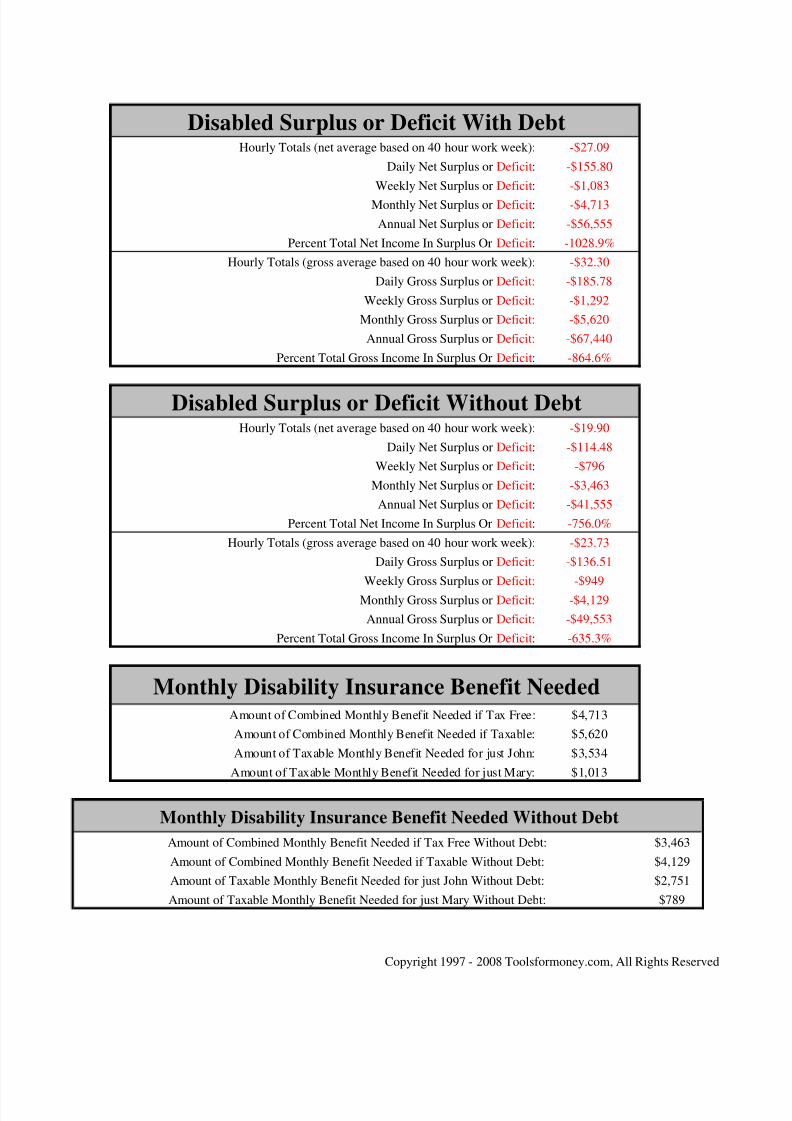
The next section displays how much in disability insurance is needed to generate enoughmoney to fund the family’s budget assuming both breadwinners were disabled.
Hopef ll the graph and chart are elf e planator The j t di pla the ame
8/3/2019 Free Sample Plan1
http://slidepdf.com/reader/full/free-sample-plan1 13/41
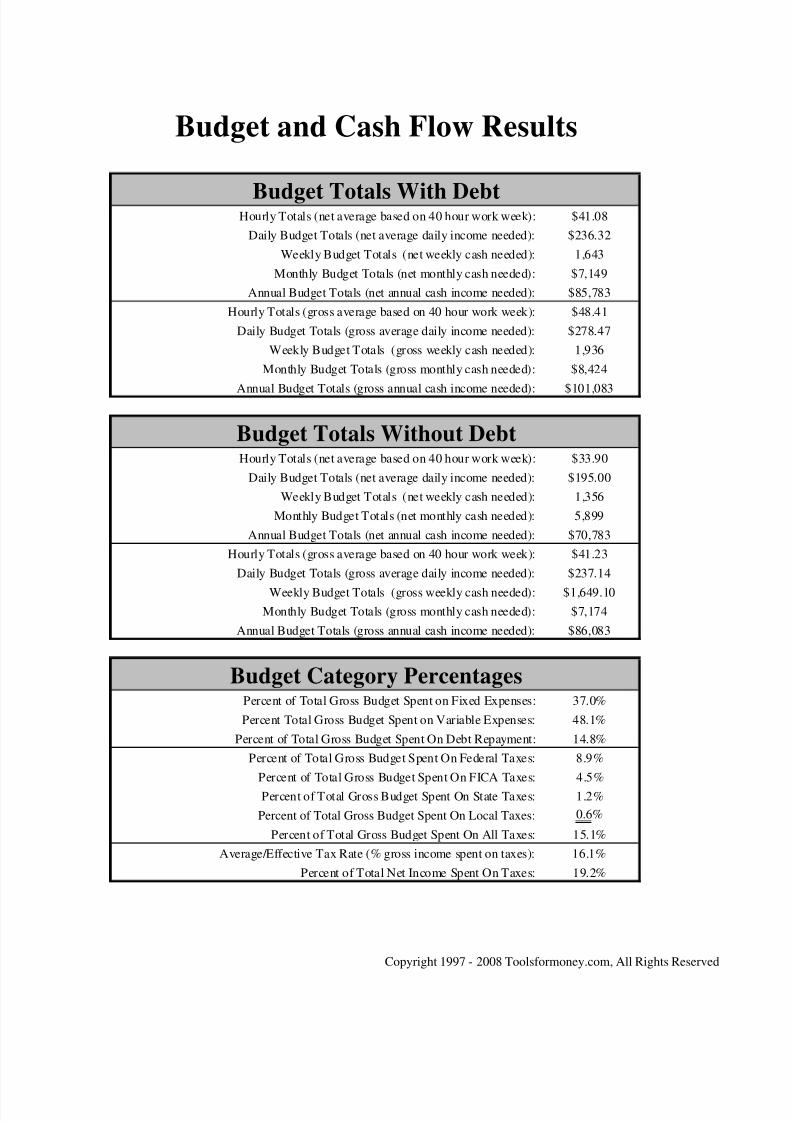
Budget and Cash Flow Results
Budget Totals With DebtHourly Totals (net average based on 40 hour work week): $41.08
Daily Budget Totals (net average daily income needed): $236.32
Weekly Budget Totals (net weekly cash needed): 1,643
Monthly Budget Totals (net monthly cash needed): $7,149Annual Budget Totals (net annual cash income needed): $85,783
Hourly Totals (gross average based on 40 hour work week): $48.41
Daily Budget Totals (gross average daily income needed): $278.47
Weekly Budget Totals (gross weekly cash needed): 1,936
Monthly Budget Totals (gross monthly cash needed): $8,424
Annual Budget Totals (gross annual cash income needed): $101,083
Budget Totals Without DebtHourly Totals (net average based on 40 hour work week): $33.90
Daily Budget Totals (net average daily income needed): $195.00
Weekly Budget Totals (net weekly cash needed): 1,356
Monthly Budget Totals (net monthly cash needed): 5,899
Annual Budget Totals (net annual cash income needed): $70,783
Hourly Totals (gross average based on 40 hour work week): $41.23Daily Budget Totals (gross average daily income needed): $237.14
Weekly Budget Totals (gross weekly cash needed): $1,649.10
M thl B d t T t l ( thl h d d) $7 174
8/3/2019 Free Sample Plan1
http://slidepdf.com/reader/full/free-sample-plan1 14/41
John's IncomesHourly Totals (net average based on 40 hour work week): $29.16
Daily Net Income Totals: $167.72
Weekly Net Income Totals: $1,166
Monthly Net Incomes: $5,074
Annual Net Incomes: $60,883Hourly Totals (gross average based on 40 hour work week): $34.77
Daily Gross Income Totals: $200.00
Weekly Gross Income Totals: $1,391
Monthly Gross Incomes: $6,050
Annual Gross Incomes: $72,600
Mary's IncomesHourly Totals (net average based on 40 hour work week): $8.92
Daily Net Income Totals: $51.29
Weekly Net Income Totals: $357
Monthly Net Incomes: $1,551
Annual Net Incomes: $18,617
Hourly Totals (gross average based on 40 hour work week): $10.63
Daily Gross Income Totals: $61.16
Weekly Gross Income Totals: $425
Monthly Gross Incomes: $1,850
$
8/3/2019 Free Sample Plan1
http://slidepdf.com/reader/full/free-sample-plan1 15/41
8/3/2019 Free Sample Plan1
http://slidepdf.com/reader/full/free-sample-plan1 16/41
Budget and Cash Flow Results
Fixed 21.9%
Fixed 20.60% Taxes 15.1%
Variable 45.33% Variable 48.1%Debt 13.97% Debt 14.8%
Taxes 14.25% 100.0%
Surplus or Defici 5.85%
$8,947
100.00%
Expense Percentage Breakdown (with
Surplus/Deficit)
Surplus or
Deficit (-)
5.9%Taxes14.3%
Fixed
20.6%
Variable
45.3%
Debt
14.0%
Expense Percentage Breakdown
Debt
14.8%
8/3/2019 Free Sample Plan1
http://slidepdf.com/reader/full/free-sample-plan1 17/41
End of Current Year Major Expense Categories
Vehicles
9.3%
Miscellaneous
6.4%
Money to Others
(Family/Church/Cha
rity/Gifts)0.4%
Income & Sales
Taxes
14.4%
Non-Home or
Vehicle Insurance
3.4%
Replacements
6.4%
Professional /
Education
0.6%
Personal Debt
Payments
1.1%
Children
13.1%
Entertainment /
Hobbies / Toys
4.3%
Fees
0.8%
Savings /
Investments
1.1%
8/3/2019 Free Sample Plan1
http://slidepdf.com/reader/full/free-sample-plan1 18/41
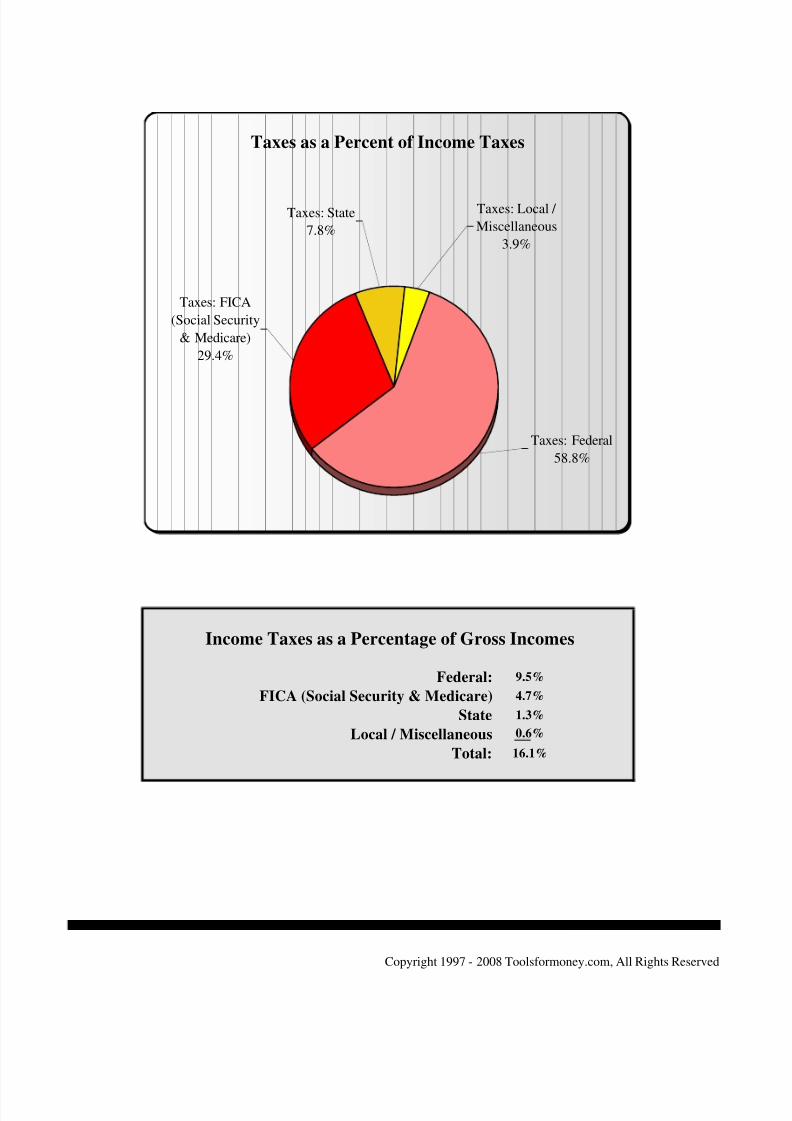
Taxes as a Percent of Income Taxes
Taxes: FICA
(Social Security
& Medicare)
29.4%
Taxes: Federal
58.8%
Taxes: State
7.8%
Taxes: Local /
Miscellaneous
3.9%
8/3/2019 Free Sample Plan1
http://slidepdf.com/reader/full/free-sample-plan1 19/41
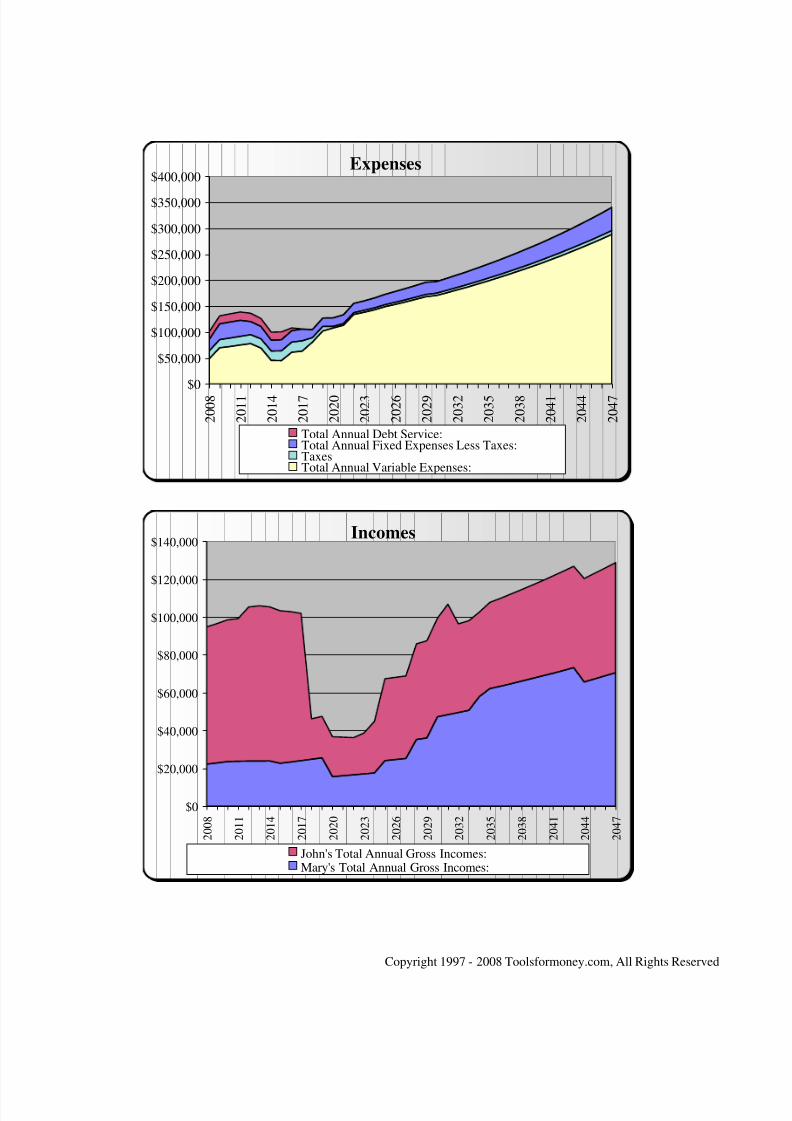
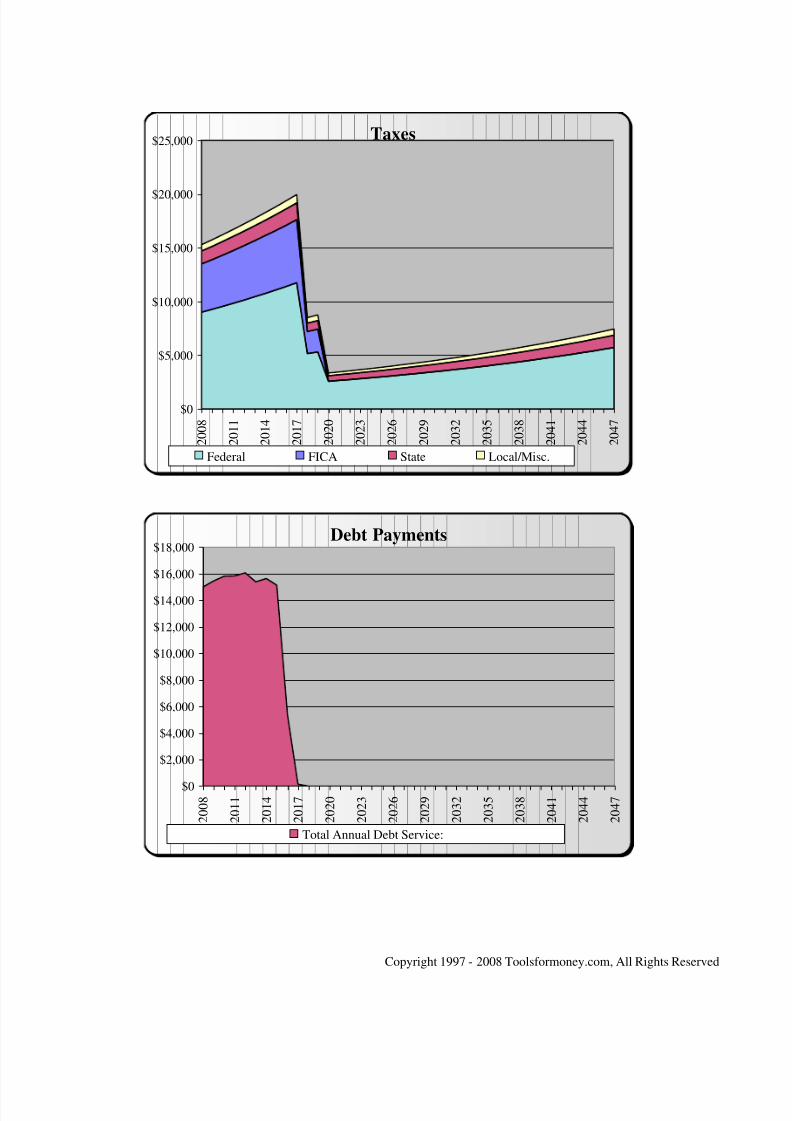
Taxes
Expenses
$0
$50,000
$100,000
$150,000
$200,000
$250,000
$300,000
$350,000
$400,000
2 0 0 8
2 0 1 1
2 0 1 4
2 0 1 7
2 0 2 0
2 0 2 3
2 0 2 6
2 0 2 9
2 0 3 2
2 0 3 5
2 0 3 8
2 0 4 1
2 0 4 4
2 0 4 7
Total Annual Debt Service:Total Annual Fixed Expenses Less Taxes:TaxesTotal Annual Variable Expenses:
Incomes
$120,000
$140,000
8/3/2019 Free Sample Plan1
http://slidepdf.com/reader/full/free-sample-plan1 20/41
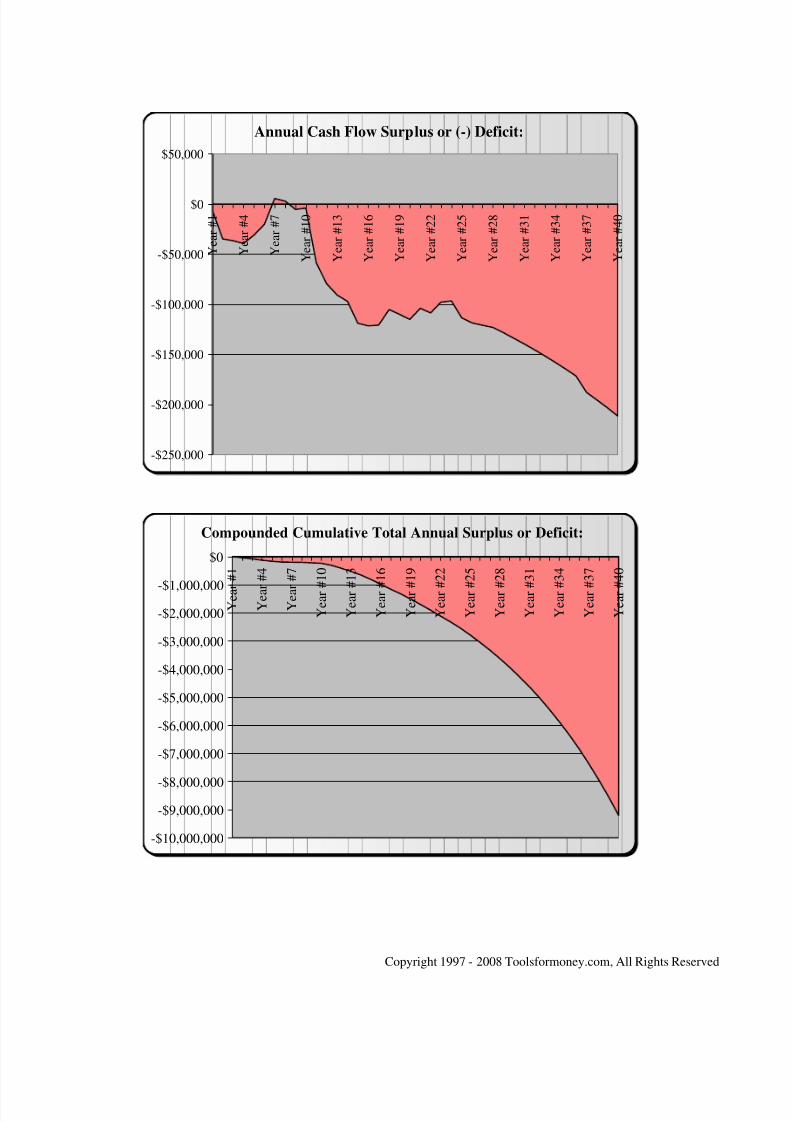
Annual Cash Flow Surplus or (-) Deficit:
-$250,000
-$200,000
-$150,000
-$100,000
-$50,000
$0
$50,000
Y e a r # 1
Y e a r # 4
Y e a r # 7
Y e a r # 1 0
Y e a r # 1 3
Y e a r # 1 6
Y e a r # 1 9
Y e a r # 2 2
Y e a r # 2 5
Y e a r # 2 8
Y e a r # 3 1
Y e a r # 3 4
Y e a r # 3 7
Y e a r # 4 0
Compounded Cumulative Total Annual Surplus or Deficit:
$
-$1,000,000
$0
Y e a r # 1
Y e a r # 4
Y e a r # 7
Y e a r # 1 0
Y e a r # 1 3
Y e a r # 1 6
Y e a r # 1 9
Y e a r # 2 2
Y e a r # 2 5
Y e a r # 2 8
Y e a r # 3 1
Y e a r # 3 4
Y e a r # 3 7
Y e a r # 4 0
8/3/2019 Free Sample Plan1
http://slidepdf.com/reader/full/free-sample-plan1 21/41
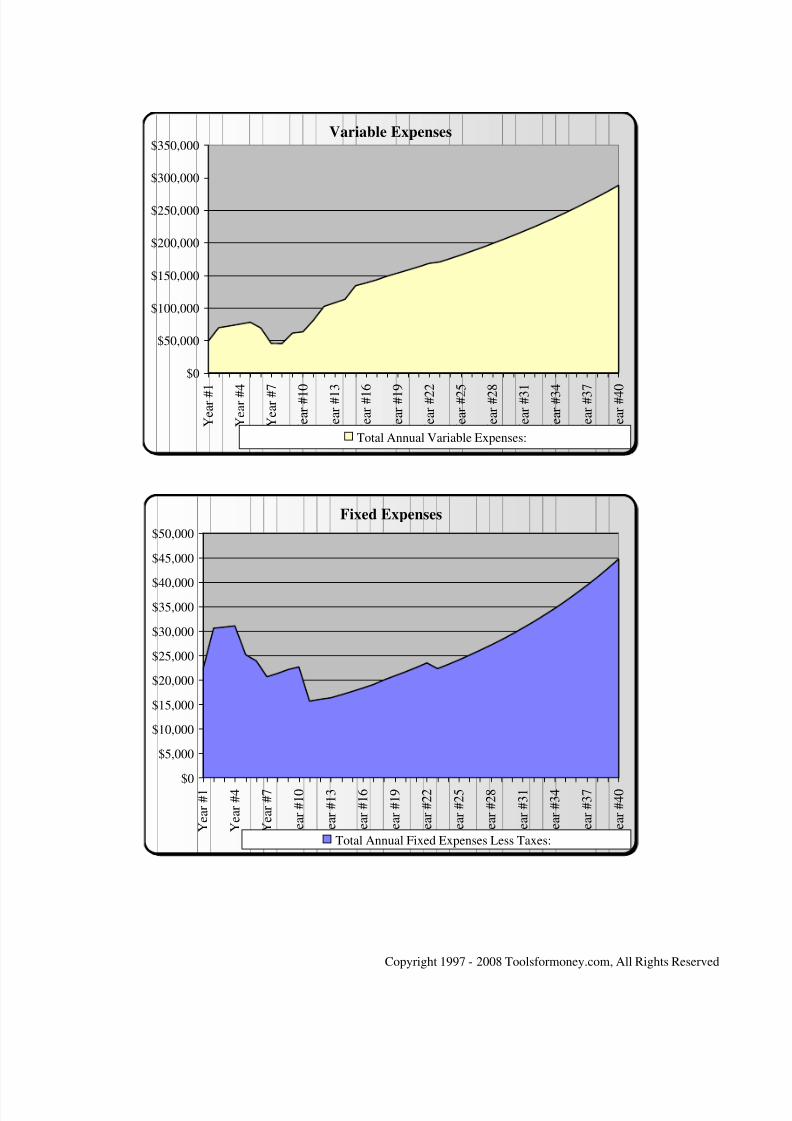
Variable Expenses
$0
$50,000
$100,000
$150,000
$200,000
$250,000
$300,000
$350,000
Y e a r # 1
Y e a r # 4
Y e a r # 7
Y e a
r # 1 0
Y e a
r # 1 3
Y e a
r # 1 6
Y e a
r # 1 9
Y e a
r # 2 2
Y e a
r # 2 5
Y e a
r # 2 8
Y e a
r # 3 1
Y e a
r # 3 4
Y e a
r # 3 7
Y e a
r # 4 0
Total Annual Variable Expenses:
Fixed Expenses
$35 000
$40,000
$45,000
$50,000
8/3/2019 Free Sample Plan1
http://slidepdf.com/reader/full/free-sample-plan1 22/41
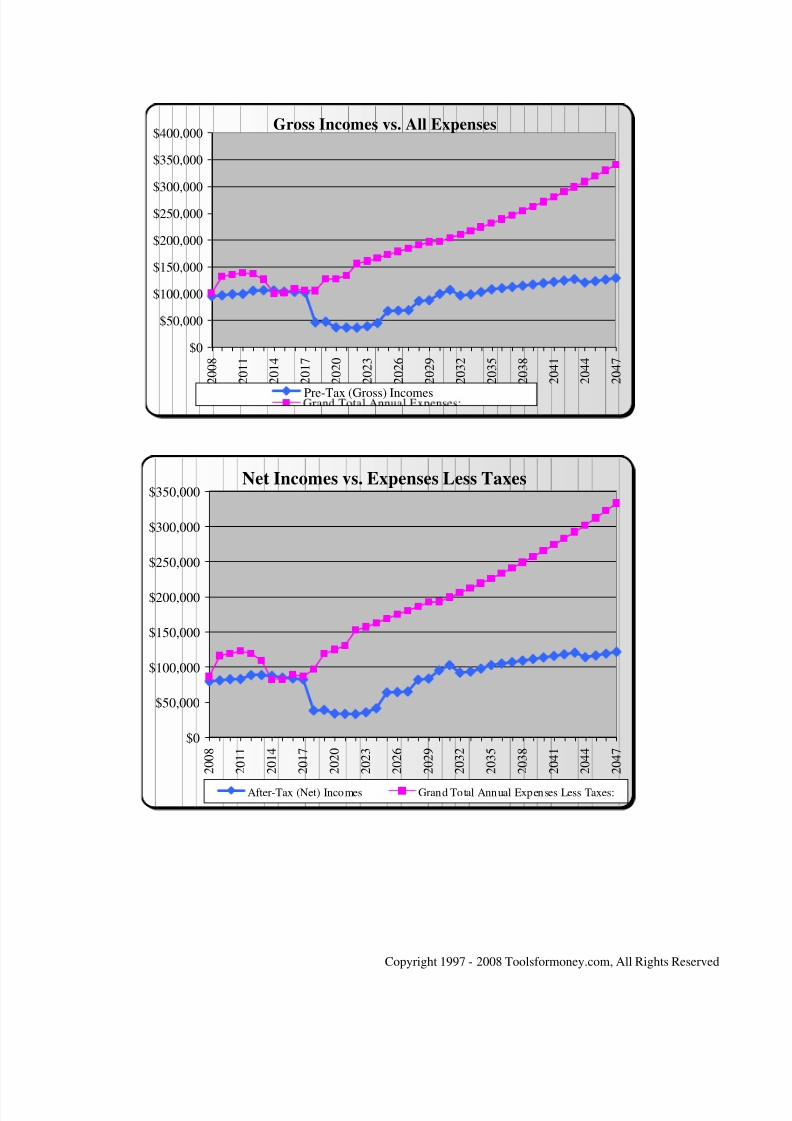
Gross Incomes vs. All Expenses
$0
$50,000
$100,000
$150,000
$200,000
$250,000
$300,000
$350,000
$400,000
2 0 0 8
2 0 1 1
2 0 1 4
2 0 1 7
2 0 2 0
2 0 2 3
2 0 2 6
2 0 2 9
2 0 3 2
2 0 3 5
2 0 3 8
2 0 4 1
2 0 4 4
2 0 4 7
Pre-Tax (Gross) Incomes
Net Incomes vs. Expenses Less Taxes
$200,000
$250,000
$300,000
$350,000
8/3/2019 Free Sample Plan1
http://slidepdf.com/reader/full/free-sample-plan1 23/41
Federal
FICA
State
Local/Misc.
Taxes
$0
$5,000
$10,000
$15,000
$20,000
$25,000
2 0 0 8
2 0 1 1
2 0 1 4
2 0 1 7
2 0 2 0
2 0 2 3
2 0 2 6
2 0 2 9
2 0 3 2
2 0 3 5
2 0 3 8
2 0 4 1
2 0 4 4
2 0 4 7
Federal FICA State Local/Misc.
Debt Payments
$14,000
$16,000
$18,000
8/3/2019 Free Sample Plan1
http://slidepdf.com/reader/full/free-sample-plan1 24/41
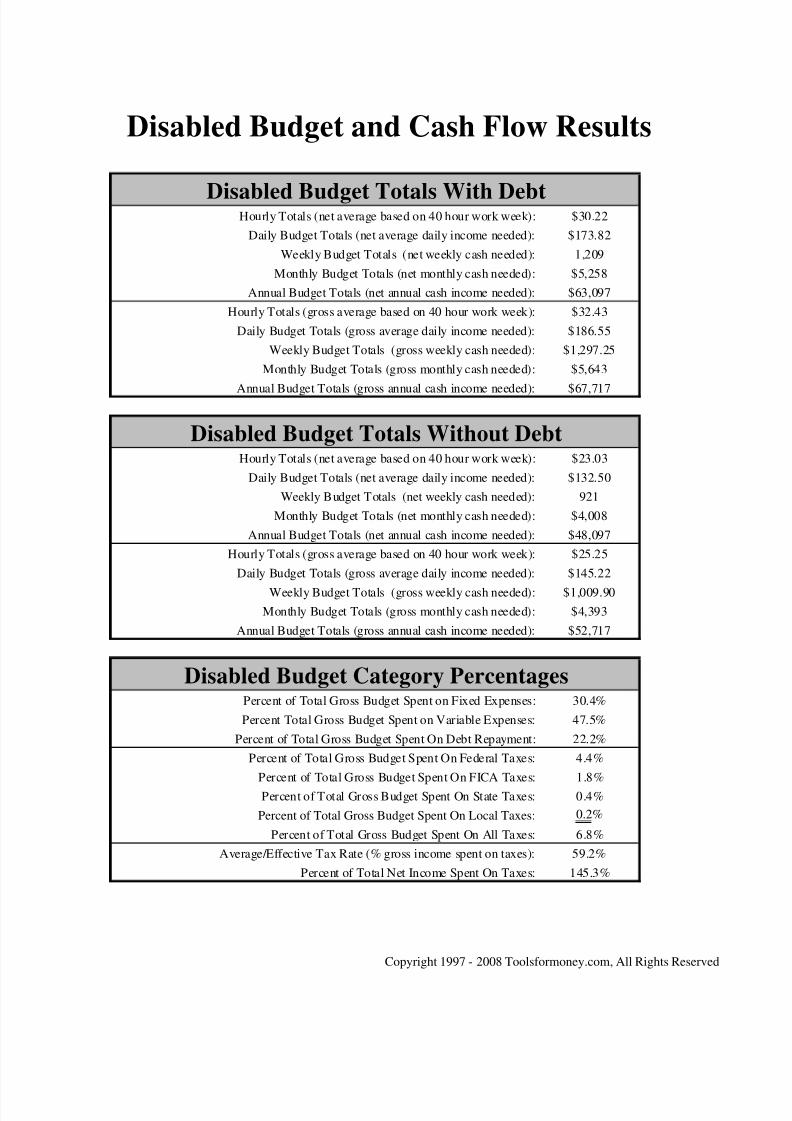
Disabled Budget and Cash Flow Results
Disabled Budget Totals With DebtHourly Totals (net average based on 40 hour work week): $30.22
Daily Budget Totals (net average daily income needed): $173.82
Weekly Budget Totals (net weekly cash needed): 1,209
Monthly Budget Totals (net monthly cash needed): $5,258Annual Budget Totals (net annual cash income needed): $63,097
Hourly Totals (gross average based on 40 hour work week): $32.43
Daily Budget Totals (gross average daily income needed): $186.55
Weekly Budget Totals (gross weekly cash needed): $1,297.25
Monthly Budget Totals (gross monthly cash needed): $5,643
Annual Budget Totals (gross annual cash income needed): $67,717
Disabled Budget Totals Without DebtHourly Totals (net average based on 40 hour work week): $23.03
Daily Budget Totals (net average daily income needed): $132.50
Weekly Budget Totals (net weekly cash needed): 921
Monthly Budget Totals (net monthly cash needed): $4,008
Annual Budget Totals (net annual cash income needed): $48,097
Hourly Totals (gross average based on 40 hour work week): $25.25Daily Budget Totals (gross average daily income needed): $145.22
Weekly Budget Totals (gross weekly cash needed): $1,009.90
M thl B d t T t l ( thl h d d) $4 393
8/3/2019 Free Sample Plan1
http://slidepdf.com/reader/full/free-sample-plan1 25/41
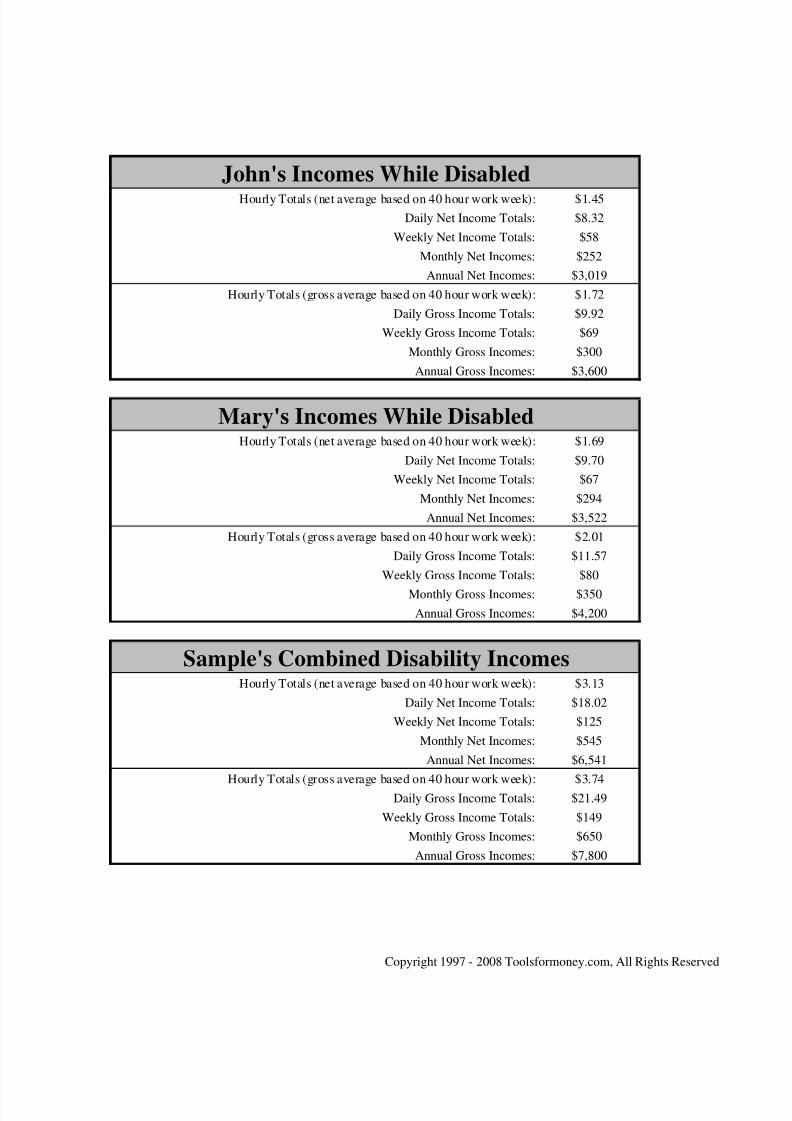
John's Incomes While DisabledHourly Totals (net average based on 40 hour work week): $1.45
Daily Net Income Totals: $8.32
Weekly Net Income Totals: $58
Monthly Net Incomes: $252
Annual Net Incomes: $3,019Hourly Totals (gross average based on 40 hour work week): $1.72
Daily Gross Income Totals: $9.92
Weekly Gross Income Totals: $69
Monthly Gross Incomes: $300
Annual Gross Incomes: $3,600
Mary's Incomes While DisabledHourly Totals (net average based on 40 hour work week): $1.69
Daily Net Income Totals: $9.70
Weekly Net Income Totals: $67
Monthly Net Incomes: $294
Annual Net Incomes: $3,522
Hourly Totals (gross average based on 40 hour work week): $2.01
Daily Gross Income Totals: $11.57Weekly Gross Income Totals: $80
Monthly Gross Incomes: $350
$
8/3/2019 Free Sample Plan1
http://slidepdf.com/reader/full/free-sample-plan1 26/41
Disabled Surplus or Deficit With DebtHourly Totals (net average based on 40 hour work week): -$27.09
Daily Net Surplus or Deficit: -$155.80
Weekly Net Surplus or Deficit: -$1,083
Monthly Net Surplus or Deficit: -$4,713
Annual Net Surplus or Deficit: -$56,555
Percent Total Net Income In Surplus Or Deficit: -1028.9%
Hourly Totals (gross average based on 40 hour work week): -$32.30
Daily Gross Surplus or Deficit: -$185.78Weekly Gross Surplus or Deficit: -$1,292
Monthly Gross Surplus or Deficit: -$5,620
Annual Gross Surplus or Deficit: -$67,440
Percent Total Gross Income In Surplus Or Deficit: -864.6%
Disabled Surplus or Deficit Without DebtHourly Totals (net average based on 40 hour work week): -$19.90
Daily Net Surplus or Deficit: -$114.48
Weekly Net Surplus or Deficit: -$796
Monthly Net Surplus or Deficit: -$3,463
Annual Net Surplus or Deficit: -$41,555
Percent Total Net Income In Surplus Or Deficit: -756.0%
Hourly Totals (gross average based on 40 hour work week): -$23.73
Daily Gross Surplus or Deficit: -$136.51
Weekly Gross Surplus or Deficit: -$949
Monthly Gross Surplus or Deficit: -$4,129
8/3/2019 Free Sample Plan1
http://slidepdf.com/reader/full/free-sample-plan1 27/41
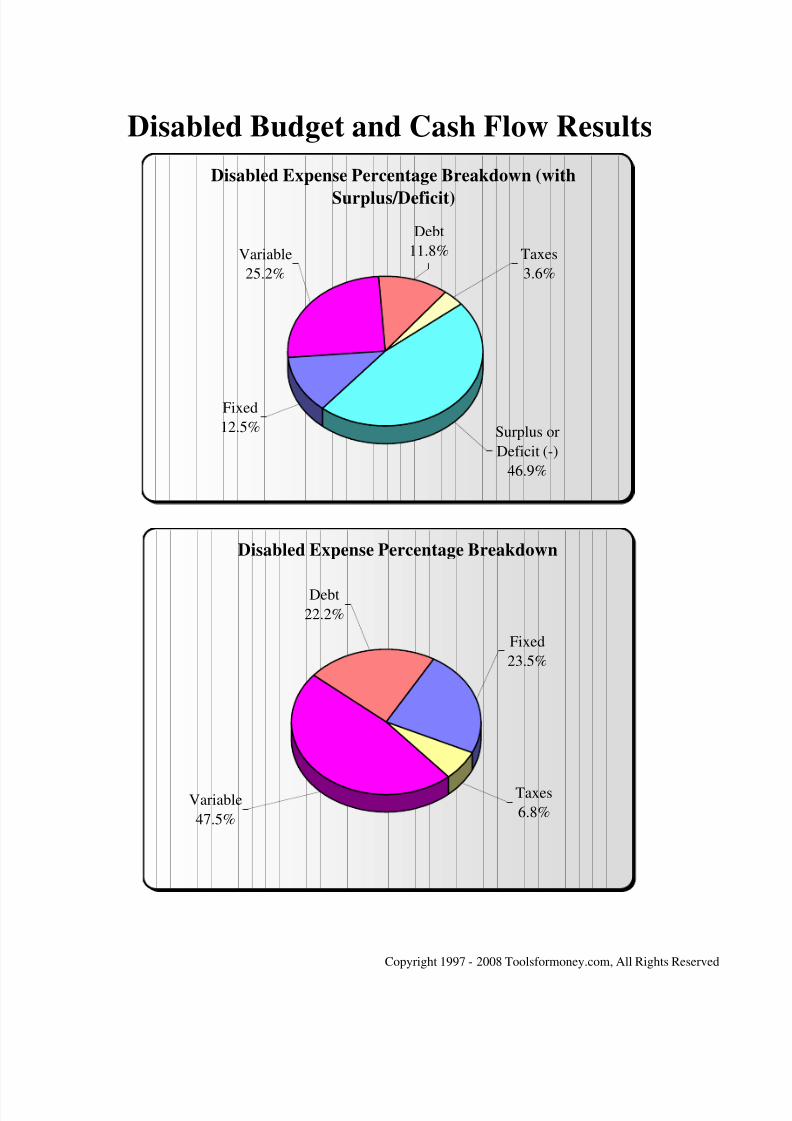
Disabled Budget and Cash Flow Results
Fixed 23.5%
Fixed 12.49% Taxes 6.8%
Variable25.19%
Variable 47.5%Debt 11.75% Debt 22.2%
Taxes 3.62% 100.0%
Surplus or Defici 46.94%
$10,636
100.00%
Disabled Expense Percentage Breakdown
Debt
Disabled Expense Percentage Breakdown (with
Surplus/Deficit)
Debt
11.8%Variable
25.2%
Fixed
12.5%
Taxes
3.6%
Surplus or
Deficit (-)
46.9%
8/3/2019 Free Sample Plan1
http://slidepdf.com/reader/full/free-sample-plan1 28/41
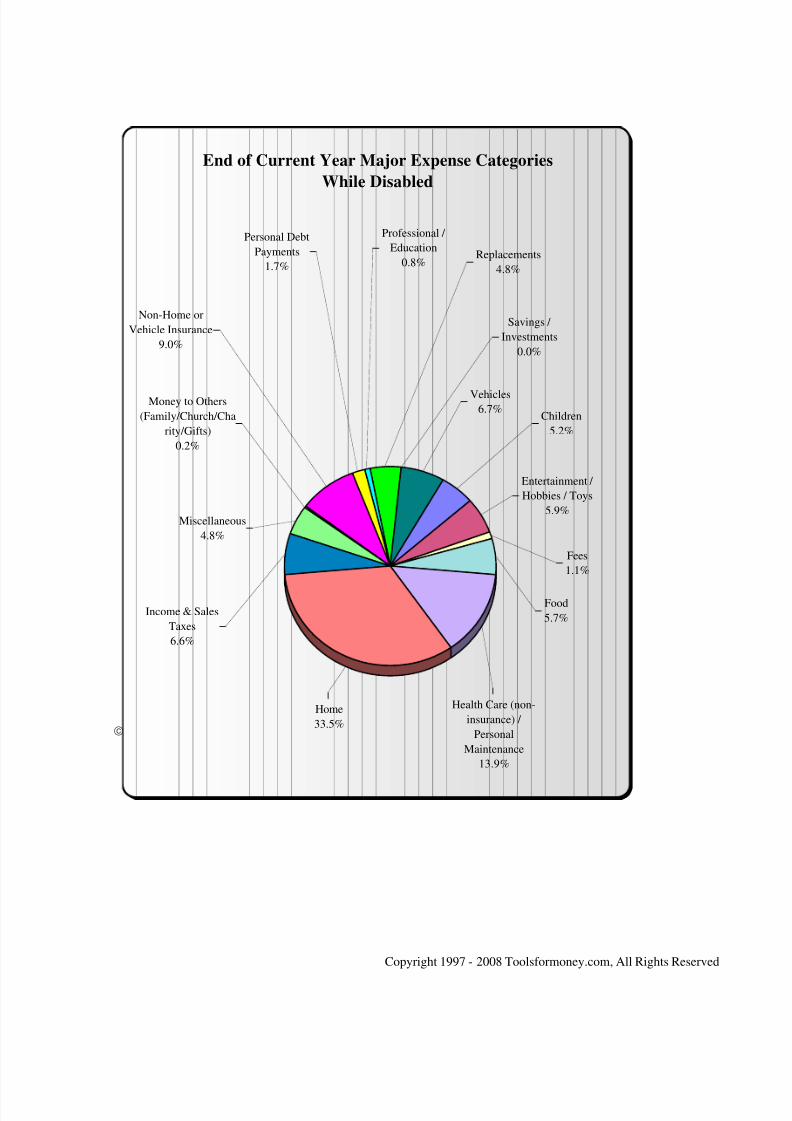
End of Current Year Major Expense Categories
While Disabled
Vehicles
6.7%
Savings /
Investments
0.0%
Miscellaneous
4.8%
Money to Others
(Family/Church/Charity/Gifts)
0.2%
I & S l
Non-Home or
Vehicle Insurance
9.0%
Replacements
4.8%
Professional /
Education
0.8%
Personal Debt
Payments
1.7%
Food
Children5.2%
Entertainment /
Hobbies / Toys
5.9%
Fees1.1%
8/3/2019 Free Sample Plan1
http://slidepdf.com/reader/full/free-sample-plan1 29/41
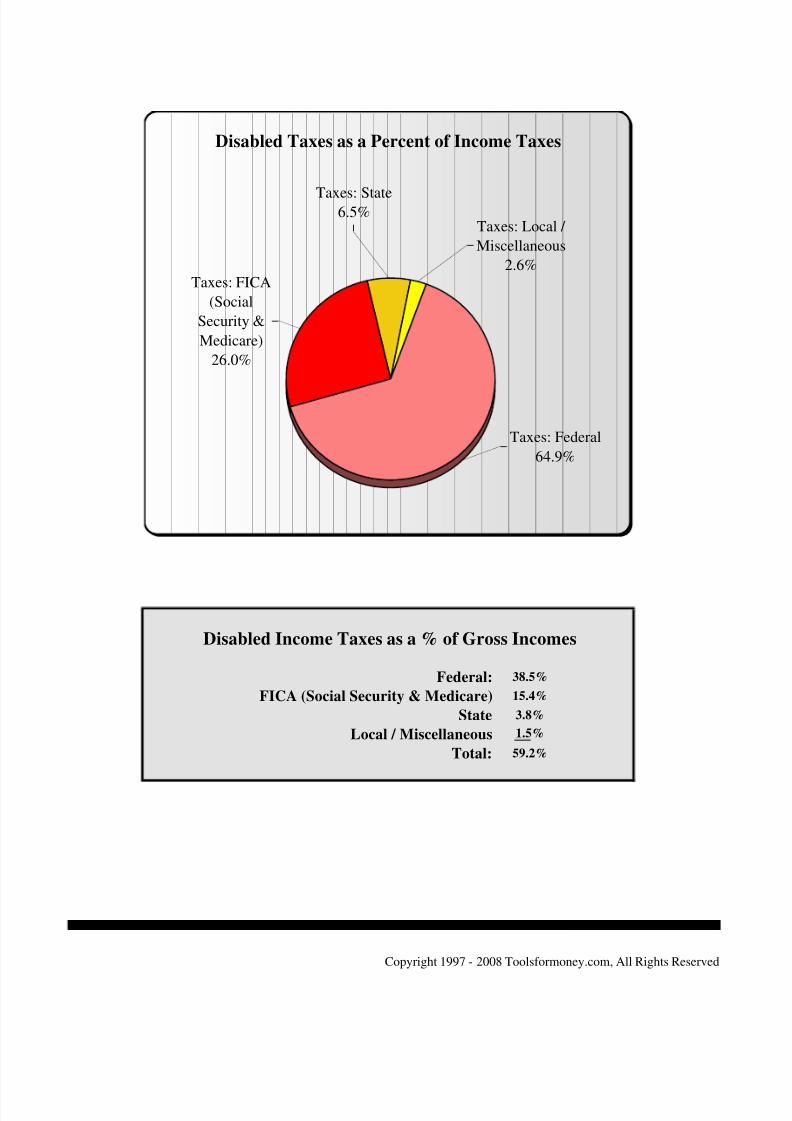
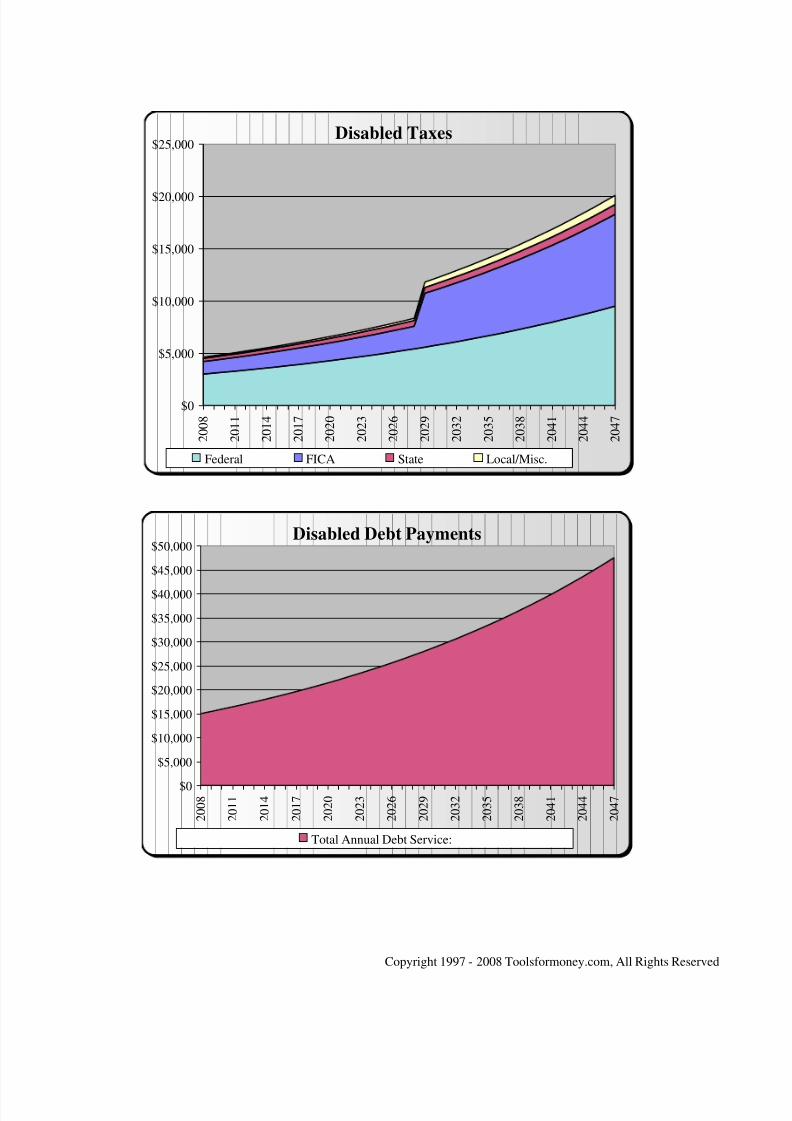
Disabled Taxes as a Percent of Income Taxes
Taxes: Local /
Miscellaneous
2.6%
Taxes: State
6.5%
Taxes: Federal
64.9%
Taxes: FICA(Social
Security &
Medicare)
26.0%
8/3/2019 Free Sample Plan1
http://slidepdf.com/reader/full/free-sample-plan1 30/41
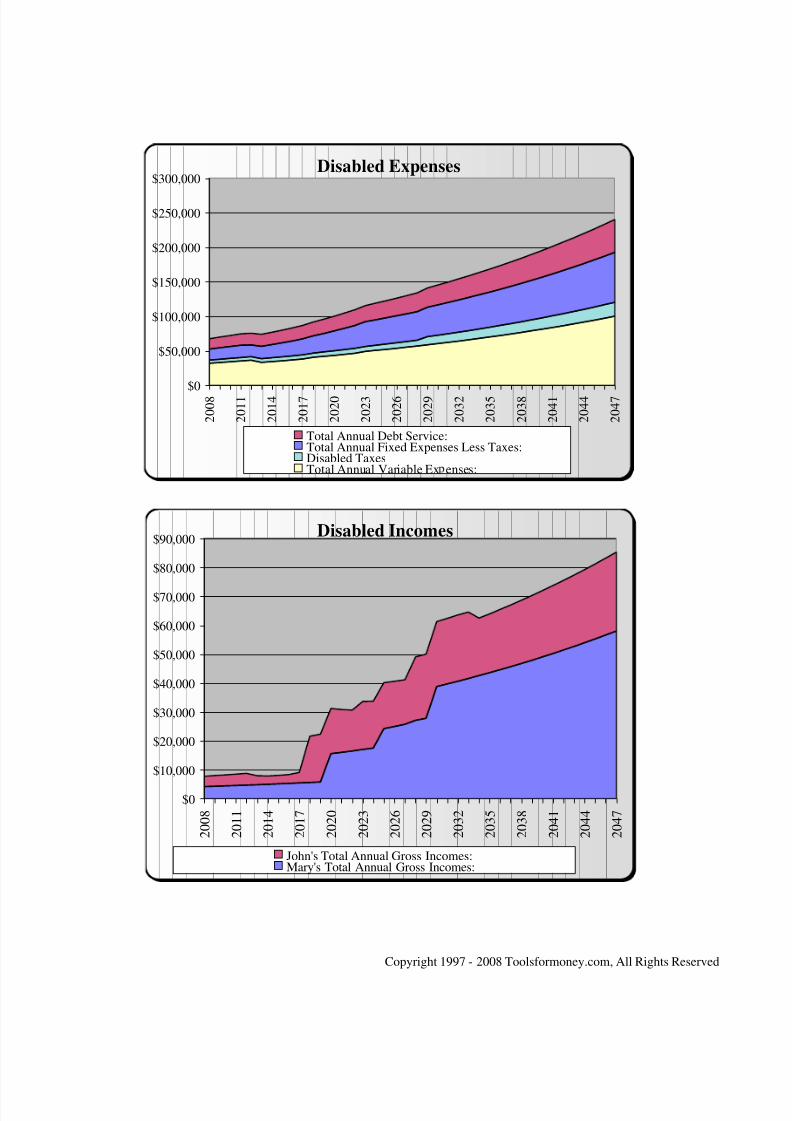
Disabled Taxes
Disabled Incomes
$70,000
$80,000
$90,000
Disabled Expenses
$0
$50,000
$100,000
$150,000
$200,000
$250,000
$300,000
2
0 0 8
2
0 1 1
2
0 1 4
2
0 1 7
2
0 2 0
2
0 2 3
2
0 2 6
2
0 2 9
2
0 3 2
2
0 3 5
2
0 3 8
2
0 4 1
2
0 4 4
2
0 4 7
Total Annual Debt Service:Total Annual Fixed Expenses Less Taxes:Disabled TaxesTotal Annual Variable Ex enses:
8/3/2019 Free Sample Plan1
http://slidepdf.com/reader/full/free-sample-plan1 31/41
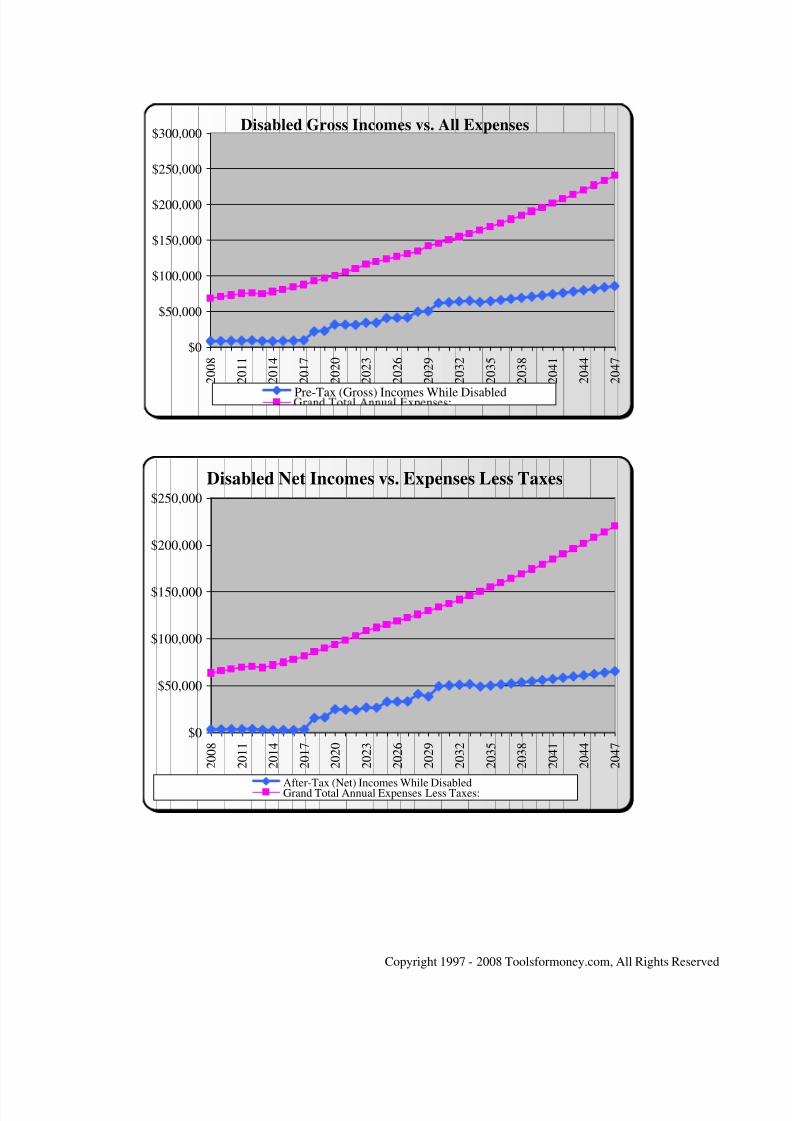
Disabled Gross Incomes vs. All Expenses
$0
$50,000
$100,000
$150,000
$200,000
$250,000
$300,000
2 0 0 8
2 0 1 1
2 0 1 4
2 0 1 7
2 0 2 0
2 0 2 3
2 0 2 6
2 0 2 9
2 0 3 2
2 0 3 5
2 0 3 8
2 0 4 1
2 0 4 4
2 0 4 7
Pre-Tax (Gross) Incomes While Disabled
Disabled Net Incomes vs. Expenses Less Taxes
$150,000
$200,000
$250,000
8/3/2019 Free Sample Plan1
http://slidepdf.com/reader/full/free-sample-plan1 32/41
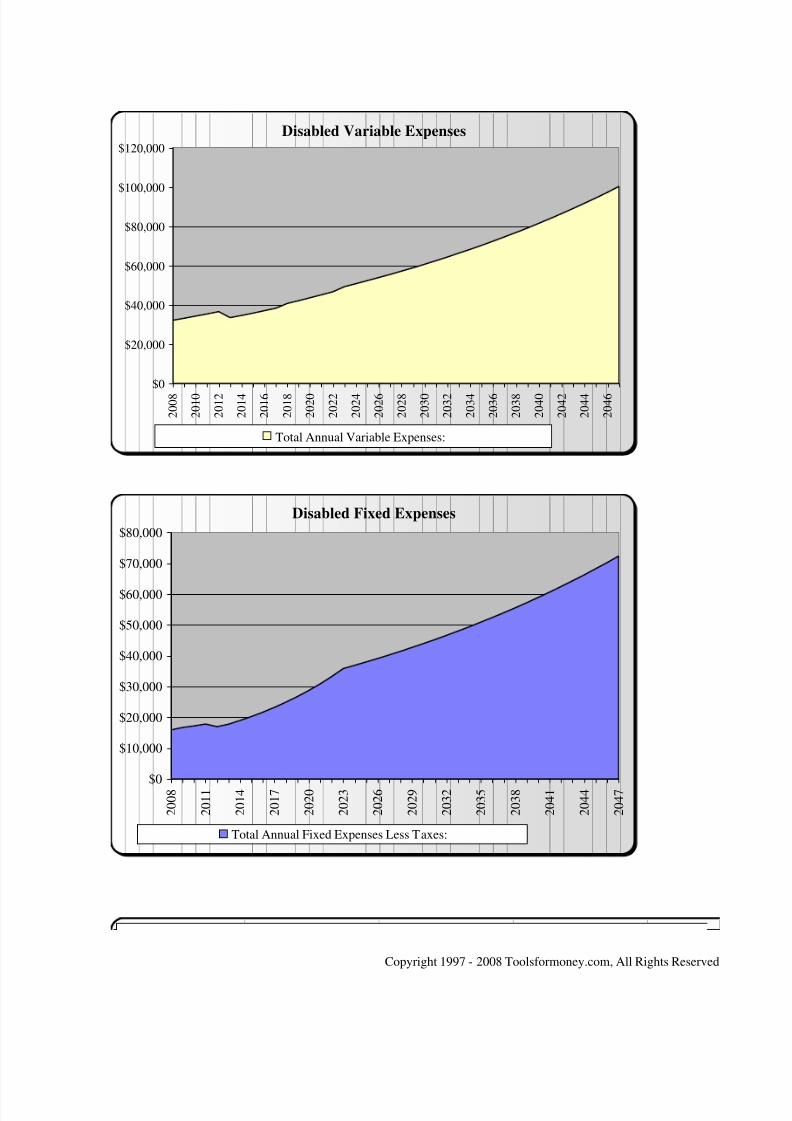
Disabled Variable Expenses
$0
$20,000
$40,000
$60,000
$80,000
$100,000
$120,000
2 0 0 8
2 0 1 0
2 0 1 2
2 0 1 4
2 0 1 6
2 0 1 8
2 0 2 0
2 0 2 2
2 0 2 4
2 0 2 6
2 0 2 8
2 0 3 0
2 0 3 2
2 0 3 4
2 0 3 6
2 0 3 8
2 0 4 0
2 0 4 2
2 0 4 4
2 0 4 6
Total Annual Variable Expenses:
Disabled Fixed Expenses
$60,000
$70,000
$80,000
8/3/2019 Free Sample Plan1
http://slidepdf.com/reader/full/free-sample-plan1 33/41
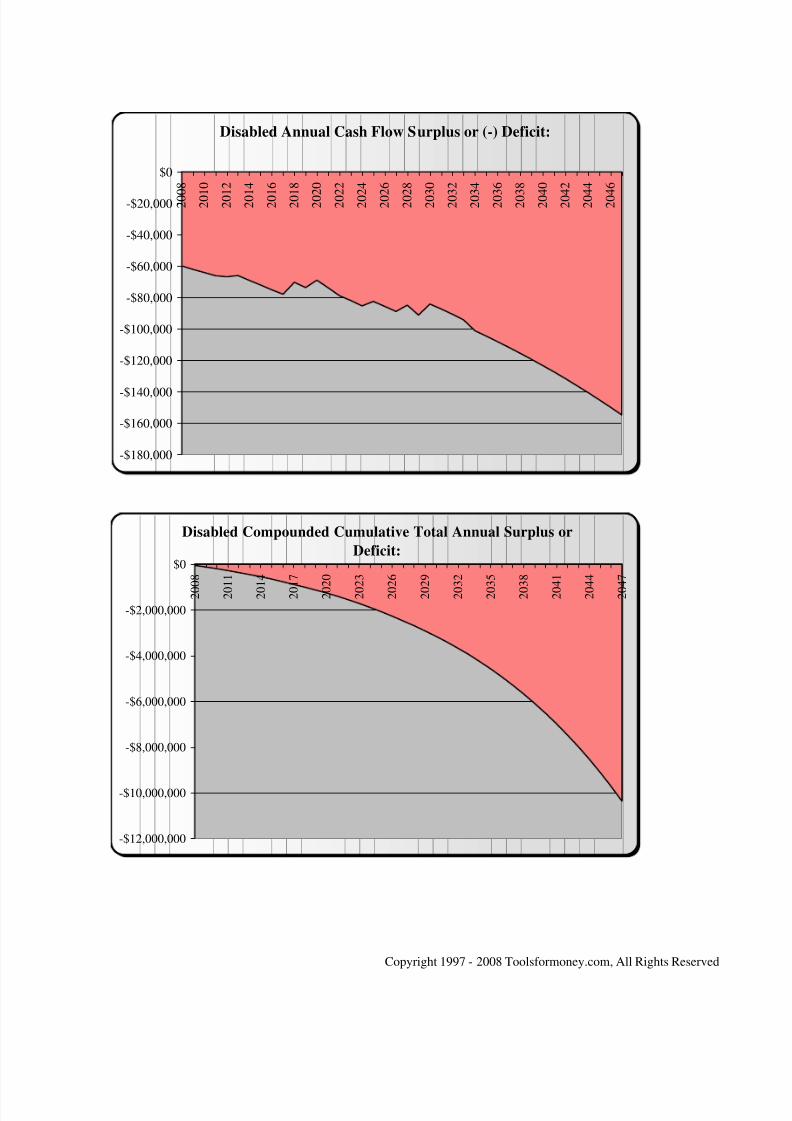
Disabled Compounded Cumulative Total Annual Surplus or
Deficit:
$2 000 000
$0
2 0 0 8
2 0 1 1
2 0 1 4
2 0 1 7
2 0 2 0
2 0 2 3
2 0 2 6
2 0 2 9
2 0 3 2
2 0 3 5
2 0 3 8
2 0 4 1
2 0 4 4
2 0 4 7
Disabled Annual Cash Flow Surplus or (-) Deficit:
-$180,000
-$160,000
-$140,000
-$120,000
-$100,000
-$80,000
-$60,000
-$40,000
-$20,000
$0
2 0 0 8
2 0 1 0
2 0 1 2
2 0 1 4
2 0 1 6
2 0 1 8
2 0 2 0
2 0 2 2
2 0 2 4
2 0 2 6
2 0 2 8
2 0 3 0
2 0 3 2
2 0 3 4
2 0 3 6
2 0 3 8
2 0 4 0
2 0 4 2
2 0 4 4
2 0 4 6
8/3/2019 Free Sample Plan1
http://slidepdf.com/reader/full/free-sample-plan1 34/41
8/3/2019 Free Sample Plan1
http://slidepdf.com/reader/full/free-sample-plan1 35/41
NET WORTH REPORT EXPLANATION
REAL WORLD PERSONAL FINANCIAL SOFTWARE 2130 9
thSt. W #166 Whitefish, MT 59912-4416 (406) 257-1182
MichealaFulford ,_ CFA [email protected] http://www.toolsformoney.com/
OVERVIEW OF THE NET WORTH REPORTS
This text is to help you understand the overall concepts, and the technical details, of the net
worth reports.
The data used to generate the reports came from a combination of fact finders, your
financial statements, assumptions, and estimates. These values change daily, so there will
always be a level of inaccuracy that can’t be avoided.
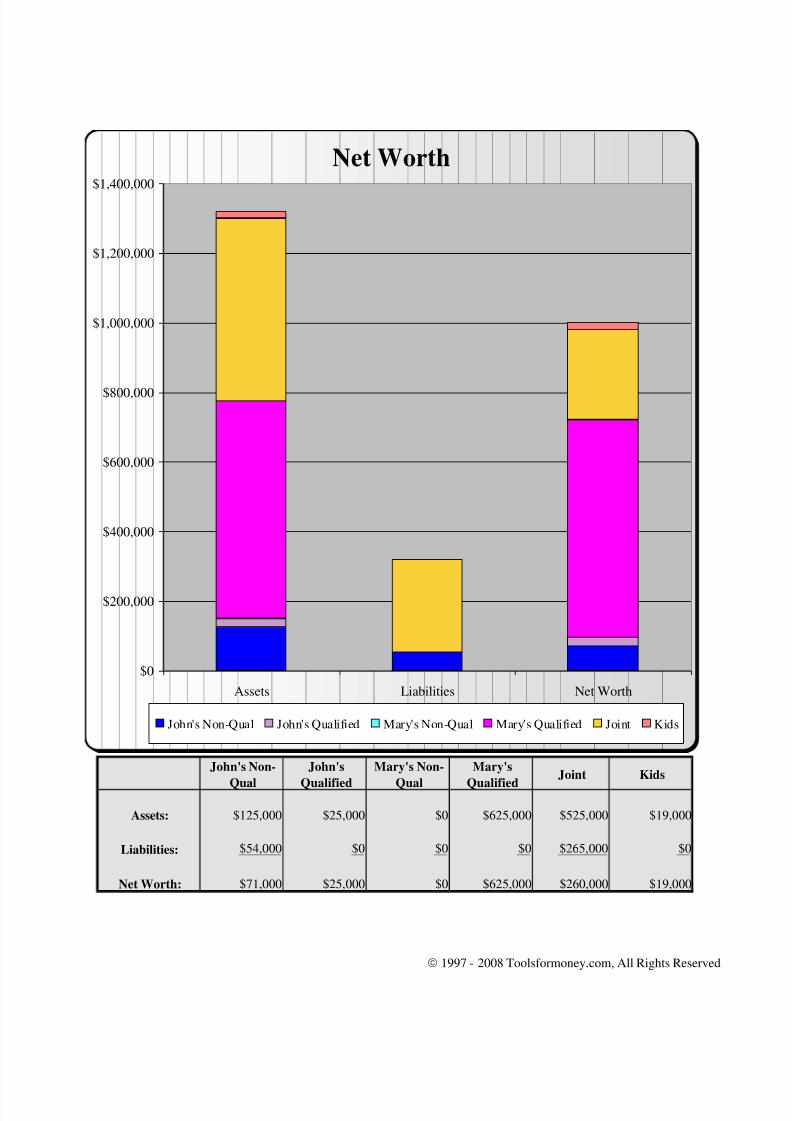
The Current Net Worth Statement page presents a top-level summary of “where you are
now.” This is a snapshot of where you were at the time of Discovery (they are not
projected end-of-year values).
Assets and liabilities are both stated using their current market values. Net worth is the
result assuming that all assets were sold at their market values, no taxes were deducted,
and then all liabilities were subtracted. This is an estimate of your wealth.
This data is then presented in both bar chart and pie chart form.
8/3/2019 Free Sample Plan1
http://slidepdf.com/reader/full/free-sample-plan1 36/41
Each account is shown with a pie chart, and then the same thing is shown totaling
everyone’s assets added together (again with a pie chart).
The next page, Asset Values Before and After Capital Gains Taxes estimates how much of
a decrease in assets will be applied after paying capital gains taxes upon their sale.
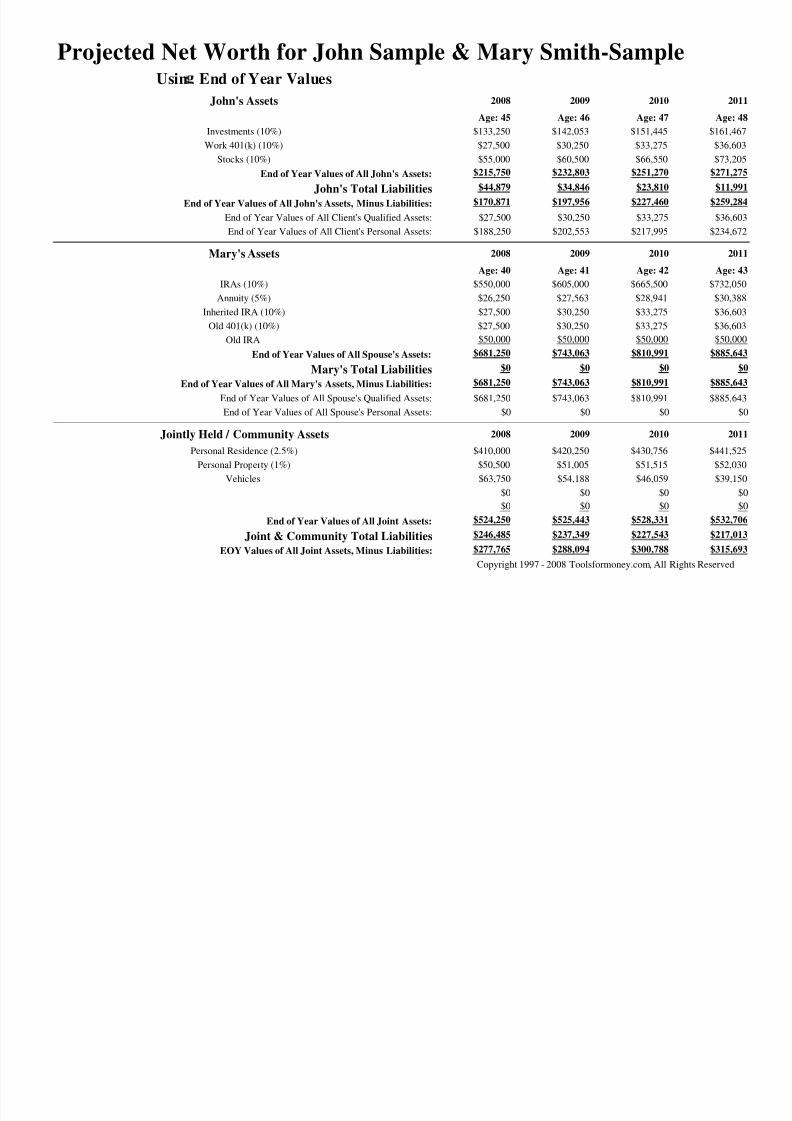
Projecting the Future
This report illustrates how your net worth will change over time.
Next to each asset is its growth rate input into the global rate of return field.
These values are all estimates of what they will be at the end of each year. This is why
they are different than what’s shown on the snapshot pages above. These values will
include growth, shrinkage, additions, withdrawals, and paying off liabilities over time.
Each person’s assets, liabilities, and resulting net worth is projected annually. Then each
person’s values are combined to display the same bottom-line information for the family
as a whole.
For each adult, there are also two rows that display assets by tax-qualified and non-tax-
qualified assets. This helps visualize how retirement assets are doing compared to personalassets.
Underneath the assets section e er one’s liabilities are detailed Underneath the liabilities
8/3/2019 Free Sample Plan1
http://slidepdf.com/reader/full/free-sample-plan1 37/41
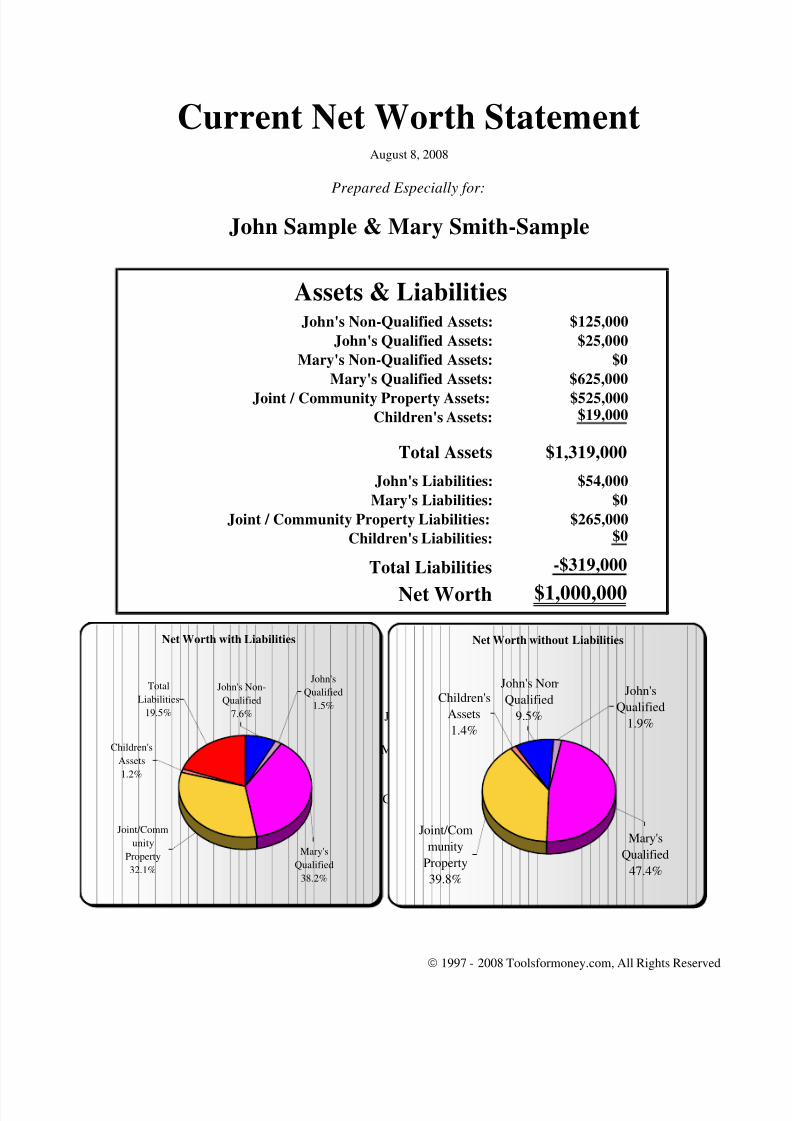
Current Net Worth StatementAugust 8, 2008
Prepared Especially for:
John Sample & Mary Smith-Sample
Assets & LiabilitiesJohn's Non-Qualified Assets: $125,000
John's Qualified Assets: $25,000
Mary's Non-Qualified Assets: $0
Mary's Qualified Assets: $625,000
Joint / Community Property Assets: $525,000
Children's Assets: $19,000
Total Assets $1,319,000
John's Liabilities: $54,000
Mary's Liabilities: $0
Joint / Community Property Liabilities: $265,000
Children's Liabilities: $0
Total Liabilities -$319,000
Net Worth $1,000,000
8/3/2019 Free Sample Plan1
http://slidepdf.com/reader/full/free-sample-plan1 38/41
8/3/2019 Free Sample Plan1
http://slidepdf.com/reader/full/free-sample-plan1 39/41
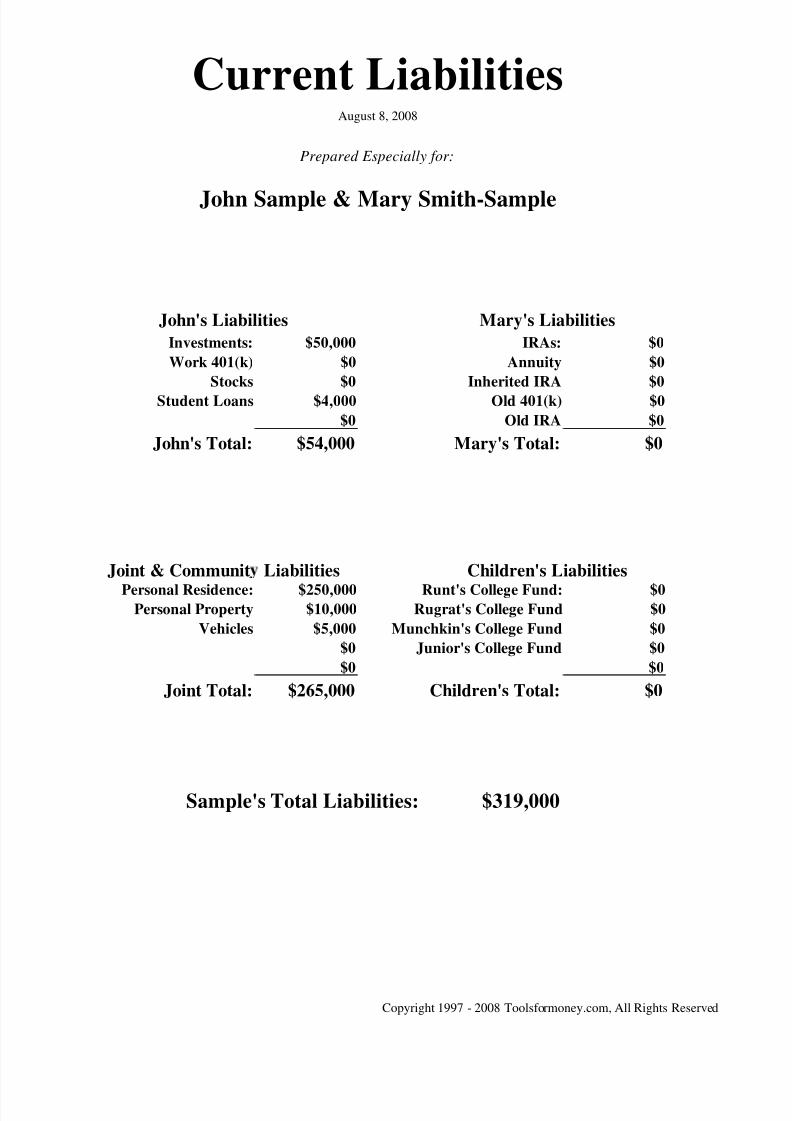
Current LiabilitiesAugust 8, 2008
Prepared Especially for:
John Sample & Mary Smith-Sample
John's Liabilities Mary's Liabilities
Investments: $50,000 IRAs: $0
Work 401(k) $0 Annuity $0
Stocks $0 Inherited IRA $0
Student Loans $4,000 Old 401(k) $0
$0 Old IRA $0John's Total: $54,000 Mary's Total: $0
Joint & Communit Liabilities Children's LiabilitiesPersonal Residence: $250,000 Runt's College Fund: $0
Personal Property $10 000 Rugrat's College Fund $0
8/3/2019 Free Sample Plan1
http://slidepdf.com/reader/full/free-sample-plan1 40/41
Projected Net Worth for John Sample & Mary Smith-SampleUsin End of Year Values
John's Assets 2008 2009 2010 2011
Age: 45 Age: 46 Age: 47 Age: 48
Investments (10%) $133,250 $142,053 $151,445 $161,467
Work 401(k) (10%) $27,500 $30,250 $33,275 $36,603Stocks (10%) $55,000 $60,500 $66,550 $73,205
End of Year Values of All John's Assets: $215,750 $232,803 $251,270 $271,275
John's Total Liabilities $44,879 $34,846 $23,810 $11,991
End of Year Values of All John's Assets, Minus Liabilities: $170,871 $197,956 $227,460 $259,284
End of Year Values of All Client's Qualified Assets: $27,500 $30,250 $33,275 $36,603
End of Year Values of All Client's Personal Assets: $188,250 $202,553 $217,995 $234,672
Mary's Assets 2008 2009 2010 2011
Age: 40 Age: 41 Age: 42 Age: 43
IRAs (10%) $550,000 $605,000 $665,500 $732,050Annuity (5%) $26,250 $27,563 $28,941 $30,388
Inherited IRA (10%) $27,500 $30,250 $33,275 $36,603
Old 401(k) (10%) $27,500 $30,250 $33,275 $36,603
Old IRA $50,000 $50,000 $50,000 $50,000
End of Year Values of All Spouse's Assets: $681,250 $743,063 $810,991 $885,643
Mary's Total Liabilities $0 $0 $0 $0
End of Year Values of All Mary's Assets, Minus Liabilities: $681,250 $743,063 $810,991 $885,643
End of Year Values of All Spouse's Qualified Assets: $681,250 $743,063 $810,991 $885,643
End of Year Values of All Spouse's Personal Assets: $0 $0 $0 $0
Jointly Held / Community Assets 2008 2009 2010 2011
Personal Residence (2.5%) $410,000 $420,250 $430,756 $441,525
Personal Property (1%) $50,500 $51,005 $51,515 $52,030
Vehicles $63,750 $54,188 $46,059 $39,150
$0 $0 $0 $0
$0 $0 $0 $0
End of Year Values of All Joint Assets: $524,250 $525,443 $528,331 $532,706
Joint & Community Total Liabilities $246,485 $237,349 $227,543 $217,013
EOY Values of All Joint Assets, Minus Liabilities: $277,765 $288,094 $300,788 $315,693
Copyright 1997 - 2008 Toolsformoney.com, All Rights Reserved
8/3/2019 Free Sample Plan1
http://slidepdf.com/reader/full/free-sample-plan1 41/41
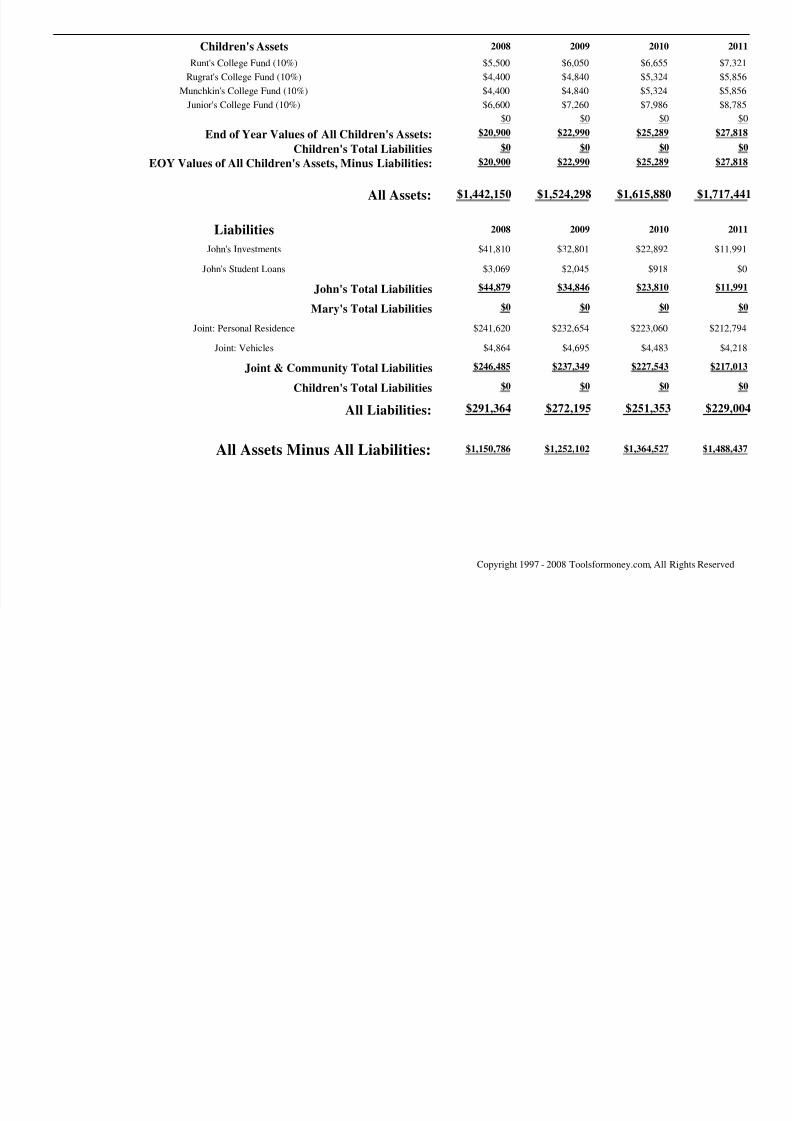
Children's Assets 2008 2009 2010 2011
Runt's College Fund (10%) $5,500 $6,050 $6,655 $7,321
Rugrat's College Fund (10%) $4,400 $4,840 $5,324 $5,856
Munchkin's College Fund (10%) $4,400 $4,840 $5,324 $5,856
Junior's College Fund (10%) $6,600 $7,260 $7,986 $8,785
$0 $0 $0 $0
End of Year Values of All Children's Assets: $20,900 $22,990 $25,289 $27,818
Children's Total Liabilities $0 $0 $0 $0
EOY Values of All Children's Assets, Minus Liabilities: $20,900 $22,990 $25,289 $27,818
All Assets: $1,442,150 $1,524,298 $1,615,880 $1,717,441
Liabilities 2008 2009 2010 2011
John's Investments $41,810 $32,801 $22,892 $11,991
John's Student Loans $3,069 $2,045 $918 $0
John's Total Liabilities $44,879 $34,846 $23,810 $11,991
Mary's Total Liabilities $0 $0 $0 $0
Joint: Personal Residence $241,620 $232,654 $223,060 $212,794
Joint: Vehicles $4,864 $4,695 $4,483 $4,218
Joint & Community Total Liabilities $246,485 $237,349 $227,543 $217,013
Children's Total Liabilities $0 $0 $0 $0
All Liabilities: $291,364 $272,195 $251,353 $229,004
All Assets Minus All Liabilities: $1,150,786 $1,252,102 $1,364,527 $1,488,437
Copyright 1997 - 2008 Toolsformoney.com, All Rights Reserved