Embed Size (px)
Citation preview
Freeling Primary School
Annual Report
2013
Annual Report 2013
Page 1
Context
School Name: Freeling Primary School Number: 0139
Principal: Cindy McGarry Region: Barossa
Freeling Primary School is a Reception to Year 7 public school, with 8 composite classes as well as an on-site
Preschool.
Freeling has a broad range of socio-economic backgrounds. There are currently 21.5% of students that are
school card holders.
Student enrolment at the end of 2013 was 206. There are currently 4 students who identify as Aboriginal.
There is one ESL student.
Enrolments have increased significantly over the last two years due to new housing developments in the town
of Freeling. Further house allotments are to be released.
Information technology is another important part of the curriculum. Every classroom has an Interactive
Whiteboard and classroom computers which are used as a valuable learning tool. This enables our students to
use the latest technology as part of their learning across all areas of the curriculum.
The Preschool is an integral part of the school and has full use of all facilities including the school library. In
2012, we offered all students 2 full days and an additional 2 hour session. A new Preschool building has been
included in the 2012/2013 State budget. The Preschool facility is also utilized by the Freeling Playgroup each
week. The school offers an Out of School Hours Care program every school day and a Vacation Care
program.
2013 Highlights
2013 was a very successful year for Freeling Primary School with significant demonstrated improvements in
student achievement. At Freeling School we are committed to providing a comprehensive and relevant
curriculum in the key learning areas, with literacy and numeracy as our major priorities. The core learning
programs are further complimented with specialist Music/Performing Arts and Japanese programs. This is
achieved in a safe, caring environment where individuals strive for success. High standards are set and support
is provided to ensure that all students achieve their full potential. Partnerships between parents, teachers are
students are highly valued and nurtured. The school also has a significant focus on extra curricula programs for
all students including sport, instrumental music, choir and performance opportunities.
The following highlights demonstrate the commitment of the school to enhanced student achievement and
engagement.
Throughout 2013:
Fortnightly whole school Assemblies organized by classes on a roster basis
Student Voice and Student Leadership opportunities
Class Buddies
Rotary Awards
Instrumental Music
Senior and Middle primary choirs
Term 1:
Freeling Fortnight
Family Pool day
AGM Governing Council
Reception to Year 4 Swimming Program
Whole Staff Training: Dyslexia
Parent/Teacher Meetings
Harmony Day activities
Annual Report 2013
Page 2
Yr 5-7 Aquatics camp at Port Vincent
Whole school Sports Day
Reception – Year 3 Netball clinic
Eat a Rainbow Program: Preschool
Term 2:
Students participated in the Regional Cross Country
Simultaneous Story reading
Walk Safely to School
Jump Rope for Heart
Whole staff training: History
Year 5-7 Lightning Carnival
Walk Safely to School Day
Term 3:
All classes participated in a 5 week Footsteps Dance Program
Whole Staff Training: Autism
Festival of Music: Senior Choir
Students participated in a range of Book Week activities, including a special Assembly
Classes attended an Indigenous performance
Term 4:
All students participated in the Music Count Us In 2012
All students participated in the Music is Fun Concert
School Fete
Whole school Remembrance Day Assembly
Year 7 Graduation
End of year Presentation Assembly
Report from Governing Council
2013 has been a year of growth and achievement at the Freeling Primary School.
As we continue to grow with enrolment numbers we also see the school grow with many new faces and
events that make our school a vibrant one.
Events such as the Fete and the Concert has seen a genuine sense of pride coming from teachers, students and
parents. This continues to attract people to the school and allows us to demonstrate the high expectations
and standards that we aim to live and work by.
Initiatives such as the Senior Class trip to Canberra in May next year has also seen extra work and effort to
allow the students to aim for something quite different to what they have been used to.
I congratulate everyone on this.
Thanks again must go to our Principal Cindy Mc Garry, Deputy Irene Simpfendorfer, our wonderful group of
teachers, the dedicated support staff and the many volunteers who make the Freeling Primary School
experience a very positive and enjoyable one.
My thanks as always to the Governing Council for their contribution and energy towards our school. With a
number of new faces on the council in 2013 it has been enjoyable to have new and differing ideas and input.
I look forward to 2014 as we continue to grow and improve.
Dominic Shepley
Governing Council Chairperson
Annual Report 2013
Page 3
Site Improvement Planning
A comprehensive DIAf Review was undertaken on 5 April 2013.
Panel feedback on the evidence that:
the school’s ongoing self-review processes meet the standards outlined in the DIAf
guidelines and
effective plans and processes are in place to address the findings of self-review
A variety of evidence of effective planning based on the analysis of data sets exists. There is data collected
from students, parents and staff. Data collected provides the evidence and there is whole school commitment
to the plans. The school’s implementation of the DIAf is at a strategic level. An Annual Report, SIP,
Performance Plans, attendance plans, student intervention plans have been developed and are operational.
The preschool has undergone an external assessment and there are plans to address the feedback from this via
the QIP.
There was clear evidence of leadership in prioritising and planning for the future.
Panel feedback on the evidence of effective processes to develop quality teaching and learning:
There are clear targets and strategies to improve teaching and learning. The resourcing and commitment to
quality supports this.
There has been supportive leadership for the implementation of initiatives that connect, and build on from
current practice.
There was anecdotal evidence from parents and students about quality teaching and high expectations.
There are effective performance development processes that challenge and support teacher professional
learning and growth.
Evidence based interventions are implemented to support Wave 2 students with explicit quality teaching.
Student achievement data from this program informs future planning.
Panel feedback on the evidence of effective processes to develop curriculum coherence:
Whole school agreements in Literacy and Numeracy are documented and implemented.
SIP teams drive pedagogical change, resulting in quality teaching and learning programs.
The implementation of the AC, and the documented Assessment and Reporting framework provides
consistency across the school.
Whilst initiatives have been implemented, the school intends to maintain these foci and embed them in teacher
practice.
An induction process has been developed that includes curriculum and pedagogical expectations.
Panel feedback on the evidence of improvements in the quality of learner outcomes over time:
There is improvement in nearly all aspects and year levels of NAPLAN testing since last self-review. The
schools results are above State and Region means in Numeracy in years 5 & 7. The school NAP results show
significant growth in students achieving in higher skill bands! 12 out of 15 test categories across year levels are
higher than like schools results.
RR levels show an outstanding growth for year 1 and 2 students.
Attendance data is above State average and there are ongoing strategies in place to improve this further.
Student perception survey shows improvement particularly in the quality of teaching at this school.
The parent opinion survey and anecdotal comments evidences quality teaching and learning at Freeling PS.
Panel feedback on the evidence of leadership for whole school improvement:
The leadership team strongly supports the professional growth of all staff.
The leadership team has a developed a culture of shared leadership which enables staff members to effectively
drive school improvement. An outcome of this is the development of whole school agreements and the
intensive intervention program.
Effective processes have been established, allowing all staff members to examine data to make informed
decisions for site improvement.
Commendations:
Strong School and parent partnerships.
Annual Report 2013
Page 4
There is a very strong sense of trust between the school and community.
Parents expressed that they can raise concerns with staff and know neither they nor their children will be
judged.
Parents praised the teachers for the way they promptly raised concerns around student learning and wellbeing,
and offered solutions and strategies to address these.
The whole staff are approachable, visible and respond sensitively to parental concerns.
Teachers are highly professional and committed to the improvement agenda.
Teachers do place children at the centre of everything they do.
There is high quality intervention and support for students at risk that is regularly monitored and evaluated.
There is significant growth in student achievement outcomes within the context of enrolment growth.
There is a strong commitment to consolidate literacy, numeracy and wellbeing practices.
There is a committed and active Governing Council who works in partnership to support students and
families.
There is a significant commitment by staff to the ASD and Dyslexia training.
Children feel safe, happy and challenged by their teachers.
The school has supported and resourced SSOs on professional learning that supports site improvement focus.
Recommendations:
Extending into community partnerships eg interagency presence, Non-Government organisations, LAP
Investigating preschool/school transition, curriculum. There should be a specific emphasis on speech and
language development.
Professional development in cultural competence.
Using student achievement data to develop differentiated teaching and learning that focuses on individuals.
Going deeper with parental partnerships to support learning and leadership capacity.
Explore the use of technology to communicate with parents.
Continue to investigate the viability of Before School care.
Keep the focus on one or two priorities and to continue to improve NAPLAN and Running Records.
School is proactive in planning for future growth. This should include induction for students, parents and staff.
Continue the work in the preschool to address recommendations from assessment.
Preschool Assessment
On Monday 4 November our Preschool was assessed according to the National Quality Framework which
contains seven Quality Areas.
A comprehensive Quality Improvement Plan was developed and submitted to the assessor.
Although our existing Preschool facility creates many challenges for our staff and program delivery, the
assessment was very successful with every Quality Area being met to National standard, as well as some
elements will be reported as exceeding the standard.
Student Achievement
Reading Running Records
Year 1 and Year 2 Reading Running records data indicates higher than state levels.
Year 1 (Levels 21-26):
- School 49% (48% 2012)
- State: 31%
- Level of disadvantage: 23%
Year 2 (Levels 21-26):
- School 72% (70% 2012)
- State: 68%
- Level of disadvantage: 62%
2013 Reading Support Teacher Role
The focus of the 2012-14 DECD Early Years Literacy Strategy is to improve early literacy development in
children. As part of the strategy, the funding for a Reading Support Teacher (RST) continued again in 2013.
Freeling Primary School received the equivalent of funding for half a day a week in time allocation. The
Annual Report 2013
Page 5
continuation of the role allowed for the consolidation of the achievements made in 2012 as well as working
towards the new goals set for improvements in literacy.
2013 RST Achievements
Support of teachers in the development and implementation of Literacy Blocks.
Support of staff with Jolly Phonics and Jolly Grammar resourcing and training.
Stocktake and purchase of take home reading books and addressing the imbalance of
fiction/information texts.
Completed training to facilitate the six hours of DECD teacher training sessions on taking and
analysing Running Records.
Support of teachers to have consistent and valid Running Record data for DECD data collections.
Accredited to deliver the Literacy for Learning course at Freeling Primary School.
Promoted reading at FPS through a ten week Book Banter page in the school newsletter with selected
students from the R to 7 classes reading and reviewing new books to our school library.
The inclusion of tips in the newsletter informing parents on how they can support their child with
home reading.
Facilitated a successful reading workshop for families in an early year class.
In Term 3 a Partners in Print session was trialled in an R/1 class with the families of transitioning preschool
children included. The focus of the session was Supporting Children to make meaning from Reading. Four
workshops facilitated by teachers and parents, highlighted the skills of introducing a book, asking questions,
looking at pictures and predicting the ending. Nineteen out of the twenty-three families were represented with
over fifty people attending. Feedback was positive and there was much interest shown for more sessions in
2014.
Early Years Literacy Intervention
The Early Years Literacy Intervention program continued into its second year at Freeling Primary School. The
program focused on improving reading and spelling in students who had been identified for Wave 3 support.
Students in Year 1 to Year 3 were identified for the Intervention Program through a range of data which
included Running Record levels, Waddington Spelling and Reading results and teacher recommendations.
Intervention sessions also aimed to support students to improve their concentration, working memory,
handwriting skills, organisation and confidence. In Term 1, a small group of students had extra support to
familiarise themselves with NAPLAN style assessments in preparation for the Year 3 NAPLAN testing early in
term 2.
Throughout the year, all reception students were screened with a phonological awareness screening test
(SPA). Students’ results were discussed with class teachers and recommendations made for in class, Wave 2
Intervention support.
Two students in Early Years are still awaiting Support Service Assessments after pre-referrals were lodged in
Term 1, 2013.
The Intervention teacher attended a three day workshop on Teaching Students with Dyslexia (Hansberry
Educational Consulting), completed two DECD on-line training courses; Understanding Dyslexia and Significant
Difficulties in Reading and Understanding Autistic Spectrum Disorder.
Over the year, thirty students participated in the Intervention program with fifteen students completing a full
year. Nineteen 50 minute sessions were timetabled across the week with a priority for the before lunch
sessions. Students were grouped according to learning needs with several groups being made up of children
from different classes.
Waddington Reading Test Data
75% of Intervention students’ Waddington Reading Ages were at or above their chronological age
with 42% six months or more above.
42% of Intervention students exceeded twelve months growth in their Reading Age from 2012 results
with 17% exceeding 18months growth.
25% of Intervention students’ Waddington Reading Ages were below their chronological age. One
third of these students were within one or two months.
Annual Report 2013
Page 6
Waddington Spelling Test Data
74% of Intervention students’ Waddington Spelling Ages were above their chronological age with 65%
six months or more.
52% improved their Waddington Reading Age by twelve months or more from their 2012 results.
26% of Intervention students’ Waddington Spelling Ages were below their chronological age. One
third of these students were within one or two months.
Running Record Data
71% of Year 1 and 2 Intervention students reached their year level benchmark at an Instructional level
on a seen text.
73% of Intervention students in Year 1 and 2 had Medium growth in their Instructional Reading
Recovery levels in a six month interval. (April & Sept 2013 data collection)
NAPLAN Data
96% of Year 3 Intervention students achieved at National Benchmarks (Band 2) or above in Reading,
Writing, Spelling and Grammar NAPLAN tests.
68% of Year 3 Intervention students achieved above National Benchmarks (in Band 3, 4, 5 and 6) in
Reading, Writing, Spelling and Grammar NAPLAN tests.
2014 Directions for Early Years Intervention Program
Explore programs and learning experiences to help students build working memory.
Develop stronger networks with parents/caregivers of Intervention students to promote quality
home support with learning.
NAPLAN
Student Proficiency Bands
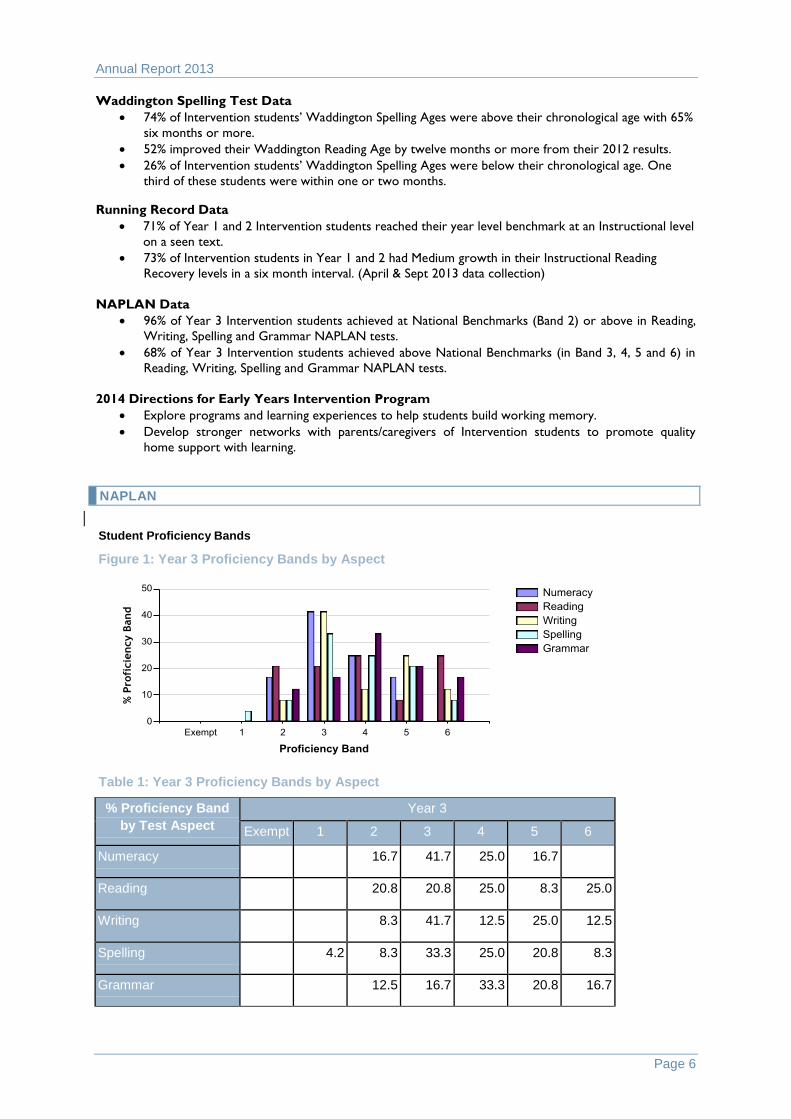
Figure 1: Year 3 Proficiency Bands by Aspect
Table 1: Year 3 Proficiency Bands by Aspect
% Proficiency Band
by Test Aspect
Year 3
Exempt 1 2 3 4 5 6
Numeracy 16.7 41.7 25.0 16.7
Reading 20.8 20.8 25.0 8.3 25.0
Writing 8.3 41.7 12.5 25.0 12.5
Spelling 4.2 8.3 33.3 25.0 20.8 8.3
Grammar 12.5 16.7 33.3 20.8 16.7
Annual Report 2013
Page 7
Year 3
Writing
- 100% at or above NMS
- 50% in higher 3 bands. 12.5% in Band 6 and above (0% in 2012).
Reading
- 100% at or above NMS
- 58.3% in higher 3 bands. 25% in Band 6 and above (15.8% in 2012)
Spelling
- 95.8% at or above NMS
- 54.1% in higher 3 bands. 8.3% in Band 6 and above (5.3% in 2012)
Grammar
- 100% at or above NMS
- 70.8% in higher 3 bands. 16.7% in Band 6 and above (10.5% in 2012)
Numeracy
- 100% at or above NMS
- 58.3% in higher 3 bands. (57.9% in 2012) 0% in Band 6.
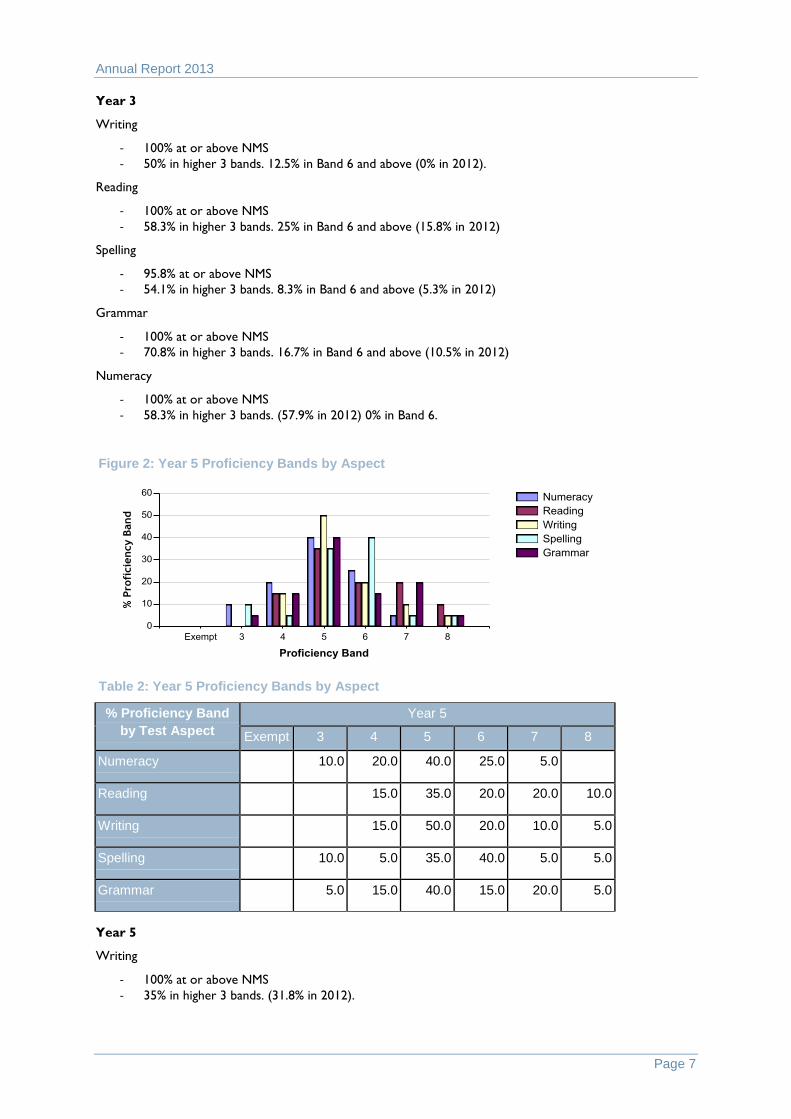
Figure 2: Year 5 Proficiency Bands by Aspect
Table 2: Year 5 Proficiency Bands by Aspect
% Proficiency Band
by Test Aspect
Year 5
Exempt 3 4 5 6 7 8
Numeracy 10.0 20.0 40.0 25.0 5.0
Reading 15.0 35.0 20.0 20.0 10.0
Writing 15.0 50.0 20.0 10.0 5.0
Spelling 10.0 5.0 35.0 40.0 5.0 5.0
Grammar 5.0 15.0 40.0 15.0 20.0 5.0
Year 5
Writing
- 100% at or above NMS
- 35% in higher 3 bands. (31.8% in 2012).
Annual Report 2013
Page 8
Reading
- 100% at or above NMS
- 50% in higher 3 bands. (31.8% in 2012)
Spelling
- 90% at or above NMS
- 50.0% in higher 3 bands. 8.3% in Band 6 and above (5.3% in 2012)
Grammar
- 95% at or above NMS
- 40% in higher 3 bands. 40.9% in 2012
Numeracy
- 90% at or above NMS
- 30% in higher 3 bands. 49.9% in 2012
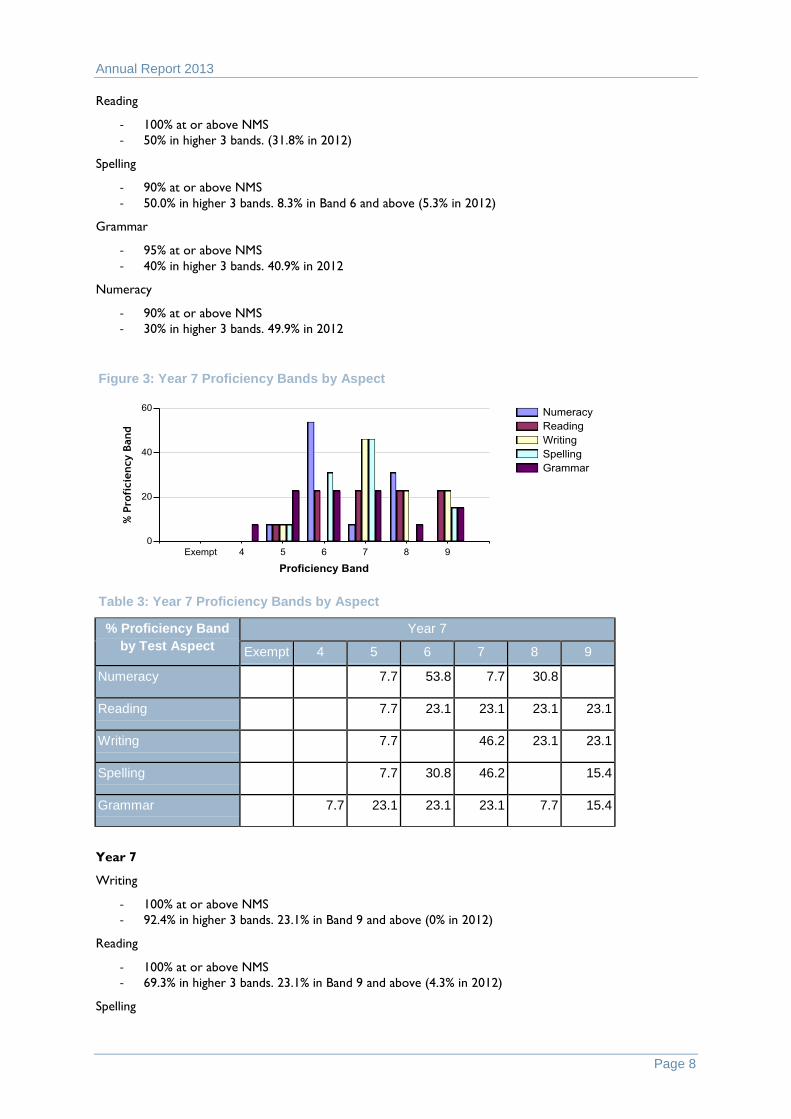
Figure 3: Year 7 Proficiency Bands by Aspect
Table 3: Year 7 Proficiency Bands by Aspect
% Proficiency Band
by Test Aspect
Year 7
Exempt 4 5 6 7 8 9
Numeracy 7.7 53.8 7.7 30.8
Reading 7.7 23.1 23.1 23.1 23.1
Writing 7.7 46.2 23.1 23.1
Spelling 7.7 30.8 46.2 15.4
Grammar 7.7 23.1 23.1 23.1 7.7 15.4
Year 7
Writing
- 100% at or above NMS
- 92.4% in higher 3 bands. 23.1% in Band 9 and above (0% in 2012)
Reading
- 100% at or above NMS
- 69.3% in higher 3 bands. 23.1% in Band 9 and above (4.3% in 2012)
Spelling
Annual Report 2013
Page 9
- 100% at or above NMS
- 61.6% in higher 3 bands. 15.4% in Band 9 and above (4.3% in 2012)
Grammar
- 92.7% at or above NMS
- 46.2% in higher 3 bands (34.7% in 2012). 15.4 % in Band 9 and above (4.3% in 2012)
Numeracy
- 100% at or above NMS
- 38.5% in higher 3 bands. (52.1% in 2012).
Student Mean Scores
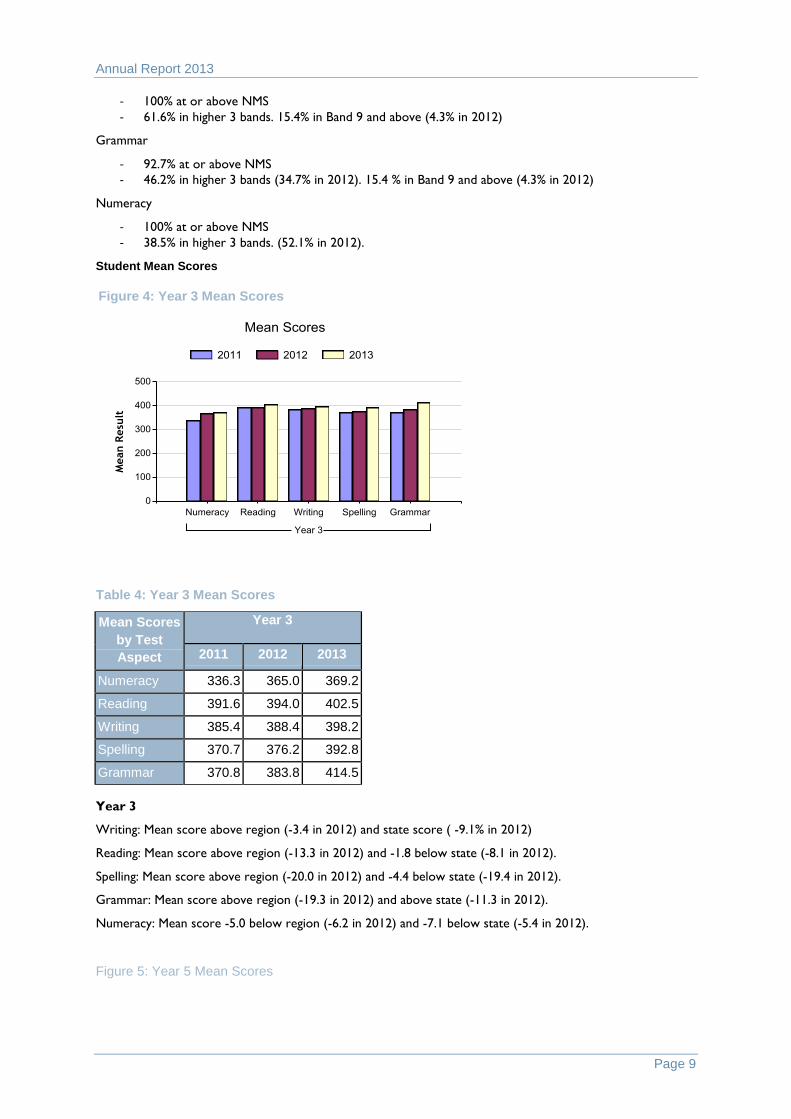
Figure 4: Year 3 Mean Scores
Table 4: Year 3 Mean Scores
Mean Scores
by Test
Aspect
Year 3
2011 2012 2013
Numeracy 336.3 365.0 369.2
Reading 391.6 394.0 402.5
Writing 385.4 388.4 398.2
Spelling 370.7 376.2 392.8
Grammar 370.8 383.8 414.5
Year 3
Writing: Mean score above region (-3.4 in 2012) and state score ( -9.1% in 2012)
Reading: Mean score above region (-13.3 in 2012) and -1.8 below state (-8.1 in 2012).
Spelling: Mean score above region (-20.0 in 2012) and -4.4 below state (-19.4 in 2012).
Grammar: Mean score above region (-19.3 in 2012) and above state (-11.3 in 2012).
Numeracy: Mean score -5.0 below region (-6.2 in 2012) and -7.1 below state (-5.4 in 2012).
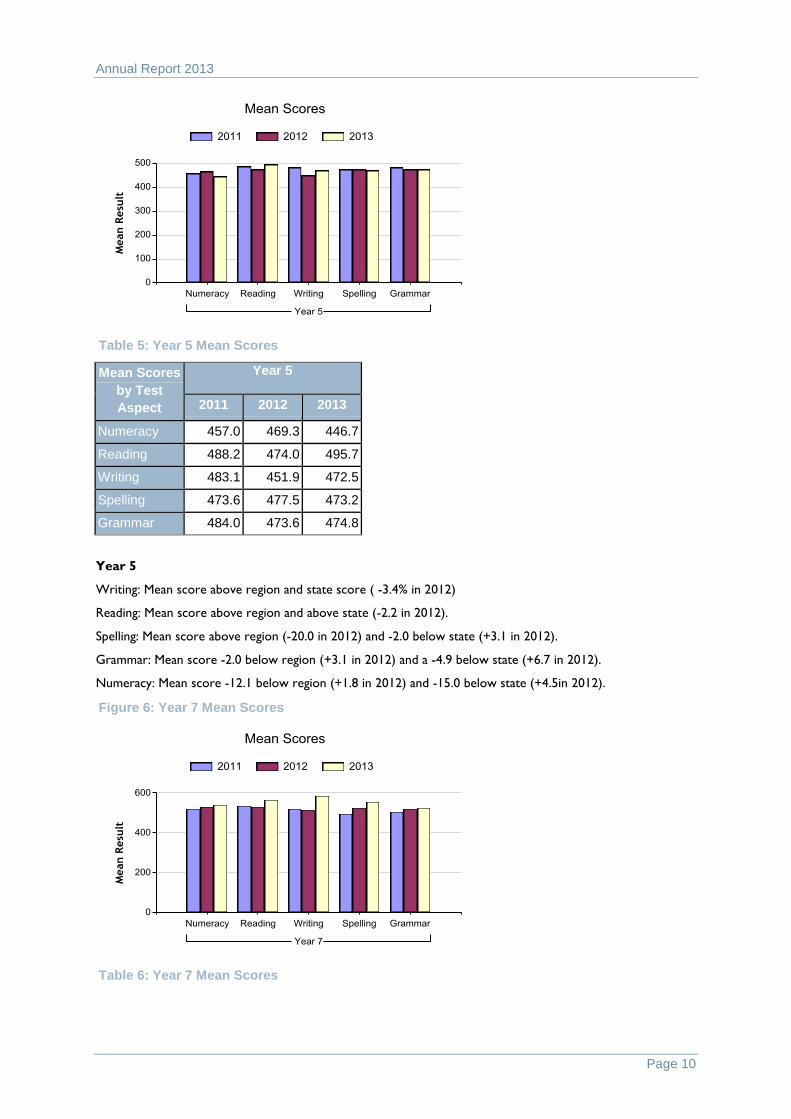
Figure 5: Year 5 Mean Scores
Annual Report 2013
Page 10
Table 5: Year 5 Mean Scores
Mean Scores
by Test
Aspect
Year 5
2011 2012 2013
Numeracy 457.0 469.3 446.7
Reading 488.2 474.0 495.7
Writing 483.1 451.9 472.5
Spelling 473.6 477.5 473.2
Grammar 484.0 473.6 474.8
Year 5
Writing: Mean score above region and state score ( -3.4% in 2012)
Reading: Mean score above region and above state (-2.2 in 2012).
Spelling: Mean score above region (-20.0 in 2012) and -2.0 below state (+3.1 in 2012).
Grammar: Mean score -2.0 below region (+3.1 in 2012) and a -4.9 below state (+6.7 in 2012).
Numeracy: Mean score -12.1 below region (+1.8 in 2012) and -15.0 below state (+4.5in 2012).
Figure 6: Year 7 Mean Scores
Table 6: Year 7 Mean Scores
Annual Report 2013
Page 11
Mean Scores
by Test
Aspect
Year 7
2011 2012 2013
Numeracy 522.3 531.7 541.2
Reading 538.0 528.4 563.7
Writing 521.8 517.8 584.0
Spelling 496.7 526.7 554.4
Grammar 505.8 520.1 526.5
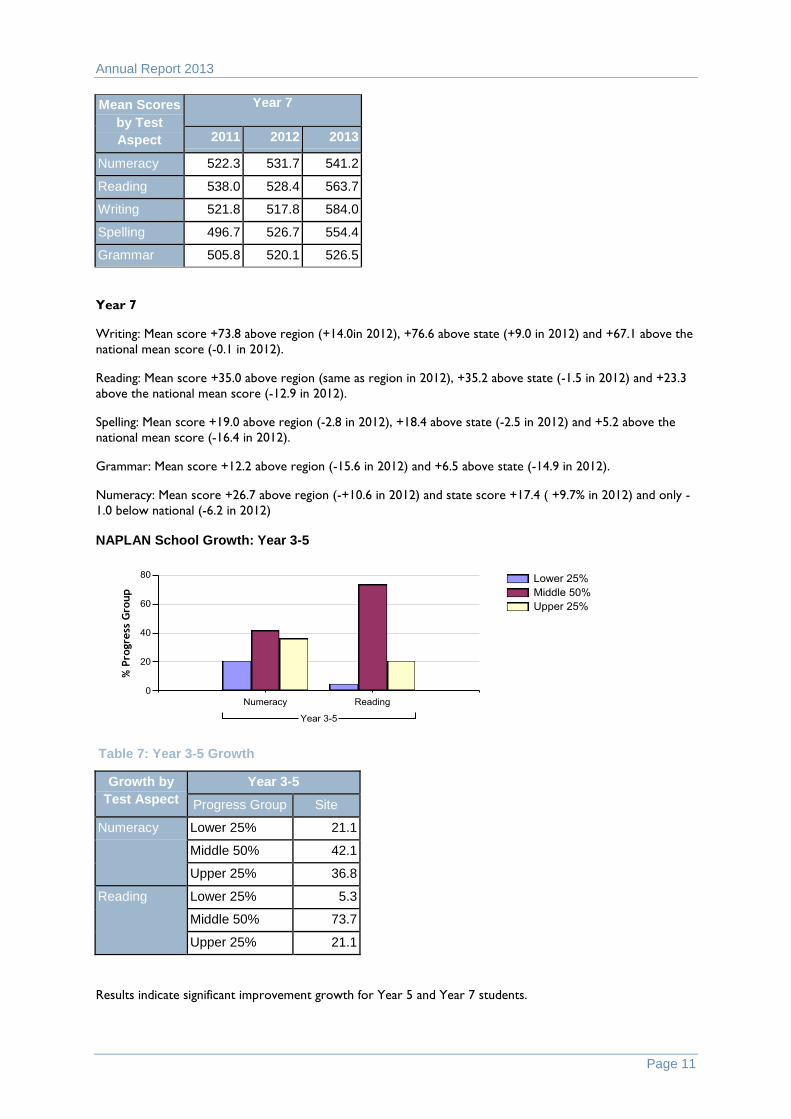
Year 7
Writing: Mean score +73.8 above region (+14.0in 2012), +76.6 above state (+9.0 in 2012) and +67.1 above the
national mean score (-0.1 in 2012).
Reading: Mean score +35.0 above region (same as region in 2012), +35.2 above state (-1.5 in 2012) and +23.3
above the national mean score (-12.9 in 2012).
Spelling: Mean score +19.0 above region (-2.8 in 2012), +18.4 above state (-2.5 in 2012) and +5.2 above the
national mean score (-16.4 in 2012).
Grammar: Mean score +12.2 above region (-15.6 in 2012) and +6.5 above state (-14.9 in 2012).
Numeracy: Mean score +26.7 above region (-+10.6 in 2012) and state score +17.4 ( +9.7% in 2012) and only -
1.0 below national (-6.2 in 2012)
NAPLAN School Growth: Year 3-5
Table 7: Year 3-5 Growth
Growth by
Test Aspect
Year 3-5
Progress Group Site
Numeracy Lower 25% 21.1
Middle 50% 42.1
Upper 25% 36.8
Reading Lower 25% 5.3
Middle 50% 73.7
Upper 25% 21.1
Results indicate significant improvement growth for Year 5 and Year 7 students.
Annual Report 2013
Page 12
Student Data
Attendance
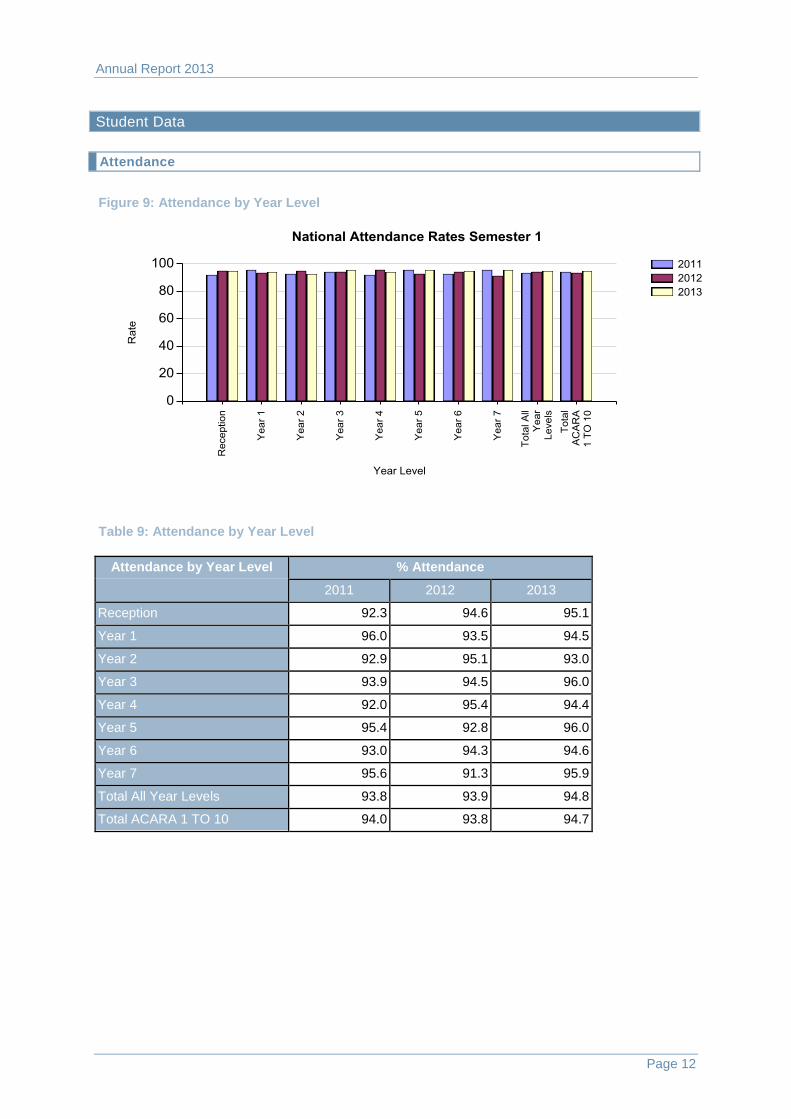
Figure 9: Attendance by Year Level
Table 9: Attendance by Year Level
Attendance by Year Level % Attendance
2011 2012 2013
Reception 92.3 94.6 95.1
Year 1 96.0 93.5 94.5
Year 2 92.9 95.1 93.0
Year 3 93.9 94.5 96.0
Year 4 92.0 95.4 94.4
Year 5 95.4 92.8 96.0
Year 6 93.0 94.3 94.6
Year 7 95.6 91.3 95.9
Total All Year Levels 93.8 93.9 94.8
Total ACARA 1 TO 10 94.0 93.8 94.7
Annual Report 2013
Page 13
Behaviour Management
Supporting students in their wellbeing so that they feel safe, secure and are able to engage in their learning
continued to be one of the important priorities in 2013 and will remain high on the school’s agenda.
Key strategies undertaken were:
The Buddy Class structure expanded even further and provided many opportunities for students to
work across age/year levels in a variety of activities/events. (eg. Jump Rope for Heart, PE Week,
Christmas Activities).
A number of games for use by students were purchased and made available as part of an Indoor
Activities program run primarily by a Student Voice Action Group. The aim is to develop this even
further.
Staff undertook a 20 hour online Autism Spectrum Disorder training course during Term 2.
17 staff undertook the online Dyslexia Training Course during Term 3 with a final follow-up Pupil
Free Day allowing completion of the course in Term 4.
The Autism Spectrum Disorder Peer Awareness Program was conducted with two-thirds of the
classes.
KidsMatter Training in Getting Started and Component 1 (Positive School Communities) took place
as part of a Pupil Free Day in Term 3.
The school subscribed to the SKOOLBAG Application to support information flow and give families
yet another way of communicating Student Absence and Change of Address information. There were
117 application downloads to 25 November 2013 and an increasing number of notifications of Student
Absence using the Application.
An update of the Freeling Primary School Anti-Bullying Policy and monitoring of reported incidents.
Examples and information related to mapping the Child Protection Curriculum was shared with the
Committee and Resource Packs to support implementation were commenced.
Data collected via EDSAS indicated only 7 incidents of Violence – Threatened or Actual. Of these
incidents, there appeared to be a pattern which indicated each of these resulted from a ‘game or play’
which had started in a ‘friendly / joking’ manner but had altered throughout the course of events. Any
injuries sustained were managed with First Aid at the school level and parents were notified in these
circumstances. Based on the severity and frequency of each incident, a range of consequences were issued
the most significant of which were 2 Internal Suspension.
Future Directions
In response to the data collected which indicated the majority of incidents involved a small but core group
of students and repetitive behaviours, key focus areas have been identified and are documented as part of
the Site Improvement Plan for 2014.
A whole-school agreement will be developed to support the use of consistent language and strategies
when dealing with inappropriate behaviour which includes revised processes for advising families of
student ‘incidents’ and consequences.
The school community will continue to develop its understanding of and commitment to KidsMatter –
Mental Health Initiative in support of its students and families.
Programs and strategies that support students to understand and build their skills around co-
operative games and play will be investigated and trialled.
Developing and conducting a survey for students new to the school with follow-up meetings.
Developing and introducing an internal referral process for students 'at risk' socially and/or
emotionally.
Review and restructure the current Peer Support Program called Peacemakers to provide additional
support for students in the yard.
Annual Report 2013
Page 14
Further develop and refine the involvement of the CPSW (Christian Pastoral Support Worker) in
classes and in the organisation and coordinating of Student House Captains to manage and run
Outdoor Lunchtime Activities for students.
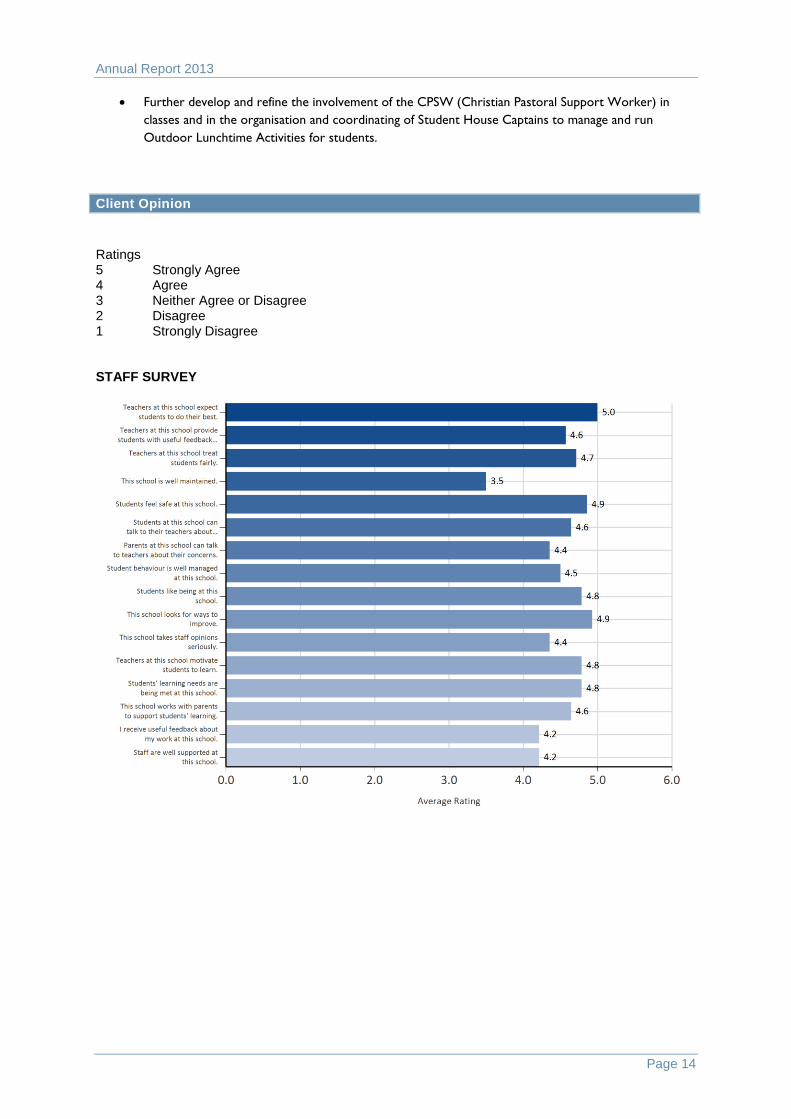
Client Opinion
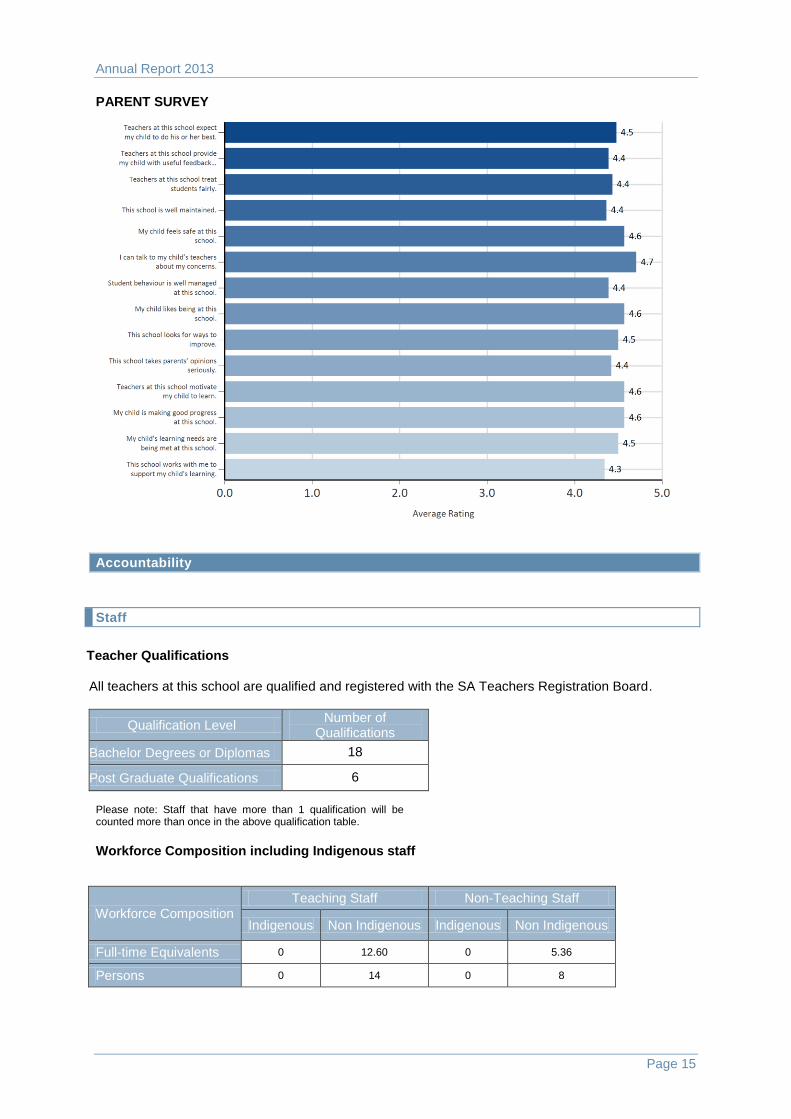
Ratings 5 Strongly Agree 4 Agree 3 Neither Agree or Disagree 2 Disagree 1 Strongly Disagree STAFF SURVEY
Annual Report 2013
Page 15
PARENT SURVEY
Accountability
Staff
Teacher Qualifications All teachers at this school are qualified and registered with the SA Teachers Registration Board.
Qualification Level Number of
Qualifications
Bachelor Degrees or Diplomas 18
Post Graduate Qualifications 6
Please note: Staff that have more than 1 qualification will be counted more than once in the above qualification table.
Workforce Composition including Indigenous staff
Workforce Composition Teaching Staff Non-Teaching Staff
Indigenous Non Indigenous Indigenous Non Indigenous
Full-time Equivalents 0 12.60 0 5.36
Persons 0 14 0 8
Annual Report 2013
Page 16
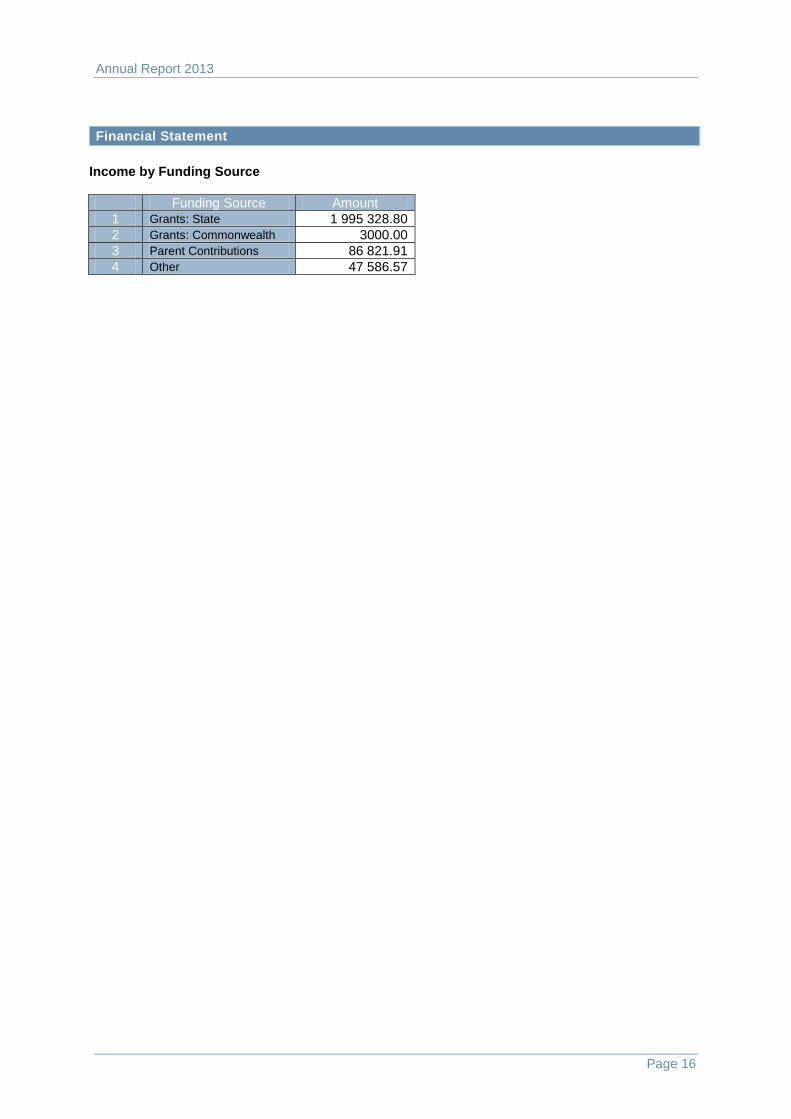
Financial Statement
Income by Funding Source
Funding Source Amount
1 Grants: State 1 995 328.80
2 Grants: Commonwealth 3000.00
3 Parent Contributions 86 821.91
4 Other 47 586.57