Embed Size (px)
Citation preview
Copyright © 2011 ARM Ltd. All rights reserved
Freescale Kinetis Cortex-M4 Lab with ARM® Keil™ MDK toolkit www.keil.com Preliminary
1
Freescale Kinetis: Cortex™-M4 Training Lab ARM® Keil™ MDK Toolkit featuring Serial Wire Viewer and ETM Trace
Spring 2011 Version 1.3 by Robert Boys, [email protected] Preliminary
Introduction: The purpose of this lab is to introduce you to the Freescale Cortex™-M4 processor using the ARM® Keil™ MDK toolkit featuring the IDE μVision®. We will use the Serial Wire Viewer (SWV) and ETM trace on the Kinetis K40 and K60 processor. At the end of this tutorial, you will be able to confidently work with these processors and Keil MDK.
Keil MDK-Lite™ is an evaluation version that limits code and data size to 32 Kbytes. Nearly all Keil examples will compile within this 32K limit. The addition of a license number will turn it into the full, unrestricted version. Contact Keil sales for a temporary full version license if you need to evaluate MDK with programs greater than 32K. MDK includes a full version of Keil RTX™. No royalty payments are required. The RTX source code is included in Keil RL-ARM™. For Linux, Android and bare metal (no OS) support on Freescale i.Mx series processors (ARM9™, Cortex-A8, A9 and A15), please see the new ARM DS-5™ toolkit at www.arm.com/ds5/.
Why Use Keil MDK ? MDK provides these features particularly suited for Cortex-M4 users:
1. µVision IDE with Integrated Debugger, Flash programmer, the ARM® Compiler toolchain and example projects.
2. A full feature Keil RTOS called RTX is included with MDK. 3. Serial Wire Viewer and ETM trace capability is included. 4. The RTX Kernel Awareness window is updated in real-time. 5. Choice of adapters: ULINK2™, ULINK-ME™, ULINKpro™,
Segger J-Link (version 6 or later) and Signum Systems JtagJetTrace. P&E OSJTAG is supported by µVision.
6. Kernel Awareness for Keil RTX, CMX, Quadros and Micrium. All RTOSs will compile with MDK.
7. MQX: MQX will be ported to MDK by Freescale in May 2011. Kernel Awareness for MQX will be available 2Q11.
8. Keil Technical Support is included for one year and is renewable. This helps you get your project completed faster.
This document details these features: 1. Serial Wire Viewer (SWV) and ETM Instruction Trace. 2. Real-time Read and Write to memory locations for Watch, Memory and RTX Tasks windows. These are non-
intrusive to your program. No CPU cycles are stolen. No instrumentation code is added to your source files. 3. Six Hardware Breakpoints (can be set/unset on-the-fly) and four Watchpoints (also called Access Breaks). 4. RTX Viewer: a kernel awareness program for the Keil RTX RTOS.
Serial Wire Viewer (SWV): Serial Wire Viewer (SWV) displays PC Samples, Exceptions (including interrupts), data reads and writes, ITM (printf), CPU counters and a timestamp. RTX Viewer uses SWV. This information comes from the ARM CoreSight™ debug module integrated into the Cortex-M4. SWV is output on the Serial Wire Output (SWO) pin found on the JTAG adapter. SWV does not steal any CPU cycles and is completely non-intrusive.(except for ITM Debug printf Viewer). SWV is provided by the Keil ULINK family, Segger J-Link and the Signum Systems JtagJetTrace. Best results are with a ULINK.
Embedded Trace Macrocell™ (ETM™): ETM adds all the program counter values to the features provided by SWV. This allows advanced debugging features including timing of areas of code, Code Coverage, Performance Analysis and program flow analysis. ETM requires a special debugger adapter such as the ULINKpro. Segger J-Trace or the Signum Systems JtagJetTrace. This document uses ULINKpro for ETM. A ULINK2 or ULINK-ME is used for the Serial Wire Viewer exercises.
Copyright © 2011 ARM Ltd. All rights reserved
Freescale Kinetis Cortex-M4 Lab with ARM® Keil™ MDK toolkit www.keil.com Preliminary
2
Freescale Evaluation Boards: This document uses the Freescale Kinetis TWR-K60N512. The K40 or other boards can also be used. Please note LEDs E1 through E4 are on Port C on the K40 board and on Port A on the K60 board.
Software Installation: This document was written for Keil MDK 4.20 or later which contains µVision 4. The evaluation copy of MDK is available free on the Keil website. Do not confuse µVision4 with MDK 4.0. The number “4” is a coincidence. To obtain a copy of MDK go to www.keil.com/arm and select “Evaluation Software” from the left column. You can use the evaluation version of MDK and a ULINK2, ULINK-ME, ULINKpro, J-Link or JtagJetTrace for this lab. You must make certain adjustments for non-ULINK adapters and not all features shown here will be available. The ULINKpro adds Cortex-M4 ETM trace support. It also adds faster programming time and better trace display.
Example Programs: Currently two example programs plus two for programming the Freescale FlexMem are included in either C:\Keil\ARM\Boards\Freescale\TWR-K40N256 or C:\Keil\ARM\Boards\Freescale\TWR-K60N512.
• Blinky: blinks 3 LEDs. Is a great starting point and can be adapted to your own project. • RTX_Blinky: A motor controller with RTX (the Keil RTOS) implemented. An easy intro to RTX. • FlexMem_Cfg and ProgOnce_Cfg: See Keil Appnote 220 to help you easily configure Kinetis FlexMem. It can be
found here: www.keil.com/appnotes/docs/apnt_220.asp
USD Debug Adapters: Keil manufactures several adapters. These are listed below with a brief description.
1. ULINK2 and ULINK-ME: ULINK2 is pictured on page 1 and ULINK-ME on page 5. ULINK-ME is offered for sale only as part of an evaluation board package. ULKINK2 can be purchased separately. These are electrically the same and both support Serial Wire Viewer (SWV), Run-time memory reads and writes for the Watch and Memory windows and hardware breakpoint setting on-the-fly.
2. ULINKpro: This is pictured on page 5. ULINKpro supports all SWV features and adds ETM Trace support. This means it provides all the program counter values. ETM makes Code Coverage, Execution Profiling and Performance Analysis features possible. ULINKpro also provides the fastest Flash programming times.
Keil supports more: 1. P&E OSJTAG: µVision running on your PC connects to the Cortex-M4 core via a USB connection. You can
connect to a Kinetis board without any debugging hardware. OSJTAG is good for general debugging but advanced features such as Serial Wire Viewer are not implemented. These limitations are listed on page 4 along with the configuration instructions. Keil MDK free evaluation version can be used to evaluate programs under 32K.
2. Segger J-Link and J-Trace: J-Link Version 6 (black) or later supports Serial Wire Viewer. J-Trace for the Cortex-M provides ETM. It has challenges correctly displaying the Logic Analyzer due to the speed of the SWV.
3. Signum Systems JtagJetTrace: This provides very good ETM support with its advanced triggers and filters for both ETM and SWV. Currently it does not support the µVision Logic Analyzer, on-the-fly data reads and writes, Code Coverage, Performance Analyzer or Execution.Profiling. The Signum window is embedded in µVision. The Signum Systems JtagJet, which has no ETM, does not support Serial Wire Viewer or ETM.
Serial Wire Viewer and ETM Trace is best supported with one of the Keil ULINKs.
JTAG and SWD Definitions: It is useful to have an understanding of these terms. JTAG: JTAG provides access to the CoreSight debugging module located on the Kinetis processor. It uses 4 to 5 pins. SWD: Serial Wire Debug is a two pin alternative to JTAG and has about the same capabilities except no Boundary Scan. SWD is referenced as SW in the µVision Cortex-M Target Driver Setup. SWV: Serial Wire Viewer: A trace capability providing display of reads, writes, exceptions, PC Samples and printf. SWO: Serial Wire Output: SWV frames come out this one pin output. Trace Port: A 4 bit port that ULINKpro uses to output ETM and optionally SWV (rather than the SWO pin). ETM: Embedded Trace Macrocell: Provides all the program counter values. Only the ULINKpro works with ETM.
Copyright © 2011 ARM Ltd. All rights reserved
Freescale Kinetis Cortex-M4 Lab with ARM® Keil™ MDK toolkit www.keil.com Preliminary
3
Index:
Part A: Connecting and Configuring Debug Adapters to the Kinetis Tower board:
1. P&E OSJTAG Configuration for the Freescale Tower board: 4 2. Connecting ULINK2, ULINK-ME or ULINKpro to the Freescale Tower board: 5 3. Configuring ULINK2 or ULINK-ME and µVision: 6 4. Configuring ULINKpro and µVision: 7
Part B: Example Projects:
1. Blinky example program using the Kinetis and ULINK2 or ULINKpro: 8 2. Hardware Breakpoints: 8 3. Watch and Memory Windows and how to use them: 9
a. Watch window: 9 b. Memory window: 10 c. How to view Local Variables in the Watch or Memory windows:
4. Getting the Serial Wire Viewer (SWV) working: 11 a. For ULINK2 or ULINK-ME: 11 b. For ULINKpro: 12
5. Using the Logic Analyzer (LA) with ULINK2 or ULINK-ME: 13 6. Watchpoints: 14 7. RTX_Blinky example program with Keil RTX RTOS: 15 8. RTX Kernel Awareness using Serial Wire Viewer (SWV): 16 9. Logic Analyzer Window: View variables real-time in a graphical format: 17 10. Serial Wire Viewer (SWV) and how to use it: (with ULINK2) 18
a. Data Reads and Writes: 18 b. Exceptions and Interrupts: 19 c. PC Samples: 20
11. ITM (Instruction Trace Macrocell) a printf feature: 21
PART C: ETM Embedded Trace Macrocell with the ULINKpro:
1. Configure the ULINKpro with ETM Trace: 22
a. Ini Initialization file 22
b. Configuring SWV and ETM 23
2. Blinky Example: ETM Frames from RESET and beyond: 24
3. Code Coverage: 25
4. Performance Analyzer (PA) 26
5. Execution Profiler 27
a. Outlining 27
6. In-The-Weeds Example 28 7. Serial Wire Viewer summary 29 8. Keil Products and contact information 30
Copyright © 2011 ARM Ltd. All rights reserved
Freescale Kinetis Cortex-M4 Lab with ARM® Keil™ MDK toolkit www.keil.com Preliminary
4
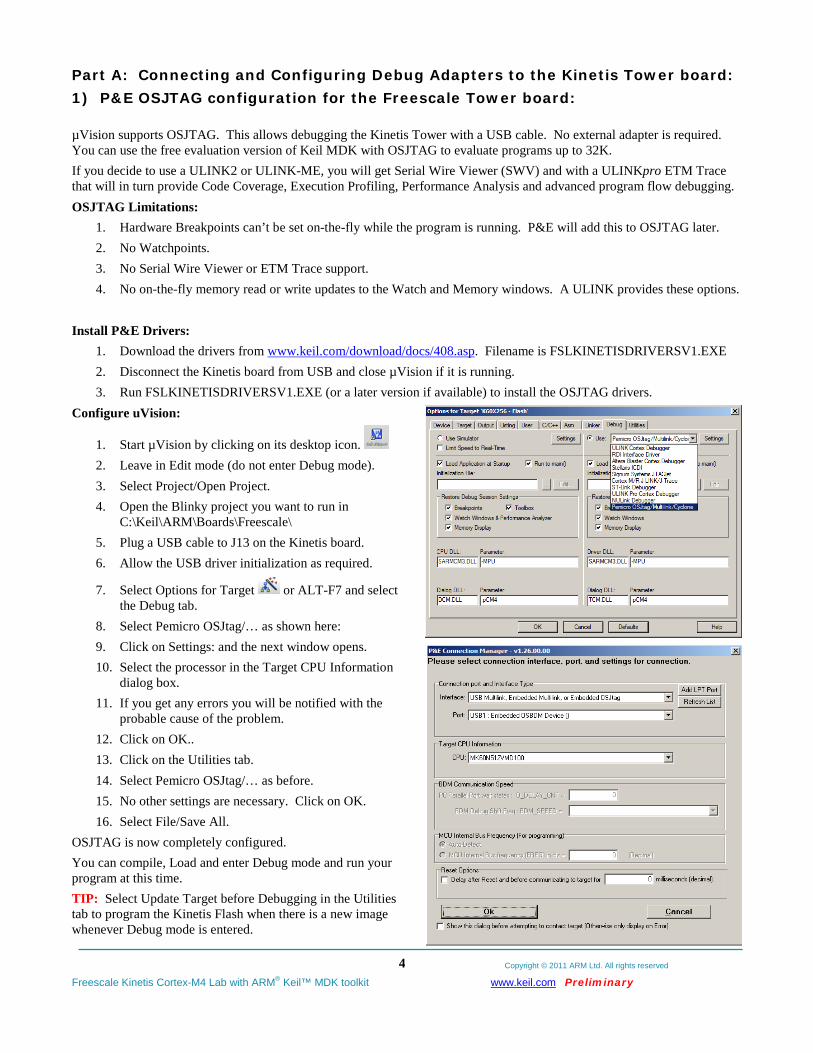
Part A: Connecting and Configuring Debug Adapters to the Kinetis Tower board: 1) P&E OSJTAG configuration for the Freescale Tower board: µVision supports OSJTAG. This allows debugging the Kinetis Tower with a USB cable. No external adapter is required. You can use the free evaluation version of Keil MDK with OSJTAG to evaluate programs up to 32K. If you decide to use a ULINK2 or ULINK-ME, you will get Serial Wire Viewer (SWV) and with a ULINKpro ETM Trace that will in turn provide Code Coverage, Execution Profiling, Performance Analysis and advanced program flow debugging. OSJTAG Limitations:
1. Hardware Breakpoints can’t be set on-the-fly while the program is running. P&E will add this to OSJTAG later. 2. No Watchpoints. 3. No Serial Wire Viewer or ETM Trace support. 4. No on-the-fly memory read or write updates to the Watch and Memory windows. A ULINK provides these options.
Install P&E Drivers:
1. Download the drivers from www.keil.com/download/docs/408.asp. Filename is FSLKINETISDRIVERSV1.EXE 2. Disconnect the Kinetis board from USB and close µVision if it is running. 3. Run FSLKINETISDRIVERSV1.EXE (or a later version if available) to install the OSJTAG drivers.
Configure uVision:
1. Start µVision by clicking on its desktop icon. 2. Leave in Edit mode (do not enter Debug mode). 3. Select Project/Open Project. 4. Open the Blinky project you want to run in
C:\Keil\ARM\Boards\Freescale\ 5. Plug a USB cable to J13 on the Kinetis board. 6. Allow the USB driver initialization as required.
7. Select Options for Target or ALT-F7 and select the Debug tab.
8. Select Pemicro OSJtag/… as shown here: 9. Click on Settings: and the next window opens. 10. Select the processor in the Target CPU Information
dialog box. 11. If you get any errors you will be notified with the
probable cause of the problem. 12. Click on OK.. 13. Click on the Utilities tab. 14. Select Pemicro OSJtag/… as before. 15. No other settings are necessary. Click on OK. 16. Select File/Save All.
OSJTAG is now completely configured. You can compile, Load and enter Debug mode and run your program at this time. TIP: Select Update Target before Debugging in the Utilities tab to program the Kinetis Flash when there is a new image whenever Debug mode is entered.
Copyright © 2011 ARM Ltd. All rights reserved
Freescale Kinetis Cortex-M4 Lab with ARM® Keil™ MDK toolkit www.keil.com Preliminary
5
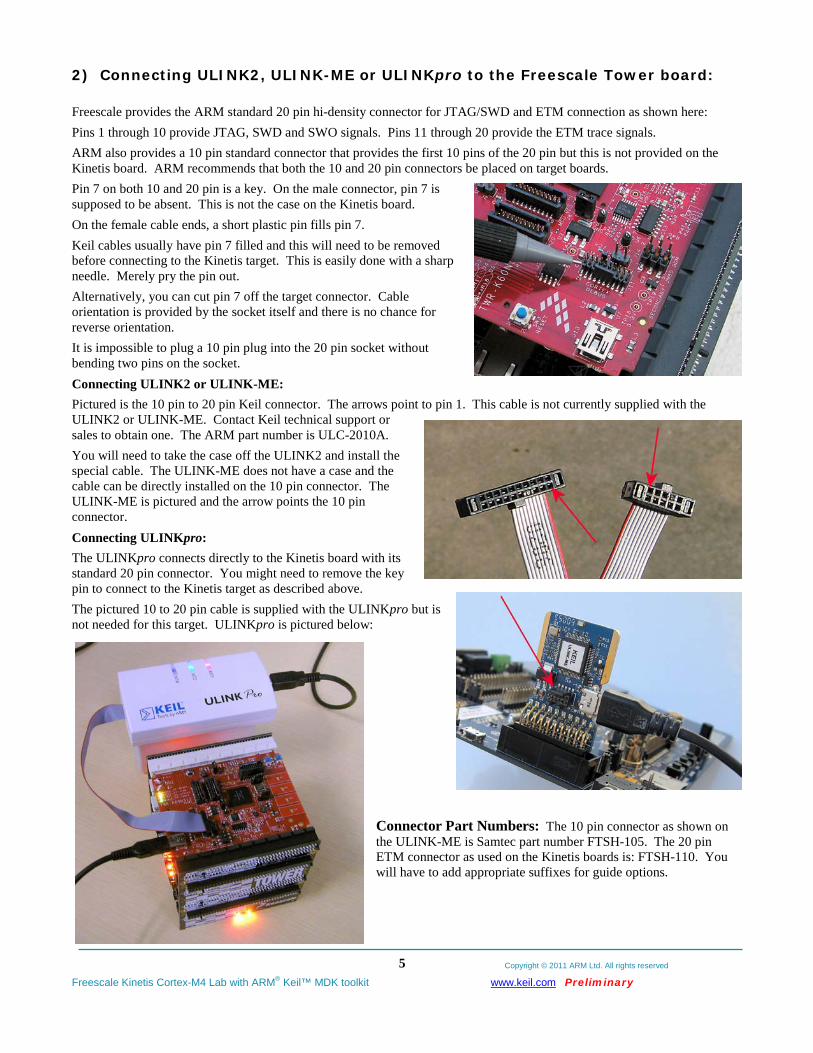
2) Connecting ULINK2, ULINK-ME or ULINKpro to the Freescale Tower board: Freescale provides the ARM standard 20 pin hi-density connector for JTAG/SWD and ETM connection as shown here: Pins 1 through 10 provide JTAG, SWD and SWO signals. Pins 11 through 20 provide the ETM trace signals. ARM also provides a 10 pin standard connector that provides the first 10 pins of the 20 pin but this is not provided on the Kinetis board. ARM recommends that both the 10 and 20 pin connectors be placed on target boards. Pin 7 on both 10 and 20 pin is a key. On the male connector, pin 7 is supposed to be absent. This is not the case on the Kinetis board. On the female cable ends, a short plastic pin fills pin 7. Keil cables usually have pin 7 filled and this will need to be removed before connecting to the Kinetis target. This is easily done with a sharp needle. Merely pry the pin out. Alternatively, you can cut pin 7 off the target connector. Cable orientation is provided by the socket itself and there is no chance for reverse orientation. It is impossible to plug a 10 pin plug into the 20 pin socket without bending two pins on the socket. Connecting ULINK2 or ULINK-ME: Pictured is the 10 pin to 20 pin Keil connector. The arrows point to pin 1. This cable is not currently supplied with the ULINK2 or ULINK-ME. Contact Keil technical support or sales to obtain one. The ARM part number is ULC-2010A. You will need to take the case off the ULINK2 and install the special cable. The ULINK-ME does not have a case and the cable can be directly installed on the 10 pin connector. The ULINK-ME is pictured and the arrow points the 10 pin connector. Connecting ULINKpro: The ULINKpro connects directly to the Kinetis board with its standard 20 pin connector. You might need to remove the key pin to connect to the Kinetis target as described above. The pictured 10 to 20 pin cable is supplied with the ULINKpro but is not needed for this target. ULINKpro is pictured below:
Connector Part Numbers: The 10 pin connector as shown on the ULINK-ME is Samtec part number FTSH-105. The 20 pin ETM connector as used on the Kinetis boards is: FTSH-110. You will have to add appropriate suffixes for guide options.
Copyright © 2011 ARM Ltd. All rights reserved
Freescale Kinetis Cortex-M4 Lab with ARM® Keil™ MDK toolkit www.keil.com Preliminary
6
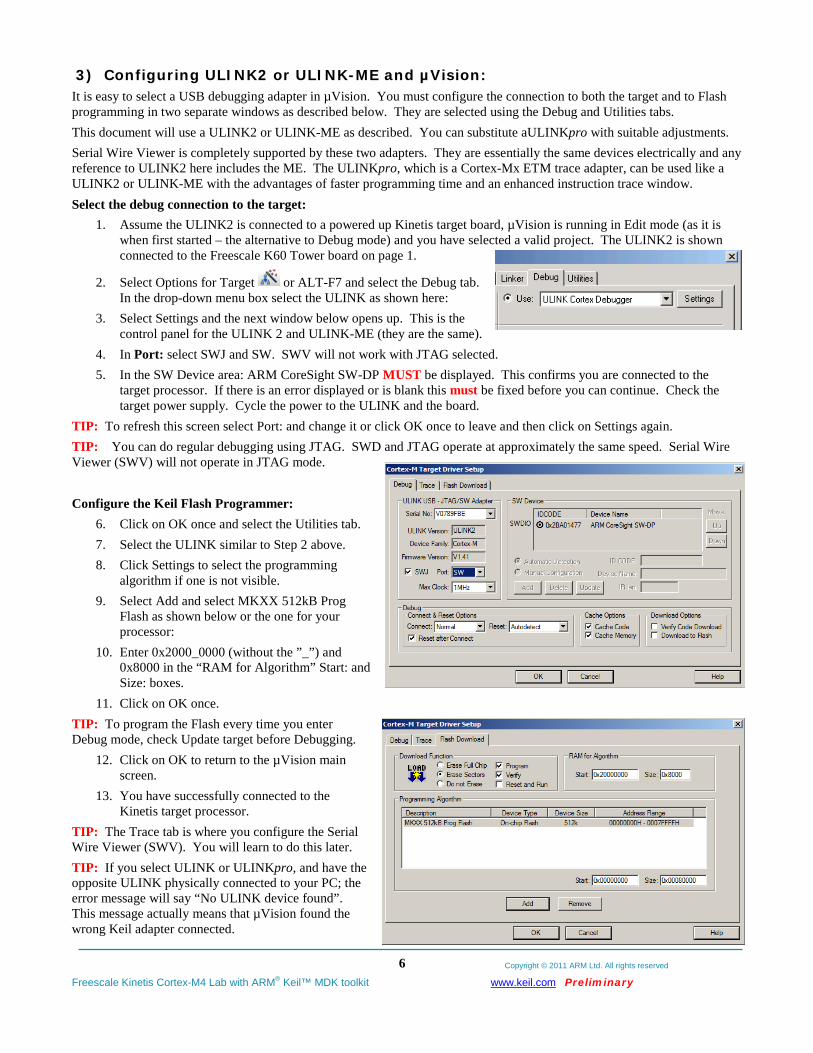
3) Configuring ULINK2 or ULINK-ME and µVision: It is easy to select a USB debugging adapter in µVision. You must configure the connection to both the target and to Flash programming in two separate windows as described below. They are selected using the Debug and Utilities tabs. This document will use a ULINK2 or ULINK-ME as described. You can substitute aULINKpro with suitable adjustments. Serial Wire Viewer is completely supported by these two adapters. They are essentially the same devices electrically and any reference to ULINK2 here includes the ME. The ULINKpro, which is a Cortex-Mx ETM trace adapter, can be used like a ULINK2 or ULINK-ME with the advantages of faster programming time and an enhanced instruction trace window. Select the debug connection to the target:
1. Assume the ULINK2 is connected to a powered up Kinetis target board, µVision is running in Edit mode (as it is when first started – the alternative to Debug mode) and you have selected a valid project. The ULINK2 is shown connected to the Freescale K60 Tower board on page 1.
2. Select Options for Target or ALT-F7 and select the Debug tab. In the drop-down menu box select the ULINK as shown here:
3. Select Settings and the next window below opens up. This is the control panel for the ULINK 2 and ULINK-ME (they are the same).
4. In Port: select SWJ and SW. SWV will not work with JTAG selected. 5. In the SW Device area: ARM CoreSight SW-DP MUST be displayed. This confirms you are connected to the
target processor. If there is an error displayed or is blank this must be fixed before you can continue. Check the target power supply. Cycle the power to the ULINK and the board.
TIP: To refresh this screen select Port: and change it or click OK once to leave and then click on Settings again. TIP: You can do regular debugging using JTAG. SWD and JTAG operate at approximately the same speed. Serial Wire Viewer (SWV) will not operate in JTAG mode. Configure the Keil Flash Programmer:
6. Click on OK once and select the Utilities tab. 7. Select the ULINK similar to Step 2 above. 8. Click Settings to select the programming
algorithm if one is not visible. 9. Select Add and select MKXX 512kB Prog
Flash as shown below or the one for your processor:
10. Enter 0x2000_0000 (without the ”_”) and 0x8000 in the “RAM for Algorithm” Start: and Size: boxes.
11. Click on OK once. TIP: To program the Flash every time you enter Debug mode, check Update target before Debugging.
12. Click on OK to return to the µVision main screen.
13. You have successfully connected to the Kinetis target processor.
TIP: The Trace tab is where you configure the Serial Wire Viewer (SWV). You will learn to do this later. TIP: If you select ULINK or ULINKpro, and have the opposite ULINK physically connected to your PC; the error message will say “No ULINK device found”. This message actually means that µVision found the wrong Keil adapter connected.
Copyright © 2011 ARM Ltd. All rights reserved
Freescale Kinetis Cortex-M4 Lab with ARM® Keil™ MDK toolkit www.keil.com Preliminary
7
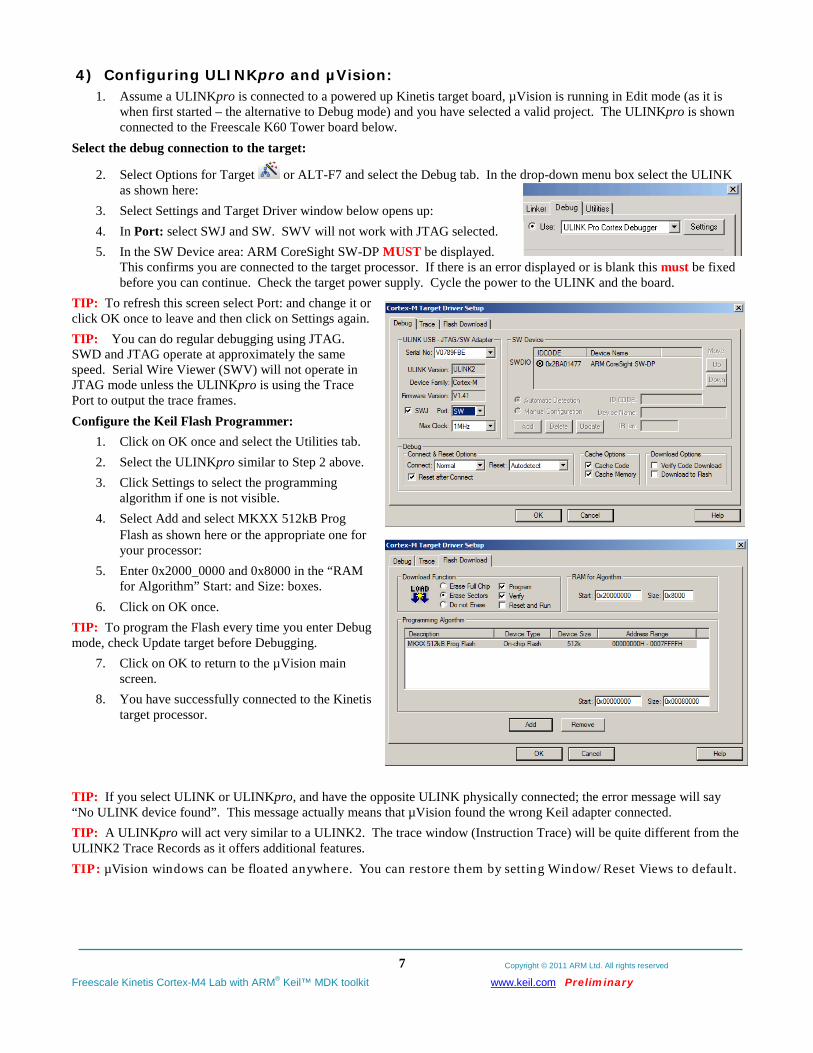
4) Configuring ULINKpro and µVision: 1. Assume a ULINKpro is connected to a powered up Kinetis target board, µVision is running in Edit mode (as it is
when first started – the alternative to Debug mode) and you have selected a valid project. The ULINKpro is shown connected to the Freescale K60 Tower board below.
Select the debug connection to the target:
2. Select Options for Target or ALT-F7 and select the Debug tab. In the drop-down menu box select the ULINK as shown here:
3. Select Settings and Target Driver window below opens up: 4. In Port: select SWJ and SW. SWV will not work with JTAG selected. 5. In the SW Device area: ARM CoreSight SW-DP MUST be displayed.
This confirms you are connected to the target processor. If there is an error displayed or is blank this must be fixed before you can continue. Check the target power supply. Cycle the power to the ULINK and the board.
TIP: To refresh this screen select Port: and change it or click OK once to leave and then click on Settings again. TIP: You can do regular debugging using JTAG. SWD and JTAG operate at approximately the same speed. Serial Wire Viewer (SWV) will not operate in JTAG mode unless the ULINKpro is using the Trace Port to output the trace frames. Configure the Keil Flash Programmer:
1. Click on OK once and select the Utilities tab. 2. Select the ULINKpro similar to Step 2 above. 3. Click Settings to select the programming
algorithm if one is not visible. 4. Select Add and select MKXX 512kB Prog
Flash as shown here or the appropriate one for your processor:
5. Enter 0x2000_0000 and 0x8000 in the “RAM for Algorithm” Start: and Size: boxes.
6. Click on OK once. TIP: To program the Flash every time you enter Debug mode, check Update target before Debugging.
7. Click on OK to return to the µVision main screen.
8. You have successfully connected to the Kinetis target processor.
TIP: If you select ULINK or ULINKpro, and have the opposite ULINK physically connected; the error message will say “No ULINK device found”. This message actually means that µVision found the wrong Keil adapter connected. TIP: A ULINKpro will act very similar to a ULINK2. The trace window (Instruction Trace) will be quite different from the ULINK2 Trace Records as it offers additional features. TIP: µVision windows can be floated anywhere. You can restore them by setting Window/Reset Views to default.
Copyright © 2011 ARM Ltd. All rights reserved
Freescale Kinetis Cortex-M4 Lab with ARM® Keil™ MDK toolkit www.keil.com Preliminary
8
Part B: Keil Example Projects 1) Blinky example program using the Kinetis and ULINK2 or ULINK-ME: Now we will connect a Keil MDK development system using real target hardware and a ULINK2 or ULINK-ME. These instructions use a K60 board. If you are using a K40 board, select the appropriate files and directories. It is possible to use the ULINKpro or the P&E OSJTAG. The Segger J-Link is also supported. Ulink2 is selected by default.
1. Connect the equipment as pictured on the first page.
2. Start µVision by clicking on its desktop icon. 3. Select Project/Open Project. Open the file C:\Keil\ARM\Boards\Freescale\TWR-K60N512\Blinky\Blinky.uvproj.
4. Make sure “K60X256 Flash” is selected (or the K40 if using that target). This is where you create and select different target configurations such as to execute a program in RAM or Flash.
5. Configure your USB-JTAG adapter if necessary at this point. See pages 4 for P&E and 7 for ULINKpro. 6. For the K60 only, in the file system_MK60N512MD100.c change #define CLOCK_SETUP 0. It is near line 75
and is “1” by default. If the program doesn’t work change it back to 1 and rebuild and flash the processor.
7. Compile the source files by clicking on the Rebuild icon. . You can also use the Build icon beside it.
8. Program the Kinetis flash by clicking on the Load icon: Progress will be indicated in the Output Window.
9. Enter Debug mode by clicking on the Debug icon. Select OK if the Evaluation Mode box appears. Note: You only need to use the Load icon to download to FLASH and not for RAM operation or the simulator.
10. Click on the RUN icon. Note: you stop the program with the STOP icon. The LEDs E1 through E3 on the Kinetis board will now blink.
Now you know how to compile a program, load it into the Kinetis processor Flash, run it and stop it.
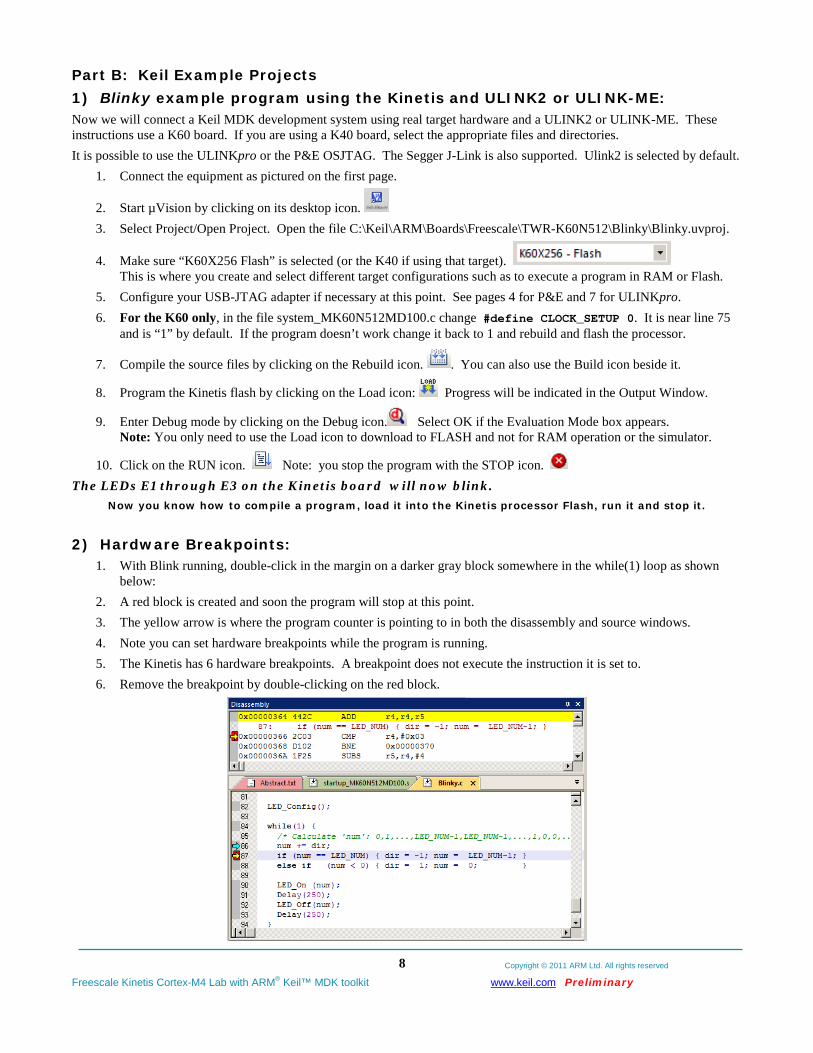
2) Hardware Breakpoints: 1. With Blink running, double-click in the margin on a darker gray block somewhere in the while(1) loop as shown
below: 2. A red block is created and soon the program will stop at this point. 3. The yellow arrow is where the program counter is pointing to in both the disassembly and source windows. 4. Note you can set hardware breakpoints while the program is running. 5. The Kinetis has 6 hardware breakpoints. A breakpoint does not execute the instruction it is set to. 6. Remove the breakpoint by double-clicking on the red block.
Copyright © 2011 ARM Ltd. All rights reserved
Freescale Kinetis Cortex-M4 Lab with ARM® Keil™ MDK toolkit www.keil.com Preliminary
9
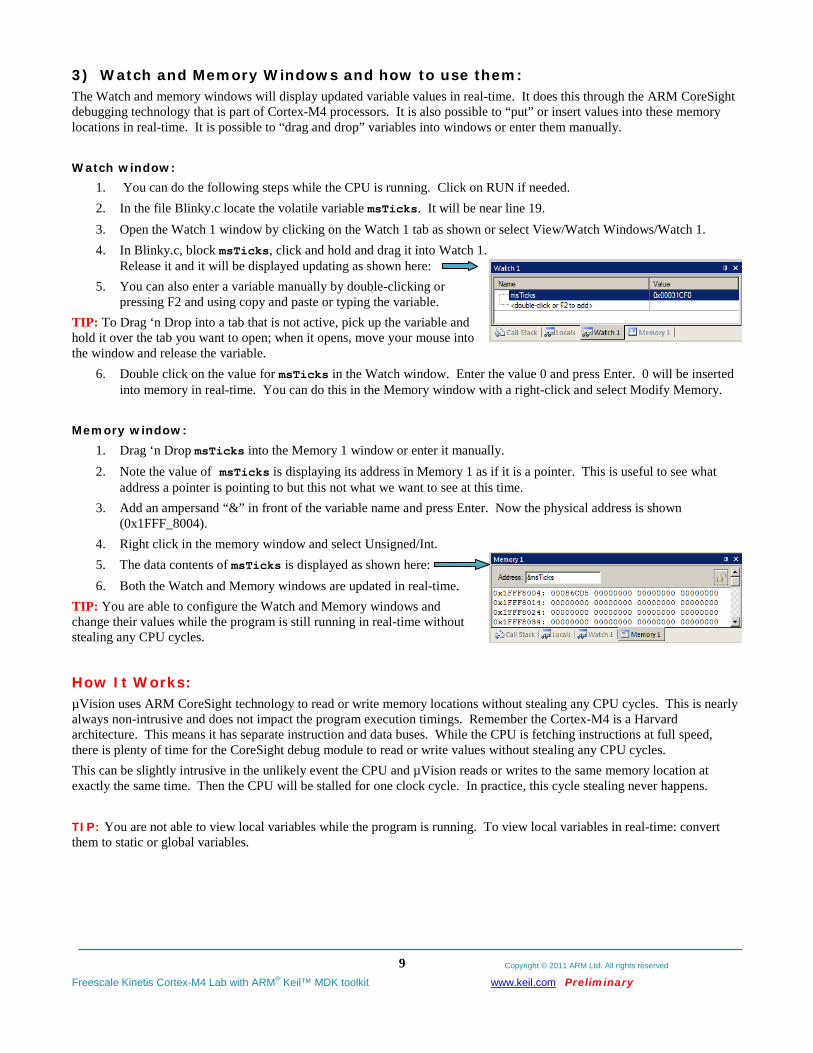
3) Watch and Memory Windows and how to use them: The Watch and memory windows will display updated variable values in real-time. It does this through the ARM CoreSight debugging technology that is part of Cortex-M4 processors. It is also possible to “put” or insert values into these memory locations in real-time. It is possible to “drag and drop” variables into windows or enter them manually. Watch window:
1. You can do the following steps while the CPU is running. Click on RUN if needed. 2. In the file Blinky.c locate the volatile variable msTicks. It will be near line 19. 3. Open the Watch 1 window by clicking on the Watch 1 tab as shown or select View/Watch Windows/Watch 1. 4. In Blinky.c, block msTicks, click and hold and drag it into Watch 1.
Release it and it will be displayed updating as shown here: 5. You can also enter a variable manually by double-clicking or
pressing F2 and using copy and paste or typing the variable. TIP: To Drag ‘n Drop into a tab that is not active, pick up the variable and hold it over the tab you want to open; when it opens, move your mouse into the window and release the variable.
6. Double click on the value for msTicks in the Watch window. Enter the value 0 and press Enter. 0 will be inserted into memory in real-time. You can do this in the Memory window with a right-click and select Modify Memory.
Memory window:
1. Drag ‘n Drop msTicks into the Memory 1 window or enter it manually. 2. Note the value of msTicks is displaying its address in Memory 1 as if it is a pointer. This is useful to see what
address a pointer is pointing to but this not what we want to see at this time. 3. Add an ampersand “&” in front of the variable name and press Enter. Now the physical address is shown
(0x1FFF_8004). 4. Right click in the memory window and select Unsigned/Int. 5. The data contents of msTicks is displayed as shown here: 6. Both the Watch and Memory windows are updated in real-time.
TIP: You are able to configure the Watch and Memory windows and change their values while the program is still running in real-time without stealing any CPU cycles.
How It Works: µVision uses ARM CoreSight technology to read or write memory locations without stealing any CPU cycles. This is nearly always non-intrusive and does not impact the program execution timings. Remember the Cortex-M4 is a Harvard architecture. This means it has separate instruction and data buses. While the CPU is fetching instructions at full speed, there is plenty of time for the CoreSight debug module to read or write values without stealing any CPU cycles. This can be slightly intrusive in the unlikely event the CPU and µVision reads or writes to the same memory location at exactly the same time. Then the CPU will be stalled for one clock cycle. In practice, this cycle stealing never happens. TIP: You are not able to view local variables while the program is running. To view local variables in real-time: convert them to static or global variables.
Copyright © 2011 ARM Ltd. All rights reserved
Freescale Kinetis Cortex-M4 Lab with ARM® Keil™ MDK toolkit www.keil.com Preliminary
10
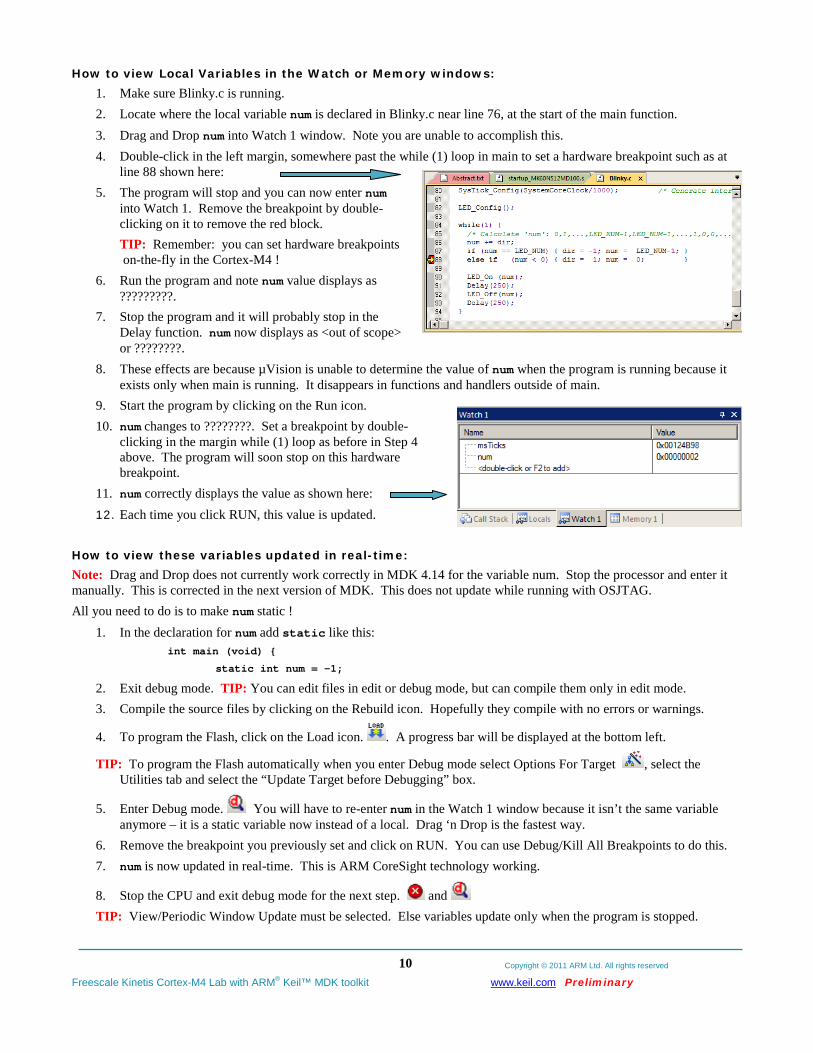
How to view Local Variables in the Watch or Memory windows: 1. Make sure Blinky.c is running. 2. Locate where the local variable num is declared in Blinky.c near line 76, at the start of the main function. 3. Drag and Drop num into Watch 1 window. Note you are unable to accomplish this. 4. Double-click in the left margin, somewhere past the while (1) loop in main to set a hardware breakpoint such as at
line 88 shown here: 5. The program will stop and you can now enter num
into Watch 1. Remove the breakpoint by double-clicking on it to remove the red block. TIP: Remember: you can set hardware breakpoints on-the-fly in the Cortex-M4 !
6. Run the program and note num value displays as ?????????.
7. Stop the program and it will probably stop in the Delay function. num now displays as <out of scope> or ????????.
8. These effects are because µVision is unable to determine the value of num when the program is running because it exists only when main is running. It disappears in functions and handlers outside of main.
9. Start the program by clicking on the Run icon. 10. num changes to ????????. Set a breakpoint by double-
clicking in the margin while (1) loop as before in Step 4 above. The program will soon stop on this hardware breakpoint.
11. num correctly displays the value as shown here: 12. Each time you click RUN, this value is updated.
How to view these variables updated in real-time: Note: Drag and Drop does not currently work correctly in MDK 4.14 for the variable num. Stop the processor and enter it manually. This is corrected in the next version of MDK. This does not update while running with OSJTAG. All you need to do is to make num static !
1. In the declaration for num add static like this: int main (void) {
static int num = -1;
2. Exit debug mode. TIP: You can edit files in edit or debug mode, but can compile them only in edit mode. 3. Compile the source files by clicking on the Rebuild icon. Hopefully they compile with no errors or warnings.
4. To program the Flash, click on the Load icon. . A progress bar will be displayed at the bottom left.
TIP: To program the Flash automatically when you enter Debug mode select Options For Target , select the Utilities tab and select the “Update Target before Debugging” box.
5. Enter Debug mode. You will have to re-enter num in the Watch 1 window because it isn’t the same variable anymore – it is a static variable now instead of a local. Drag ‘n Drop is the fastest way.
6. Remove the breakpoint you previously set and click on RUN. You can use Debug/Kill All Breakpoints to do this. 7. num is now updated in real-time. This is ARM CoreSight technology working.
8. Stop the CPU and exit debug mode for the next step. and TIP: View/Periodic Window Update must be selected. Else variables update only when the program is stopped.
Copyright © 2011 ARM Ltd. All rights reserved
Freescale Kinetis Cortex-M4 Lab with ARM® Keil™ MDK toolkit www.keil.com Preliminary
11
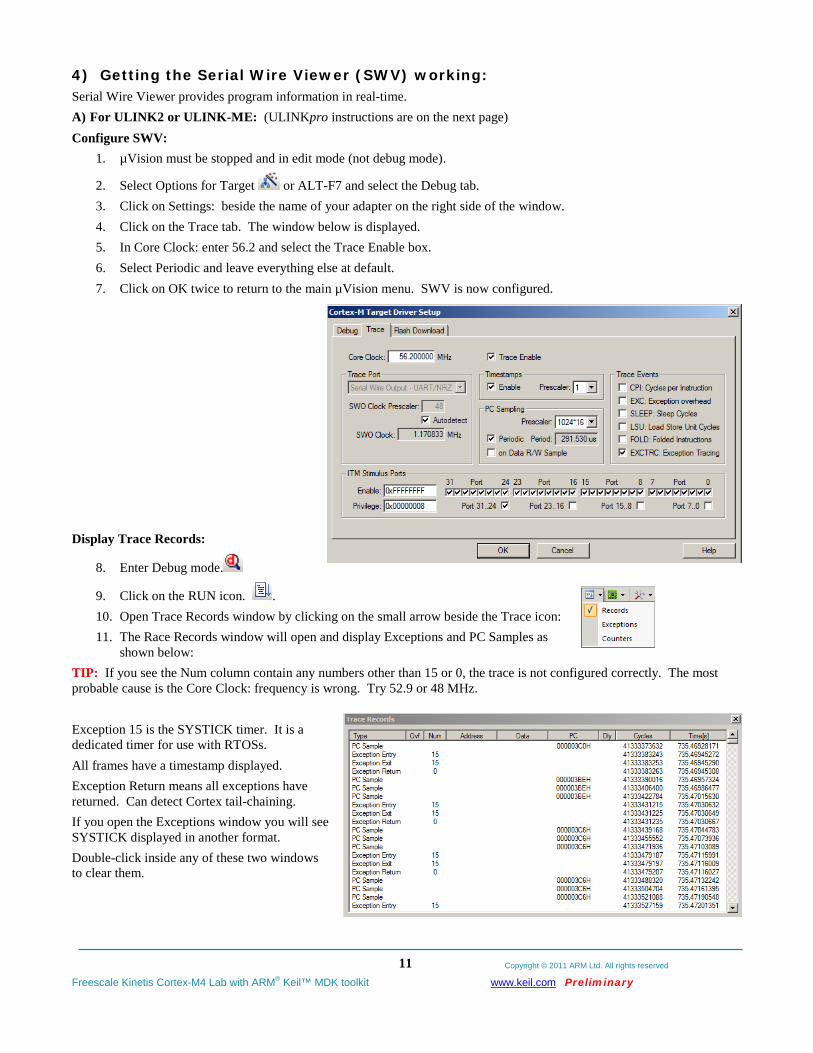
4) Getting the Serial Wire Viewer (SWV) working: Serial Wire Viewer provides program information in real-time. A) For ULINK2 or ULINK-ME: (ULINKpro instructions are on the next page) Configure SWV:
1. µVision must be stopped and in edit mode (not debug mode).
2. Select Options for Target or ALT-F7 and select the Debug tab. 3. Click on Settings: beside the name of your adapter on the right side of the window. 4. Click on the Trace tab. The window below is displayed. 5. In Core Clock: enter 56.2 and select the Trace Enable box. 6. Select Periodic and leave everything else at default. 7. Click on OK twice to return to the main µVision menu. SWV is now configured.
Display Trace Records:
8. Enter Debug mode.
9. Click on the RUN icon. . 10. Open Trace Records window by clicking on the small arrow beside the Trace icon: 11. The Race Records window will open and display Exceptions and PC Samples as
shown below: TIP: If you see the Num column contain any numbers other than 15 or 0, the trace is not configured correctly. The most probable cause is the Core Clock: frequency is wrong. Try 52.9 or 48 MHz. Exception 15 is the SYSTICK timer. It is a dedicated timer for use with RTOSs. All frames have a timestamp displayed. Exception Return means all exceptions have returned. Can detect Cortex tail-chaining. If you open the Exceptions window you will see SYSTICK displayed in another format. Double-click inside any of these two windows to clear them.
Copyright © 2011 ARM Ltd. All rights reserved
Freescale Kinetis Cortex-M4 Lab with ARM® Keil™ MDK toolkit www.keil.com Preliminary
12
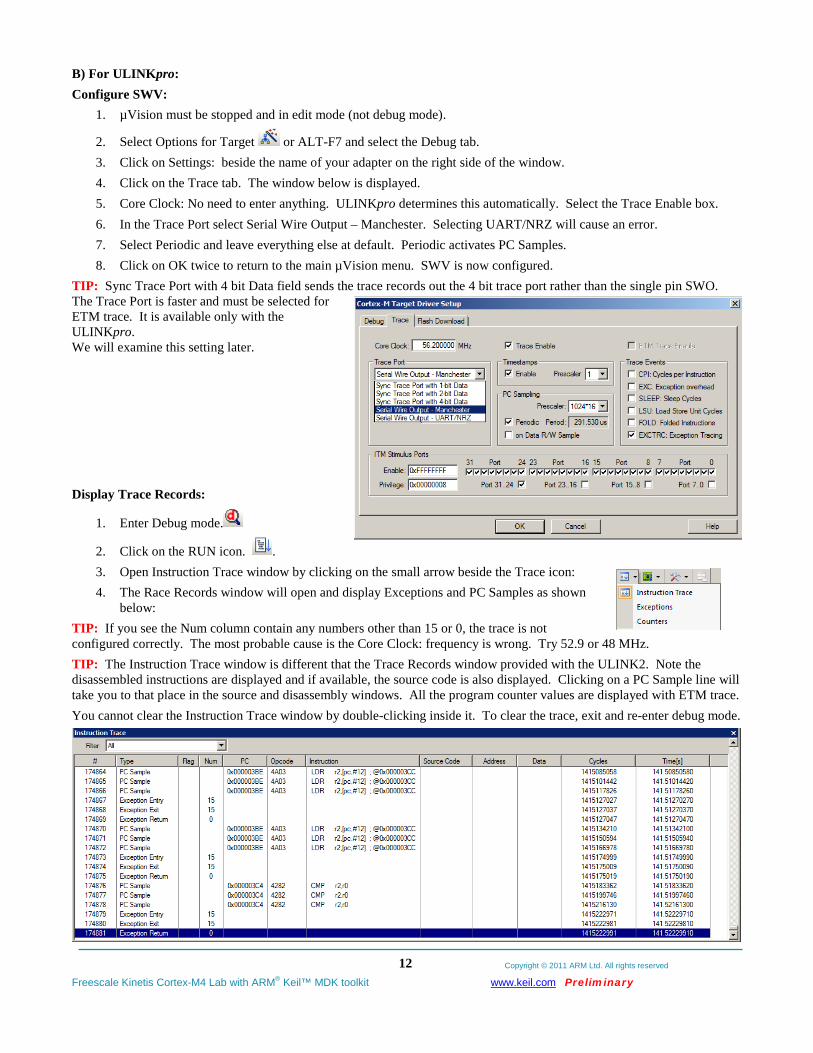
B) For ULINKpro: Configure SWV:
1. µVision must be stopped and in edit mode (not debug mode).
2. Select Options for Target or ALT-F7 and select the Debug tab. 3. Click on Settings: beside the name of your adapter on the right side of the window. 4. Click on the Trace tab. The window below is displayed. 5. Core Clock: No need to enter anything. ULINKpro determines this automatically. Select the Trace Enable box. 6. In the Trace Port select Serial Wire Output – Manchester. Selecting UART/NRZ will cause an error. 7. Select Periodic and leave everything else at default. Periodic activates PC Samples. 8. Click on OK twice to return to the main µVision menu. SWV is now configured.
TIP: Sync Trace Port with 4 bit Data field sends the trace records out the 4 bit trace port rather than the single pin SWO. The Trace Port is faster and must be selected for ETM trace. It is available only with the ULINKpro. We will examine this setting later.
Display Trace Records:
1. Enter Debug mode.
2. Click on the RUN icon. . 3. Open Instruction Trace window by clicking on the small arrow beside the Trace icon: 4. The Race Records window will open and display Exceptions and PC Samples as shown
below: TIP: If you see the Num column contain any numbers other than 15 or 0, the trace is not configured correctly. The most probable cause is the Core Clock: frequency is wrong. Try 52.9 or 48 MHz. TIP: The Instruction Trace window is different that the Trace Records window provided with the ULINK2. Note the disassembled instructions are displayed and if available, the source code is also displayed. Clicking on a PC Sample line will take you to that place in the source and disassembly windows. All the program counter values are displayed with ETM trace. You cannot clear the Instruction Trace window by double-clicking inside it. To clear the trace, exit and re-enter debug mode.
Copyright © 2011 ARM Ltd. All rights reserved
Freescale Kinetis Cortex-M4 Lab with ARM® Keil™ MDK toolkit www.keil.com Preliminary
13
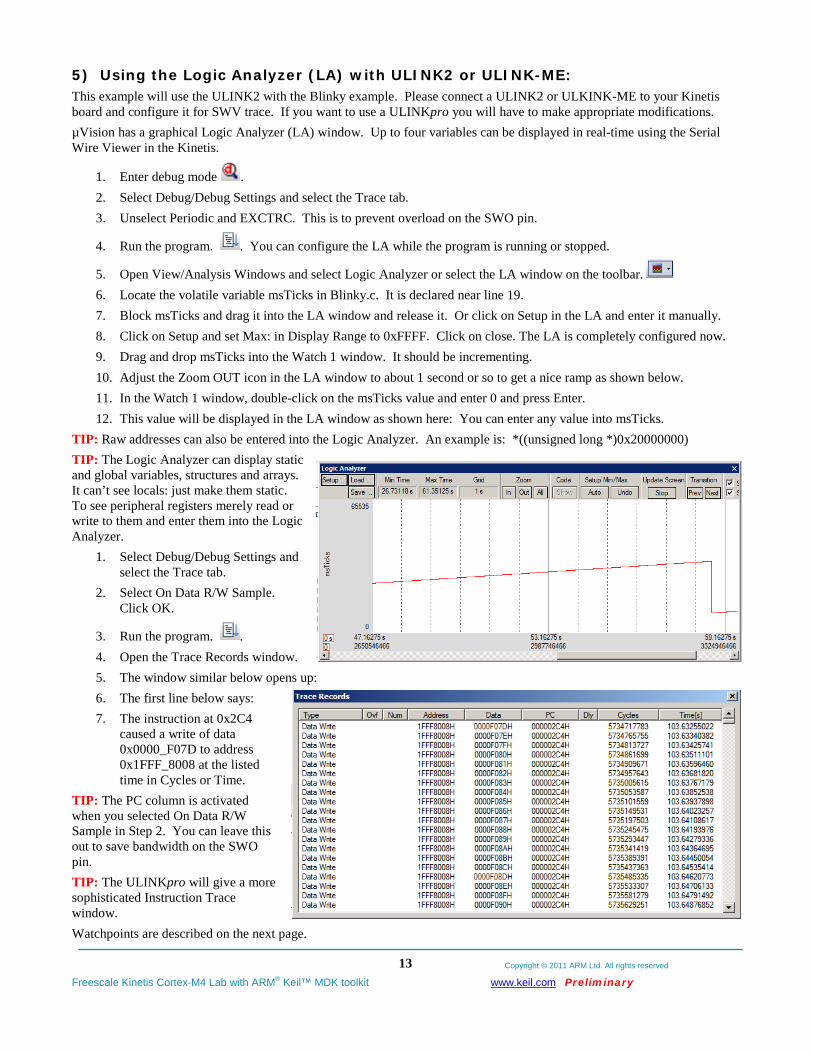
5) Using the Logic Analyzer (LA) with ULINK2 or ULINK-ME: This example will use the ULINK2 with the Blinky example. Please connect a ULINK2 or ULKINK-ME to your Kinetis board and configure it for SWV trace. If you want to use a ULINKpro you will have to make appropriate modifications. µVision has a graphical Logic Analyzer (LA) window. Up to four variables can be displayed in real-time using the Serial Wire Viewer in the Kinetis.
1. Enter debug mode . 2. Select Debug/Debug Settings and select the Trace tab. 3. Unselect Periodic and EXCTRC. This is to prevent overload on the SWO pin.
4. Run the program. . You can configure the LA while the program is running or stopped.
5. Open View/Analysis Windows and select Logic Analyzer or select the LA window on the toolbar. 6. Locate the volatile variable msTicks in Blinky.c. It is declared near line 19. 7. Block msTicks and drag it into the LA window and release it. Or click on Setup in the LA and enter it manually. 8. Click on Setup and set Max: in Display Range to 0xFFFF. Click on close. The LA is completely configured now. 9. Drag and drop msTicks into the Watch 1 window. It should be incrementing. 10. Adjust the Zoom OUT icon in the LA window to about 1 second or so to get a nice ramp as shown below. 11. In the Watch 1 window, double-click on the msTicks value and enter 0 and press Enter. 12. This value will be displayed in the LA window as shown here: You can enter any value into msTicks.
TIP: Raw addresses can also be entered into the Logic Analyzer. An example is: *((unsigned long *)0x20000000) TIP: The Logic Analyzer can display static and global variables, structures and arrays. It can’t see locals: just make them static. To see peripheral registers merely read or write to them and enter them into the Logic Analyzer.
1. Select Debug/Debug Settings and select the Trace tab.
2. Select On Data R/W Sample. Click OK.
3. Run the program. . 4. Open the Trace Records window. 5. The window similar below opens up: 6. The first line below says: 7. The instruction at 0x2C4
caused a write of data 0x0000_F07D to address 0x1FFF_8008 at the listed time in Cycles or Time.
TIP: The PC column is activated when you selected On Data R/W Sample in Step 2. You can leave this out to save bandwidth on the SWO pin. TIP: The ULINKpro will give a more sophisticated Instruction Trace window. Watchpoints are described on the next page.
Copyright © 2011 ARM Ltd. All rights reserved
Freescale Kinetis Cortex-M4 Lab with ARM® Keil™ MDK toolkit www.keil.com Preliminary
14
6) Watchpoints: Conditional Breakpoints The Kinetis Cortex-M4 processors have four Watchpoints. Watchpoints can be thought of as conditional breakpoints. The Logic Analyzer uses watchpoints in its operations. This means in µVision you must have two variables free in the Logic Analyzer to use Watchpoints.
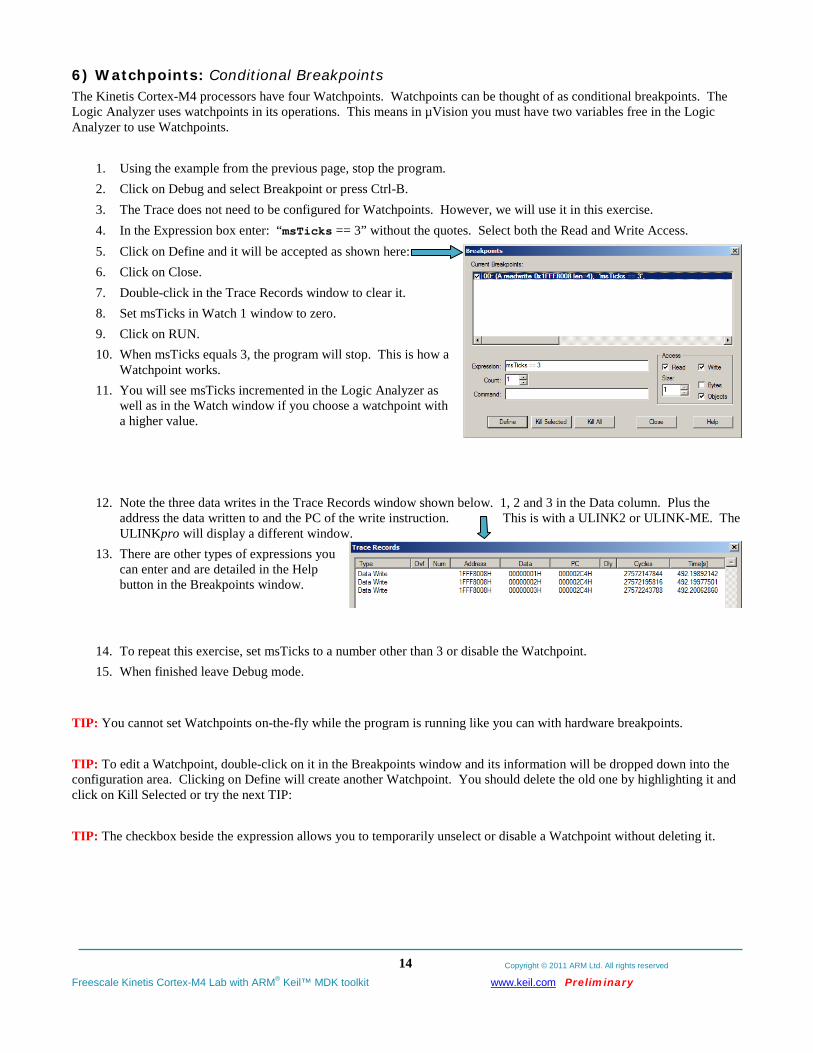
1. Using the example from the previous page, stop the program. 2. Click on Debug and select Breakpoint or press Ctrl-B. 3. The Trace does not need to be configured for Watchpoints. However, we will use it in this exercise. 4. In the Expression box enter: “msTicks == 3” without the quotes. Select both the Read and Write Access. 5. Click on Define and it will be accepted as shown here: 6. Click on Close. 7. Double-click in the Trace Records window to clear it. 8. Set msTicks in Watch 1 window to zero. 9. Click on RUN. 10. When msTicks equals 3, the program will stop. This is how a
Watchpoint works. 11. You will see msTicks incremented in the Logic Analyzer as
well as in the Watch window if you choose a watchpoint with a higher value.
12. Note the three data writes in the Trace Records window shown below. 1, 2 and 3 in the Data column. Plus the address the data written to and the PC of the write instruction. This is with a ULINK2 or ULINK-ME. The ULINKpro will display a different window.
13. There are other types of expressions you can enter and are detailed in the Help button in the Breakpoints window.
14. To repeat this exercise, set msTicks to a number other than 3 or disable the Watchpoint. 15. When finished leave Debug mode.
TIP: You cannot set Watchpoints on-the-fly while the program is running like you can with hardware breakpoints. TIP: To edit a Watchpoint, double-click on it in the Breakpoints window and its information will be dropped down into the configuration area. Clicking on Define will create another Watchpoint. You should delete the old one by highlighting it and click on Kill Selected or try the next TIP: TIP: The checkbox beside the expression allows you to temporarily unselect or disable a Watchpoint without deleting it.

Copyright © 2011 ARM Ltd. All rights reserved
Freescale Kinetis Cortex-M4 Lab with ARM® Keil™ MDK toolkit www.keil.com Preliminary
15
7) RTX_Blinky Example Program with Keil RTX RTOS: A Stepper Motor example Keil provides RTX, a full feature RTOS. RTX is included for no charge as part of the Keil MDK full tool suite. It can have up to 255 tasks and no royalty payments are required. If source code is required, this is included in the Keil RL-ARM™ Real-Time Library which also includes USB, CAN, TCP/IP networking and a Flash File system. This example explores the RTOS project. Keil will work with any RTOS. An RTOS is just a set of C functions that gets compiled with your project.
1. Start µVision by clicking on its icon on your Desktop if it is not already running. 2. Select Project/Open Project. 3. Open the file C:\Keil\ARM\Boards\Freescale\TWR-K60N512\RTX_Blinky\Blinky.uvproj. 4. Since RTX_Blinky uses a ULINKpro as default: if you are using a ULINK2 please configure it as described on page
4 under 2) ULINK2 or ULINK-ME and µVision Configuration: You do not need to configure the trace yet. You only have to do this once – it will be saved in the project file. You can also make a new target configuration.
5. Compile the source files by clicking on the Rebuild icon. . They will compile with no errors or warnings.
6. To program the Flash manually, click on the Load icon. . A progress bar will be at the bottom left.
7. Enter the Debug mode by clicking on the debug icon and click on the RUN icon.
8. The LEDs will blink indicating the four waveforms of a stepper motor driver changing. Click on STOP . The Configuration Wizard for RTX:
1. Click on the RTX_Conf_CM.c source file tab as shown below on the left. You can open it with File/Open. 2. Click on Configuration Wizard at the bottom and your view will change to the Configuration Wizard. 3. Open up the individual directories to show the various configuration items available. 4. See how easy it is to modify these settings here as opposed to finding and changing entries in the source code. 5. This is a great feature as it is much easier changing items here than in the source code. 6. You can create Configuration Wizards in any source file with the scripting language as used in the Text Editor. 7. This scripting language is shown below in the Text Editor as comments starting such as a </h> or <i>. 8. The new µVision4 System Viewer windows are created in a similar fashion. Available Q4 2010.
Text Editor: Source Code Configuration Wizard
Copyright © 2011 ARM Ltd. All rights reserved
Freescale Kinetis Cortex-M4 Lab with ARM® Keil™ MDK toolkit www.keil.com Preliminary
16
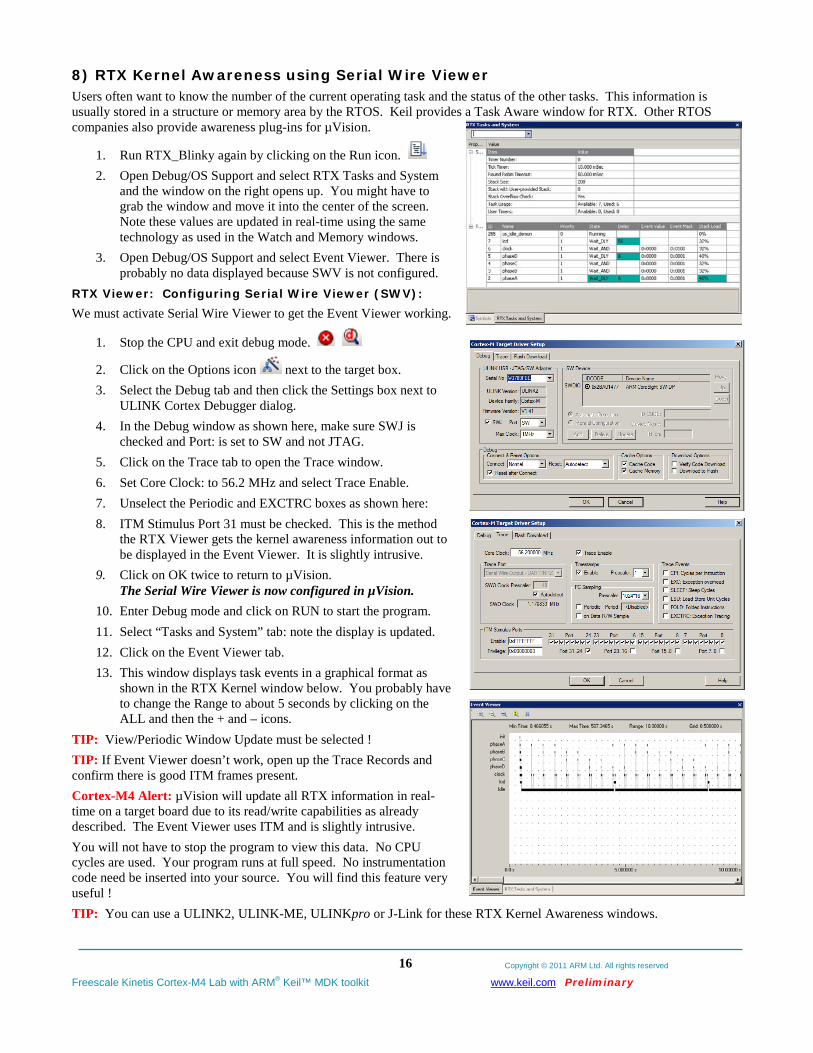
8) RTX Kernel Awareness using Serial Wire Viewer Users often want to know the number of the current operating task and the status of the other tasks. This information is usually stored in a structure or memory area by the RTOS. Keil provides a Task Aware window for RTX. Other RTOS companies also provide awareness plug-ins for µVision.
1. Run RTX_Blinky again by clicking on the Run icon. 2. Open Debug/OS Support and select RTX Tasks and System
and the window on the right opens up. You might have to grab the window and move it into the center of the screen. Note these values are updated in real-time using the same technology as used in the Watch and Memory windows.
3. Open Debug/OS Support and select Event Viewer. There is probably no data displayed because SWV is not configured.
RTX Viewer: Configuring Serial Wire Viewer (SWV): We must activate Serial Wire Viewer to get the Event Viewer working.
1. Stop the CPU and exit debug mode.
2. Click on the Options icon next to the target box. 3. Select the Debug tab and then click the Settings box next to
ULINK Cortex Debugger dialog. 4. In the Debug window as shown here, make sure SWJ is
checked and Port: is set to SW and not JTAG. 5. Click on the Trace tab to open the Trace window. 6. Set Core Clock: to 56.2 MHz and select Trace Enable. 7. Unselect the Periodic and EXCTRC boxes as shown here: 8. ITM Stimulus Port 31 must be checked. This is the method
the RTX Viewer gets the kernel awareness information out to be displayed in the Event Viewer. It is slightly intrusive.
9. Click on OK twice to return to µVision. The Serial Wire Viewer is now configured in µVision.
10. Enter Debug mode and click on RUN to start the program. 11. Select “Tasks and System” tab: note the display is updated. 12. Click on the Event Viewer tab. 13. This window displays task events in a graphical format as
shown in the RTX Kernel window below. You probably have to change the Range to about 5 seconds by clicking on the ALL and then the + and – icons.
TIP: View/Periodic Window Update must be selected ! TIP: If Event Viewer doesn’t work, open up the Trace Records and confirm there is good ITM frames present. Cortex-M4 Alert: µVision will update all RTX information in real-time on a target board due to its read/write capabilities as already described. The Event Viewer uses ITM and is slightly intrusive. You will not have to stop the program to view this data. No CPU cycles are used. Your program runs at full speed. No instrumentation code need be inserted into your source. You will find this feature very useful ! TIP: You can use a ULINK2, ULINK-ME, ULINKpro or J-Link for these RTX Kernel Awareness windows.

Copyright © 2011 ARM Ltd. All rights reserved
Freescale Kinetis Cortex-M4 Lab with ARM® Keil™ MDK toolkit www.keil.com Preliminary
17
9) Logic Analyzer Window: View variables real-time in a graphical format: µVision has a graphical Logic Analyzer window. Up to four variables can be displayed in real-time using the Serial Wire Viewer in the Kinetis. RTX_Blinky uses four tasks to create the waveforms. We will graph these four waveforms.
1. Close the RTX Viewer windows. Stop the program and exit debug mode. 2. Add 4 global variables unsigned int phasea through unsigned int phased to Blinky.c as shown here: 3. Add 2 lines to each of the four tasks Task1 through Task4 in Blinky.c as
shown below: phasea=1; and phasea=0; :the first two lines are shown added at lines 081 and 084 (just after LED_On and LED_Off function calls). For each of the four tasks, add the corresponding variable assignment statements phasea, phaseb, phasec and phased.
4. We do this because in this simple program there are not enough suitable variables to connect to the Logic Analyzer.
TIP: The Logic Analyzer can display static and global variables, structures and arrays. It can’t see locals: just make them static. To see peripheral registers merely read or write to them and enter them into the Logic Analyzer.
5. Rebuild the project. Program the Flash .
6. Enter debug mode .
7. You can run the program at this point. 8. Open View/Analysis Windows and select Logic Analyzer
or select the LA window on the toolbar. Enter the Variables into the Logic Analyzer:
9. Click on the Blinky.c tab. Block phasea, click, hold and drag up to the Logic Analyzer tab (don’t let go yet!) 10. When it opens, bring the mouse down anywhere into the Logic Analyzer window and release. 11. Repeat for phaseb, phasec and phased. These variables will be listed on the left side of the LA window as
shown. Now we have to adjust the scaling. 12. Click on the Setup icon and click on each of the four variables and set Max. in the Display Range: to 0x3. 13. Click on Close to go back to the LA window. 14. Using the OUT and In buttons set the range to 20 seconds. Move the scrolling bar to the far right if needed. 15. You will see the following waveforms appear. Click to mark a place See 252 s below. Place the cursor on one of
the waveforms and get timing and other information as shown in the inserted box labeled phasec:
TIP: You can also enter these variables into the Watch and Memory windows to display and change them in real-time.
Copyright © 2011 ARM Ltd. All rights reserved
Freescale Kinetis Cortex-M4 Lab with ARM® Keil™ MDK toolkit www.keil.com Preliminary
18
10) Serial Wire Viewer (SWV) and how to use it: a) Data Reads and Writes: (Note: Data Reads but not Writes are disabled in the current version of µVision). You have configured Serial Wire Viewer (SWV) in Section 6 under RTX Viewer: Configuring the Serial Wire Viewer:
Now we will examine some of the features available to you. SWV works with µVision and a ULINK2, ULINK-ME, ULINKpro or a Segger J-Link V6 or higher. SWV is included with MDK and no other equipment must be purchased. Everything shown here is done without stealing any CPU cycles and is completely non-intrusive. A user program runs at full speed and needs no code stubs or instrumentation software added to your programs.
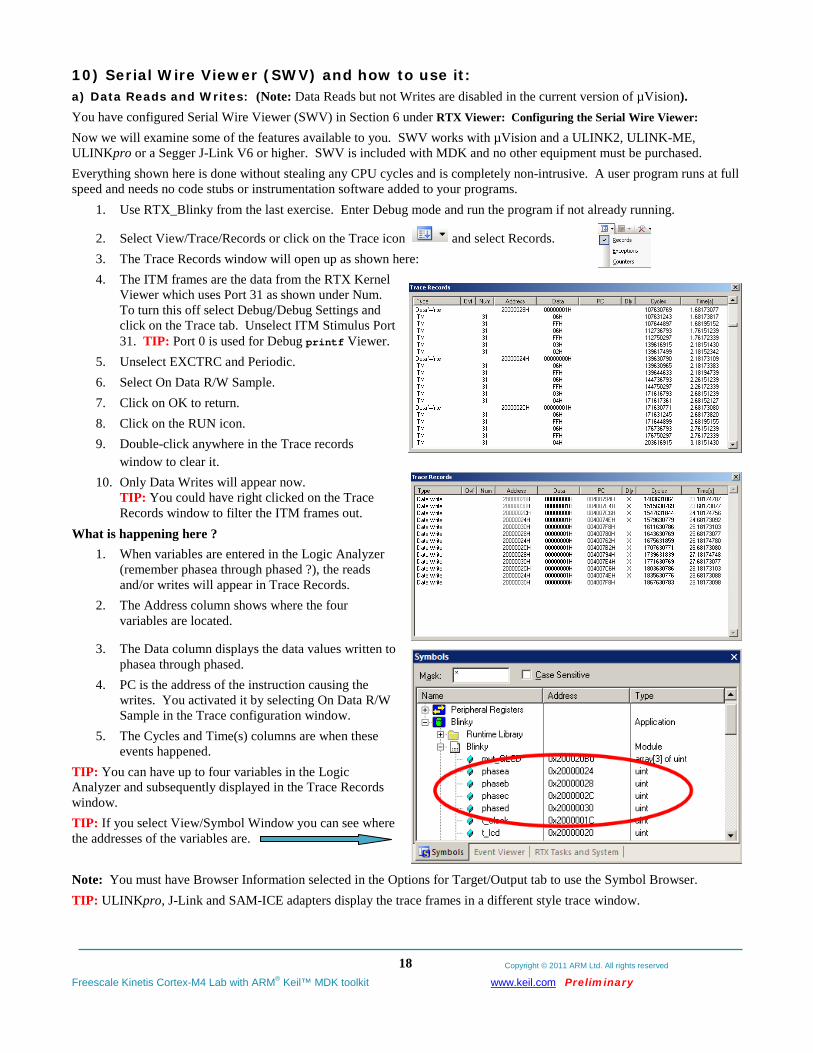
1. Use RTX_Blinky from the last exercise. Enter Debug mode and run the program if not already running.
2. Select View/Trace/Records or click on the Trace icon and select Records. 3. The Trace Records window will open up as shown here: 4. The ITM frames are the data from the RTX Kernel
Viewer which uses Port 31 as shown under Num. To turn this off select Debug/Debug Settings and click on the Trace tab. Unselect ITM Stimulus Port 31. TIP: Port 0 is used for Debug printf Viewer.
5. Unselect EXCTRC and Periodic. 6. Select On Data R/W Sample. 7. Click on OK to return. 8. Click on the RUN icon. 9. Double-click anywhere in the Trace records
window to clear it. 10. Only Data Writes will appear now.
TIP: You could have right clicked on the Trace Records window to filter the ITM frames out.
What is happening here ? 1. When variables are entered in the Logic Analyzer
(remember phasea through phased ?), the reads and/or writes will appear in Trace Records.
2. The Address column shows where the four variables are located.
3. The Data column displays the data values written to phasea through phased.
4. PC is the address of the instruction causing the writes. You activated it by selecting On Data R/W Sample in the Trace configuration window.
5. The Cycles and Time(s) columns are when these events happened.
TIP: You can have up to four variables in the Logic Analyzer and subsequently displayed in the Trace Records window. TIP: If you select View/Symbol Window you can see where the addresses of the variables are. Note: You must have Browser Information selected in the Options for Target/Output tab to use the Symbol Browser. TIP: ULINKpro, J-Link and SAM-ICE adapters display the trace frames in a different style trace window.
Copyright © 2011 ARM Ltd. All rights reserved
Freescale Kinetis Cortex-M4 Lab with ARM® Keil™ MDK toolkit www.keil.com Preliminary
19
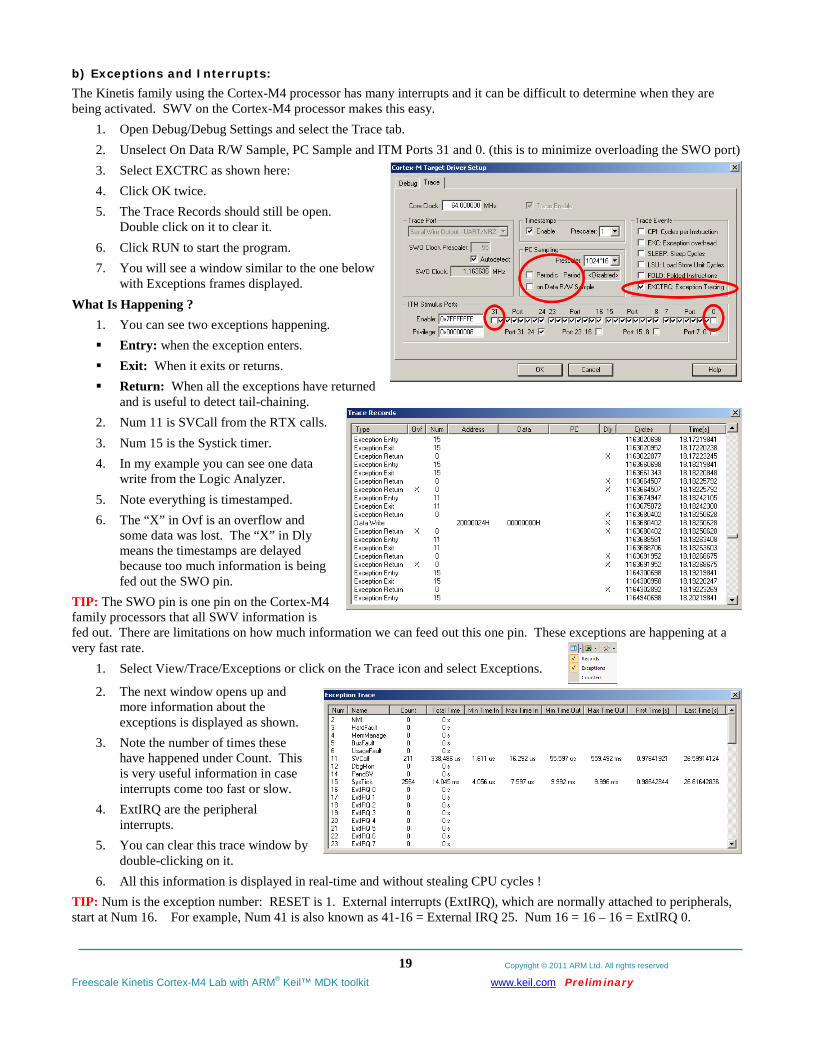
b) Exceptions and Interrupts: The Kinetis family using the Cortex-M4 processor has many interrupts and it can be difficult to determine when they are being activated. SWV on the Cortex-M4 processor makes this easy.
1. Open Debug/Debug Settings and select the Trace tab. 2. Unselect On Data R/W Sample, PC Sample and ITM Ports 31 and 0. (this is to minimize overloading the SWO port) 3. Select EXCTRC as shown here: 4. Click OK twice. 5. The Trace Records should still be open.
Double click on it to clear it. 6. Click RUN to start the program. 7. You will see a window similar to the one below
with Exceptions frames displayed. What Is Happening ?
1. You can see two exceptions happening. Entry: when the exception enters. Exit: When it exits or returns. Return: When all the exceptions have returned
and is useful to detect tail-chaining. 2. Num 11 is SVCall from the RTX calls. 3. Num 15 is the Systick timer. 4. In my example you can see one data
write from the Logic Analyzer. 5. Note everything is timestamped. 6. The “X” in Ovf is an overflow and
some data was lost. The “X” in Dly means the timestamps are delayed because too much information is being fed out the SWO pin.
TIP: The SWO pin is one pin on the Cortex-M4 family processors that all SWV information is fed out. There are limitations on how much information we can feed out this one pin. These exceptions are happening at a very fast rate.
1. Select View/Trace/Exceptions or click on the Trace icon and select Exceptions.
2. The next window opens up and more information about the exceptions is displayed as shown.
3. Note the number of times these have happened under Count. This is very useful information in case interrupts come too fast or slow.
4. ExtIRQ are the peripheral interrupts.
5. You can clear this trace window by double-clicking on it.
6. All this information is displayed in real-time and without stealing CPU cycles ! TIP: Num is the exception number: RESET is 1. External interrupts (ExtIRQ), which are normally attached to peripherals, start at Num 16. For example, Num 41 is also known as 41-16 = External IRQ 25. Num 16 = 16 – 16 = ExtIRQ 0.
Copyright © 2011 ARM Ltd. All rights reserved
Freescale Kinetis Cortex-M4 Lab with ARM® Keil™ MDK toolkit www.keil.com Preliminary
20
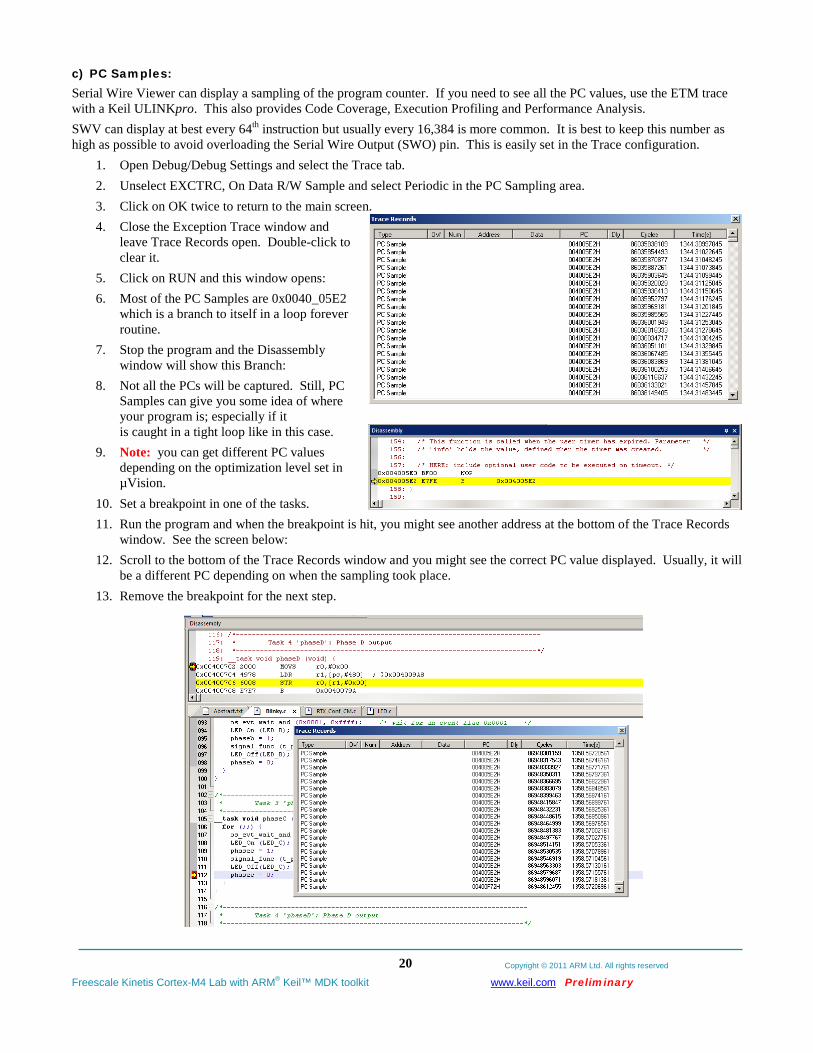
c) PC Samples: Serial Wire Viewer can display a sampling of the program counter. If you need to see all the PC values, use the ETM trace with a Keil ULINKpro. This also provides Code Coverage, Execution Profiling and Performance Analysis. SWV can display at best every 64th instruction but usually every 16,384 is more common. It is best to keep this number as high as possible to avoid overloading the Serial Wire Output (SWO) pin. This is easily set in the Trace configuration.
1. Open Debug/Debug Settings and select the Trace tab. 2. Unselect EXCTRC, On Data R/W Sample and select Periodic in the PC Sampling area. 3. Click on OK twice to return to the main screen. 4. Close the Exception Trace window and
leave Trace Records open. Double-click to clear it.
5. Click on RUN and this window opens: 6. Most of the PC Samples are 0x0040_05E2
which is a branch to itself in a loop forever routine.
7. Stop the program and the Disassembly window will show this Branch:
8. Not all the PCs will be captured. Still, PC Samples can give you some idea of where your program is; especially if it is caught in a tight loop like in this case.
9. Note: you can get different PC values depending on the optimization level set in µVision.
10. Set a breakpoint in one of the tasks. 11. Run the program and when the breakpoint is hit, you might see another address at the bottom of the Trace Records
window. See the screen below: 12. Scroll to the bottom of the Trace Records window and you might see the correct PC value displayed. Usually, it will
be a different PC depending on when the sampling took place. 13. Remove the breakpoint for the next step.
Copyright © 2011 ARM Ltd. All rights reserved
Freescale Kinetis Cortex-M4 Lab with ARM® Keil™ MDK toolkit www.keil.com Preliminary
21
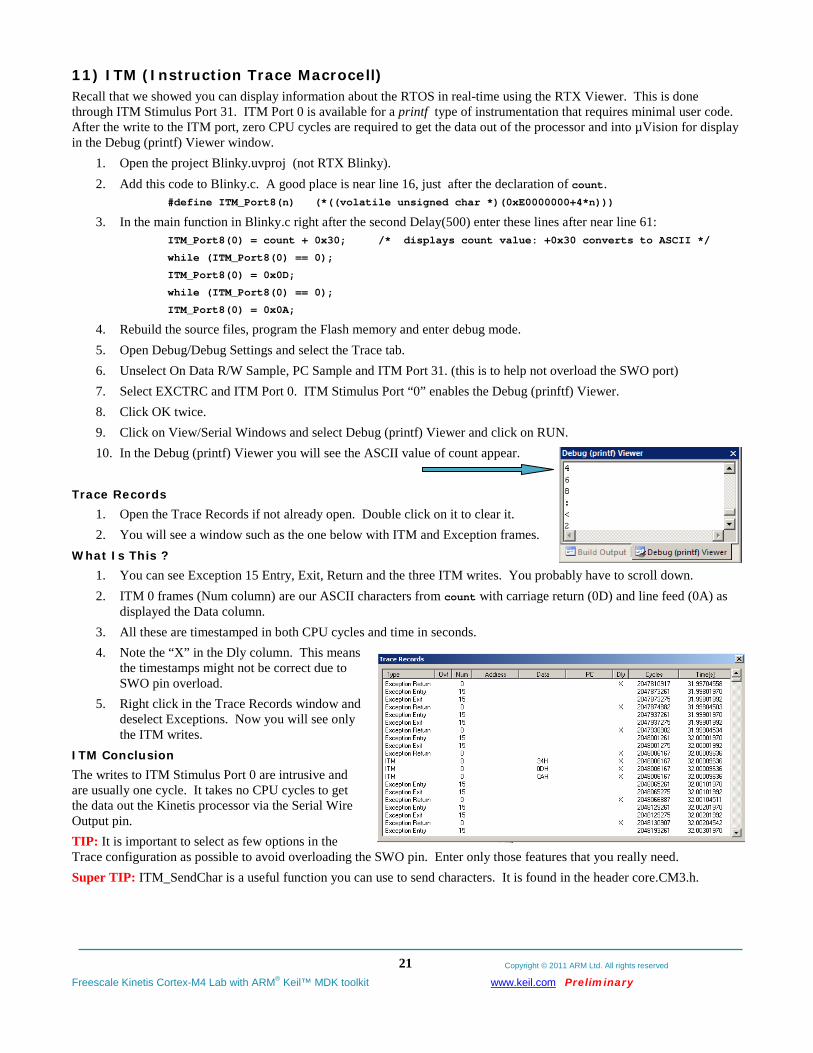
11) ITM (Instruction Trace Macrocell) Recall that we showed you can display information about the RTOS in real-time using the RTX Viewer. This is done through ITM Stimulus Port 31. ITM Port 0 is available for a printf type of instrumentation that requires minimal user code. After the write to the ITM port, zero CPU cycles are required to get the data out of the processor and into µVision for display in the Debug (printf) Viewer window.
1. Open the project Blinky.uvproj (not RTX Blinky). 2. Add this code to Blinky.c. A good place is near line 16, just after the declaration of count.
#define ITM_Port8(n) (*((volatile unsigned char *)(0xE0000000+4*n)))
3. In the main function in Blinky.c right after the second Delay(500) enter these lines after near line 61: ITM_Port8(0) = count + 0x30; /* displays count value: +0x30 converts to ASCII */
while (ITM_Port8(0) == 0);
ITM_Port8(0) = 0x0D;
while (ITM_Port8(0) == 0);
ITM_Port8(0) = 0x0A;
4. Rebuild the source files, program the Flash memory and enter debug mode. 5. Open Debug/Debug Settings and select the Trace tab. 6. Unselect On Data R/W Sample, PC Sample and ITM Port 31. (this is to help not overload the SWO port) 7. Select EXCTRC and ITM Port 0. ITM Stimulus Port “0” enables the Debug (prinftf) Viewer. 8. Click OK twice. 9. Click on View/Serial Windows and select Debug (printf) Viewer and click on RUN. 10. In the Debug (printf) Viewer you will see the ASCII value of count appear.
Trace Records
1. Open the Trace Records if not already open. Double click on it to clear it. 2. You will see a window such as the one below with ITM and Exception frames.
What Is This ? 1. You can see Exception 15 Entry, Exit, Return and the three ITM writes. You probably have to scroll down. 2. ITM 0 frames (Num column) are our ASCII characters from count with carriage return (0D) and line feed (0A) as
displayed the Data column. 3. All these are timestamped in both CPU cycles and time in seconds. 4. Note the “X” in the Dly column. This means
the timestamps might not be correct due to SWO pin overload.
5. Right click in the Trace Records window and deselect Exceptions. Now you will see only the ITM writes.
ITM Conclusion The writes to ITM Stimulus Port 0 are intrusive and are usually one cycle. It takes no CPU cycles to get the data out the Kinetis processor via the Serial Wire Output pin. TIP: It is important to select as few options in the Trace configuration as possible to avoid overloading the SWO pin. Enter only those features that you really need. Super TIP: ITM_SendChar is a useful function you can use to send characters. It is found in the header core.CM3.h.
Copyright © 2011 ARM Ltd. All rights reserved
Freescale Kinetis Cortex-M4 Lab with ARM® Keil™ MDK toolkit www.keil.com Preliminary
22
Part C) Using the ULINKpro with ETM Trace: Contact Keil technical support for more information on ETM support with Kinetis processors. The examples shown previously with the ULINK2 will also work with the ULINKpro. There are two major differences:
1) The window containing the trace frames is now called Instruction Trace. More complete filtering is available. 2) The SWV (Serial Wire Viewer) data is sent out the SWO pin with the ULINK2 using UART encoding. The
ULINKpro can send SWV data either out the SWO pin using Manchester encoding or through the 4 bit Trace Port. This is done so the ULINKpro can support those Cortex-M3 processors that have SWV but not ETM. The trace port is found on the 20 pin Hi-density connector. It is configured in the Trace configuration window as shown below. ETM data is always sent out the Trace Port and if ETM is being used, SWV data is also sent out this port.
ULINKpro offers: 1) Faster Flash programming than the ULINK2. 2) All Serial Wire Viewer features as the ULINK2 does. 3) Adds ETM trace which provides records of all Program Counter values. ULINK2 provides only PC Samples and is
not nearly as useful. 4) Code Coverage: were all the assembly isntructions executed ? 5) Performance Analysis: where the processor spent its time. 6) Execution Profiling: How long instructions, ranges of instructions, functions or C source code took in both time
and CPU cycles as well as number of times these were executed.
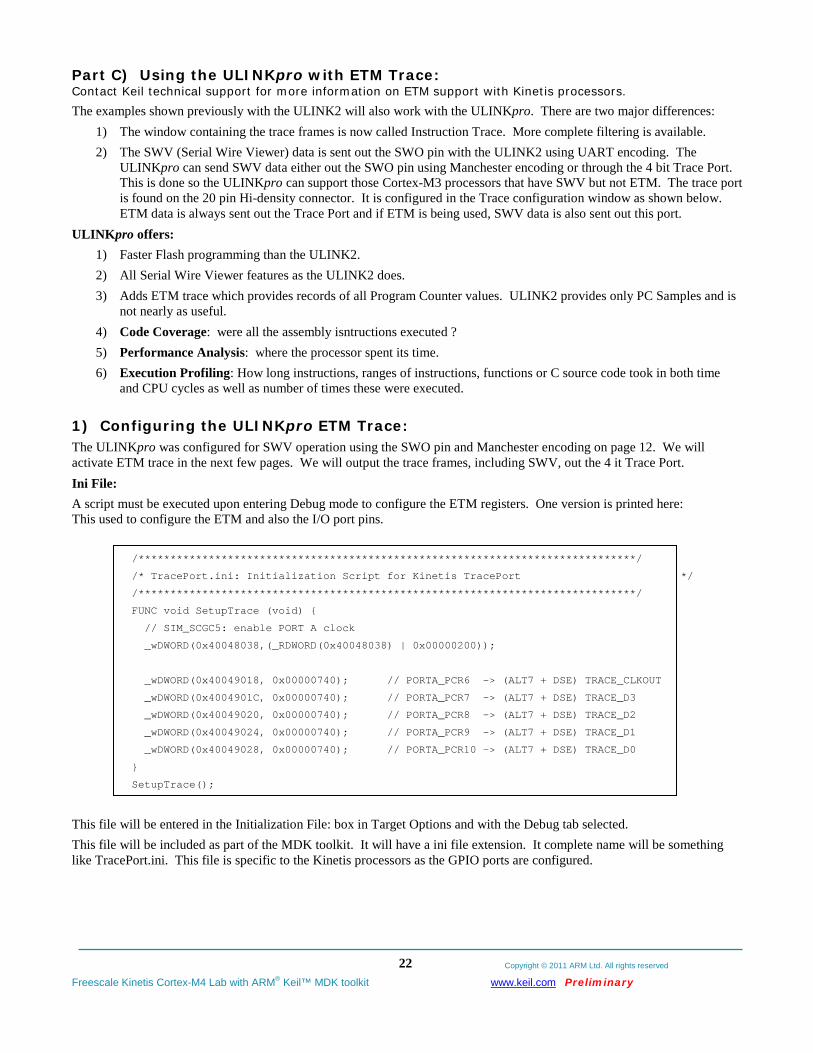
1) Configuring the ULINKpro ETM Trace: The ULINKpro was configured for SWV operation using the SWO pin and Manchester encoding on page 12. We will activate ETM trace in the next few pages. We will output the trace frames, including SWV, out the 4 it Trace Port. Ini File: A script must be executed upon entering Debug mode to configure the ETM registers. One version is printed here: This used to configure the ETM and also the I/O port pins.
/******************************************************************************/
/* TracePort.ini: Initialization Script for Kinetis TracePort */
/******************************************************************************/
FUNC void SetupTrace (void) {
// SIM_SCGC5: enable PORT A clock
_wDWORD(0x40048038,(_RDWORD(0x40048038) | 0x00000200));
_wDWORD(0x40049018, 0x00000740); // PORTA_PCR6 -> (ALT7 + DSE) TRACE_CLKOUT
_wDWORD(0x4004901C, 0x00000740); // PORTA_PCR7 -> (ALT7 + DSE) TRACE_D3
_wDWORD(0x40049020, 0x00000740); // PORTA_PCR8 -> (ALT7 + DSE) TRACE_D2
_wDWORD(0x40049024, 0x00000740); // PORTA_PCR9 -> (ALT7 + DSE) TRACE_D1
_wDWORD(0x40049028, 0x00000740); // PORTA_PCR10 -> (ALT7 + DSE) TRACE_D0
}
SetupTrace();
This file will be entered in the Initialization File: box in Target Options and with the Debug tab selected. This file will be included as part of the MDK toolkit. It will have a ini file extension. It complete name will be something like TracePort.ini. This file is specific to the Kinetis processors as the GPIO ports are configured.
Copyright © 2011 ARM Ltd. All rights reserved
Freescale Kinetis Cortex-M4 Lab with ARM® Keil™ MDK toolkit www.keil.com Preliminary
23
Configuring SWV and ETM Trace: 1) Connect the ULINKpro to the K40 or K60 Kinetis target. 2) Select the Kinetis project at C:\Keil\ARM\Boards\Freescale\TWR-K60N512\Blinky\Blinky.proj 3) Configure ULINKpro for the Kinetis processor as described on page 7: 4) Configuring ULINKpro and µVision:
Do not forget to configure the Flash programmer as well. 4) µVision must be stopped and in edit mode (not debug mode).
5) Select Options for Target or ALT-F7 and select the Debug tab. 6) In the box Initialization File: an ini file should be entered. If not, you must enter an appropriate file. It will be in the
Keil example files and an example is on the previous page. This file is probably called TracePort.ini and configures the GPIO port for ETM operation. You can use the Browse icon to select this file.
7) Click on the Edit box. The specified ini file will open. You can examine it. 8) Click OK.
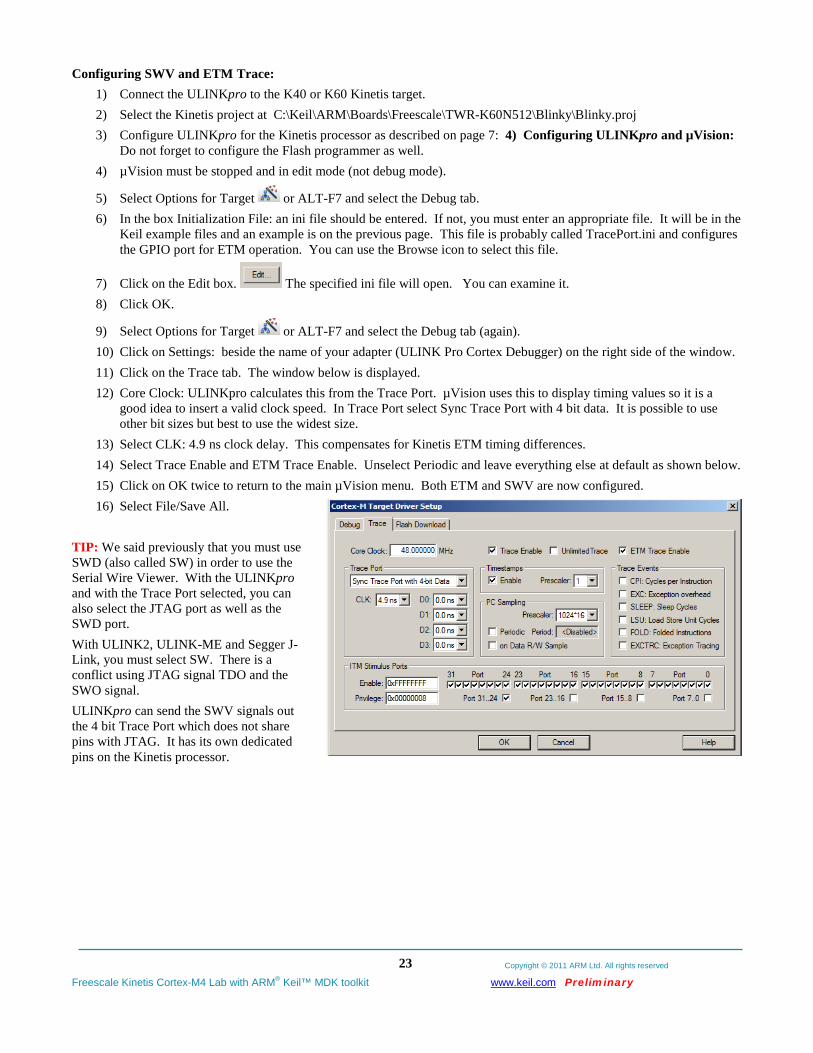
9) Select Options for Target or ALT-F7 and select the Debug tab (again). 10) Click on Settings: beside the name of your adapter (ULINK Pro Cortex Debugger) on the right side of the window. 11) Click on the Trace tab. The window below is displayed. 12) Core Clock: ULINKpro calculates this from the Trace Port. µVision uses this to display timing values so it is a
good idea to insert a valid clock speed. In Trace Port select Sync Trace Port with 4 bit data. It is possible to use other bit sizes but best to use the widest size.
13) Select CLK: 4.9 ns clock delay. This compensates for Kinetis ETM timing differences. 14) Select Trace Enable and ETM Trace Enable. Unselect Periodic and leave everything else at default as shown below. 15) Click on OK twice to return to the main µVision menu. Both ETM and SWV are now configured. 16) Select File/Save All.
TIP: We said previously that you must use SWD (also called SW) in order to use the Serial Wire Viewer. With the ULINKpro and with the Trace Port selected, you can also select the JTAG port as well as the SWD port. With ULINK2, ULINK-ME and Segger J-Link, you must select SW. There is a conflict using JTAG signal TDO and the SWO signal. ULINKpro can send the SWV signals out the 4 bit Trace Port which does not share pins with JTAG. It has its own dedicated pins on the Kinetis processor.
Copyright © 2011 ARM Ltd. All rights reserved
Freescale Kinetis Cortex-M4 Lab with ARM® Keil™ MDK toolkit www.keil.com Preliminary
24
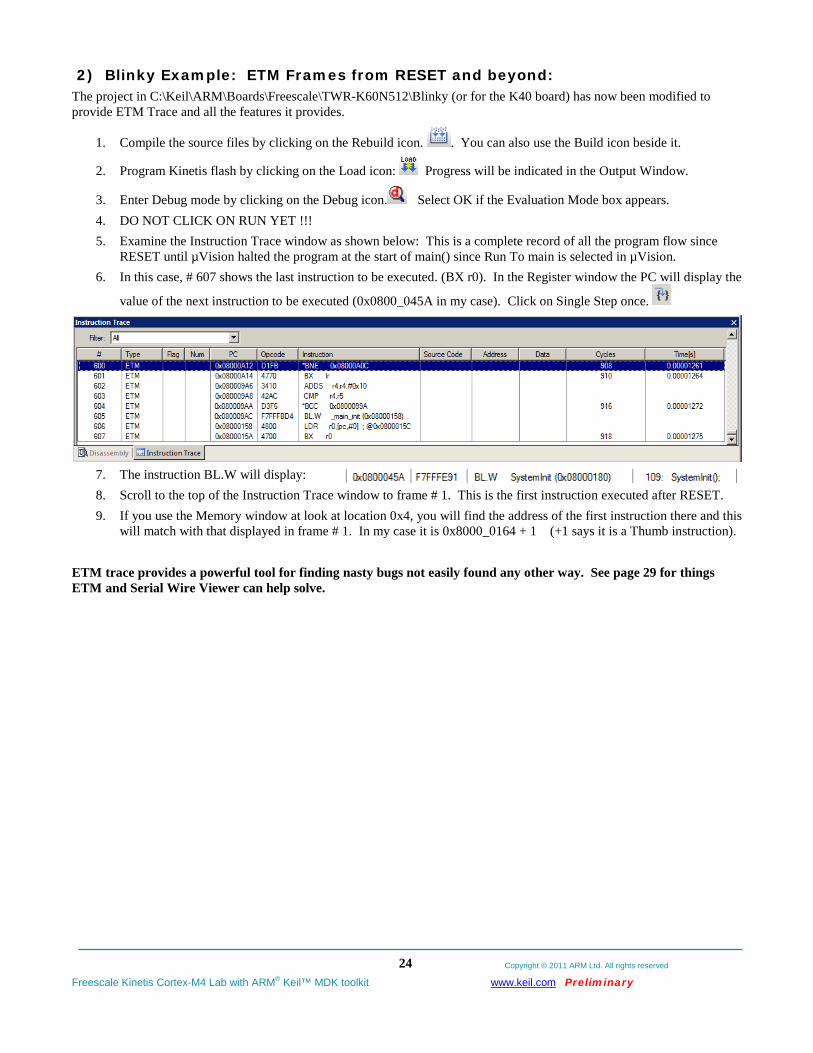
2) Blinky Example: ETM Frames from RESET and beyond: The project in C:\Keil\ARM\Boards\Freescale\TWR-K60N512\Blinky (or for the K40 board) has now been modified to provide ETM Trace and all the features it provides.
1. Compile the source files by clicking on the Rebuild icon. . You can also use the Build icon beside it.
2. Program Kinetis flash by clicking on the Load icon: Progress will be indicated in the Output Window.
3. Enter Debug mode by clicking on the Debug icon. Select OK if the Evaluation Mode box appears. 4. DO NOT CLICK ON RUN YET !!! 5. Examine the Instruction Trace window as shown below: This is a complete record of all the program flow since
RESET until µVision halted the program at the start of main() since Run To main is selected in µVision. 6. In this case, # 607 shows the last instruction to be executed. (BX r0). In the Register window the PC will display the
value of the next instruction to be executed (0x0800_045A in my case). Click on Single Step once.
7. The instruction BL.W will display: 8. Scroll to the top of the Instruction Trace window to frame # 1. This is the first instruction executed after RESET. 9. If you use the Memory window at look at location 0x4, you will find the address of the first instruction there and this
will match with that displayed in frame # 1. In my case it is 0x8000_0164 + 1 (+1 says it is a Thumb instruction).
ETM trace provides a powerful tool for finding nasty bugs not easily found any other way. See page 29 for things ETM and Serial Wire Viewer can help solve.
Copyright © 2011 ARM Ltd. All rights reserved
Freescale Kinetis Cortex-M4 Lab with ARM® Keil™ MDK toolkit www.keil.com Preliminary
25
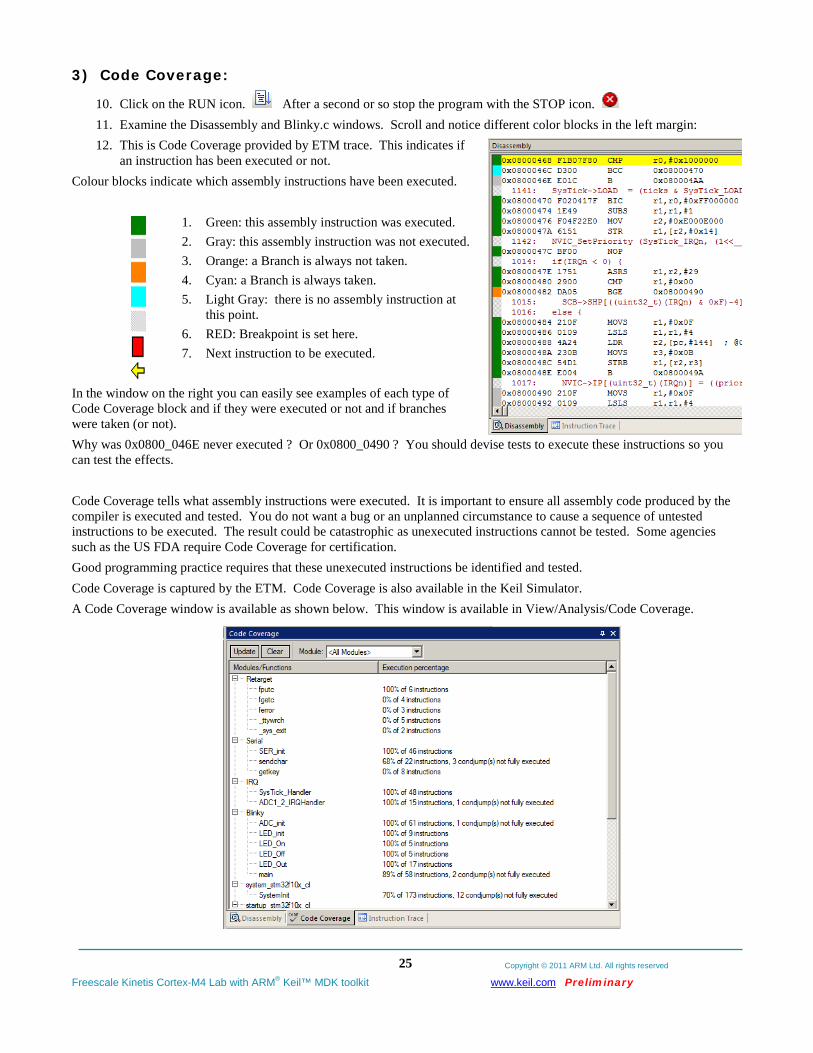
3) Code Coverage:
10. Click on the RUN icon. After a second or so stop the program with the STOP icon. 11. Examine the Disassembly and Blinky.c windows. Scroll and notice different color blocks in the left margin: 12. This is Code Coverage provided by ETM trace. This indicates if
an instruction has been executed or not. Colour blocks indicate which assembly instructions have been executed.
1. Green: this assembly instruction was executed. 2. Gray: this assembly instruction was not executed. 3. Orange: a Branch is always not taken. 4. Cyan: a Branch is always taken. 5. Light Gray: there is no assembly instruction at
this point. 6. RED: Breakpoint is set here. 7. Next instruction to be executed.
In the window on the right you can easily see examples of each type of Code Coverage block and if they were executed or not and if branches were taken (or not). Why was 0x0800_046E never executed ? Or 0x0800_0490 ? You should devise tests to execute these instructions so you can test the effects. Code Coverage tells what assembly instructions were executed. It is important to ensure all assembly code produced by the compiler is executed and tested. You do not want a bug or an unplanned circumstance to cause a sequence of untested instructions to be executed. The result could be catastrophic as unexecuted instructions cannot be tested. Some agencies such as the US FDA require Code Coverage for certification. Good programming practice requires that these unexecuted instructions be identified and tested. Code Coverage is captured by the ETM. Code Coverage is also available in the Keil Simulator. A Code Coverage window is available as shown below. This window is available in View/Analysis/Code Coverage.
Copyright © 2011 ARM Ltd. All rights reserved
Freescale Kinetis Cortex-M4 Lab with ARM® Keil™ MDK toolkit www.keil.com Preliminary
26
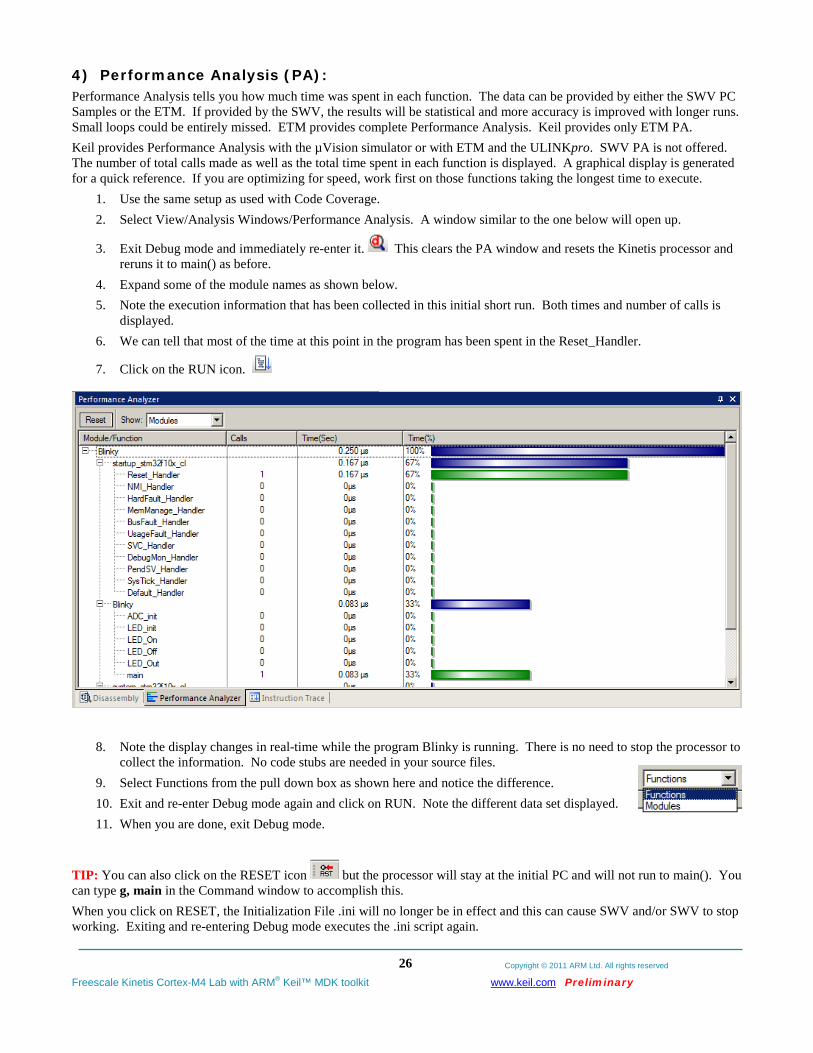
4) Performance Analysis (PA): Performance Analysis tells you how much time was spent in each function. The data can be provided by either the SWV PC Samples or the ETM. If provided by the SWV, the results will be statistical and more accuracy is improved with longer runs. Small loops could be entirely missed. ETM provides complete Performance Analysis. Keil provides only ETM PA. Keil provides Performance Analysis with the µVision simulator or with ETM and the ULINKpro. SWV PA is not offered. The number of total calls made as well as the total time spent in each function is displayed. A graphical display is generated for a quick reference. If you are optimizing for speed, work first on those functions taking the longest time to execute.
1. Use the same setup as used with Code Coverage. 2. Select View/Analysis Windows/Performance Analysis. A window similar to the one below will open up.
3. Exit Debug mode and immediately re-enter it. This clears the PA window and resets the Kinetis processor and reruns it to main() as before.
4. Expand some of the module names as shown below. 5. Note the execution information that has been collected in this initial short run. Both times and number of calls is
displayed. 6. We can tell that most of the time at this point in the program has been spent in the Reset_Handler.
7. Click on the RUN icon.
8. Note the display changes in real-time while the program Blinky is running. There is no need to stop the processor to
collect the information. No code stubs are needed in your source files. 9. Select Functions from the pull down box as shown here and notice the difference. 10. Exit and re-enter Debug mode again and click on RUN. Note the different data set displayed. 11. When you are done, exit Debug mode.
TIP: You can also click on the RESET icon but the processor will stay at the initial PC and will not run to main(). You can type g, main in the Command window to accomplish this. When you click on RESET, the Initialization File .ini will no longer be in effect and this can cause SWV and/or SWV to stop working. Exiting and re-entering Debug mode executes the .ini script again.

Copyright © 2011 ARM Ltd. All rights reserved
Freescale Kinetis Cortex-M4 Lab with ARM® Keil™ MDK toolkit www.keil.com Preliminary
27
5) Execution Profiling: Execution profiling is used to display how much time a C source line took to execute and how many times it was called. This information is provided by the ETM trace. It is possible to group source lines (called collapse) to get combined times and number of calls. This is called Outlining. The µVision simulator also provides Execution Profiling.
1. Enter Debug mode. 2. Select Debug/Execution Profiling/Show Time. 3. In the left margin of the disassembly and C source
windows will display various time values. 4. Click on RUN. 5. The times will start to fill up as shown below right: 6. Click inside the yellow margin of Blinky.c to refresh it. 7. This is done in real-time and without stealing CPU cycles. 8. Hover the cursor over a time and ands more information appears as in the yellow box here:
9. Recall you can also select Show Calls and this information rather than the execution times will be displayed in the left margin.
Outlining:
1) Block a section of source as similar to this:
2) Right click on the blue block and select Outlining and then
Collapse Section as shown below:
3) Note the section you blocked is now collapsed and the times are
added together where the red arrow points. 4) Click on the + to expand it. 5) Stop the program and exit Debug mode.
Copyright © 2011 ARM Ltd. All rights reserved
Freescale Kinetis Cortex-M4 Lab with ARM® Keil™ MDK toolkit www.keil.com Preliminary
28
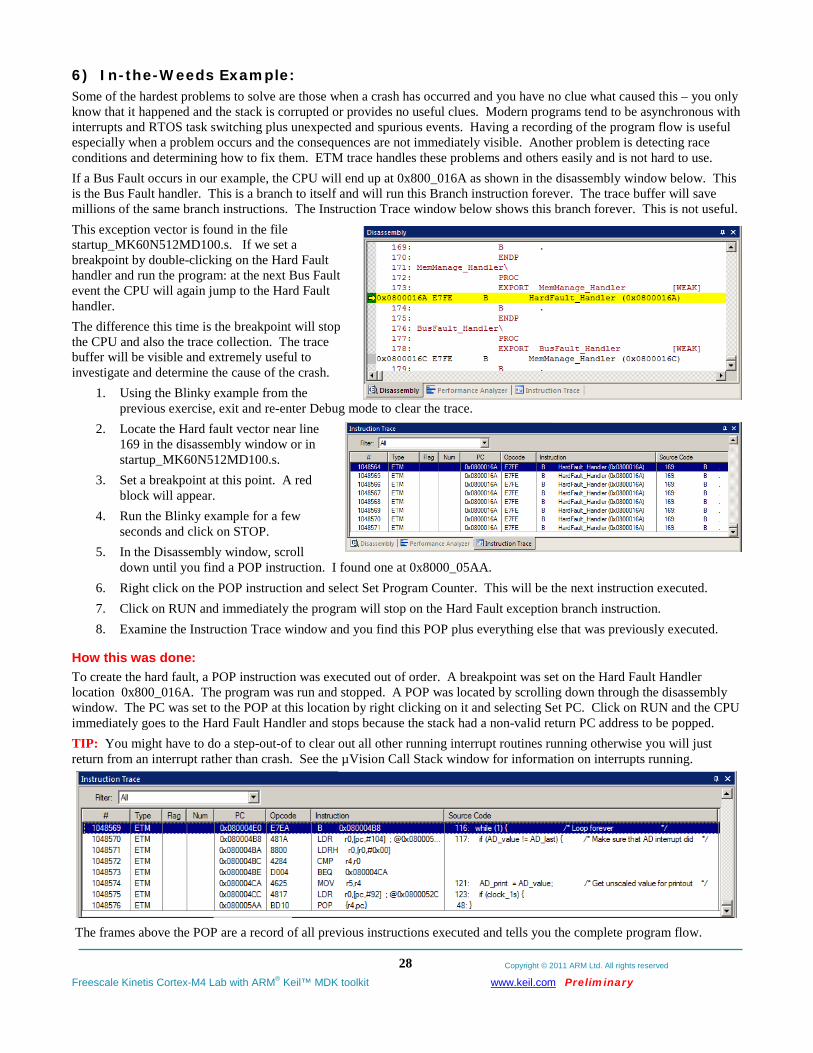
6) In-the-Weeds Example: Some of the hardest problems to solve are those when a crash has occurred and you have no clue what caused this – you only know that it happened and the stack is corrupted or provides no useful clues. Modern programs tend to be asynchronous with interrupts and RTOS task switching plus unexpected and spurious events. Having a recording of the program flow is useful especially when a problem occurs and the consequences are not immediately visible. Another problem is detecting race conditions and determining how to fix them. ETM trace handles these problems and others easily and is not hard to use. If a Bus Fault occurs in our example, the CPU will end up at 0x800_016A as shown in the disassembly window below. This is the Bus Fault handler. This is a branch to itself and will run this Branch instruction forever. The trace buffer will save millions of the same branch instructions. The Instruction Trace window below shows this branch forever. This is not useful. This exception vector is found in the file startup_MK60N512MD100.s. If we set a breakpoint by double-clicking on the Hard Fault handler and run the program: at the next Bus Fault event the CPU will again jump to the Hard Fault handler. The difference this time is the breakpoint will stop the CPU and also the trace collection. The trace buffer will be visible and extremely useful to investigate and determine the cause of the crash.
1. Using the Blinky example from the previous exercise, exit and re-enter Debug mode to clear the trace.
2. Locate the Hard fault vector near line 169 in the disassembly window or in startup_MK60N512MD100.s.
3. Set a breakpoint at this point. A red block will appear.
4. Run the Blinky example for a few seconds and click on STOP.
5. In the Disassembly window, scroll down until you find a POP instruction. I found one at 0x8000_05AA.
6. Right click on the POP instruction and select Set Program Counter. This will be the next instruction executed. 7. Click on RUN and immediately the program will stop on the Hard Fault exception branch instruction. 8. Examine the Instruction Trace window and you find this POP plus everything else that was previously executed.
How this was done: To create the hard fault, a POP instruction was executed out of order. A breakpoint was set on the Hard Fault Handler location 0x800_016A. The program was run and stopped. A POP was located by scrolling down through the disassembly window. The PC was set to the POP at this location by right clicking on it and selecting Set PC. Click on RUN and the CPU immediately goes to the Hard Fault Handler and stops because the stack had a non-valid return PC address to be popped. TIP: You might have to do a step-out-of to clear out all other running interrupt routines running otherwise you will just return from an interrupt rather than crash. See the µVision Call Stack window for information on interrupts running.
The frames above the POP are a record of all previous instructions executed and tells you the complete program flow.

Copyright © 2011 ARM Ltd. All rights reserved
Freescale Kinetis Cortex-M4 Lab with ARM® Keil™ MDK toolkit www.keil.com Preliminary
29
7) Serial Wire Viewer Summary: Serial Wire Viewer can see:
Global variables. Static variables. Structures. Peripheral registers – just read or write to them. Can’t see local variables. (just make them global or static). Can’t see DMA transfers – DMA bypasses CPU and SWV by definition.
Serial Wire Viewer displays in various ways:
PC Samples. Data reads and writes. Exception and interrupt events. CPU counters. Timestamps for these.
Trace is good for:
Trace adds significant power to debugging efforts. Tells where the program has been. A recorded history of the program execution in the order it happened. Trace can often find nasty problems very quickly. Weeks or months can be replaced by minutes. Especially where the bug occurs a long time before the consequences are seen. Or where the state of the system disappears with a change in scope(s). Plus - don’t have to stop the program. Crucial to some.
These are the types of problems that can be found with a quality trace:
Pointer problems. Illegal instructions and data aborts (such as misaligned writes). Code overwrites – writes to Flash, unexpected writes to peripheral registers (SFRs), corrupted stack.
How did I get here ? Out of bounds data. Uninitialized variables and arrays. Stack overflows. What causes the stack to grow bigger than it should ? Runaway programs: your program has gone off into the weeds and you need to know what instruction caused this.
Is very tough to find these problems without a trace. ETM trace with the ULINKpro is best for this. Communication protocol and timing issues. System timing problems.
For complete information on CoreSight for the Cortex-M4: Search for DDI0314F_coresight_component_trm.pdf on www.arm.com.

Copyright © 2011 ARM Ltd. All rights reserved
Freescale Kinetis Cortex-M4 Lab with ARM® Keil™ MDK toolkit www.keil.com Preliminary
30
8) Keil Products: Keil Microcontroller Development Kit (MDK-ARM™)
MDK-Professional™ (Includes RL-ARM) Promotion with ULINKpro until September 30, 2011 - $9,995 MDK-Standard™ (with included RTX RTOS) - $4,895 MDK-Basic™ (256K compiler limit, No debug limit) RTX is not included - $2,695 MDK-Lite™ (Evaluation version) 32K Code and Data Limit - $0
Note: USA prices. Contact [email protected] for pricing in other countries. Call Keil Sales for more details on current pricing. All products are available. Call Keil Sales for special university pricing. For the ARM University program: go to www.arm.com and search for university. Email: [email protected] All products include Technical Support for 1 year. This can be renewed. Keil Real Time Library (RL-ARM™)
RTX sources, Flash File, TCP/IP, CAN and USB driver libraries. RL-ARM is available only as a component of MDK-Professional.
USB-JTAG adapter (for Flash programming too)
ULINK2 - $395 (ULINK2 and ME - SWV only – no ETM) ULINK-ME – sold only with a board by Keil or OEM. ULINKpro - $1,395 – Cortex-Mx SWV & ETM trace
Prices are for reference only and are subject to change without notice. For the entire Keil catalog see www.keil.com or contact Keil or your local distributor. For Linux, Android and bare metal (no OS) support on Freescale ARM9™ and Cortex-A series processors, please see the ARM DS-5™ toolkit at http://www.arm.com/ds5/.
For more information: Keil Sales In North and South America: [email protected] or 800-348-8051. Outside the US: [email protected] Keil Technical Support in USA: [email protected] or 800-348-8051. Outside the US: [email protected]. For comments or corrections please email [email protected]. For the latest version of this document, contact the author, Keil Technical support or www.keil.com.