Embed Size (px)
Citation preview
Copyright © 2016 ARM Ltd. ARM Limited or its affiliates. All rights reserved.
NXP Kinetis Cortex-M4 Lab with ARM® Keil™ MDK toolkit www.keil.com/NXP
1
NXP Kinetis: FRDM-K64F Cortex™-M4 Lab
ARM® Keil® MDK Toolkit featuring Serial Wire Viewer and ETM Trace
Fall 2016 Version 1.0 by Robert Boys, [email protected]
Introduction:
The purpose of this lab is to introduce you to the NXP Cortex™
-M4 processor by using the ARM Keil MDK toolkit featuring
μVision®
IDE. We will use the Serial Wire Viewer (SWV) on the Kinetis processor. For labs and appnotes for other Tower
or Freedom boards see www.keil.com/NXP. MDK includes many example projects including using Keil Middleware.
Keil MDK-Lite™
is a free evaluation version that limits code size to 32 Kbytes. The addition of a license number will turn it
into a full commercial version. Contact Keil sales for pricing, options and current special offers. Contact info is on last page.
Linux and Android: For Linux, Android, bare metal (no OS) and other OS support on NXP i.MX and Vybrid series
processors see DS-5™
at www.arm.com/ds5/ and www.keil.com/ds-mdk.
Why Use Keil MDK ?
MDK provides these features particularly suited for Kinetis Cortex-M users:
1. µVision IDE with Integrated Debugger, Flash programmer and the
ARM® Compiler toolchain. MDK is turn-key "out-of-the-box".
2. Keil Middleware is offered. www.keil.com/mdk5/middleware/
3. Compiler Safety Certification Kit: www.keil.com/safety/
4. TÜV certified. SIL3 (IEC 61508) and ASILD (ISO 26262).
5. ARM Compiler 5 and 6 (LLVM) included. You can also use GCC.
6. MISRA C/C++ support using PC-Lint. www.gimpel.com
7. Keil RTX with all source code is included. www.keil.com/RTX.
8. MQX: An MQX port for MDK is available. www.keil.com/NXP.
9. CoreSight™ Serial Wire Viewer and ETM trace capability.
10. Choice of debug adapters: ULINK2™, ULINKpro™, OpenSDA
(CMSIS-DAP), Segger J-Link and P&E.
11. Kinetis Expert compatible: A MDK 5 project is created that you can load directly into µVision. See kex.nxp.com/.
12. Keil Technical Support is included for one year and is renewable. This helps you get your project completed faster.
13. Affordable perpetual and term licensing. Contact Keil sales for pricing, options and current special offers.
This document details these features and more:
1. Serial Wire Viewer (SWV) data trace including exceptions, display variables and ETM Instruction Trace.
2. Real-time Read and Write to memory locations for Watch, Memory, System Viewer and RTX Tasks windows.
These are non-intrusive to your program. No CPU cycles are stolen. No instrumentation code is needed.
3. Six Hardware Breakpoints (can be set/unset on-the-fly) and one Watchpoint (also called Access Breaks).
4. A DSP example using ARM CMIS-DSP libraries which are included with MDK. All DSP source code is included.
5. Create a µVision project from scratch. Optionally add RTX. An example using Kinetis Expert is also provided.
Serial Wire Viewer (SWV): With a Keil ULINK2, ULINKpro or J-Link (Not with OpenSDA):
Serial Wire Viewer (SWV) displays Exceptions (including interrupts), data reads and writes, ITM (printf), CPU counters,
PC Samples and a timestamp. RTX Event Viewer uses SWV. This information comes from the ARM CoreSight™ debug
module integrated into the Cortex-M4. SWV is output on the 1 bit Serial Wire Output (SWO) or the 4 bit Trace Port.
SWV does not steal any CPU cycles and is completely non-intrusive (except for the ITM Debug printf Viewer).
Embedded Trace Macrocell™
(ETM): ETM is available only with a Keil ULINKpro and TWR-K64F.
ETM records all executed instructions in addition to the features provided by SWV. ETM provides advanced features
including Program Flow instruction debugging in assembly and C, Code Coverage and Performance Analysis.
The latest version of this document is here: www.keil.com/appnotes/docs/apnt_287.asp
ULINK2 connected to a FRDM-K64F
A lab for the TWR-K64F120M with ETM: www.keil.com/appnotes/docs/apnt_288.asp
Copyright © 2016 ARM Ltd. ARM Limited or its affiliates. All rights reserved.
NXP Kinetis Cortex-M4 Lab with ARM® Keil™ MDK toolkit www.keil.com/NXP
2
General Information and introduction to Keil MDK:
1. Keil MDK, Download, Install, Licensing, Debug Adapters and Getting Started Guide: 3
2. Software Pack Install Process: 4
3. Copy the Blinky, RTX_Blinky and DSP examples: 5
4. A) Software Pack Version Control B) Manage Run-Time Environment C) Update Files: 6
5. CoreSight Definitions: 8
Part A: Connecting and Configuring Debug Adapters to the Kinetis FRDM board:
1. OpenSDAV2 Configuration for the NXP Kinetis FRDM board: 9
2. Connecting ULINK2, ULINK-ME, ULINKpro or a J-Link to the NXP FRDM board: 10
3. Configuring Debug Adapters in µVision: This section is for reference: 11
Part B: Keil Example Projects:
1. Blinky example program using the Kinetis and ULINK2 or ULINKpro: 12
2. Hardware Breakpoints: 12
3. Call Stack + Locals Window: 13
4. Watch and Memory Windows and how to use them: 14
5. System Viewer: Peripheral Views: 15
6. Configuring the Serial Wire Viewer (SWV) Data Trace: 16
a. For ULINK2 or ULINK-ME: 16
b. For ULINKpro: 17
7. Using the Logic Analyzer (LA) with ULINK2, ULINK-ME, ULINKpro or J-Link: 18
8. Watchpoints: Conditional Breakpoints: 19
9. Exceptions and Interrupts tracing using SWV: 20
10. printf using ITM 0 (Instruction Trace Macrocell): 21
11. Trace Configuration Fields and General Trace Information (for reference): 22
Part C: DSP Example Project using ARM CMSIS-DSP Libraries:
1. DSP Sine Example: 22
2. Signal Timings using Logic Analyzer: 23
3. RTX System and Thread Viewer: 23
4. RTX Event Viewer: 24
5. Using a Keil ULINKpro and Event Viewer to view Interrupt Handler execution times: 25
6. Serial Wire Viewer and ETM Instruction Trace summary: 26
PART D: Creating your own MDK 5 Projects from Scratch:
1. Creating your own MDK 5 Project with no RTOS: 27
2. Adding Keil RTX to your Project: 30
3. Adding a Thread: 31
4. View RTX Thread and Exception Timings with Event Viewer: 32
5. Using Kinetis Expert to create a MDK 5 Project with and without Serial Wire Viewer: 33
6. Display Serial Wirer Viewer Information with a Kinetis Expert Project: 34
Part E: RESOURCES:
1. Document Resources: 35
2. Keil Products and contact information: 36
Copyright © 2016 ARM Ltd. ARM Limited or its affiliates. All rights reserved.
NXP Kinetis Cortex-M4 Lab with ARM® Keil™ MDK toolkit www.keil.com/NXP
3
1) General Information and introduction to MDK:
Keil Software: MDK 5 This document used MDK 5.20 and Software Pack 1.4.0. You can use later versions.
MDK 5 uses Software Packs to distribute processor specific software, examples, documentation and middleware. MDK 5
Core is first installed and you then download the Software Packs required for your processor(s) from the web. A Pack can
also be imported manually. You no longer need to wait for the next version of MDK or install patches to get the latest files.
Software Packs are an ARM CMSIS standard. See www.keil.com/cmsis and https://github.com/ARM-software/CMSIS_5
Kinetis Expert provides software projects in MDK 5 format consistent with Software Packs.
Summary of the Keil software installation: This is a three step process:
A. Download and install MDK Core. This is done in Step 2 below.
B. Download and install the appropriate Software Pack for the processor you are using. This is done on the next page.
C. In addition, you need to download and install the examples used in this tutorial. See page 5.
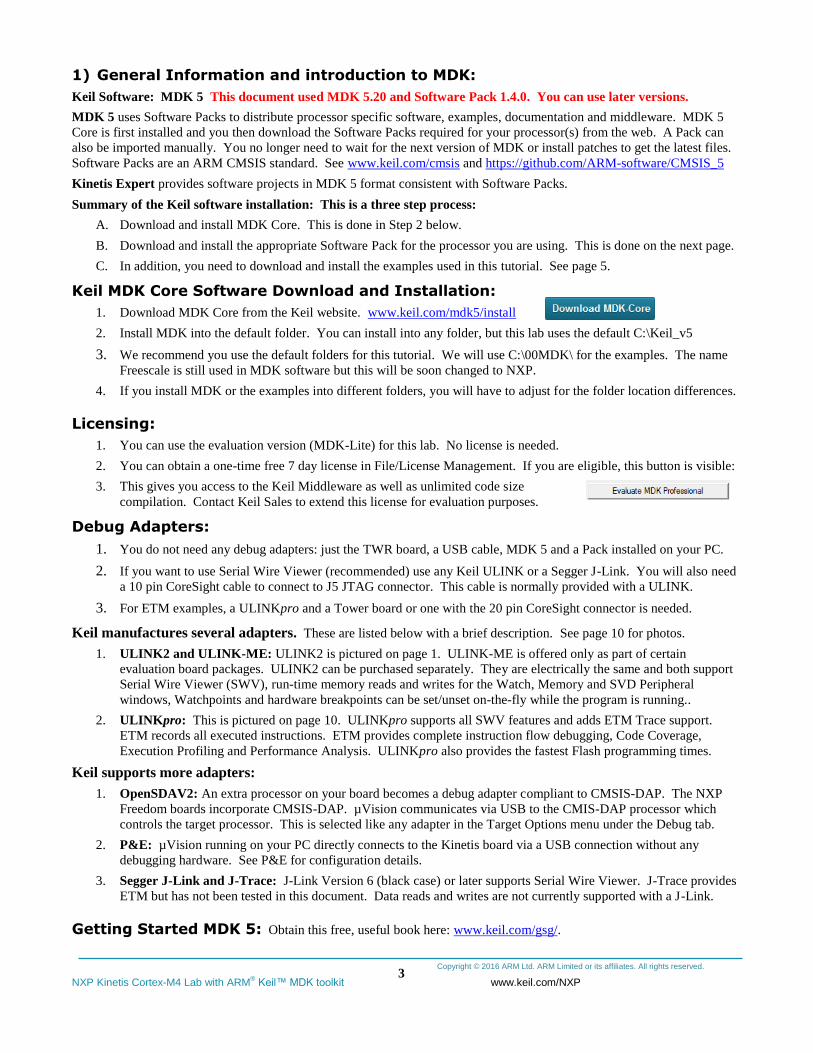
Keil MDK Core Software Download and Installation:
1. Download MDK Core from the Keil website. www.keil.com/mdk5/install
2. Install MDK into the default folder. You can install into any folder, but this lab uses the default C:\Keil_v5
3. We recommend you use the default folders for this tutorial. We will use C:\00MDK\ for the examples. The name
Freescale is still used in MDK software but this will be soon changed to NXP.
4. If you install MDK or the examples into different folders, you will have to adjust for the folder location differences.
Licensing:
1. You can use the evaluation version (MDK-Lite) for this lab. No license is needed.
2. You can obtain a one-time free 7 day license in File/License Management. If you are eligible, this button is visible:
3. This gives you access to the Keil Middleware as well as unlimited code size
compilation. Contact Keil Sales to extend this license for evaluation purposes.
Debug Adapters:
1. You do not need any debug adapters: just the TWR board, a USB cable, MDK 5 and a Pack installed on your PC.
2. If you want to use Serial Wire Viewer (recommended) use any Keil ULINK or a Segger J-Link. You will also need
a 10 pin CoreSight cable to connect to J5 JTAG connector. This cable is normally provided with a ULINK.
3. For ETM examples, a ULINKpro and a Tower board or one with the 20 pin CoreSight connector is needed.
Keil manufactures several adapters. These are listed below with a brief description. See page 10 for photos.
1. ULINK2 and ULINK-ME: ULINK2 is pictured on page 1. ULINK-ME is offered only as part of certain
evaluation board packages. ULINK2 can be purchased separately. They are electrically the same and both support
Serial Wire Viewer (SWV), run-time memory reads and writes for the Watch, Memory and SVD Peripheral
windows, Watchpoints and hardware breakpoints can be set/unset on-the-fly while the program is running..
2. ULINKpro: This is pictured on page 10. ULINKpro supports all SWV features and adds ETM Trace support.
ETM records all executed instructions. ETM provides complete instruction flow debugging, Code Coverage,
Execution Profiling and Performance Analysis. ULINKpro also provides the fastest Flash programming times.
Keil supports more adapters:
1. OpenSDAV2: An extra processor on your board becomes a debug adapter compliant to CMSIS-DAP. The NXP
Freedom boards incorporate CMSIS-DAP. µVision communicates via USB to the CMIS-DAP processor which
controls the target processor. This is selected like any adapter in the Target Options menu under the Debug tab.
2. P&E: µVision running on your PC directly connects to the Kinetis board via a USB connection without any
debugging hardware. See P&E for configuration details.
3. Segger J-Link and J-Trace: J-Link Version 6 (black case) or later supports Serial Wire Viewer. J-Trace provides
ETM but has not been tested in this document. Data reads and writes are not currently supported with a J-Link.
Getting Started MDK 5: Obtain this free, useful book here: www.keil.com/gsg/.
Copyright © 2016 ARM Ltd. ARM Limited or its affiliates. All rights reserved.
NXP Kinetis Cortex-M4 Lab with ARM® Keil™ MDK toolkit www.keil.com/NXP
4
2) Software Pack Install Process:
1) Start µVision and open Pack Installer:
When the first MDK install is complete and if you are connected to the Internet, µVision and Software Packs will
automatically start. Otherwise, follow Steps 1 and 2 below. Initially, the Pack master list must be downloaded from the web.
1. Connect your computer to the Internet. This is normally needed to download the Software Packs.
2. Start µVision by clicking on its desktop icon. The Pack descriptions will download on the initial µVision run.
3. Open the Pack Installer by clicking on its icon: A Pack Installer Welcome screen will open. Read and close it.
4. If there are any Updates available, you can download them now if they are applicable.
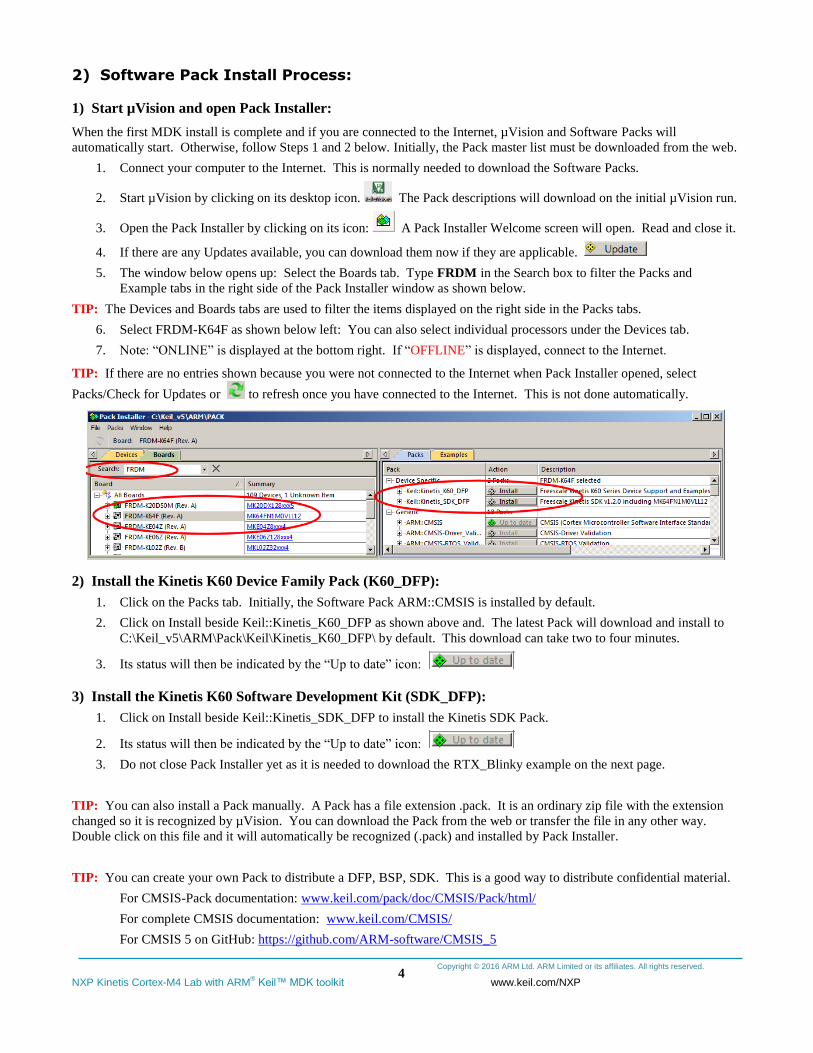
5. The window below opens up: Select the Boards tab. Type FRDM in the Search box to filter the Packs and
Example tabs in the right side of the Pack Installer window as shown below.
TIP: The Devices and Boards tabs are used to filter the items displayed on the right side in the Packs tabs.
6. Select FRDM-K64F as shown below left: You can also select individual processors under the Devices tab.
7. Note: “ONLINE” is displayed at the bottom right. If “OFFLINE” is displayed, connect to the Internet.
TIP: If there are no entries shown because you were not connected to the Internet when Pack Installer opened, select
Packs/Check for Updates or to refresh once you have connected to the Internet. This is not done automatically.
2) Install the Kinetis K60 Device Family Pack (K60_DFP):
1. Click on the Packs tab. Initially, the Software Pack ARM::CMSIS is installed by default.
2. Click on Install beside Keil::Kinetis_K60_DFP as shown above and. The latest Pack will download and install to
C:\Keil_v5\ARM\Pack\Keil\Kinetis_K60_DFP\ by default. This download can take two to four minutes.
3. Its status will then be indicated by the “Up to date” icon:
3) Install the Kinetis K60 Software Development Kit (SDK_DFP):
1. Click on Install beside Keil::Kinetis_SDK_DFP to install the Kinetis SDK Pack.
2. Its status will then be indicated by the “Up to date” icon:
3. Do not close Pack Installer yet as it is needed to download the RTX_Blinky example on the next page.
TIP: You can also install a Pack manually. A Pack has a file extension .pack. It is an ordinary zip file with the extension
changed so it is recognized by µVision. You can download the Pack from the web or transfer the file in any other way.
Double click on this file and it will automatically be recognized (.pack) and installed by Pack Installer.
TIP: You can create your own Pack to distribute a DFP, BSP, SDK. This is a good way to distribute confidential material.
For CMSIS-Pack documentation: www.keil.com/pack/doc/CMSIS/Pack/html/
For complete CMSIS documentation: www.keil.com/CMSIS/
For CMSIS 5 on GitHub: https://github.com/ARM-software/CMSIS_5
Copyright © 2016 ARM Ltd. ARM Limited or its affiliates. All rights reserved.
NXP Kinetis Cortex-M4 Lab with ARM® Keil™ MDK toolkit www.keil.com/NXP
5
3) Copy the Blinky, RTX_Blinky and DSP Examples:
1) Copy Blinky and RTX_Blinky using Pack Installer Utility:
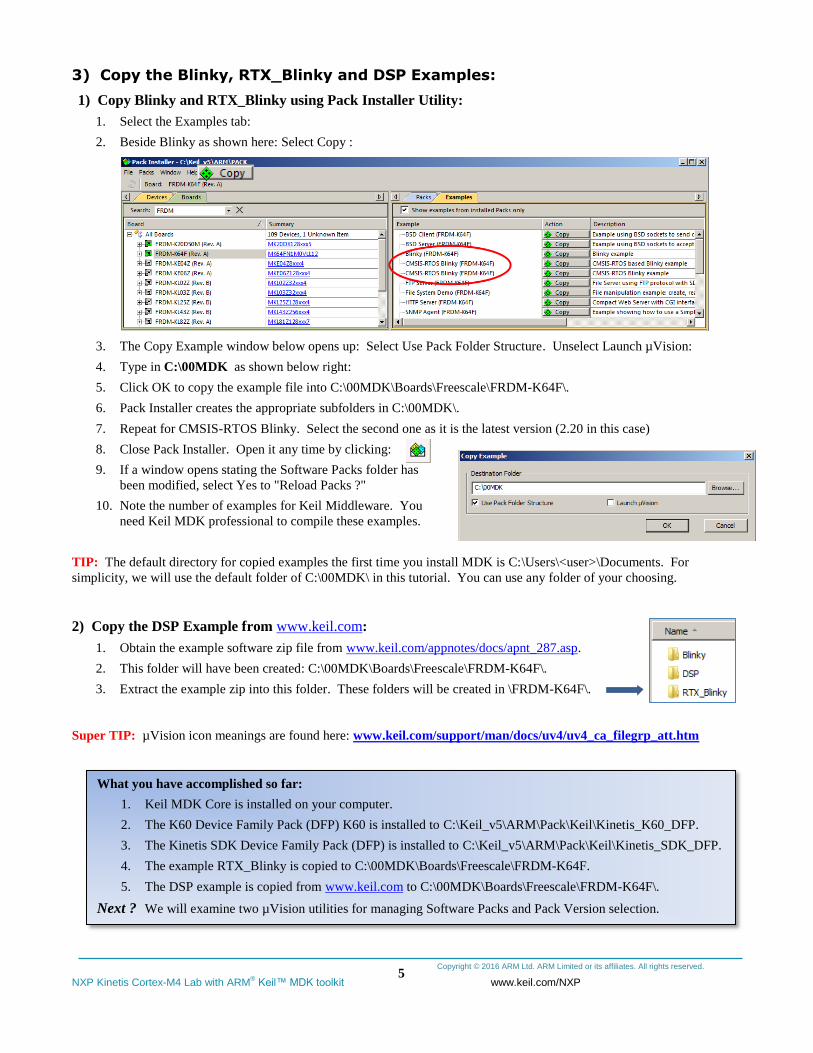
1. Select the Examples tab:
2. Beside Blinky as shown here: Select Copy :
3. The Copy Example window below opens up: Select Use Pack Folder Structure. Unselect Launch µVision:
4. Type in C:\00MDK as shown below right:
5. Click OK to copy the example file into C:\00MDK\Boards\Freescale\FRDM-K64F\.
6. Pack Installer creates the appropriate subfolders in C:\00MDK\.
7. Repeat for CMSIS-RTOS Blinky. Select the second one as it is the latest version (2.20 in this case)
8. Close Pack Installer. Open it any time by clicking:
9. If a window opens stating the Software Packs folder has
been modified, select Yes to "Reload Packs ?"
10. Note the number of examples for Keil Middleware. You
need Keil MDK professional to compile these examples.
TIP: The default directory for copied examples the first time you install MDK is C:\Users\<user>\Documents. For
simplicity, we will use the default folder of C:\00MDK\ in this tutorial. You can use any folder of your choosing.
2) Copy the DSP Example from www.keil.com:
1. Obtain the example software zip file from www.keil.com/appnotes/docs/apnt_287.asp.
2. This folder will have been created: C:\00MDK\Boards\Freescale\FRDM-K64F\.
3. Extract the example zip into this folder. These folders will be created in \FRDM-K64F\.
Super TIP: µVision icon meanings are found here: www.keil.com/support/man/docs/uv4/uv4_ca_filegrp_att.htm
What you have accomplished so far:
1. Keil MDK Core is installed on your computer.
2. The K60 Device Family Pack (DFP) K60 is installed to C:\Keil_v5\ARM\Pack\Keil\Kinetis_K60_DFP.
3. The Kinetis SDK Device Family Pack (DFP) is installed to C:\Keil_v5\ARM\Pack\Keil\Kinetis_SDK_DFP.
4. The example RTX_Blinky is copied to C:\00MDK\Boards\Freescale\FRDM-K64F.
5. The DSP example is copied from www.keil.com to C:\00MDK\Boards\Freescale\FRDM-K64F\.
Next ? We will examine two µVision utilities for managing Software Packs and Pack Version selection.
Copyright © 2016 ARM Ltd. ARM Limited or its affiliates. All rights reserved.
NXP Kinetis Cortex-M4 Lab with ARM® Keil™ MDK toolkit www.keil.com/NXP
6
4) Software Pack Version Selection and Manage Run-Time Environment:
This section contains three parts on this and the next page:
A) Select Software Pack Version:
B) Manage Run-Time Environment:
C) Updating Source Files:
A) Select Software Pack Version: this section is provided for reference:
This µVision utility provides the ability to choose various Software Pack versions installed in your computer. You can select
the versions you want to use. You must have µVision running and any project open for the following exercises:
1. Select Project/Open Project and navigate to C:\00MDK\Boards\Freescale\FRDM-K64F\Blinky.
2. Open Blinky.uvprojx. Blinky will load into µVision.
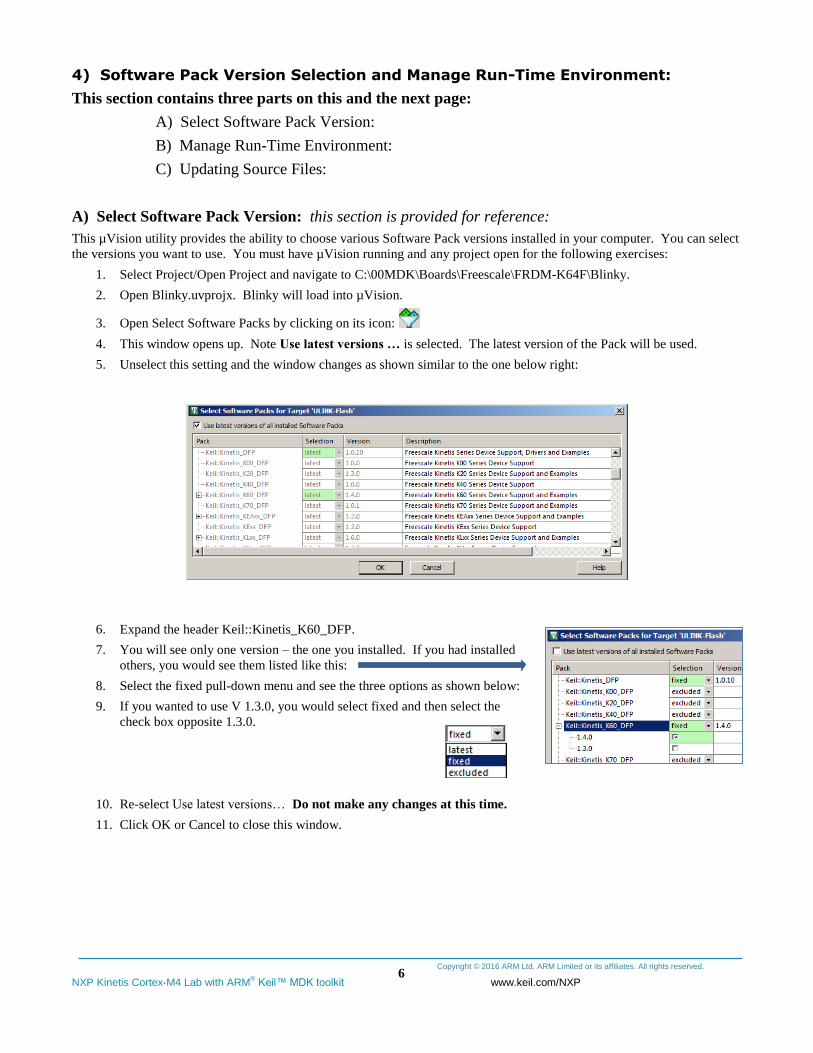
3. Open Select Software Packs by clicking on its icon:
4. This window opens up. Note Use latest versions … is selected. The latest version of the Pack will be used.
5. Unselect this setting and the window changes as shown similar to the one below right:
6. Expand the header Keil::Kinetis_K60_DFP.
7. You will see only one version – the one you installed. If you had installed
others, you would see them listed like this:
8. Select the fixed pull-down menu and see the three options as shown below:
9. If you wanted to use V 1.3.0, you would select fixed and then select the
check box opposite 1.3.0.
10. Re-select Use latest versions… Do not make any changes at this time.
11. Click OK or Cancel to close this window.
Copyright © 2016 ARM Ltd. ARM Limited or its affiliates. All rights reserved.
NXP Kinetis Cortex-M4 Lab with ARM® Keil™ MDK toolkit www.keil.com/NXP
7
B) Manage Run-Time Environment: this section is provided for reference:
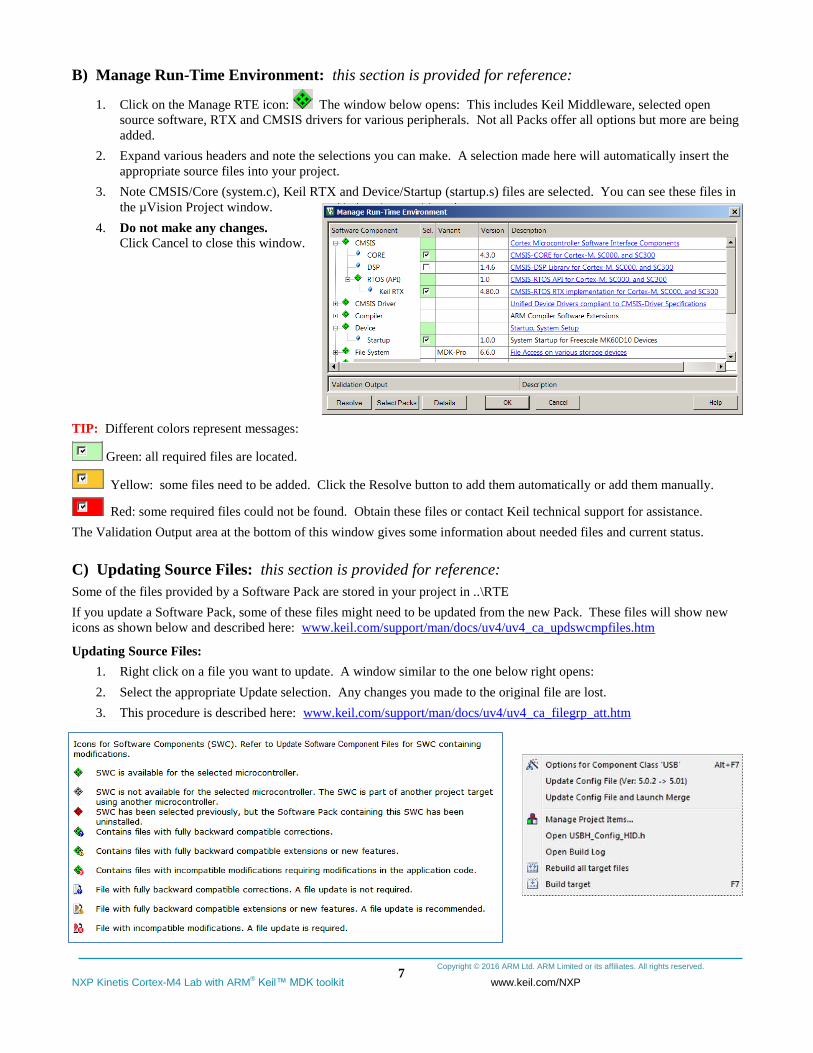
1. Click on the Manage RTE icon: The window below opens: This includes Keil Middleware, selected open
source software, RTX and CMSIS drivers for various peripherals. Not all Packs offer all options but more are being
added.
2. Expand various headers and note the selections you can make. A selection made here will automatically insert the
appropriate source files into your project.
3. Note CMSIS/Core (system.c), Keil RTX and Device/Startup (startup.s) files are selected. You can see these files in
the µVision Project window.
4. Do not make any changes.
Click Cancel to close this window.
TIP: Different colors represent messages:
Green: all required files are located.
Yellow: some files need to be added. Click the Resolve button to add them automatically or add them manually.
Red: some required files could not be found. Obtain these files or contact Keil technical support for assistance.
The Validation Output area at the bottom of this window gives some information about needed files and current status.
C) Updating Source Files: this section is provided for reference:
Some of the files provided by a Software Pack are stored in your project in ..\RTE
If you update a Software Pack, some of these files might need to be updated from the new Pack. These files will show new
icons as shown below and described here: www.keil.com/support/man/docs/uv4/uv4_ca_updswcmpfiles.htm
Updating Source Files:
1. Right click on a file you want to update. A window similar to the one below right opens:
2. Select the appropriate Update selection. Any changes you made to the original file are lost.
3. This procedure is described here: www.keil.com/support/man/docs/uv4/uv4_ca_filegrp_att.htm
Copyright © 2016 ARM Ltd. ARM Limited or its affiliates. All rights reserved.
NXP Kinetis Cortex-M4 Lab with ARM® Keil™ MDK toolkit www.keil.com/NXP
8
5) CoreSight Definitions: It is useful to have a basic understanding of these terms:
Cortex-M0 and Cortex-M0+ may have only features 2) and 4) plus 11), 12) and 13) implemented. Cortex-M3, Cortex-
M4 and Cortex-M7 can have all features listed implemented. MTB is normally found on Cortex-M0+. It is possible
some processors have all features except ETM Instruction trace and the trace port. Consult your specific datasheet.
1. JTAG: Provides access to the CoreSight debugging module located on the Cortex processor. It uses 4 to 5 pins.
2. SWD: Serial Wire Debug is a two pin alternative to JTAG and has about the same capabilities except Boundary
Scan is not possible. SWD is referenced as SW in the µVision Cortex-M Target Driver Setup.
The SWJ box must be selected in ULINK2/ME or ULINKpro. Serial Wire Viewer (SWV) must use SWD because
the JTAG signal TDO shares the same pin as SWO. The SWV data normally comes out the SWO pin or Trace Port.
3. JTAG and SWD are functionally equivalent. The signals and protocols are not directly compatible.
4. DAP: Debug Access Port. This is a component of the ARM CoreSight debugging module that is accessed via the
JTAG or SWD port. One of the features of the DAP are the memory read and write accesses which provide on-the-
fly memory accesses without the need for processor core intervention. µVision uses the DAP to update Memory,
Watch, Peripheral and RTOS kernel awareness windows while the processor is running. You can also modify
variable values on the fly. No CPU cycles are used, the program can be running and no code stubs are needed.
You do not need to configure or activate DAP. µVision configures DAP when you select a function that uses it.
Do not confuse this with CMSIS_DAP which is an ARM on-board debug adapter standard.
5. SWV: Serial Wire Viewer: A trace capability providing display of reads, writes, exceptions, PC Samples and printf.
6. SWO: Serial Wire Output: SWV frames usually come out this one pin output. It shares the JTAG signal TDO.
7. Trace Port: A 4 bit port that ULINKpro uses to collect ETM frames and optionally SWV (rather than SWO pin).
8. ITM: Instrumentation Trace Macrocell: As used by µVision, ITM is thirty-two 32 bit memory addresses (Port 0
through 31) that when written to, will be output on either the SWO or Trace Port. This is useful for printf type
operations. µVision uses Port 0 for printf and Port 31 for the RTOS Event Viewer. The data can be saved to a file.
9. ETM: Embedded Trace Macrocell: Displays all the executed instructions. The ULINKpro provides ETM. ETM
requires a special 20 pin CoreSight connector. ETM also provides Code Coverage and Performance Analysis. ETM
is output on the Trace Port or accessible in the ETB (ETB has no Code Coverage or Performance Analysis).
10. ETB: Embedded Trace Buffer: A small amount of internal RAM used as an ETM trace buffer. This trace does not
need a specialized debug adapter such as a ULINKpro. ETB runs as fast as the processor and is especially useful for
very fast Cortex-A processors. Not all processors have ETB. See your specific datasheet.
11. MTB: Micro Trace Buffer. A portion of the device internal RAM is used for an instruction trace buffer. Only on
Cortex-M0+ processors. Cortex-M3/M4 and Cortex-M7 processors provide ETM trace instead.
12. Hardware Breakpoints: The Cortex-M0+ has 2 breakpoints. The Cortex-M3, M4 and M7 usually have 6. These
can be set/unset on-the-fly without stopping the processor. They are no skid: they do not execute the instruction
they are set on when a match occurs. The CPU is halted before the instruction is executed.
13. WatchPoints: Both the Cortex-M0, M0+, Cortex-M3, Cortex-M4 and Cortex-M7 can have 2 Watchpoints. These
are conditional breakpoints. They stop the program when a specified value is read and/or written to a specified
address or variable. There also referred to as Access Breaks in Keil documentation.
Read-Only Source Files:
Some source files in the Project window will have a yellow key on them: This means they are read-only. This is to help
unintentional changes to these files. This can cause difficult to solve problems. These files normally need no modification.
If you need to modify one, you can use Windows Explorer to modify its permission.
1. In the Projects window, double click on the file to open it in the Sources window.
2. Right click on its source tab and select Open Containing folder.
3. Explorer will open with the file selected.
4. Right click on the file and select Properties.
5. Unselect Read-only and click OK. You are now able to change the file in the µVision editor.
6. It is a good idea to make the file read-only when you are finished modifications.
Super TIP: µVision icon meanings are found here: www.keil.com/support/man/docs/uv4/uv4_ca_filegrp_att.htm
Copyright © 2016 ARM Ltd. ARM Limited or its affiliates. All rights reserved.
NXP Kinetis Cortex-M4 Lab with ARM® Keil™ MDK toolkit www.keil.com/NXP
9
Part A: Connecting and Configuring Debug Adapters to the Kinetis FRDM board:
1) OpenSDA (CMSIS-DAP) configuration for the NXP Freedom board:
If you are using any Keil ULINK or a J-Link as your debug adapter: you can skip this page: µVision supports CMSOIS-DAP as provided by NXP OpenSDA.. This allows debugging the K64F with a USB cable. No
external adapter is required. µVision directly supports CMSIS-DAP. You must download the CMSIS-DAP into the board.
The OpenSDA file is contained within the Keil example projects. Currently it is named k20dx128_k64f_if_mbed.bin and
located in this folder: C:\00MDK\Boards\Freescale\FRDM-K64F\Blinky\OpenSDAv2.
If you decide to use a ULINK2 or ULINK-ME, you will get Serial Wire Viewer (SWV). With a ULINKpro, ETM Trace is
added which records all executed instructions and provides Code Coverage, Execution Profiling and Performance Analysis.
Put the FRDM-K64F board into download mode:
1. With the board unpowered, hold RESET SW1 down and power the board on J26 SDA USB as shown below:
2. Wait 1 second and release the RESET switch.
3. The green LED SDA D2 will blink every two seconds. The OpenSDA K20 processor is now in download mode.
4. A drive called BOOTLOADER will be created:
Download the .bin CMSIS-DAP: You normally have to do this procedure only once.
5. Open Microsoft Explorer and navigate to C:\00MDK\Boards\Freescale\FRDM-K64F\Blinky\OpenSDAv2\.
6. The file k20dx128_k64f_if_mbed.bin will be located in this folder.
7. Copy and paste or drag and drop into the BOOTLOADER disk that is shown above.
8. Remove and replace the USB cable to cycle the power to the FRDM board.
9. You will hear the usual USB double tone and the green LED SDA D2 will stay on. CMSIS-DAP is now installed.
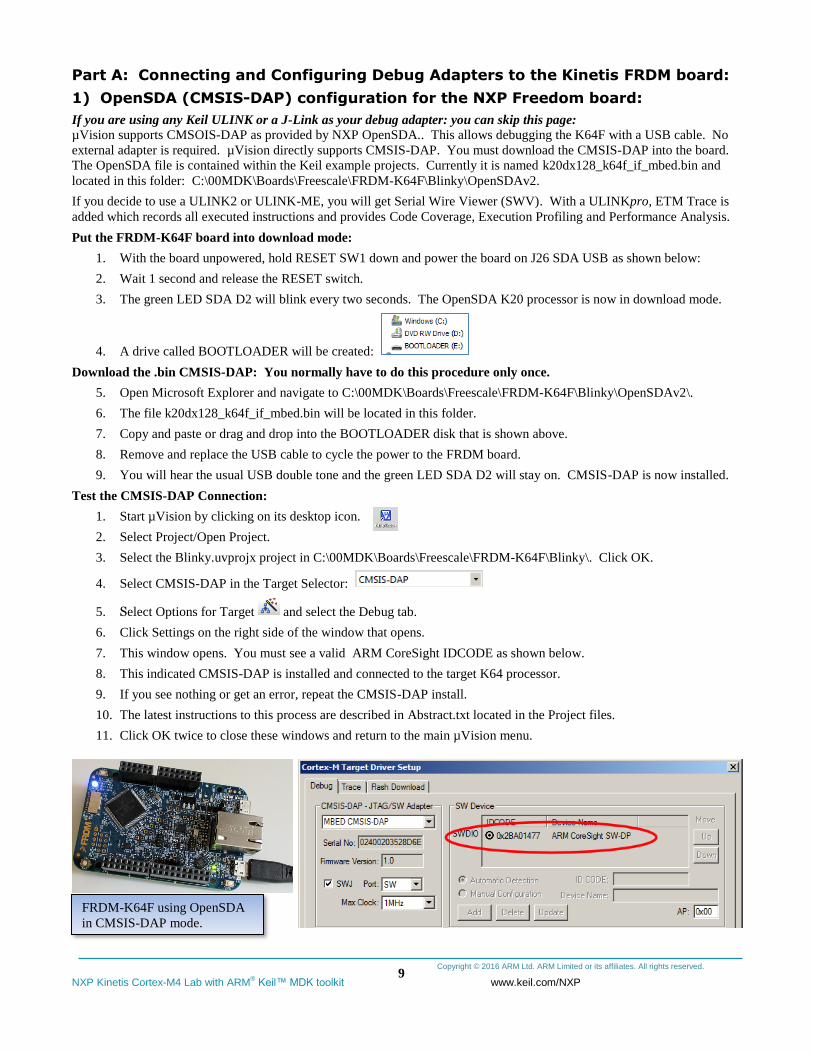
Test the CMSIS-DAP Connection:
1. Start µVision by clicking on its desktop icon.
2. Select Project/Open Project.
3. Select the Blinky.uvprojx project in C:\00MDK\Boards\Freescale\FRDM-K64F\Blinky\. Click OK.
4. Select CMSIS-DAP in the Target Selector:
5. Select Options for Target and select the Debug tab.
6. Click Settings on the right side of the window that opens.
7. This window opens. You must see a valid ARM CoreSight IDCODE as shown below.
8. This indicated CMSIS-DAP is installed and connected to the target K64 processor.
9. If you see nothing or get an error, repeat the CMSIS-DAP install.
10. The latest instructions to this process are described in Abstract.txt located in the Project files.
11. Click OK twice to close these windows and return to the main µVision menu.
FRDM-K64F using OpenSDA
in CMSIS-DAP mode.
Copyright © 2016 ARM Ltd. ARM Limited or its affiliates. All rights reserved.
NXP Kinetis Cortex-M4 Lab with ARM® Keil™ MDK toolkit www.keil.com/NXP
10
2) Connecting a ULINK2/ME, ULINKpro or J-Link to the NXP FRDM board:
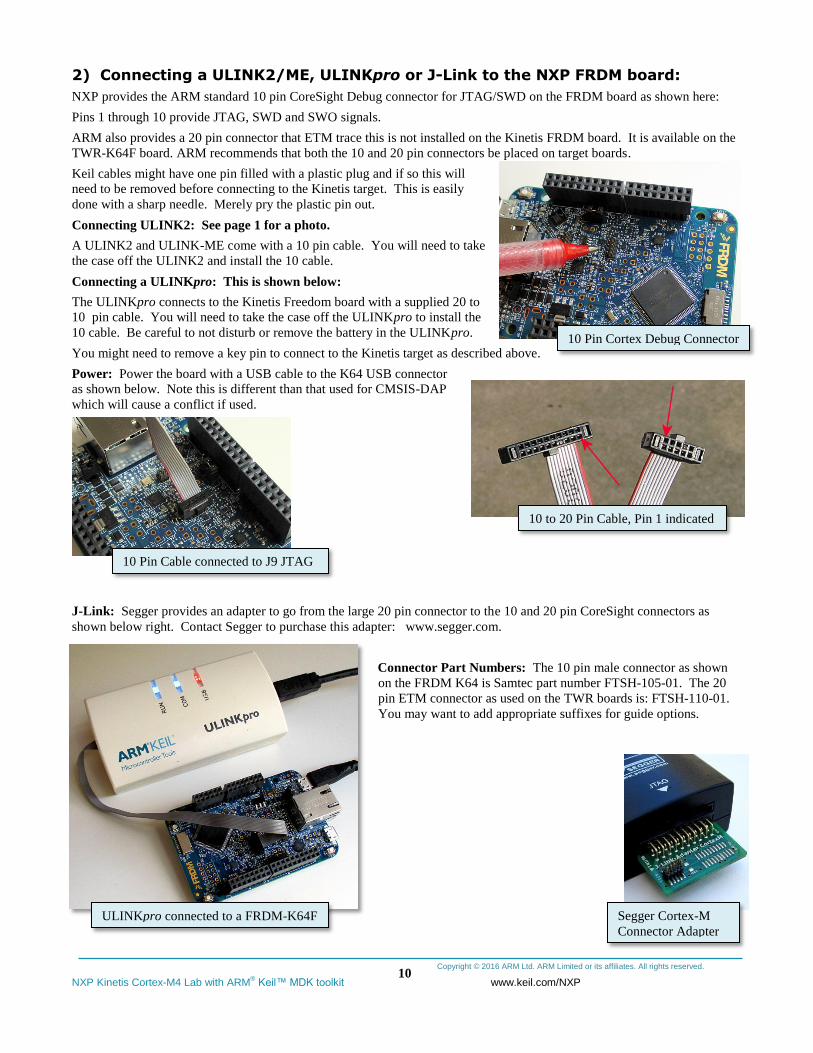
NXP provides the ARM standard 10 pin CoreSight Debug connector for JTAG/SWD on the FRDM board as shown here:
Pins 1 through 10 provide JTAG, SWD and SWO signals.
ARM also provides a 20 pin connector that ETM trace this is not installed on the Kinetis FRDM board. It is available on the
TWR-K64F board. ARM recommends that both the 10 and 20 pin connectors be placed on target boards.
Keil cables might have one pin filled with a plastic plug and if so this will
need to be removed before connecting to the Kinetis target. This is easily
done with a sharp needle. Merely pry the plastic pin out.
Connecting ULINK2: See page 1 for a photo.
A ULINK2 and ULINK-ME come with a 10 pin cable. You will need to take
the case off the ULINK2 and install the 10 cable.
Connecting a ULINKpro: This is shown below:
The ULINKpro connects to the Kinetis Freedom board with a supplied 20 to
10 pin cable. You will need to take the case off the ULINKpro to install the
10 cable. Be careful to not disturb or remove the battery in the ULINKpro.
You might need to remove a key pin to connect to the Kinetis target as described above.
Power: Power the board with a USB cable to the K64 USB connector
as shown below. Note this is different than that used for CMSIS-DAP
which will cause a conflict if used.
J-Link: Segger provides an adapter to go from the large 20 pin connector to the 10 and 20 pin CoreSight connectors as
shown below right. Contact Segger to purchase this adapter: www.segger.com.
Connector Part Numbers: The 10 pin male connector as shown
on the FRDM K64 is Samtec part number FTSH-105-01. The 20
pin ETM connector as used on the TWR boards is: FTSH-110-01.
You may want to add appropriate suffixes for guide options.
Segger Cortex-M
Connector Adapter
ULINKpro connected to a FRDM-K64F
10 Pin Cortex Debug Connector
10 to 20 Pin Cable, Pin 1 indicated
10 Pin Cable connected to J9 JTAG
Copyright © 2016 ARM Ltd. ARM Limited or its affiliates. All rights reserved.
NXP Kinetis Cortex-M4 Lab with ARM® Keil™ MDK toolkit www.keil.com/NXP
11
3) Configuring Debug Adapters in µVision: This section is for reference:
It is easy to configure for a variety of Debug Adapters. Blinky and RTX_Blinky examples are preconfigured for CMSIS-
DAP (OpenSDAV2) and a Keil ULINK2. You can add a configuration for a ULINKpro or a J-Link easily.
This will explain how to add a ULINKpro to the Blinky example. You can add a J-Link in a similar fashion.
Prerequisites:
µVision must be running and in Edit mode (not Debug mode). Your project must be loaded. We will use Blinky.
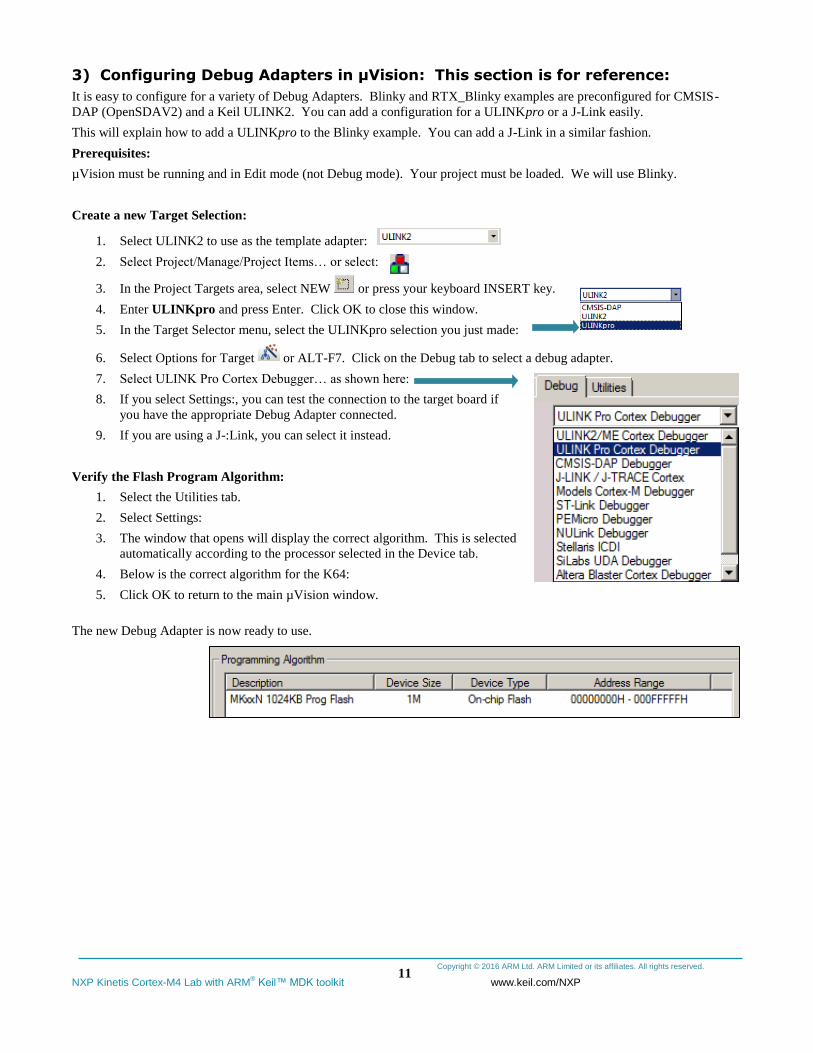
Create a new Target Selection:
1. Select ULINK2 to use as the template adapter:
2. Select Project/Manage/Project Items… or select:
3. In the Project Targets area, select NEW or press your keyboard INSERT key.
4. Enter ULINKpro and press Enter. Click OK to close this window.
5. In the Target Selector menu, select the ULINKpro selection you just made:
6. Select Options for Target or ALT-F7. Click on the Debug tab to select a debug adapter.
7. Select ULINK Pro Cortex Debugger… as shown here:
8. If you select Settings:, you can test the connection to the target board if
you have the appropriate Debug Adapter connected.
9. If you are using a J-:Link, you can select it instead.
Verify the Flash Program Algorithm:
1. Select the Utilities tab.
2. Select Settings:
3. The window that opens will display the correct algorithm. This is selected
automatically according to the processor selected in the Device tab.
4. Below is the correct algorithm for the K64:
5. Click OK to return to the main µVision window.
The new Debug Adapter is now ready to use.
Copyright © 2016 ARM Ltd. ARM Limited or its affiliates. All rights reserved.
NXP Kinetis Cortex-M4 Lab with ARM® Keil™ MDK toolkit www.keil.com/NXP
12
Part B: Keil Example Projects
1) Blinky example program:
We will run the example program Blinky on the FRDM-K64F board using the CMSIS-DAP OpenSDA.
If you want to use a Keil ULINK2, it is preconfigured in the Target Selector. If you are using a ULINKpro, you must select
it in the Target Options window under the Debug tab. See the previous page for instructions.
If using CMSIS-DAP OpenSDA (no external debug adapter):
1. Connect a USB cable to the SDA USB J26 connector. Skip the next step.
If Using a Keil ULINK2, ULINKpro or a J-Link:
1. Connect your debug adapter as described on the page 10 to the J9 JTAG connector.
2. Power your TWR board with a USB cable connected to J 22 K64 USB connector and to your PC.
Open and compile the Blinky Program:
1. Start µVision by clicking on its desktop icon.
2. Select Project/Open Project.
3. Open the file C:\00MDK\Boards\Freescale\FRDM-K64F\Blinky\Blinky.uvprojx.
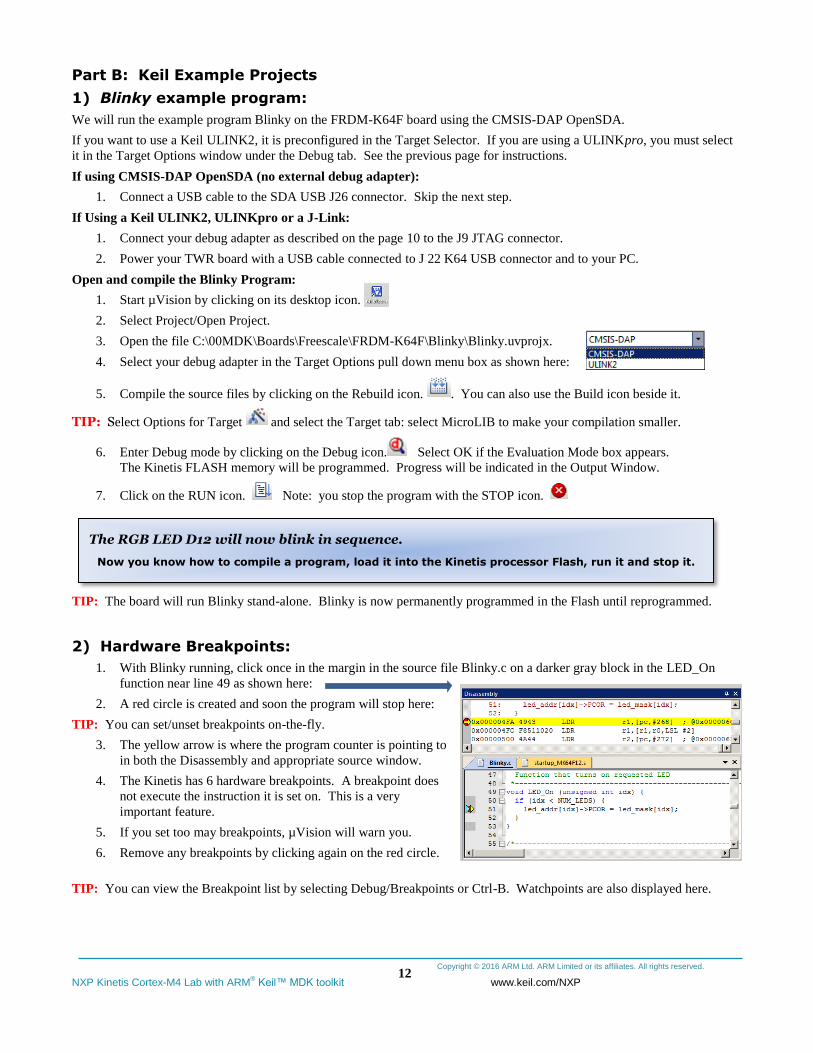
4. Select your debug adapter in the Target Options pull down menu box as shown here:
5. Compile the source files by clicking on the Rebuild icon. . You can also use the Build icon beside it.
TIP: Select Options for Target and select the Target tab: select MicroLIB to make your compilation smaller.
6. Enter Debug mode by clicking on the Debug icon. Select OK if the Evaluation Mode box appears.
The Kinetis FLASH memory will be programmed. Progress will be indicated in the Output Window.
7. Click on the RUN icon. Note: you stop the program with the STOP icon.
TIP: The board will run Blinky stand-alone. Blinky is now permanently programmed in the Flash until reprogrammed.
2) Hardware Breakpoints:
1. With Blinky running, click once in the margin in the source file Blinky.c on a darker gray block in the LED_On
function near line 49 as shown here:
2. A red circle is created and soon the program will stop here:
TIP: You can set/unset breakpoints on-the-fly.
3. The yellow arrow is where the program counter is pointing to
in both the Disassembly and appropriate source window.
4. The Kinetis has 6 hardware breakpoints. A breakpoint does
not execute the instruction it is set on. This is a very
important feature.
5. If you set too may breakpoints, µVision will warn you.
6. Remove any breakpoints by clicking again on the red circle.
TIP: You can view the Breakpoint list by selecting Debug/Breakpoints or Ctrl-B. Watchpoints are also displayed here.
The RGB LED D12 will now blink in sequence.
Now you know how to compile a program, load it into the Kinetis processor Flash, run it and stop it.
Copyright © 2016 ARM Ltd. ARM Limited or its affiliates. All rights reserved.
NXP Kinetis Cortex-M4 Lab with ARM® Keil™ MDK toolkit www.keil.com/NXP
13
3) Call Stack + Locals Window: (This page works with all debug adapters)
Local Variables:
The Call Stack and Local windows are incorporated into one integrated window. Whenever the program is stopped, the Call
Stack + Locals window will display stack contents as well as any local variables belonging to the active function.
If possible, the values of the local variables will be displayed and if not the message <not in scope> will be displayed. The
Call + Stack window presence or visibility can be toggled by selecting View/Call Stack window.
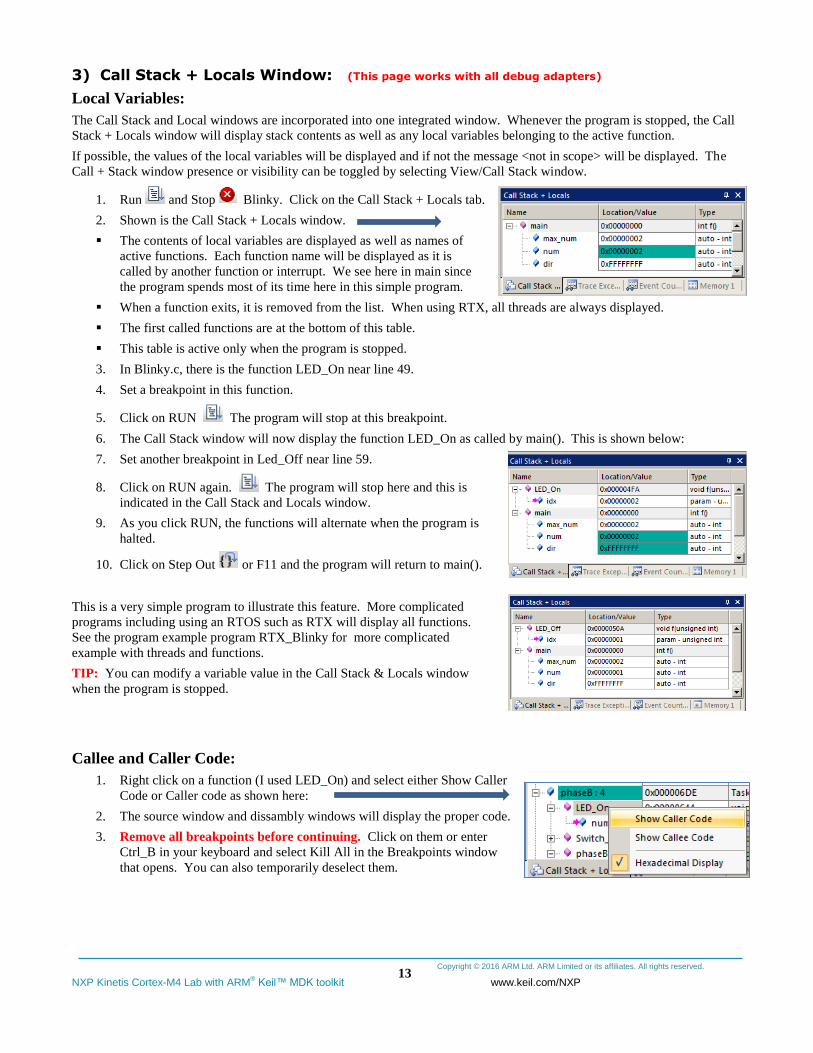
1. Run and Stop Blinky. Click on the Call Stack + Locals tab.
2. Shown is the Call Stack + Locals window.
The contents of local variables are displayed as well as names of
active functions. Each function name will be displayed as it is
called by another function or interrupt. We see here in main since
the program spends most of its time here in this simple program.
When a function exits, it is removed from the list. When using RTX, all threads are always displayed.
The first called functions are at the bottom of this table.
This table is active only when the program is stopped.
3. In Blinky.c, there is the function LED_On near line 49.
4. Set a breakpoint in this function.
5. Click on RUN The program will stop at this breakpoint.
6. The Call Stack window will now display the function LED_On as called by main(). This is shown below:
7. Set another breakpoint in Led_Off near line 59.
8. Click on RUN again. The program will stop here and this is
indicated in the Call Stack and Locals window.
9. As you click RUN, the functions will alternate when the program is
halted.
10. Click on Step Out or F11 and the program will return to main().
This is a very simple program to illustrate this feature. More complicated
programs including using an RTOS such as RTX will display all functions.
See the program example program RTX_Blinky for more complicated
example with threads and functions.
TIP: You can modify a variable value in the Call Stack & Locals window
when the program is stopped.
Callee and Caller Code:
1. Right click on a function (I used LED_On) and select either Show Caller
Code or Caller code as shown here:
2. The source window and dissambly windows will display the proper code.
3. Remove all breakpoints before continuing. Click on them or enter
Ctrl_B in your keyboard and select Kill All in the Breakpoints window
that opens. You can also temporarily deselect them.
Copyright © 2016 ARM Ltd. ARM Limited or its affiliates. All rights reserved.
NXP Kinetis Cortex-M4 Lab with ARM® Keil™ MDK toolkit www.keil.com/NXP
14
4) Watch and Memory Windows and how to use them:
The Watch and Memory windows will display updated variables (not local or automatic variables) in real-time. It does this
using ARM CoreSight debugging technology that is part of Cortex-M processors. It is also possible to “put” or insert values
into memory locations using the Memory and Peripheral windows in real-time or Watch if the data changes slowly enough..
a) Create a Global Variable counter and increment it:
1. Stop the program and exit Debug mode.
2. In Blinky.c near line 18, declare this global variable: unsigned int counter = 0;
3. In the function LED_On which is located near line 49, add this code at the end of this function near line 52:
counter++;
if (counter > 0x0F) counter = 0;
TIP: You can add another counter++; to the end of the function LED_Off to speed up the incrementing of this variable.
4. Compile the source files by clicking on the Rebuild icon. . Enter Debug mode Click RUN
b) Enter counter in a Watch window:
1. In Blinky.c, right click on any instance of counter and select Add counter to … and select Watch 1.
TIP: You can add a variable to a Watch or Memory window while the program runs only with any Keil ULINK or a J-Link.
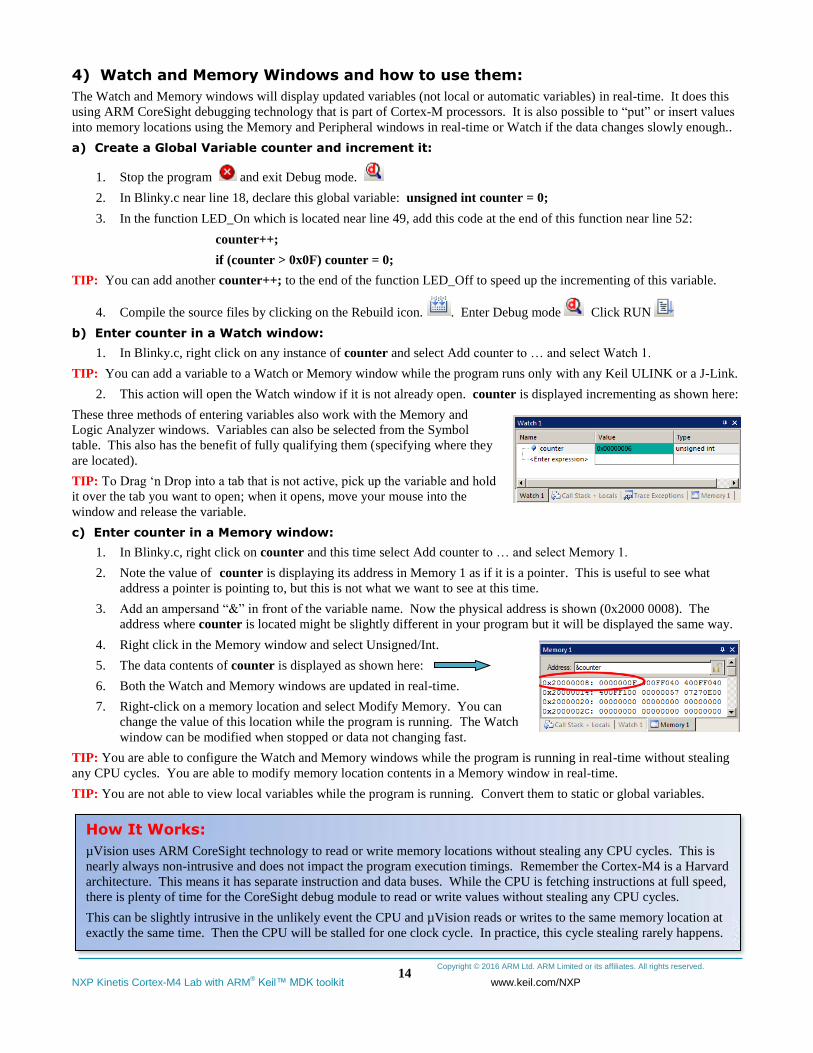
2. This action will open the Watch window if it is not already open. counter is displayed incrementing as shown here:
These three methods of entering variables also work with the Memory and
Logic Analyzer windows. Variables can also be selected from the Symbol
table. This also has the benefit of fully qualifying them (specifying where they
are located).
TIP: To Drag ‘n Drop into a tab that is not active, pick up the variable and hold
it over the tab you want to open; when it opens, move your mouse into the
window and release the variable.
c) Enter counter in a Memory window:
1. In Blinky.c, right click on counter and this time select Add counter to … and select Memory 1.
2. Note the value of counter is displaying its address in Memory 1 as if it is a pointer. This is useful to see what
address a pointer is pointing to, but this is not what we want to see at this time.
3. Add an ampersand “&” in front of the variable name. Now the physical address is shown (0x2000 0008). The
address where counter is located might be slightly different in your program but it will be displayed the same way.
4. Right click in the Memory window and select Unsigned/Int.
5. The data contents of counter is displayed as shown here:
6. Both the Watch and Memory windows are updated in real-time.
7. Right-click on a memory location and select Modify Memory. You can
change the value of this location while the program is running. The Watch
window can be modified when stopped or data not changing fast.
TIP: You are able to configure the Watch and Memory windows while the program is running in real-time without stealing
any CPU cycles. You are able to modify memory location contents in a Memory window in real-time.
TIP: You are not able to view local variables while the program is running. Convert them to static or global variables.
How It Works:
µVision uses ARM CoreSight technology to read or write memory locations without stealing any CPU cycles. This is
nearly always non-intrusive and does not impact the program execution timings. Remember the Cortex-M4 is a Harvard
architecture. This means it has separate instruction and data buses. While the CPU is fetching instructions at full speed,
there is plenty of time for the CoreSight debug module to read or write values without stealing any CPU cycles.
This can be slightly intrusive in the unlikely event the CPU and µVision reads or writes to the same memory location at
exactly the same time. Then the CPU will be stalled for one clock cycle. In practice, this cycle stealing rarely happens.
Copyright © 2016 ARM Ltd. ARM Limited or its affiliates. All rights reserved.
NXP Kinetis Cortex-M4 Lab with ARM® Keil™ MDK toolkit www.keil.com/NXP
15
5) System Viewer (SV):
System Viewer provides the ability to view certain registers in the CPU core and in peripherals. In many cases, these Views
are updated in real-time while your program is running. These Views are available only while in Debug mode. There are two
ways to access these Views: a) View/System Viewer and b) Peripherals/System Viewer. In the Peripheral/Viewer menu, the
Core Peripherals are also available:
In our Blinky example, the three LEDs blinking are connected to GPIO Port A and E.
1. Click on RUN . You can open SV windows when your program is running.
GPIO Port A:
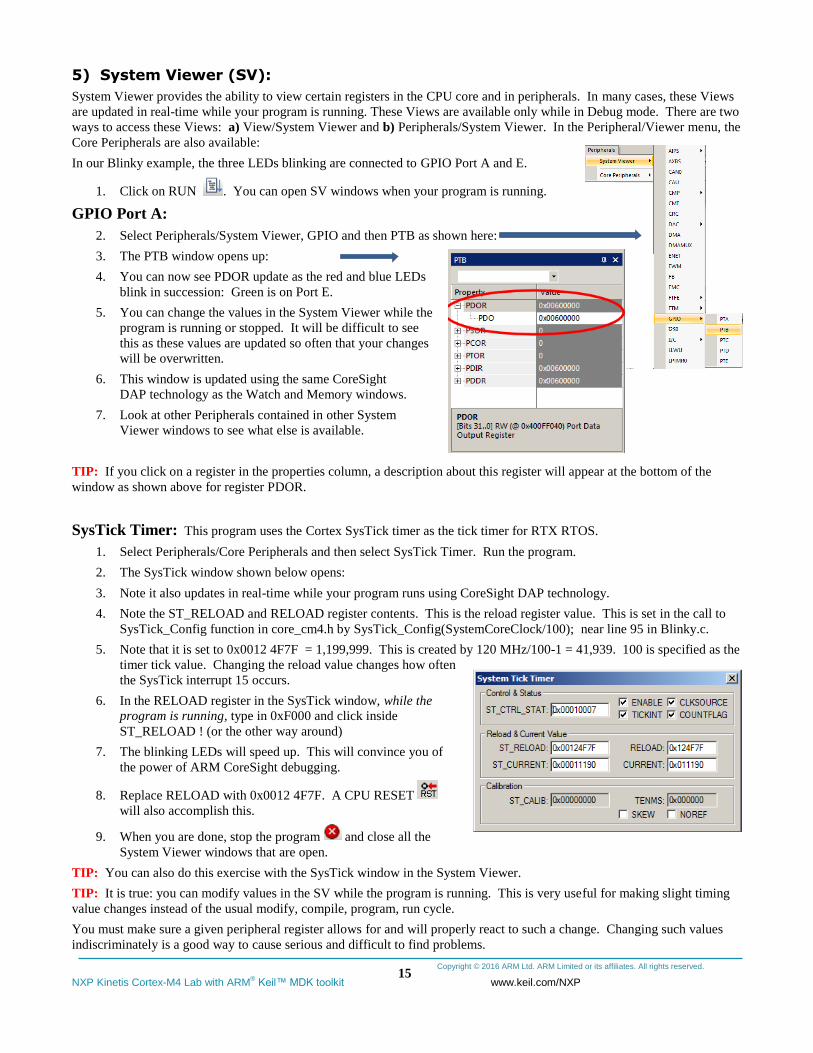
2. Select Peripherals/System Viewer, GPIO and then PTB as shown here:
3. The PTB window opens up:
4. You can now see PDOR update as the red and blue LEDs
blink in succession: Green is on Port E.
5. You can change the values in the System Viewer while the
program is running or stopped. It will be difficult to see
this as these values are updated so often that your changes
will be overwritten.
6. This window is updated using the same CoreSight
DAP technology as the Watch and Memory windows.
7. Look at other Peripherals contained in other System
Viewer windows to see what else is available.
TIP: If you click on a register in the properties column, a description about this register will appear at the bottom of the
window as shown above for register PDOR.
SysTick Timer: This program uses the Cortex SysTick timer as the tick timer for RTX RTOS.
1. Select Peripherals/Core Peripherals and then select SysTick Timer. Run the program.
2. The SysTick window shown below opens:
3. Note it also updates in real-time while your program runs using CoreSight DAP technology.
4. Note the ST_RELOAD and RELOAD register contents. This is the reload register value. This is set in the call to
SysTick_Config function in core_cm4.h by SysTick_Config(SystemCoreClock/100); near line 95 in Blinky.c.
5. Note that it is set to 0x0012 4F7F = 1,199,999. This is created by 120 MHz/100-1 = 41,939. 100 is specified as the
timer tick value. Changing the reload value changes how often
the SysTick interrupt 15 occurs.
6. In the RELOAD register in the SysTick window, while the
program is running, type in 0xF000 and click inside
ST_RELOAD ! (or the other way around)
7. The blinking LEDs will speed up. This will convince you of
the power of ARM CoreSight debugging.
8. Replace RELOAD with 0x0012 4F7F. A CPU RESET
will also accomplish this.
9. When you are done, stop the program and close all the
System Viewer windows that are open.
TIP: You can also do this exercise with the SysTick window in the System Viewer.
TIP: It is true: you can modify values in the SV while the program is running. This is very useful for making slight timing
value changes instead of the usual modify, compile, program, run cycle.
You must make sure a given peripheral register allows for and will properly react to such a change. Changing such values
indiscriminately is a good way to cause serious and difficult to find problems.
Copyright © 2016 ARM Ltd. ARM Limited or its affiliates. All rights reserved.
NXP Kinetis Cortex-M4 Lab with ARM® Keil™ MDK toolkit www.keil.com/NXP
16
6a) Configuring Serial Wire Viewer (SWV) only with ULINK2, ULINK-ME or J-Link:
These instructions are not for ULINKpro: they are on the next page.
Serial Wire Viewer provides data trace information including interrupts in real-time without any code stubs in your sources.
These instructions are for a ULINK2, ULINK-ME or a J-Link.
Configure SWV:
1. µVision must be stopped and in Edit mode (not Debug mode). Blinky.uvprojx must be loaded.
2. For ULINK2/ME: select ULINK2:
3. Select Options for Target or ALT-F7 and select the Debug tab. Your debugger must be displayed beside Use:.
4. Select Settings: on the right side of this window.
5. Confirm Port: is set to SW and SWJ box is enabled for SWD operation. SWV will not work with JTAG.
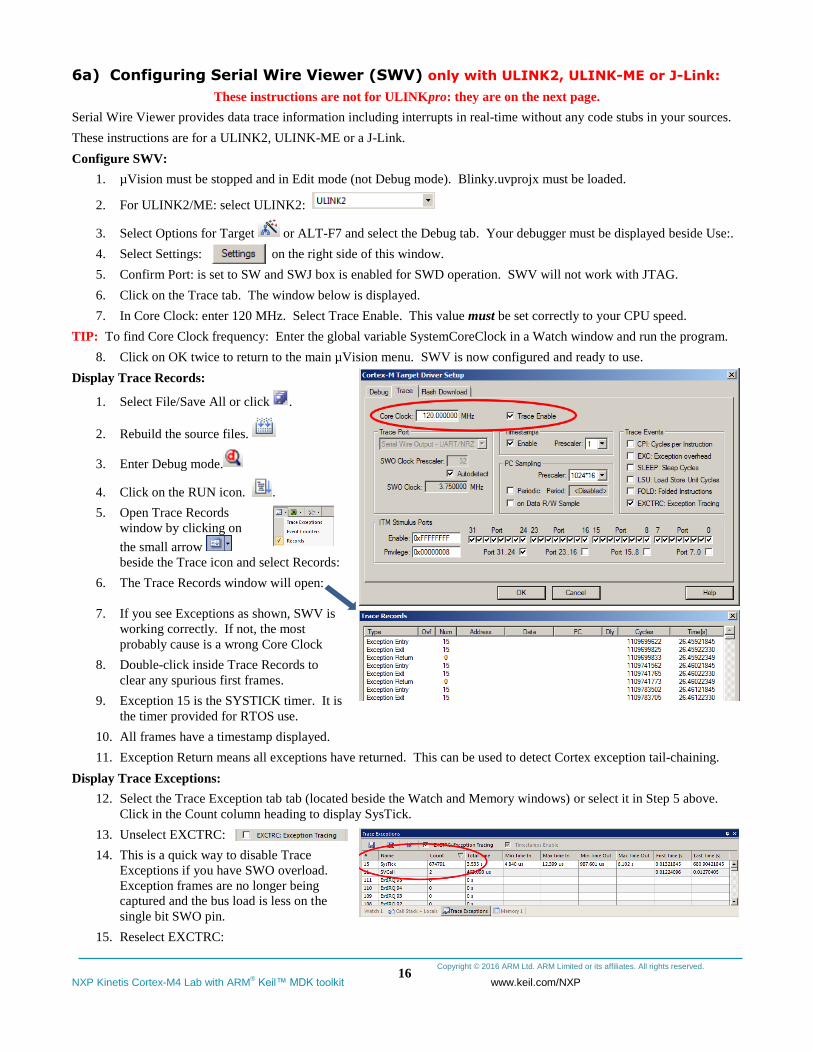
6. Click on the Trace tab. The window below is displayed.
7. In Core Clock: enter 120 MHz. Select Trace Enable. This value must be set correctly to your CPU speed.
TIP: To find Core Clock frequency: Enter the global variable SystemCoreClock in a Watch window and run the program.
8. Click on OK twice to return to the main µVision menu. SWV is now configured and ready to use.
Display Trace Records:
1. Select File/Save All or click .
2. Rebuild the source files.
3. Enter Debug mode.
4. Click on the RUN icon. .
5. Open Trace Records
window by clicking on
the small arrow
beside the Trace icon and select Records:
6. The Trace Records window will open:
7. If you see Exceptions as shown, SWV is
working correctly. If not, the most
probably cause is a wrong Core Clock
8. Double-click inside Trace Records to
clear any spurious first frames.
9. Exception 15 is the SYSTICK timer. It is
the timer provided for RTOS use.
10. All frames have a timestamp displayed.
11. Exception Return means all exceptions have returned. This can be used to detect Cortex exception tail-chaining.
Display Trace Exceptions:
12. Select the Trace Exception tab tab (located beside the Watch and Memory windows) or select it in Step 5 above.
Click in the Count column heading to display SysTick.
13. Unselect EXCTRC:
14. This is a quick way to disable Trace
Exceptions if you have SWO overload.
Exception frames are no longer being
captured and the bus load is less on the
single bit SWO pin.
15. Reselect EXCTRC:
Copyright © 2016 ARM Ltd. ARM Limited or its affiliates. All rights reserved.
NXP Kinetis Cortex-M4 Lab with ARM® Keil™ MDK toolkit www.keil.com/NXP
17
6b) Using Serial Wire Viewer (SWV) with ULINKpro: (using the 1 bit SWO Port)
1) Configure SWV: (You can also use the 4 bit Trace Port with the ULINKpro. This is available on TWR boards only)
1. µVision must be stopped and in Edit mode (not Debug mode). Blinky must be loaded.
2. Connect a ULINKpro as described on page 10 to JTAG J9 and to your PC USB Port.
3. Create a new target option for ULINKpro as described on page 11. Select ULINKpro: in the pulldown menu.
4. Select Options for Target or ALT-F7 and select the Debug tab. ULINKpro must be visible in the dialog box.
5. Select Settings: on the right side of this window.
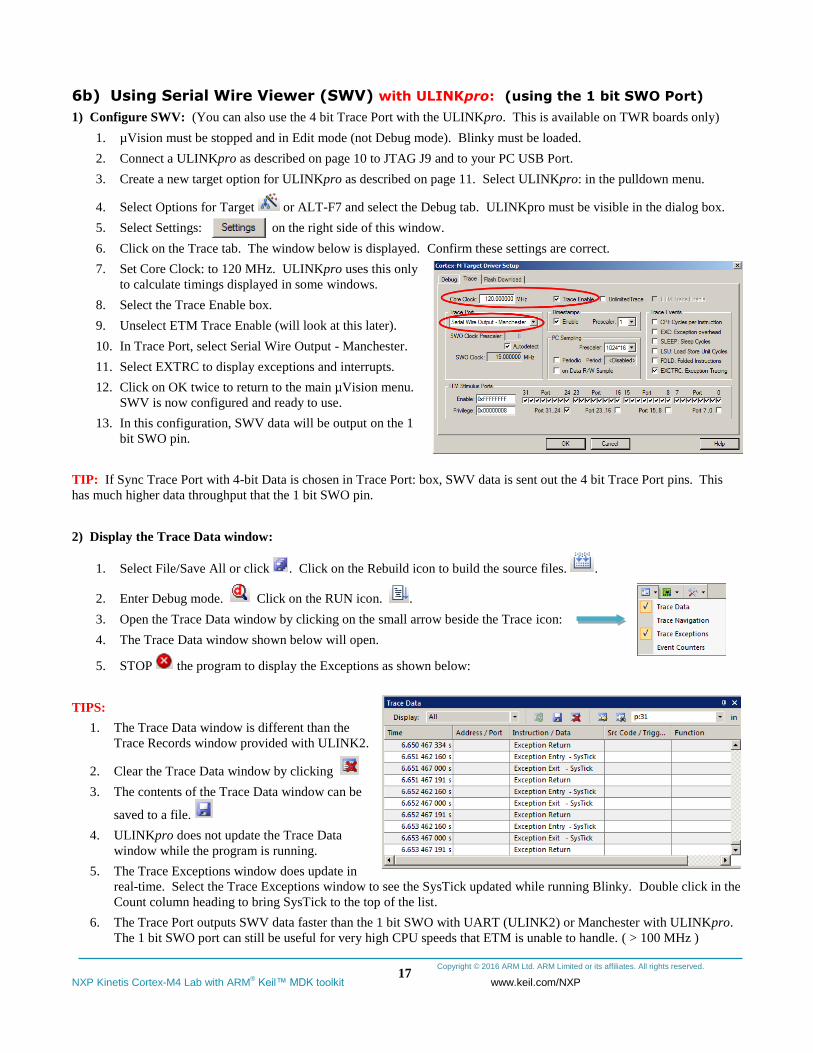
6. Click on the Trace tab. The window below is displayed. Confirm these settings are correct.
7. Set Core Clock: to 120 MHz. ULINKpro uses this only
to calculate timings displayed in some windows.
8. Select the Trace Enable box.
9. Unselect ETM Trace Enable (will look at this later).
10. In Trace Port, select Serial Wire Output - Manchester.
11. Select EXTRC to display exceptions and interrupts.
12. Click on OK twice to return to the main µVision menu.
SWV is now configured and ready to use.
13. In this configuration, SWV data will be output on the 1
bit SWO pin.
TIP: If Sync Trace Port with 4-bit Data is chosen in Trace Port: box, SWV data is sent out the 4 bit Trace Port pins. This
has much higher data throughput that the 1 bit SWO pin.
2) Display the Trace Data window:
1. Select File/Save All or click . Click on the Rebuild icon to build the source files. .
2. Enter Debug mode. Click on the RUN icon. .
3. Open the Trace Data window by clicking on the small arrow beside the Trace icon:
4. The Trace Data window shown below will open.
5. STOP the program to display the Exceptions as shown below:
TIPS:
1. The Trace Data window is different than the
Trace Records window provided with ULINK2.
2. Clear the Trace Data window by clicking
3. The contents of the Trace Data window can be
saved to a file.
4. ULINKpro does not update the Trace Data
window while the program is running.
5. The Trace Exceptions window does update in
real-time. Select the Trace Exceptions window to see the SysTick updated while running Blinky. Double click in the
Count column heading to bring SysTick to the top of the list.
6. The Trace Port outputs SWV data faster than the 1 bit SWO with UART (ULINK2) or Manchester with ULINKpro.
The 1 bit SWO port can still be useful for very high CPU speeds that ETM is unable to handle. ( > 100 MHz )
Copyright © 2016 ARM Ltd. ARM Limited or its affiliates. All rights reserved.
NXP Kinetis Cortex-M4 Lab with ARM® Keil™ MDK toolkit www.keil.com/NXP
18
7) Using the Logic Analyzer (LA) with ULINK2, ULINK-ME, ULINKpro or J-Link:
This example will use a ULINK2, ULINKpro or a J-Link with the Blinky example. Please connect a your debug adapter to
your Kinetis board and configure it for Serial Wire Viewer (SWV) trace as described on the previous two pages.
µVision has a graphical Logic Analyzer (LA) window. Up to four variables can be displayed in real-time using the Serial
Wire Viewer as implemented in the Kinetis. LA uses the same comparators as Watchpoints so all can't be used at same time.
1. SWV must be configured as found on the two previous two pages for the debug adapter you are using.
2. µVision must be in Debug mode.
3. Run the program. . TIP: Recall you can configure the LA while the program is running or stopped.
4. Open View/Analysis Windows and select Logic Analyzer or select the LA window on the toolbar.
5. Locate the global variable counter in Blinky.c. You declared it near line 18.
6. Right click on counter and select Add counter to… and select Logic Analyzer.
TIP: If an error results when adding counter to the LA, the most probable cause is SWV is not configured correctly.
7. In the LA, click on Setup and set Max: in Display Range to 0x0F. Click on Close.
8. The LA is now configured to display counter in a graphical format.
9. counter should still be in the Watch and Memory windows. It will be incrementing if the program is running.
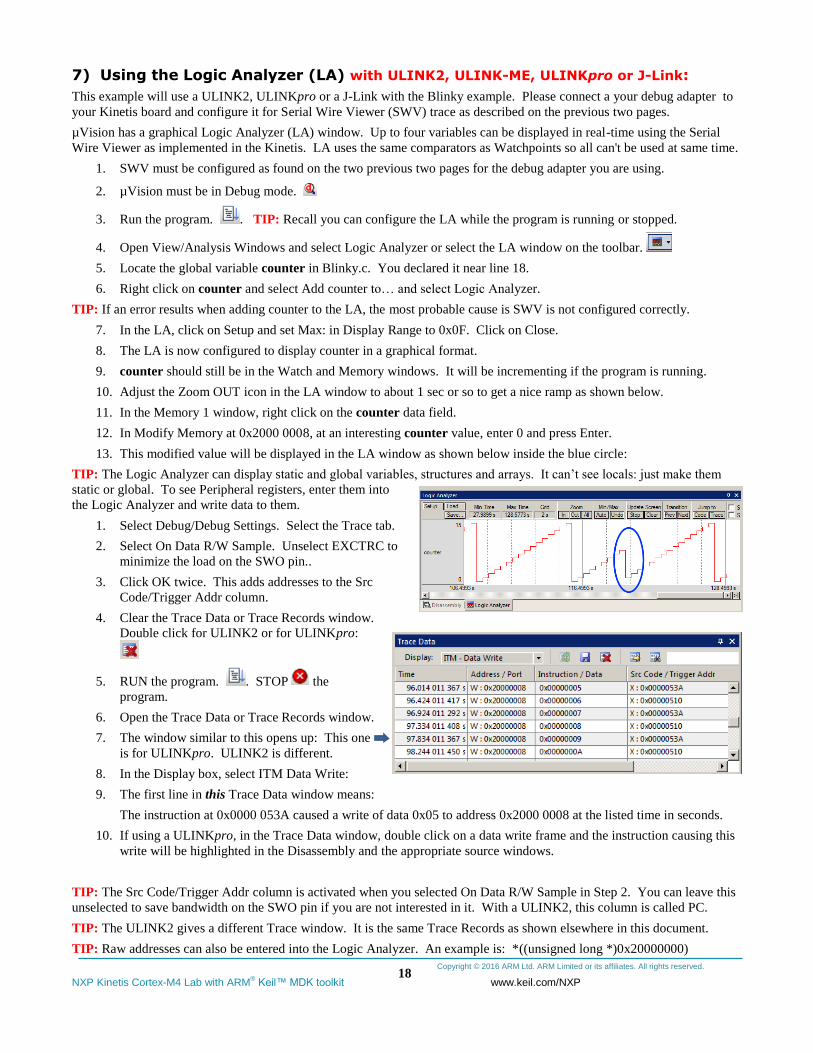
10. Adjust the Zoom OUT icon in the LA window to about 1 sec or so to get a nice ramp as shown below.
11. In the Memory 1 window, right click on the counter data field.
12. In Modify Memory at 0x2000 0008, at an interesting counter value, enter 0 and press Enter.
13. This modified value will be displayed in the LA window as shown below inside the blue circle:
TIP: The Logic Analyzer can display static and global variables, structures and arrays. It can’t see locals: just make them
static or global. To see Peripheral registers, enter them into
the Logic Analyzer and write data to them.
1. Select Debug/Debug Settings. Select the Trace tab.
2. Select On Data R/W Sample. Unselect EXCTRC to
minimize the load on the SWO pin..
3. Click OK twice. This adds addresses to the Src
Code/Trigger Addr column.
4. Clear the Trace Data or Trace Records window.
Double click for ULINK2 or for ULINKpro:
5. RUN the program. . STOP the
program.
6. Open the Trace Data or Trace Records window.
7. The window similar to this opens up: This one
is for ULINKpro. ULINK2 is different.
8. In the Display box, select ITM Data Write:
9. The first line in this Trace Data window means:
The instruction at 0x0000 053A caused a write of data 0x05 to address 0x2000 0008 at the listed time in seconds.
10. If using a ULINKpro, in the Trace Data window, double click on a data write frame and the instruction causing this
write will be highlighted in the Disassembly and the appropriate source windows.
TIP: The Src Code/Trigger Addr column is activated when you selected On Data R/W Sample in Step 2. You can leave this
unselected to save bandwidth on the SWO pin if you are not interested in it. With a ULINK2, this column is called PC.
TIP: The ULINK2 gives a different Trace window. It is the same Trace Records as shown elsewhere in this document.
TIP: Raw addresses can also be entered into the Logic Analyzer. An example is: *((unsigned long *)0x20000000)
Copyright © 2016 ARM Ltd. ARM Limited or its affiliates. All rights reserved.
NXP Kinetis Cortex-M4 Lab with ARM® Keil™ MDK toolkit www.keil.com/NXP
19
8) Watchpoints: Conditional Breakpoints: With OpenSDA (CMSIS-DAP), ULINK2, ULINKpro or J-Link.
Kinetis Cortex-M4 processors have two Watchpoints. Watchpoints can be thought of as conditional breakpoints. The Logic
Analyzer uses the same CoreSight components as Watchpoints in its operations. A Watchpoint requires two of the four
comparators. Keil documentation often refers to Watchpoints as Access Breaks. µVision uses only one at this time.
µVision warns you if you attempt to set more than one Watchpoint. SWV or ETM do not need to be configured and any
ULINK or J-Link can be used for Watchpoints.
1. Use the Blinky example from the previous page. A Watchpoint can be set while the program is running.
2. While in Debug mode, click on Debug and select Breakpoints or press Ctrl-B.
3. The SWV Trace does not need to be configured for Watchpoints. However, we will use it in this exercise.
4. OpenSDA does not currently support SWV and therefore does not support the LA which uses SWV.
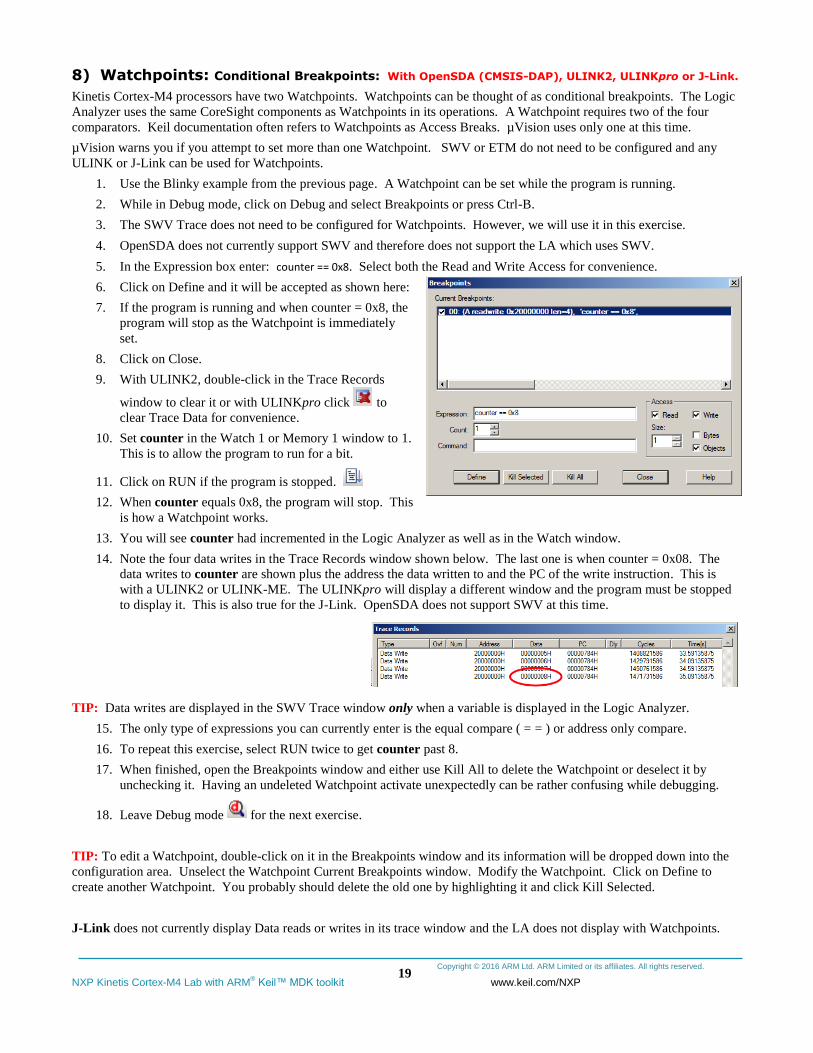
5. In the Expression box enter: counter == 0x8. Select both the Read and Write Access for convenience.
6. Click on Define and it will be accepted as shown here:
7. If the program is running and when counter = 0x8, the
program will stop as the Watchpoint is immediately
set.
8. Click on Close.
9. With ULINK2, double-click in the Trace Records
window to clear it or with ULINKpro click to
clear Trace Data for convenience.
10. Set counter in the Watch 1 or Memory 1 window to 1.
This is to allow the program to run for a bit.
11. Click on RUN if the program is stopped.
12. When counter equals 0x8, the program will stop. This
is how a Watchpoint works.
13. You will see counter had incremented in the Logic Analyzer as well as in the Watch window.
14. Note the four data writes in the Trace Records window shown below. The last one is when counter = 0x08. The
data writes to counter are shown plus the address the data written to and the PC of the write instruction. This is
with a ULINK2 or ULINK-ME. The ULINKpro will display a different window and the program must be stopped
to display it. This is also true for the J-Link. OpenSDA does not support SWV at this time.
TIP: Data writes are displayed in the SWV Trace window only when a variable is displayed in the Logic Analyzer.
15. The only type of expressions you can currently enter is the equal compare ( = = ) or address only compare.
16. To repeat this exercise, select RUN twice to get counter past 8.
17. When finished, open the Breakpoints window and either use Kill All to delete the Watchpoint or deselect it by
unchecking it. Having an undeleted Watchpoint activate unexpectedly can be rather confusing while debugging.
18. Leave Debug mode for the next exercise.
TIP: To edit a Watchpoint, double-click on it in the Breakpoints window and its information will be dropped down into the
configuration area. Unselect the Watchpoint Current Breakpoints window. Modify the Watchpoint. Click on Define to
create another Watchpoint. You probably should delete the old one by highlighting it and click Kill Selected.
J-Link does not currently display Data reads or writes in its trace window and the LA does not display with Watchpoints.
Copyright © 2016 ARM Ltd. ARM Limited or its affiliates. All rights reserved.
NXP Kinetis Cortex-M4 Lab with ARM® Keil™ MDK toolkit www.keil.com/NXP
20
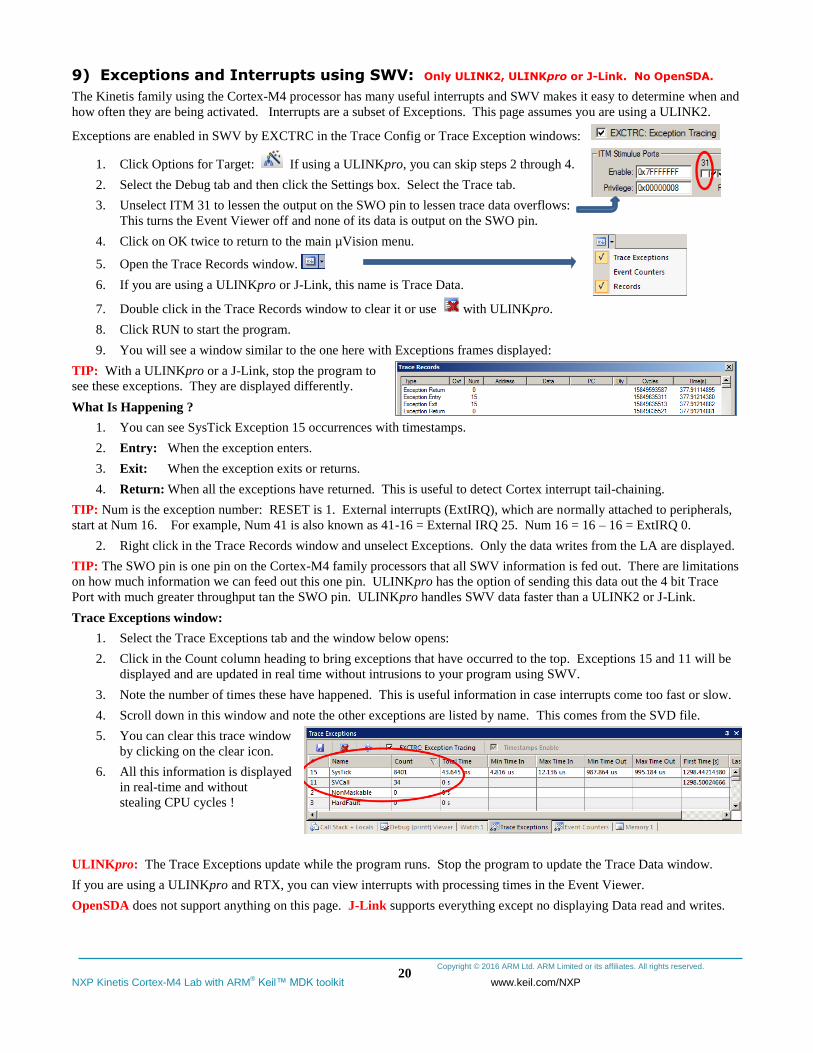
9) Exceptions and Interrupts using SWV: Only ULINK2, ULINKpro or J-Link. No OpenSDA.
The Kinetis family using the Cortex-M4 processor has many useful interrupts and SWV makes it easy to determine when and
how often they are being activated. Interrupts are a subset of Exceptions. This page assumes you are using a ULINK2.
Exceptions are enabled in SWV by EXCTRC in the Trace Config or Trace Exception windows:
1. Click Options for Target: If using a ULINKpro, you can skip steps 2 through 4.
2. Select the Debug tab and then click the Settings box. Select the Trace tab.
3. Unselect ITM 31 to lessen the output on the SWO pin to lessen trace data overflows:
This turns the Event Viewer off and none of its data is output on the SWO pin.
4. Click on OK twice to return to the main µVision menu.
5. Open the Trace Records window.
6. If you are using a ULINKpro or J-Link, this name is Trace Data.
7. Double click in the Trace Records window to clear it or use with ULINKpro.
8. Click RUN to start the program.
9. You will see a window similar to the one here with Exceptions frames displayed:
TIP: With a ULINKpro or a J-Link, stop the program to
see these exceptions. They are displayed differently.
What Is Happening ?
1. You can see SysTick Exception 15 occurrences with timestamps.
2. Entry: When the exception enters.
3. Exit: When the exception exits or returns.
4. Return: When all the exceptions have returned. This is useful to detect Cortex interrupt tail-chaining.
TIP: Num is the exception number: RESET is 1. External interrupts (ExtIRQ), which are normally attached to peripherals,
start at Num 16. For example, Num 41 is also known as 41-16 = External IRQ 25. Num 16 = 16 – 16 = ExtIRQ 0.
2. Right click in the Trace Records window and unselect Exceptions. Only the data writes from the LA are displayed.
TIP: The SWO pin is one pin on the Cortex-M4 family processors that all SWV information is fed out. There are limitations
on how much information we can feed out this one pin. ULINKpro has the option of sending this data out the 4 bit Trace
Port with much greater throughput tan the SWO pin. ULINKpro handles SWV data faster than a ULINK2 or J-Link.
Trace Exceptions window:
1. Select the Trace Exceptions tab and the window below opens:
2. Click in the Count column heading to bring exceptions that have occurred to the top. Exceptions 15 and 11 will be
displayed and are updated in real time without intrusions to your program using SWV.
3. Note the number of times these have happened. This is useful information in case interrupts come too fast or slow.
4. Scroll down in this window and note the other exceptions are listed by name. This comes from the SVD file.
5. You can clear this trace window
by clicking on the clear icon.
6. All this information is displayed
in real-time and without
stealing CPU cycles !
ULINKpro: The Trace Exceptions update while the program runs. Stop the program to update the Trace Data window.
If you are using a ULINKpro and RTX, you can view interrupts with processing times in the Event Viewer.
OpenSDA does not support anything on this page. J-Link supports everything except no displaying Data read and writes.
Copyright © 2016 ARM Ltd. ARM Limited or its affiliates. All rights reserved.
NXP Kinetis Cortex-M4 Lab with ARM® Keil™ MDK toolkit www.keil.com/NXP
21
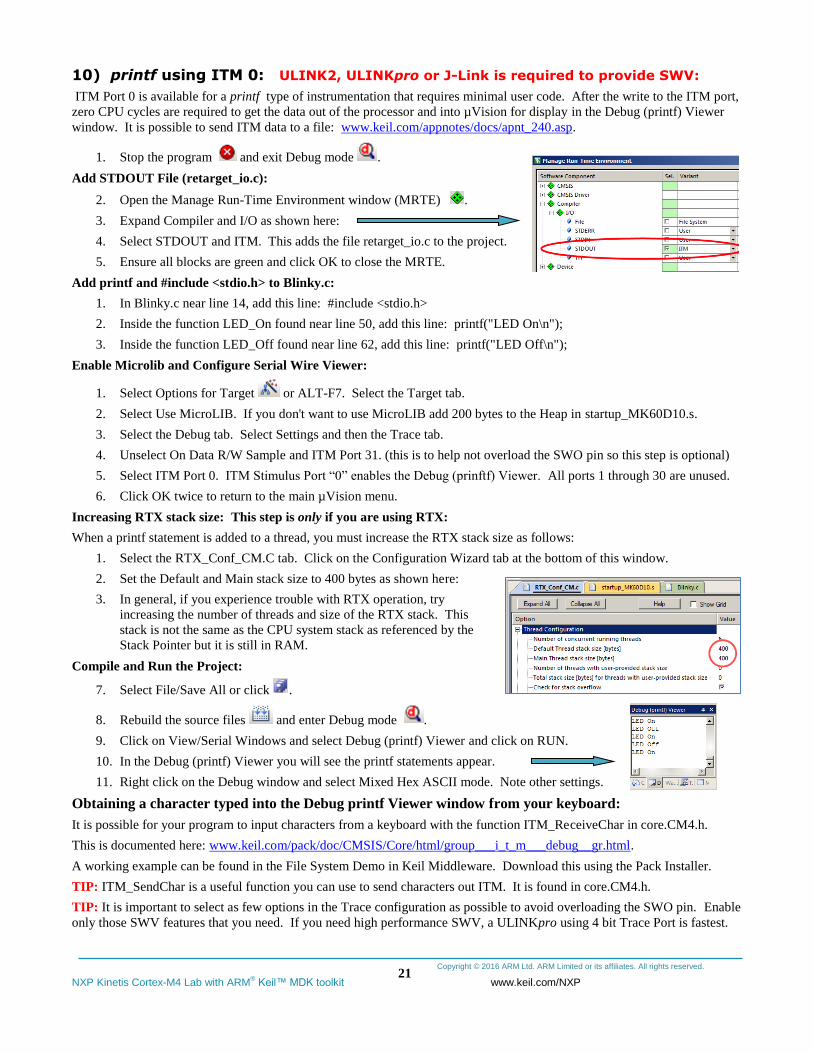
10) printf using ITM 0: ULINK2, ULINKpro or J-Link is required to provide SWV:
ITM Port 0 is available for a printf type of instrumentation that requires minimal user code. After the write to the ITM port,
zero CPU cycles are required to get the data out of the processor and into µVision for display in the Debug (printf) Viewer
window. It is possible to send ITM data to a file: www.keil.com/appnotes/docs/apnt_240.asp.
1. Stop the program and exit Debug mode .
Add STDOUT File (retarget_io.c):
2. Open the Manage Run-Time Environment window (MRTE) .
3. Expand Compiler and I/O as shown here:
4. Select STDOUT and ITM. This adds the file retarget_io.c to the project.
5. Ensure all blocks are green and click OK to close the MRTE.
Add printf and #include <stdio.h> to Blinky.c:
1. In Blinky.c near line 14, add this line: #include <stdio.h>
2. Inside the function LED_On found near line 50, add this line: printf("LED On\n");
3. Inside the function LED_Off found near line 62, add this line: printf("LED Off\n");
Enable Microlib and Configure Serial Wire Viewer:
1. Select Options for Target or ALT-F7. Select the Target tab.
2. Select Use MicroLIB. If you don't want to use MicroLIB add 200 bytes to the Heap in startup_MK60D10.s.
3. Select the Debug tab. Select Settings and then the Trace tab.
4. Unselect On Data R/W Sample and ITM Port 31. (this is to help not overload the SWO pin so this step is optional)
5. Select ITM Port 0. ITM Stimulus Port “0” enables the Debug (prinftf) Viewer. All ports 1 through 30 are unused.
6. Click OK twice to return to the main µVision menu.
Increasing RTX stack size: This step is only if you are using RTX:
When a printf statement is added to a thread, you must increase the RTX stack size as follows:
1. Select the RTX_Conf_CM.C tab. Click on the Configuration Wizard tab at the bottom of this window.
2. Set the Default and Main stack size to 400 bytes as shown here:
3. In general, if you experience trouble with RTX operation, try
increasing the number of threads and size of the RTX stack. This
stack is not the same as the CPU system stack as referenced by the
Stack Pointer but it is still in RAM.
Compile and Run the Project:
7. Select File/Save All or click .
8. Rebuild the source files and enter Debug mode .
9. Click on View/Serial Windows and select Debug (printf) Viewer and click on RUN.
10. In the Debug (printf) Viewer you will see the printf statements appear.
11. Right click on the Debug window and select Mixed Hex ASCII mode. Note other settings.
Obtaining a character typed into the Debug printf Viewer window from your keyboard:
It is possible for your program to input characters from a keyboard with the function ITM_ReceiveChar in core.CM4.h.
This is documented here: www.keil.com/pack/doc/CMSIS/Core/html/group___i_t_m___debug__gr.html.
A working example can be found in the File System Demo in Keil Middleware. Download this using the Pack Installer.
TIP: ITM_SendChar is a useful function you can use to send characters out ITM. It is found in core.CM4.h.
TIP: It is important to select as few options in the Trace configuration as possible to avoid overloading the SWO pin. Enable
only those SWV features that you need. If you need high performance SWV, a ULINKpro using 4 bit Trace Port is fastest.
Copyright © 2016 ARM Ltd. ARM Limited or its affiliates. All rights reserved.
NXP Kinetis Cortex-M4 Lab with ARM® Keil™ MDK toolkit www.keil.com/NXP
22
11) Trace Configuration Fields and General Trace Information:
For ULINK2 see www.keil.com/support/man/docs/ulink2/ulink2_ctx_trace.htm
For ULINKpro see www.keil.com/support/man/docs/ulinkpro/ulinkpro_ctx_trace.htm
For Segger J-Link see http://www.keil.com/support/man/docs/jlink/jLink_cortexTrace.htm
SWO Overload:
Serial Wire Viewer data (frames) are output on the 1 pin SWO with a ULINk2 or J-Link. This pin is located on 13 on
the 20 pin legacy connector (not on Tower boards). It is also available on the 10 or 20 pin CoreSight Debug connectors.
SWO is on pin 6 on the 10 pin and pin 14 on the 20 pin. SWO is multiplexed with JTAG TDO pin. This means SWD
(Serial Wire Debug) must be used and not JTAG mode. This is easily set in µVision. SWD = SW in µVision.
SWO is one pin and it can be challenging to send a large amount of SWV data through it. A ULINKpro using
Manchester mode on the SWO pin is more efficient. For even more throughput, ULINKpro can output SWV on the 4
bit Trace Port. This port is available on most NXP Cortex-M3, M4 and M7. Cortex-M0 does not have SWV nor the
Trace Port. It does have DAP read and writes to RAM and Peripheral addresses.
It is important to ensure the Serial Wire Output (SWO) pin is not overloaded. µVision will alert you when an overflow
occurs with an “X” in the Trace Records window or with a “D” or a “O” in the ULINKpro Trace Data window. µVision
easily recovers from these overflows and immediately continues displaying the next available trace frame. Dropped
frames are somewhat the normal situation especially with many data reads and/or writes.
Variables entered in the LA with the resulting Data writes to the Trace Records window plus exceptions and interrupts
create a trace frame each time there is an event. You may have to sample a rapidly changing variable.
ULINKpro can process SWV information much faster than the ULINK2 or ULINK-ME can. This results in fewer
dropped frames especially with higher data transfer rates out the SWO pin. ULINKpro has the option of collecting
information from the 4 bit Trace Port instead of the 1 bit SWO pin. Data overruns are often associated with a fast stream
of data reads and writes which are created in the Logic Analyzer. Minimize these issues by displaying only the
information you really need or use a ULINKpro with UART Manchester or better the 4 bit Trace Port.
Since LA is event driven, you can reduce overload by sampling a variable in your program and sending this to the LA.
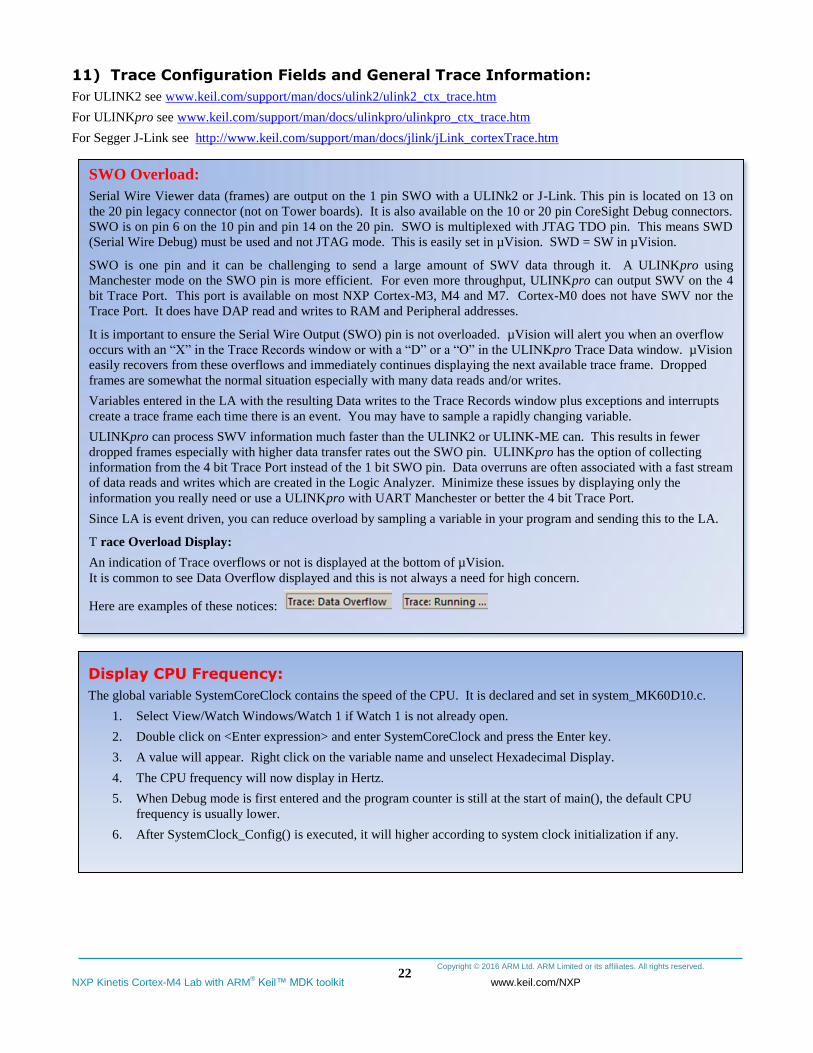
T race Overload Display:
An indication of Trace overflows or not is displayed at the bottom of µVision.
It is common to see Data Overflow displayed and this is not always a need for high concern.
Here are examples of these notices:
Display CPU Frequency:
The global variable SystemCoreClock contains the speed of the CPU. It is declared and set in system_MK60D10.c.
1. Select View/Watch Windows/Watch 1 if Watch 1 is not already open.
2. Double click on <Enter expression> and enter SystemCoreClock and press the Enter key.
3. A value will appear. Right click on the variable name and unselect Hexadecimal Display.
4. The CPU frequency will now display in Hertz.
5. When Debug mode is first entered and the program counter is still at the start of main(), the default CPU
frequency is usually lower.
6. After SystemClock_Config() is executed, it will higher according to system clock initialization if any.
Copyright © 2016 ARM Ltd. ARM Limited or its affiliates. All rights reserved.
NXP Kinetis Cortex-M4 Lab with ARM® Keil™ MDK toolkit www.keil.com/NXP
23
PART C): DSP Example using ARM CMSIS-DSP Libraries:
1) DSP SINE example:
ARM CMSIS-DSP libraries are offered for ARM Cortex-M0, Cortex-M3, Cortex-M4 and Cortex-M7 processors. DSP
libraries plus all sources are provided in MDK in C:\Keil_v5\ARM\Pack\ARM\CMSIS\.
See www.keil.com/cmsis and https://github.com/ARM-software/CMSIS_5.
You can use this example with other Kinetis boards. You might need to make some changes to the startup and system files.
This example creates a sine wave, then creates a second to act as noise, which are then added together (disturbed), and then
the noise is filtered out (filtered). The waveform in each step is displayed in the Logic Analyzer using Serial Wire Viewer.
This example incorporates the Keil RTOS RTX. RTX has a BSD (soon Apache 2.0) license. All source code is provided.
This program will run with OpenSDA but to see the interesting and useful SWV features you need any ULINK or a J-Link.
1. This program was copied to C:\00MDK\Boards\Freescale\FRDM-K64F on page 5.
1. Open the project file sine.uvprojx with µVision. Connect a ULINK or J-Link to J9 JTAG on the K64 board .
2. If you will use OpenSDA CMSIS-DAP, connect a USB cable to J26 SDA USB connector. Only the Watch1 will
show activity. No SWV including the LA will function with OpenSDA.
3. Select your debug adapter from the pull-down menu as shown here:
4. Compile the source files by clicking on the Rebuild icon. .
5. Enter Debug mode by clicking on the Debug icon. The Flash will be programmed. Select OK if the Evaluation
Mode notice appears.
TIP: The default Core Clock: is 120 MHz for use by the Trace configuration window under the Trace tab.
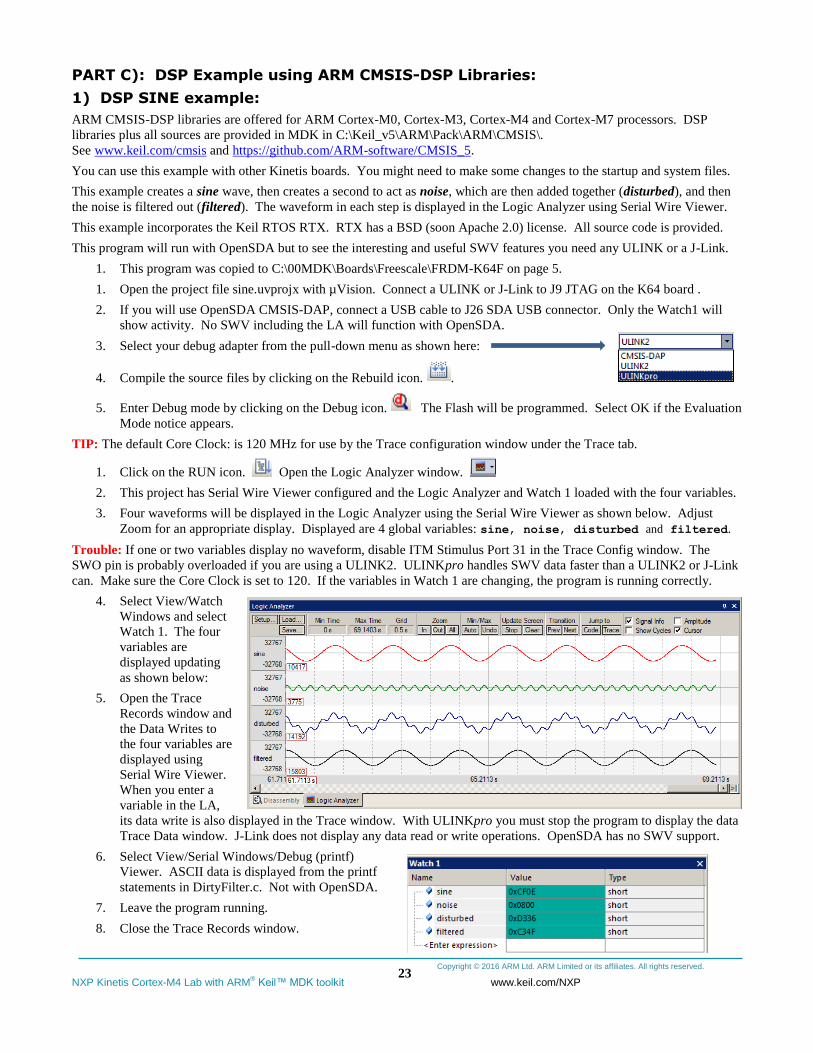
1. Click on the RUN icon. Open the Logic Analyzer window.
2. This project has Serial Wire Viewer configured and the Logic Analyzer and Watch 1 loaded with the four variables.
3. Four waveforms will be displayed in the Logic Analyzer using the Serial Wire Viewer as shown below. Adjust
Zoom for an appropriate display. Displayed are 4 global variables: sine, noise, disturbed and filtered.
Trouble: If one or two variables display no waveform, disable ITM Stimulus Port 31 in the Trace Config window. The
SWO pin is probably overloaded if you are using a ULINK2. ULINKpro handles SWV data faster than a ULINK2 or J-Link
can. Make sure the Core Clock is set to 120. If the variables in Watch 1 are changing, the program is running correctly.
4. Select View/Watch
Windows and select
Watch 1. The four
variables are
displayed updating
as shown below:
5. Open the Trace
Records window and
the Data Writes to
the four variables are
displayed using
Serial Wire Viewer.
When you enter a
variable in the LA,
its data write is also displayed in the Trace window. With ULINKpro you must stop the program to display the data
Trace Data window. J-Link does not display any data read or write operations. OpenSDA has no SWV support.
6. Select View/Serial Windows/Debug (printf)
Viewer. ASCII data is displayed from the printf
statements in DirtyFilter.c. Not with OpenSDA.
7. Leave the program running.
8. Close the Trace Records window.
Copyright © 2016 ARM Ltd. ARM Limited or its affiliates. All rights reserved.
NXP Kinetis Cortex-M4 Lab with ARM® Keil™ MDK toolkit www.keil.com/NXP
24
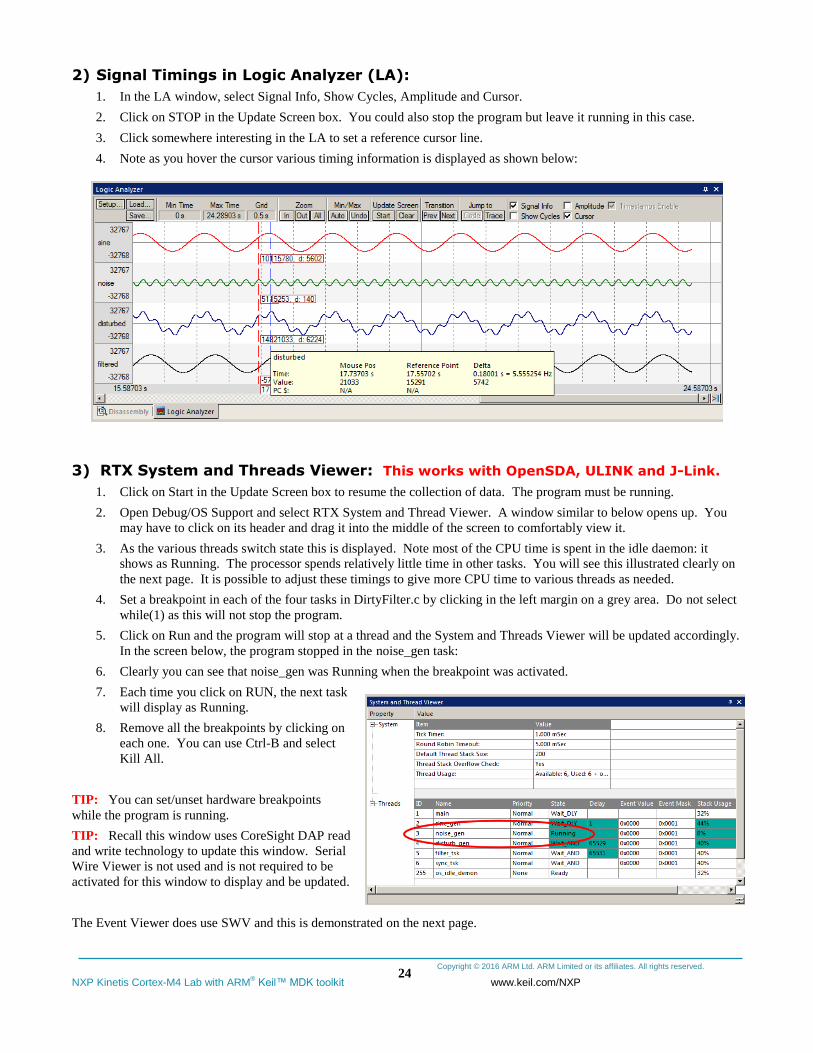
2) Signal Timings in Logic Analyzer (LA):
1. In the LA window, select Signal Info, Show Cycles, Amplitude and Cursor.
2. Click on STOP in the Update Screen box. You could also stop the program but leave it running in this case.
3. Click somewhere interesting in the LA to set a reference cursor line.
4. Note as you hover the cursor various timing information is displayed as shown below:
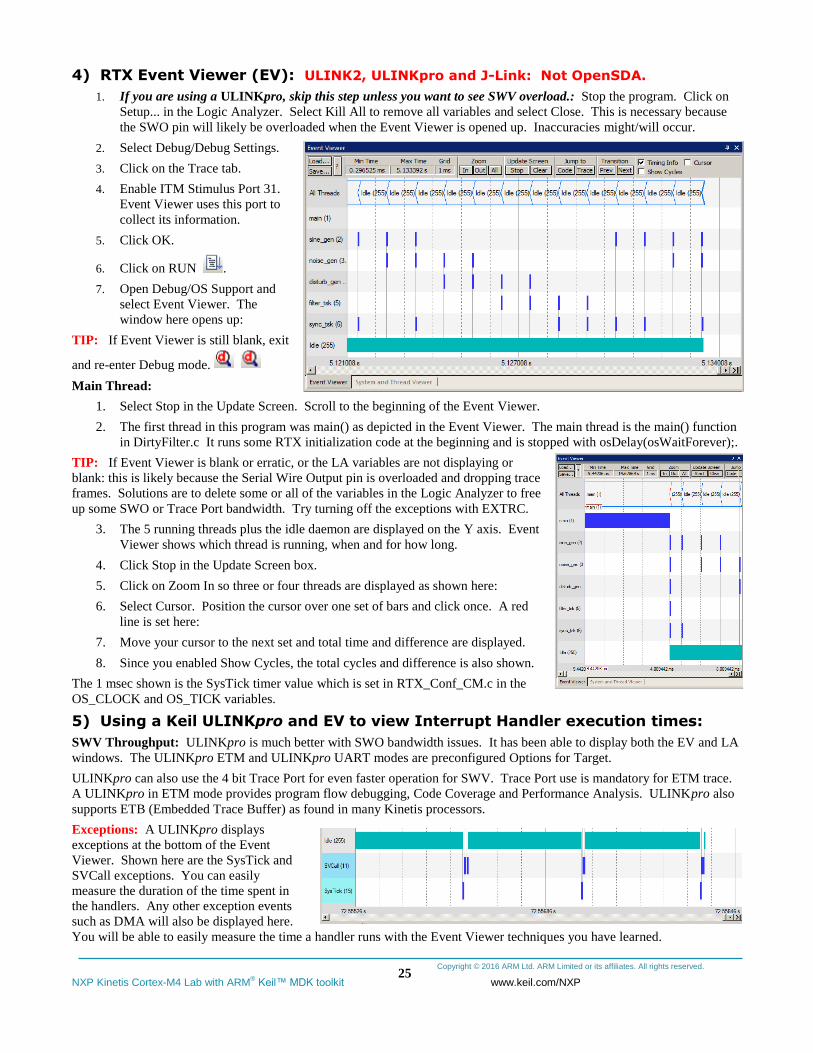
3) RTX System and Threads Viewer: This works with OpenSDA, ULINK and J-Link.
1. Click on Start in the Update Screen box to resume the collection of data. The program must be running.
2. Open Debug/OS Support and select RTX System and Thread Viewer. A window similar to below opens up. You
may have to click on its header and drag it into the middle of the screen to comfortably view it.
3. As the various threads switch state this is displayed. Note most of the CPU time is spent in the idle daemon: it
shows as Running. The processor spends relatively little time in other tasks. You will see this illustrated clearly on
the next page. It is possible to adjust these timings to give more CPU time to various threads as needed.
4. Set a breakpoint in each of the four tasks in DirtyFilter.c by clicking in the left margin on a grey area. Do not select
while(1) as this will not stop the program.
5. Click on Run and the program will stop at a thread and the System and Threads Viewer will be updated accordingly.
In the screen below, the program stopped in the noise_gen task:
6. Clearly you can see that noise_gen was Running when the breakpoint was activated.
7. Each time you click on RUN, the next task
will display as Running.
8. Remove all the breakpoints by clicking on
each one. You can use Ctrl-B and select
Kill All.
TIP: You can set/unset hardware breakpoints
while the program is running.
TIP: Recall this window uses CoreSight DAP read
and write technology to update this window. Serial
Wire Viewer is not used and is not required to be
activated for this window to display and be updated.
The Event Viewer does use SWV and this is demonstrated on the next page.
Copyright © 2016 ARM Ltd. ARM Limited or its affiliates. All rights reserved.
NXP Kinetis Cortex-M4 Lab with ARM® Keil™ MDK toolkit www.keil.com/NXP
25
4) RTX Event Viewer (EV): ULINK2, ULINKpro and J-Link: Not OpenSDA.
1. If you are using a ULINKpro, skip this step unless you want to see SWV overload.: Stop the program. Click on
Setup... in the Logic Analyzer. Select Kill All to remove all variables and select Close. This is necessary because
the SWO pin will likely be overloaded when the Event Viewer is opened up. Inaccuracies might/will occur.
2. Select Debug/Debug Settings.
3. Click on the Trace tab.
4. Enable ITM Stimulus Port 31.
Event Viewer uses this port to
collect its information.
5. Click OK.
6. Click on RUN .
7. Open Debug/OS Support and
select Event Viewer. The
window here opens up:
TIP: If Event Viewer is still blank, exit
and re-enter Debug mode.
Main Thread:
1. Select Stop in the Update Screen. Scroll to the beginning of the Event Viewer.
2. The first thread in this program was main() as depicted in the Event Viewer. The main thread is the main() function
in DirtyFilter.c It runs some RTX initialization code at the beginning and is stopped with osDelay(osWaitForever);.
TIP: If Event Viewer is blank or erratic, or the LA variables are not displaying or
blank: this is likely because the Serial Wire Output pin is overloaded and dropping trace
frames. Solutions are to delete some or all of the variables in the Logic Analyzer to free
up some SWO or Trace Port bandwidth. Try turning off the exceptions with EXTRC.
3. The 5 running threads plus the idle daemon are displayed on the Y axis. Event
Viewer shows which thread is running, when and for how long.
4. Click Stop in the Update Screen box.
5. Click on Zoom In so three or four threads are displayed as shown here:
6. Select Cursor. Position the cursor over one set of bars and click once. A red
line is set here:
7. Move your cursor to the next set and total time and difference are displayed.
8. Since you enabled Show Cycles, the total cycles and difference is also shown.
The 1 msec shown is the SysTick timer value which is set in RTX_Conf_CM.c in the
OS_CLOCK and OS_TICK variables.
5) Using a Keil ULINKpro and EV to view Interrupt Handler execution times:
SWV Throughput: ULINKpro is much better with SWO bandwidth issues. It has been able to display both the EV and LA
windows. The ULINKpro ETM and ULINKpro UART modes are preconfigured Options for Target.
ULINKpro can also use the 4 bit Trace Port for even faster operation for SWV. Trace Port use is mandatory for ETM trace.
A ULINKpro in ETM mode provides program flow debugging, Code Coverage and Performance Analysis. ULINKpro also
supports ETB (Embedded Trace Buffer) as found in many Kinetis processors.
Exceptions: A ULINKpro displays
exceptions at the bottom of the Event
Viewer. Shown here are the SysTick and
SVCall exceptions. You can easily
measure the duration of the time spent in
the handlers. Any other exception events
such as DMA will also be displayed here.
You will be able to easily measure the time a handler runs with the Event Viewer techniques you have learned.

Copyright © 2016 ARM Ltd. ARM Limited or its affiliates. All rights reserved.
NXP Kinetis Cortex-M4 Lab with ARM® Keil™ MDK toolkit www.keil.com/NXP
26
6) Serial Wire Viewer and ETM Trace Summary:
We have several debug systems implemented in Kinetis Cortex-M4 devices:
1. SWV and ITM data output on the SWO pin located on the JTAG/SWD 10 pin CoreSight debug connector. The 20
pin connector adds ETM trace. This is available on the TWR-K64F board.
2. ITM is a printf type viewer. ASCII characters are displayed in the Debug printf Viewer in µVision.
3. Non-intrusive Memory Reads and Writes in/out the JTAG/SWD ports (DAP).
4. Breakpoints and Watchpoints are set/unset through the JTAG/SWD ports.
5. ETM provides a record of all instructions executed. ETM also provides Code Coverage and Performance Analysis.
These features are completely controlled through µVision via a ULINK.
What kind of data can the Serial Wire Viewer display ?
1. Global variables.
2. Static variables.
3. Structures.
4. Can see Peripheral registers – just read or write to them. The same is true for memory locations.
5. Can see executed instructions. SWV only samples them. Use ETM to capture all instructions executed.
6. CPU counters. Folded instructions, extra cycles and interrupt overhead.
What Kind of Data the Serial Wire Viewer can’t display…
1. Can’t see local variables. (just make them global or static).
2. Can’t see register operations. PC Samples records some of the instructions but not the data values.
3. SWV can’t see DMA transfers. This is because by definition these transfers bypass the CPU. SWV and ETM can
only see CPU actions. If using a ULINKpro and RTX, DMA exceptions will display in the Event Viewer.
Types of problems that can be found with a quality ETM trace:
SWV Trace adds significant power to debugging efforts. Problems which may take hours, days or even weeks in big projects
can often be found in a fraction of these times with a trace. Especially useful is where the bug occurs a long time before the
consequences are seen or where the state of the system disappears with a change in scope(s) or RTOS thread switches.
Usually, these techniques allow finding bugs without stopping the program. These are the types of problems that can be
found with a quality trace: Some of these items need ETM trace.
1) Pointer problems.
2) Illegal instructions and data aborts (such as misaligned writes). How I did I get to this Fault vector ?
3) Code overwrites – writes to Flash, unexpected writes to peripheral registers (SFRs). How did I get here ?
4) A corrupted stack.
5) Out of bounds data. Uninitialized variables and arrays.
6) Stack overflows. What causes the stack to grow bigger than it should ?
7) Runaway programs: your program has gone off into the weeds and you need to know what instruction caused this.
This is probably the most important use of trace.
8) Communication protocol and timing issues. System timing problems.
9) Trace adds significant power to debugging efforts. Tells you where the program has been.
10) Weeks or months can be replaced by minutes.
11) Especially where the bug occurs a long time before any consequences are seen.
12) Or where the state of the system disappears with a change in scope(s).
13) Plus - don’t have to stop the program to test conditions. Crucial to some applications.
14) A recorded history of the program execution in the order it happened. Source and Disassembly is as it was written.
15) Trace can often find nasty problems very quickly.
16) Profile Analysis and Code Coverage is provided. Available only with ETM trace.
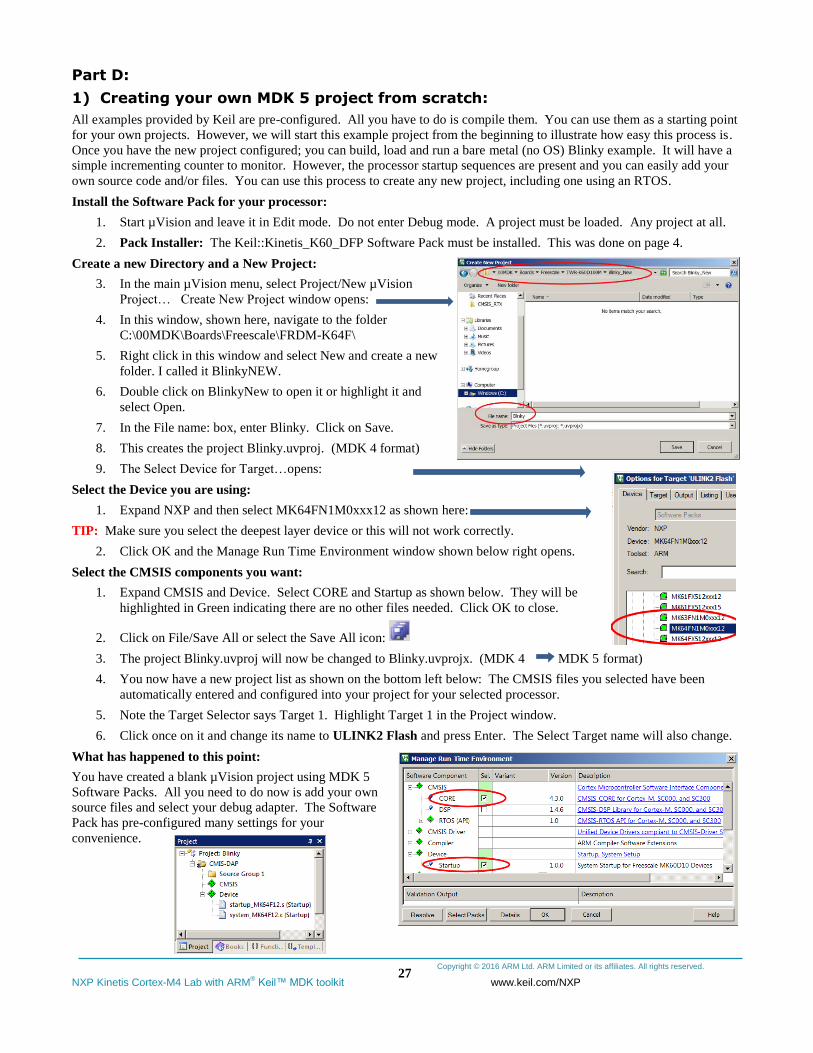
Copyright © 2016 ARM Ltd. ARM Limited or its affiliates. All rights reserved.
NXP Kinetis Cortex-M4 Lab with ARM® Keil™ MDK toolkit www.keil.com/NXP
27
Part D:
1) Creating your own MDK 5 project from scratch:
All examples provided by Keil are pre-configured. All you have to do is compile them. You can use them as a starting point
for your own projects. However, we will start this example project from the beginning to illustrate how easy this process is.
Once you have the new project configured; you can build, load and run a bare metal (no OS) Blinky example. It will have a
simple incrementing counter to monitor. However, the processor startup sequences are present and you can easily add your
own source code and/or files. You can use this process to create any new project, including one using an RTOS.
Install the Software Pack for your processor:
1. Start µVision and leave it in Edit mode. Do not enter Debug mode. A project must be loaded. Any project at all.
2. Pack Installer: The Keil::Kinetis_K60_DFP Software Pack must be installed. This was done on page 4.
Create a new Directory and a New Project:
3. In the main µVision menu, select Project/New µVision
Project… Create New Project window opens:
4. In this window, shown here, navigate to the folder
C:\00MDK\Boards\Freescale\FRDM-K64F\
5. Right click in this window and select New and create a new
folder. I called it BlinkyNEW.
6. Double click on BlinkyNew to open it or highlight it and
select Open.
7. In the File name: box, enter Blinky. Click on Save.
8. This creates the project Blinky.uvproj. (MDK 4 format)
9. The Select Device for Target…opens:
Select the Device you are using:
1. Expand NXP and then select MK64FN1M0xxx12 as shown here:
TIP: Make sure you select the deepest layer device or this will not work correctly.
2. Click OK and the Manage Run Time Environment window shown below right opens.
Select the CMSIS components you want:
1. Expand CMSIS and Device. Select CORE and Startup as shown below. They will be
highlighted in Green indicating there are no other files needed. Click OK to close.
2. Click on File/Save All or select the Save All icon:
3. The project Blinky.uvproj will now be changed to Blinky.uvprojx. (MDK 4 MDK 5 format)
4. You now have a new project list as shown on the bottom left below: The CMSIS files you selected have been
automatically entered and configured into your project for your selected processor.
5. Note the Target Selector says Target 1. Highlight Target 1 in the Project window.
6. Click once on it and change its name to ULINK2 Flash and press Enter. The Select Target name will also change.
What has happened to this point:
You have created a blank µVision project using MDK 5
Software Packs. All you need to do now is add your own
source files and select your debug adapter. The Software
Pack has pre-configured many settings for your
convenience.
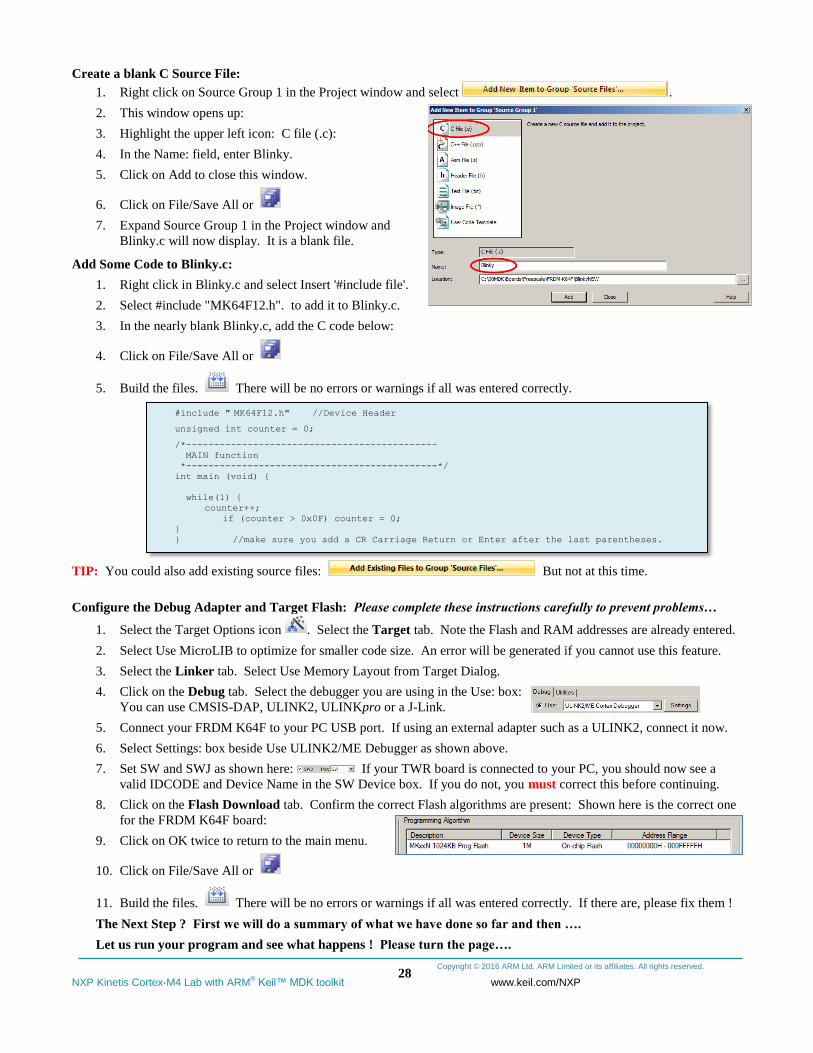
Copyright © 2016 ARM Ltd. ARM Limited or its affiliates. All rights reserved.
NXP Kinetis Cortex-M4 Lab with ARM® Keil™ MDK toolkit www.keil.com/NXP
28
Create a blank C Source File:
1. Right click on Source Group 1 in the Project window and select .
2. This window opens up:
3. Highlight the upper left icon: C file (.c):
4. In the Name: field, enter Blinky.
5. Click on Add to close this window.
6. Click on File/Save All or
7. Expand Source Group 1 in the Project window and
Blinky.c will now display. It is a blank file.
Add Some Code to Blinky.c:
1. Right click in Blinky.c and select Insert '#include file'.
2. Select #include "MK64F12.h". to add it to Blinky.c.
3. In the nearly blank Blinky.c, add the C code below:
4. Click on File/Save All or
5. Build the files. There will be no errors or warnings if all was entered correctly.
TIP: You could also add existing source files: But not at this time.
Configure the Debug Adapter and Target Flash: Please complete these instructions carefully to prevent problems…
1. Select the Target Options icon . Select the Target tab. Note the Flash and RAM addresses are already entered.
2. Select Use MicroLIB to optimize for smaller code size. An error will be generated if you cannot use this feature.
3. Select the Linker tab. Select Use Memory Layout from Target Dialog.
4. Click on the Debug tab. Select the debugger you are using in the Use: box:
You can use CMSIS-DAP, ULINK2, ULINKpro or a J-Link.
5. Connect your FRDM K64F to your PC USB port. If using an external adapter such as a ULINK2, connect it now.
6. Select Settings: box beside Use ULINK2/ME Debugger as shown above.
7. Set SW and SWJ as shown here: If your TWR board is connected to your PC, you should now see a
valid IDCODE and Device Name in the SW Device box. If you do not, you must correct this before continuing.
8. Click on the Flash Download tab. Confirm the correct Flash algorithms are present: Shown here is the correct one
for the FRDM K64F board:
9. Click on OK twice to return to the main menu.
10. Click on File/Save All or
11. Build the files. There will be no errors or warnings if all was entered correctly. If there are, please fix them !
The Next Step ? First we will do a summary of what we have done so far and then ….
Let us run your program and see what happens ! Please turn the page….
#include " MK64F12.h" //Device Header
unsigned int counter = 0;
/*---------------------------------------------
MAIN function
*---------------------------------------------*/
int main (void) {
while(1) {
counter++;
if (counter > 0x0F) counter = 0;
}
} //make sure you add a CR Carriage Return or Enter after the last parentheses.
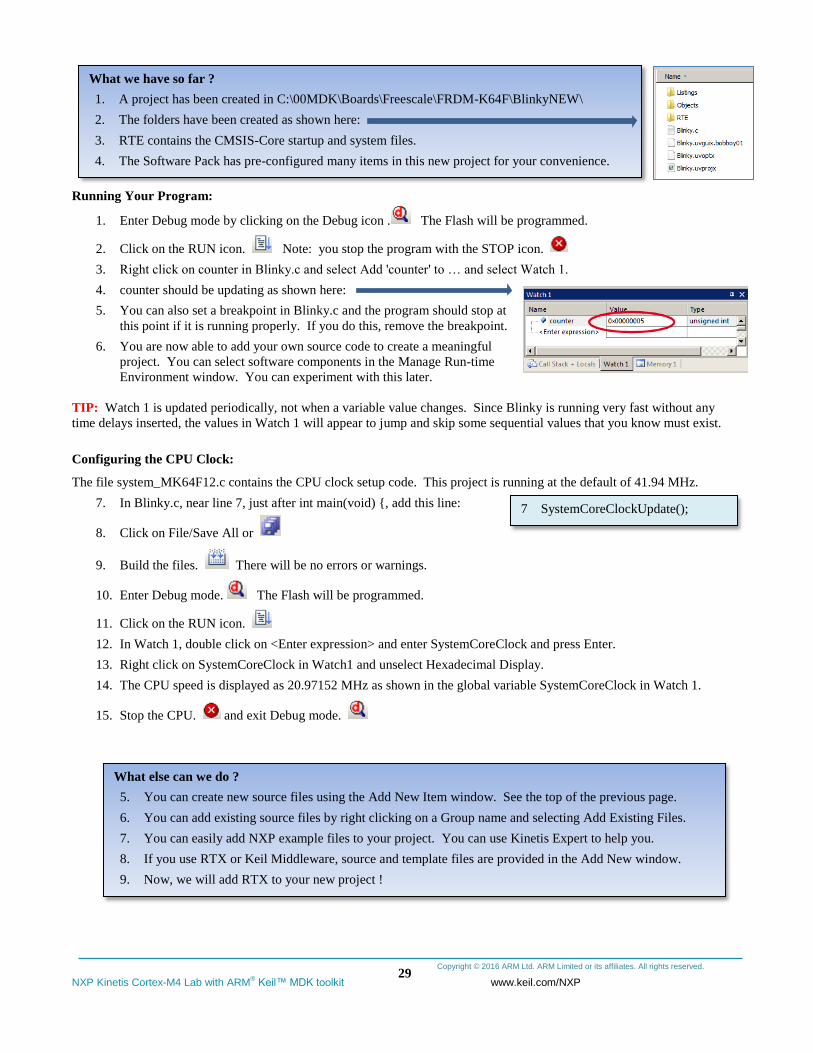
Copyright © 2016 ARM Ltd. ARM Limited or its affiliates. All rights reserved.
NXP Kinetis Cortex-M4 Lab with ARM® Keil™ MDK toolkit www.keil.com/NXP
29
Running Your Program:
1. Enter Debug mode by clicking on the Debug icon . The Flash will be programmed.
2. Click on the RUN icon. Note: you stop the program with the STOP icon.
3. Right click on counter in Blinky.c and select Add 'counter' to … and select Watch 1.
4. counter should be updating as shown here:
5. You can also set a breakpoint in Blinky.c and the program should stop at
this point if it is running properly. If you do this, remove the breakpoint.
6. You are now able to add your own source code to create a meaningful
project. You can select software components in the Manage Run-time
Environment window. You can experiment with this later.
TIP: Watch 1 is updated periodically, not when a variable value changes. Since Blinky is running very fast without any
time delays inserted, the values in Watch 1 will appear to jump and skip some sequential values that you know must exist.
Configuring the CPU Clock:
The file system_MK64F12.c contains the CPU clock setup code. This project is running at the default of 41.94 MHz.
7. In Blinky.c, near line 7, just after int main(void) {, add this line:
8. Click on File/Save All or
9. Build the files. There will be no errors or warnings.
10. Enter Debug mode. The Flash will be programmed.
11. Click on the RUN icon.
12. In Watch 1, double click on <Enter expression> and enter SystemCoreClock and press Enter.
13. Right click on SystemCoreClock in Watch1 and unselect Hexadecimal Display.
14. The CPU speed is displayed as 20.97152 MHz as shown in the global variable SystemCoreClock in Watch 1.
15. Stop the CPU. and exit Debug mode.
What we have so far ?
1. A project has been created in C:\00MDK\Boards\Freescale\FRDM-K64F\BlinkyNEW\
2. The folders have been created as shown here:
3. RTE contains the CMSIS-Core startup and system files.
4. The Software Pack has pre-configured many items in this new project for your convenience.
7 SystemCoreClockUpdate();
What else can we do ?
5. You can create new source files using the Add New Item window. See the top of the previous page.
6. You can add existing source files by right clicking on a Group name and selecting Add Existing Files.
7. You can easily add NXP example files to your project. You can use Kinetis Expert to help you.
8. If you use RTX or Keil Middleware, source and template files are provided in the Add New window.
9. Now, we will add RTX to your new project !
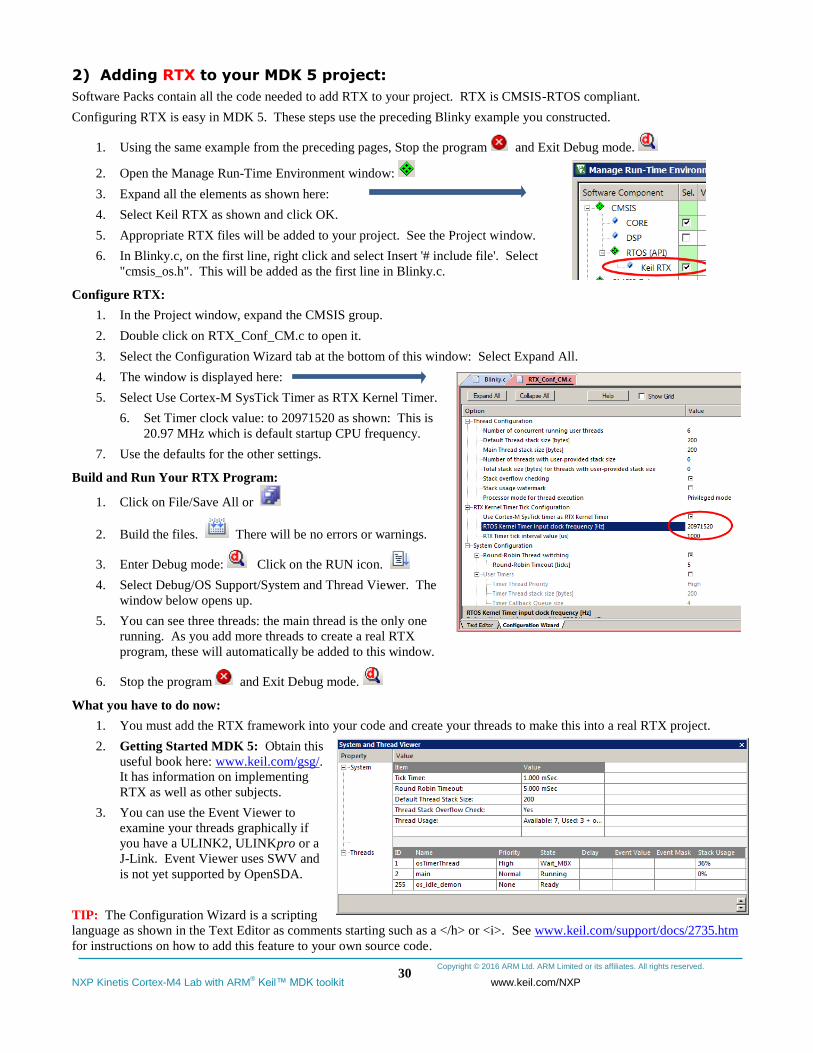
Copyright © 2016 ARM Ltd. ARM Limited or its affiliates. All rights reserved.
NXP Kinetis Cortex-M4 Lab with ARM® Keil™ MDK toolkit www.keil.com/NXP
30
2) Adding RTX to your MDK 5 project:
Software Packs contain all the code needed to add RTX to your project. RTX is CMSIS-RTOS compliant.
Configuring RTX is easy in MDK 5. These steps use the preceding Blinky example you constructed.
1. Using the same example from the preceding pages, Stop the program and Exit Debug mode.
2. Open the Manage Run-Time Environment window:
3. Expand all the elements as shown here:
4. Select Keil RTX as shown and click OK.
5. Appropriate RTX files will be added to your project. See the Project window.
6. In Blinky.c, on the first line, right click and select Insert '# include file'. Select
"cmsis_os.h". This will be added as the first line in Blinky.c.
Configure RTX:
1. In the Project window, expand the CMSIS group.
2. Double click on RTX_Conf_CM.c to open it.
3. Select the Configuration Wizard tab at the bottom of this window: Select Expand All.
4. The window is displayed here:
5. Select Use Cortex-M SysTick Timer as RTX Kernel Timer.
6. Set Timer clock value: to 20971520 as shown: This is
20.97 MHz which is default startup CPU frequency.
7. Use the defaults for the other settings.
Build and Run Your RTX Program:
1. Click on File/Save All or
2. Build the files. There will be no errors or warnings.
3. Enter Debug mode: Click on the RUN icon.
4. Select Debug/OS Support/System and Thread Viewer. The
window below opens up.
5. You can see three threads: the main thread is the only one
running. As you add more threads to create a real RTX
program, these will automatically be added to this window.
6. Stop the program and Exit Debug mode.
What you have to do now:
1. You must add the RTX framework into your code and create your threads to make this into a real RTX project.
2. Getting Started MDK 5: Obtain this
useful book here: www.keil.com/gsg/.
It has information on implementing
RTX as well as other subjects.
3. You can use the Event Viewer to
examine your threads graphically if
you have a ULINK2, ULINKpro or a
J-Link. Event Viewer uses SWV and
is not yet supported by OpenSDA.
TIP: The Configuration Wizard is a scripting
language as shown in the Text Editor as comments starting such as a </h> or <i>. See www.keil.com/support/docs/2735.htm
for instructions on how to add this feature to your own source code.
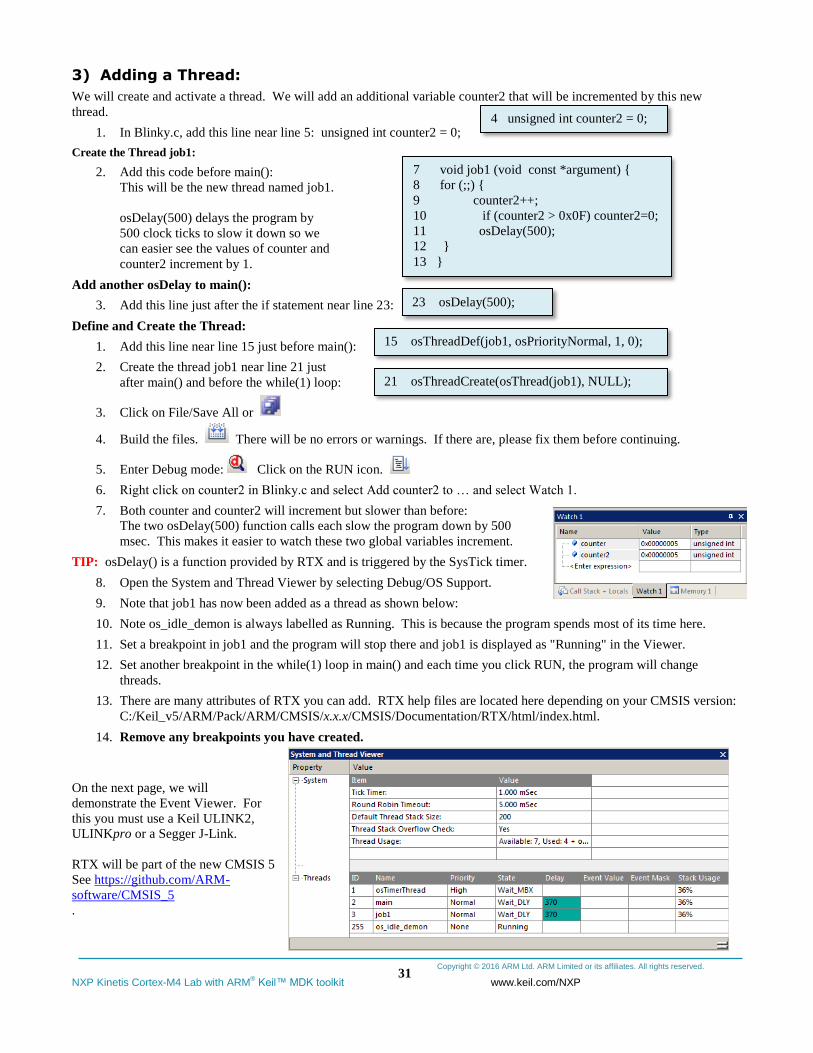
Copyright © 2016 ARM Ltd. ARM Limited or its affiliates. All rights reserved.
NXP Kinetis Cortex-M4 Lab with ARM® Keil™ MDK toolkit www.keil.com/NXP
31
3) Adding a Thread:
We will create and activate a thread. We will add an additional variable counter2 that will be incremented by this new
thread.
1. In Blinky.c, add this line near line 5: unsigned int counter2 = 0;
Create the Thread job1:
2. Add this code before main():
This will be the new thread named job1.
osDelay(500) delays the program by
500 clock ticks to slow it down so we
can easier see the values of counter and
counter2 increment by 1.
Add another osDelay to main():
3. Add this line just after the if statement near line 23:
Define and Create the Thread:
1. Add this line near line 15 just before main():
2. Create the thread job1 near line 21 just
after main() and before the while(1) loop:
3. Click on File/Save All or
4. Build the files. There will be no errors or warnings. If there are, please fix them before continuing.
5. Enter Debug mode: Click on the RUN icon.
6. Right click on counter2 in Blinky.c and select Add counter2 to … and select Watch 1.
7. Both counter and counter2 will increment but slower than before:
The two osDelay(500) function calls each slow the program down by 500
msec. This makes it easier to watch these two global variables increment.
TIP: osDelay() is a function provided by RTX and is triggered by the SysTick timer.
8. Open the System and Thread Viewer by selecting Debug/OS Support.
9. Note that job1 has now been added as a thread as shown below:
10. Note os_idle_demon is always labelled as Running. This is because the program spends most of its time here.
11. Set a breakpoint in job1 and the program will stop there and job1 is displayed as "Running" in the Viewer.
12. Set another breakpoint in the while(1) loop in main() and each time you click RUN, the program will change
threads.
13. There are many attributes of RTX you can add. RTX help files are located here depending on your CMSIS version:
C:/Keil_v5/ARM/Pack/ARM/CMSIS/x.x.x/CMSIS/Documentation/RTX/html/index.html.
14. Remove any breakpoints you have created.
On the next page, we will
demonstrate the Event Viewer. For
this you must use a Keil ULINK2,
ULINKpro or a Segger J-Link.
RTX will be part of the new CMSIS 5
See https://github.com/ARM-
software/CMSIS_5
.
4 unsigned int counter2 = 0;
7 void job1 (void const *argument) {
8 for (;;) {
9 counter2++;
10 if (counter2 > 0x0F) counter2=0;
11 osDelay(500);
12 }
13 }
15 osThreadDef(job1, osPriorityNormal, 1, 0);
21 osThreadCreate(osThread(job1), NULL);
23 osDelay(500);
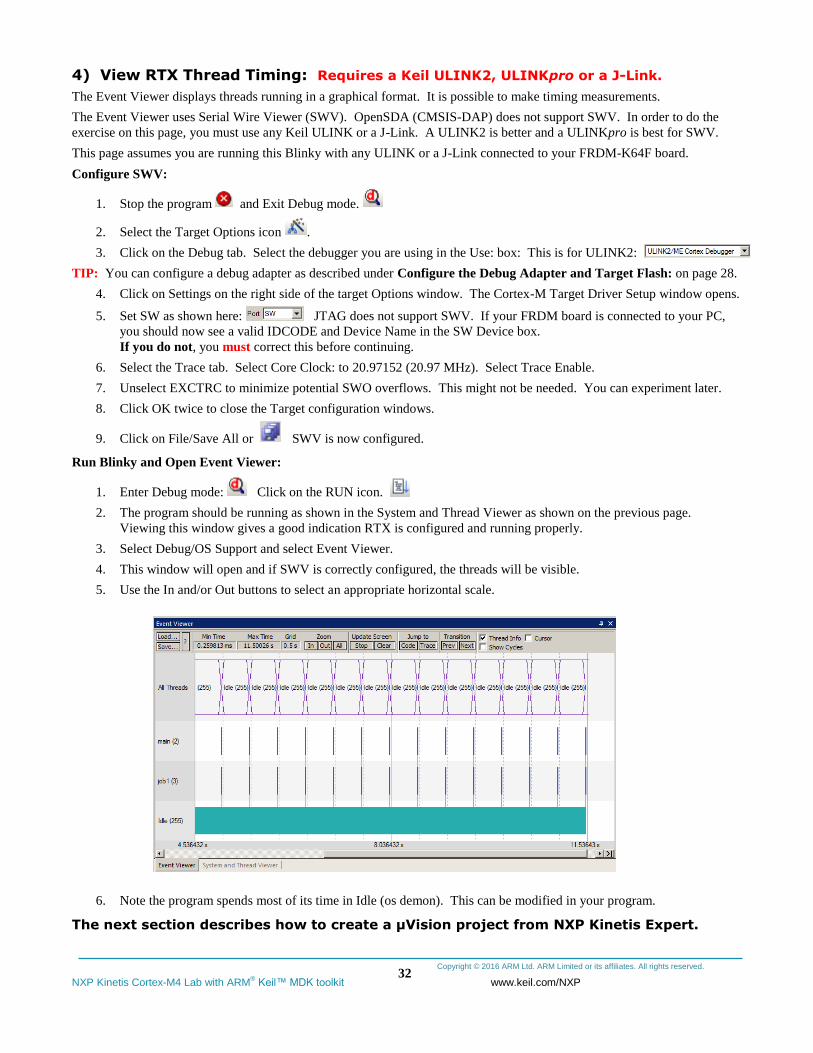
Copyright © 2016 ARM Ltd. ARM Limited or its affiliates. All rights reserved.
NXP Kinetis Cortex-M4 Lab with ARM® Keil™ MDK toolkit www.keil.com/NXP
32
4) View RTX Thread Timing: Requires a Keil ULINK2, ULINKpro or a J-Link.
The Event Viewer displays threads running in a graphical format. It is possible to make timing measurements.
The Event Viewer uses Serial Wire Viewer (SWV). OpenSDA (CMSIS-DAP) does not support SWV. In order to do the
exercise on this page, you must use any Keil ULINK or a J-Link. A ULINK2 is better and a ULINKpro is best for SWV.
This page assumes you are running this Blinky with any ULINK or a J-Link connected to your FRDM-K64F board.
Configure SWV:
1. Stop the program and Exit Debug mode.
2. Select the Target Options icon .
3. Click on the Debug tab. Select the debugger you are using in the Use: box: This is for ULINK2:
TIP: You can configure a debug adapter as described under Configure the Debug Adapter and Target Flash: on page 28.
4. Click on Settings on the right side of the target Options window. The Cortex-M Target Driver Setup window opens.
5. Set SW as shown here: JTAG does not support SWV. If your FRDM board is connected to your PC,
you should now see a valid IDCODE and Device Name in the SW Device box.
If you do not, you must correct this before continuing.
6. Select the Trace tab. Select Core Clock: to 20.97152 (20.97 MHz). Select Trace Enable.
7. Unselect EXCTRC to minimize potential SWO overflows. This might not be needed. You can experiment later.
8. Click OK twice to close the Target configuration windows.
9. Click on File/Save All or SWV is now configured.
Run Blinky and Open Event Viewer:
1. Enter Debug mode: Click on the RUN icon.
2. The program should be running as shown in the System and Thread Viewer as shown on the previous page.
Viewing this window gives a good indication RTX is configured and running properly.
3. Select Debug/OS Support and select Event Viewer.
4. This window will open and if SWV is correctly configured, the threads will be visible.
5. Use the In and/or Out buttons to select an appropriate horizontal scale.
6. Note the program spends most of its time in Idle (os demon). This can be modified in your program.
The next section describes how to create a µVision project from NXP Kinetis Expert.
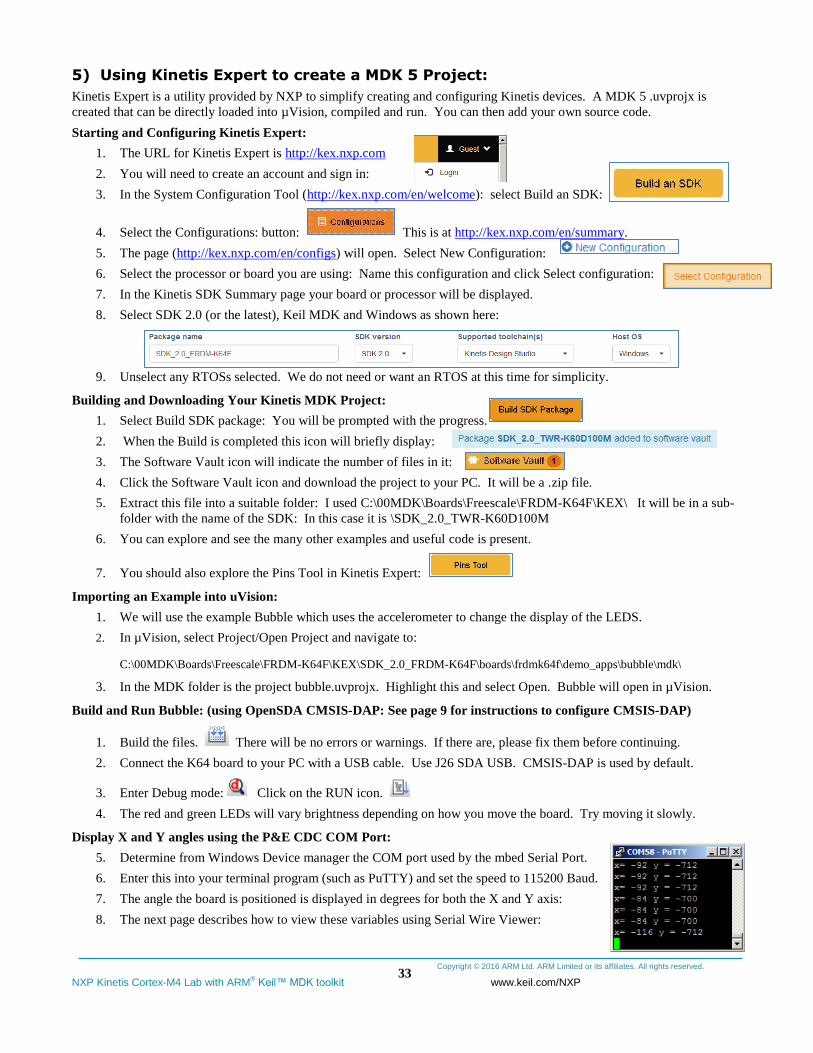
Copyright © 2016 ARM Ltd. ARM Limited or its affiliates. All rights reserved.
NXP Kinetis Cortex-M4 Lab with ARM® Keil™ MDK toolkit www.keil.com/NXP
33
5) Using Kinetis Expert to create a MDK 5 Project:
Kinetis Expert is a utility provided by NXP to simplify creating and configuring Kinetis devices. A MDK 5 .uvprojx is
created that can be directly loaded into µVision, compiled and run. You can then add your own source code.
Starting and Configuring Kinetis Expert:
1. The URL for Kinetis Expert is http://kex.nxp.com
2. You will need to create an account and sign in:
3. In the System Configuration Tool (http://kex.nxp.com/en/welcome): select Build an SDK:
4. Select the Configurations: button: This is at http://kex.nxp.com/en/summary.
5. The page (http://kex.nxp.com/en/configs) will open. Select New Configuration:
6. Select the processor or board you are using: Name this configuration and click Select configuration:
7. In the Kinetis SDK Summary page your board or processor will be displayed.
8. Select SDK 2.0 (or the latest), Keil MDK and Windows as shown here:
9. Unselect any RTOSs selected. We do not need or want an RTOS at this time for simplicity.
Building and Downloading Your Kinetis MDK Project:
1. Select Build SDK package: You will be prompted with the progress.
2. When the Build is completed this icon will briefly display:
3. The Software Vault icon will indicate the number of files in it:
4. Click the Software Vault icon and download the project to your PC. It will be a .zip file.
5. Extract this file into a suitable folder: I used C:\00MDK\Boards\Freescale\FRDM-K64F\KEX\ It will be in a sub-
folder with the name of the SDK: In this case it is \SDK_2.0_TWR-K60D100M
6. You can explore and see the many other examples and useful code is present.
7. You should also explore the Pins Tool in Kinetis Expert:
Importing an Example into uVision:
1. We will use the example Bubble which uses the accelerometer to change the display of the LEDS.
2. In µVision, select Project/Open Project and navigate to:
C:\00MDK\Boards\Freescale\FRDM-K64F\KEX\SDK_2.0_FRDM-K64F\boards\frdmk64f\demo_apps\bubble\mdk\
3. In the MDK folder is the project bubble.uvprojx. Highlight this and select Open. Bubble will open in µVision.
Build and Run Bubble: (using OpenSDA CMSIS-DAP: See page 9 for instructions to configure CMSIS-DAP)
1. Build the files. There will be no errors or warnings. If there are, please fix them before continuing.
2. Connect the K64 board to your PC with a USB cable. Use J26 SDA USB. CMSIS-DAP is used by default.
3. Enter Debug mode: Click on the RUN icon.
4. The red and green LEDs will vary brightness depending on how you move the board. Try moving it slowly.
Display X and Y angles using the P&E CDC COM Port:
5. Determine from Windows Device manager the COM port used by the mbed Serial Port.
6. Enter this into your terminal program (such as PuTTY) and set the speed to 115200 Baud.
7. The angle the board is positioned is displayed in degrees for both the X and Y axis:
8. The next page describes how to view these variables using Serial Wire Viewer:
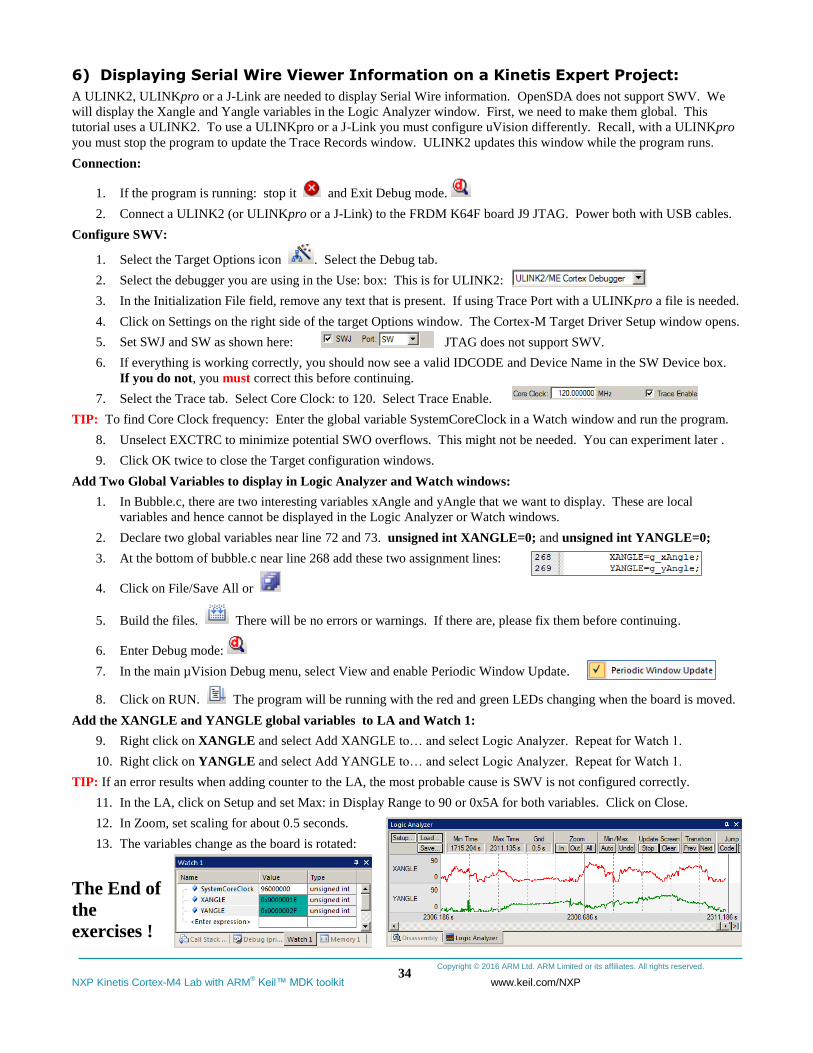
Copyright © 2016 ARM Ltd. ARM Limited or its affiliates. All rights reserved.
NXP Kinetis Cortex-M4 Lab with ARM® Keil™ MDK toolkit www.keil.com/NXP
34
6) Displaying Serial Wire Viewer Information on a Kinetis Expert Project:
A ULINK2, ULINKpro or a J-Link are needed to display Serial Wire information. OpenSDA does not support SWV. We
will display the Xangle and Yangle variables in the Logic Analyzer window. First, we need to make them global. This
tutorial uses a ULINK2. To use a ULINKpro or a J-Link you must configure uVision differently. Recall, with a ULINKpro
you must stop the program to update the Trace Records window. ULINK2 updates this window while the program runs.
Connection:
1. If the program is running: stop it and Exit Debug mode.
2. Connect a ULINK2 (or ULINKpro or a J-Link) to the FRDM K64F board J9 JTAG. Power both with USB cables.
Configure SWV:
1. Select the Target Options icon . Select the Debug tab.
2. Select the debugger you are using in the Use: box: This is for ULINK2:
3. In the Initialization File field, remove any text that is present. If using Trace Port with a ULINKpro a file is needed.
4. Click on Settings on the right side of the target Options window. The Cortex-M Target Driver Setup window opens.
5. Set SWJ and SW as shown here: JTAG does not support SWV.
6. If everything is working correctly, you should now see a valid IDCODE and Device Name in the SW Device box.
If you do not, you must correct this before continuing.
7. Select the Trace tab. Select Core Clock: to 120. Select Trace Enable.
TIP: To find Core Clock frequency: Enter the global variable SystemCoreClock in a Watch window and run the program.
8. Unselect EXCTRC to minimize potential SWO overflows. This might not be needed. You can experiment later .
9. Click OK twice to close the Target configuration windows.
Add Two Global Variables to display in Logic Analyzer and Watch windows:
1. In Bubble.c, there are two interesting variables xAngle and yAngle that we want to display. These are local
variables and hence cannot be displayed in the Logic Analyzer or Watch windows.
2. Declare two global variables near line 72 and 73. unsigned int XANGLE=0; and unsigned int YANGLE=0;
3. At the bottom of bubble.c near line 268 add these two assignment lines:
4. Click on File/Save All or
5. Build the files. There will be no errors or warnings. If there are, please fix them before continuing.
6. Enter Debug mode:
7. In the main µVision Debug menu, select View and enable Periodic Window Update.
8. Click on RUN. The program will be running with the red and green LEDs changing when the board is moved.
Add the XANGLE and YANGLE global variables to LA and Watch 1:
9. Right click on XANGLE and select Add XANGLE to… and select Logic Analyzer. Repeat for Watch 1.
10. Right click on YANGLE and select Add YANGLE to… and select Logic Analyzer. Repeat for Watch 1.
TIP: If an error results when adding counter to the LA, the most probable cause is SWV is not configured correctly.
11. In the LA, click on Setup and set Max: in Display Range to 90 or 0x5A for both variables. Click on Close.
12. In Zoom, set scaling for about 0.5 seconds.
13. The variables change as the board is rotated:
The End of
the
exercises !
Copyright © 2016 ARM Ltd. ARM Limited or its affiliates. All rights reserved.
NXP Kinetis Cortex-M4 Lab with ARM® Keil™ MDK toolkit www.keil.com/NXP
35
1) Document Resources: See www.keil.com/NXP
Books:
1. NEW! Getting Started with MDK 5: Obtain this free book here: www.keil.com/gsg/
2. There is a good selection of books available on ARM: www.arm.com/support/resources/arm-books/index.php
3. µVision contains a window titled Books. Many documents including data sheets are located there.
4. A list of resources is located at: www.arm.com/products/processors/cortex-m/index.php
Click on the Resources tab. Or select the Cortex-M processor you want in the Processor panel on the left.
5. Or search for the Cortex-M processor you want on www.arm.com.
6. The Definitive Guide to the ARM Cortex-M0/M0+ by Joseph Yiu. Search the web for retailers.
7. The Definitive Guide to the ARM Cortex-M3/M4 by Joseph Yiu. Search the web for retailers.
8. Embedded Systems: Introduction to Arm Cortex-M Microcontrollers (3 volumes) by Jonathan Valvano
9. MOOC: Massive Open Online Class: University of Texas: http://users.ece.utexas.edu/~valvano/
Application Notes:
10. NEW! ARM Compiler Qualification Kit: Compiler Safety Certification: www.keil.com/safety
11. Using Cortex-M3 and Cortex-M4 Fault Exceptions www.keil.com/appnotes/files/apnt209.pdf
12. CAN Primer: www.keil.com/appnotes/files/apnt_247.pdf
13. Segger emWin GUIBuilder with µVision™ www.keil.com/appnotes/files/apnt_234.pdf
14. Porting mbed Project to Keil MDK™ 4 www.keil.com/appnotes/docs/apnt_207.asp
15. MDK-ARM™ Compiler Optimizations www.keil.com/appnotes/docs/apnt_202.asp
16. GNU tools (GCC) for use with µVision https://launchpad.net/gcc-arm-embedded
17. RTX CMSIS-RTOS Download https://github.com/ARM-software/CMSIS_5
18. Barrier Instructions http://infocenter.arm.com/help/topic/com.arm.doc.dai0321a/index.html
19. Lazy Stacking on the Cortex-M4: www.arm.com and search for DAI0298A
20. Cortex Debug Connectors: www.keil.com/coresight/coresight-connectors
21. Sending ITM printf to external Windows applications: www.keil.com/appnotes/docs/apnt_240.asp
22. FlexMemory configuration using MDK www.keil.com/appnotes/files/apnt220.pdf
23. Sending ITM printf to external Windows applications: www.keil.com/appnotes/docs/apnt_240.asp
24. NEW! Migrating Cortex-M3/M4 to Cortex-M7 processors: www.keil.com/appnotes/docs/apnt_270.asp
25. NEW! ARMv8-M Architecture Technical Overview https://community.arm.com/docs/DOC-10896
Useful ARM Websites:
1. NEW! CMSIS Standards: https://github.com/ARM-software/CMSIS_5 and www.keil.com/cmsis/
2. ARM and Keil Community Forums: www.keil.com/forum and http://community.arm.com/groups/tools/content
3. ARM University Program: www.arm.com/university. Email: [email protected]
4. mbed™: http://mbed.org
Sales In Americas: [email protected] or 800-348-8051. Europe/Asia: [email protected] +49 89/456040-20
Keil Distributors: See www.keil.com/distis/ DS-5 Direct Sales Worldwide: [email protected]
Keil Technical Support in USA: [email protected] or 800-348-8051. Outside the US: [email protected].
For comments, additions or corrections please email [email protected]

Copyright © 2016 ARM Ltd. ARM Limited or its affiliates. All rights reserved.
NXP Kinetis Cortex-M4 Lab with ARM® Keil™ MDK toolkit www.keil.com/NXP
36
2) Keil Products and contact information: See www.keil.com/NXP
Keil Microcontroller Development Kit (MDK-ARM™) for Kinetis processors:
MDK-Lite™ (Evaluation version) 32K Code and Data Limit - $0
New MDK-ARM-CM™ For all Cortex-M series processors – unlimited code limit
New MDK-Plus™ MiddleWare Level 1. ARM7™, ARM9™, Cortex-M, SecureCore®.
New MDK-Professional™ MiddleWare Level 2. For details: www.keil.com/mdk5/version520.
Keil Middleware includes Network, USB, Graphics and File System. www.keil.com/mdk5/middleware/
USB-JTAG/SWD Debug Adapter (for Flash programming too)
ULINK2 - (ULINK2 and ME - SWV only – no ETM)
ULINK-ME – sold only with a board by Keil or OEM: is equivalent to a ULINK2.
ULINKpro - Cortex-Mx SWV & ETM trace
ULINKpro D - Cortex-Mx SWV no ETM trace ULINKpro also works with ARM DS-5
You can use OS-JTAG on the Kinetis Tower board. For Serial Wire Viewer (SWV), a ULINK2, ULINK-ME or
a J-Link is needed. For ETM support, a ULINKpro is needed. OS-JTAG or OpenSDA do not support either
SWV or ETM debug technology.
Call Keil Sales for more details on current pricing. All products are available.
For the ARM University program: go to www.arm.com/university Email: [email protected]
All software products include Technical Support and Updates for 1 year. This can easily be renewed.
Keil RTX™ Real Time Operating System
RTX is provided free as part of Keil MDK. It is the full version of RTX – it is not restricted or crippled.
No royalties are required and is very easy to use. It has a BSD license.
RTX source code is included with all versions of MDK.
Kernel Awareness visibility windows are integral to µVision.
For the entire Keil catalog see www.keil.com or contact Keil or your
local distributor. For NXP support: www.keil.com/NXP
For Linux, Android, bare metal (no OS) and other OS support on NXP
i.MX and Vybrid series processors please see DS-5and DS-MDK at
www.arm.com/ds5/ and www.keil.com/ds-mdk.
For more information:
Sales In Americas: [email protected] or 800-348-8051. Europe/Asia: [email protected] +49 89/456040-20
Keil Technical Support in USA: [email protected] or 800-348-8051. Outside the US: [email protected].
For comments or corrections please email [email protected].
For more information: www.arm.com/cmsis, www.keil.com/forum and http://community.arm.com/groups/tools/content