Embed Size (px)
Citation preview
Freeze-Etching and Vapor Matrix Deposition for ToF-SIMS Imagingof Single Cells
Paul D. Piehowski,† Michael E. Kurczy,† David Willingham,† Shawn Parry,†
Michael L. Heien,† Nicholas Winograd,† and Andrew G. Ewing*,†,‡
Department of Chemistry, The PennsylVania State UniVersity, UniVersity Park, PennsylVania 16802, andDepartment of Chemistry, Goteborg UniVersity, KemiVagen 10, SE-41296 Goteborg, Sweden
ReceiVed January 28, 2008. ReVised Manuscript ReceiVed April 30, 2008
Freeze-etching, the practice of removing excess surface water from a sample through sublimation into the vacuumof the analysis environment, has been extensively used in conjunction with electron microscopy. Here, we apply thistechnique to time-of-flight secondary-ion mass spectrometry (ToF-SIMS) imaging of cryogenically preserved singlecells. By removing the excess water which condenses onto the sample in Vacuo, a uniform surface is produced thatis ideal for imaging by static SIMS. We demonstrate that the conditions employed to remove deposited water do notadversely affect cell morphology and do not redistribute molecules in the topmost surface layers. In addition, we foundwater can be controllably redeposited onto the sample at temperatures below -100 °C in vacuum. The redepositedwater increases the ionization of characteristic fragments of biologically interesting molecules 2-fold without loss ofspatial resolution. The utilization of freeze-etch methodology will increase the reliability of cryogenic sample preparationsfor SIMS analysis by providing greater control of the surface environment. Using these procedures, we have obtainedhigh quality spectra with both atomic bombardment as well as C60
+ cluster ion bombardment.
Introduction
The role of individual lipid components in membrane processesis a topic of considerable interest in cellular and molecularbiology.1–3 A variety of methods including atomic forcemicroscopy (AFM),4 NMR,5 near-field scanning optical mi-croscopy (NSOM),6 electron spin resonance (ESR),7 singleparticle tracking (SPT),8 and fluorescence microscopy have beenapplied to the study of membrane lipid heterogeneity.9 Indeed,much of what is known about role of individual lipid componentsin membrane processes has been obtained with fluorescencetechniques. Typically, synthetic fluorescent probes containingfatty acid-like chains are inserted into the membrane. Bymanipulating the structure of these chains, a preference for variouslipid domains is imparted, although the chemical specificity isoften restricted. In addition, these bulky fluorophores mightperturb the environment and alter intrinsic domain formationevents.4
Recently, imaging with time-of-flight secondary-ion massspectrometry (ToF-SIMS) has been shown to be a powerfulanalytical tool for mapping the distribution of biologically rele-vant small molecules (<1000 Da) on a surface.10 This methodcombines submicrometer spatial resolution, high chemical
specificity, and surface sensitivity, making it a promising toolfor the study of lipids in cellular membranes. Briefly, a pulsedbeam of primary ions is directed at the analysis surface, causingthe sputtering of ions and molecules. The ions are extracted intoa ToF mass analyzer generating a mass spectrum. To obtain animage, the primary beam is raster-scanned across the surface,recording a mass spectrum for each pixel. Masses of interest arethen selected from the spectrum, and their intensities are mappedacross the imaging area. When combined with cryogenic samplepreparation techniques, ToF-SIMS allows the detailed study ofmembrane lipids during dynamic processes such as membranefusion.11–13
The quality of the information obtained with this techniqueis dependent upon conservation of the morphological and chemicalintegrity of samples.14 However, utilization of ToF-SIMS requiresthat the biological samples be analyzed in a high vacuumenvironment. Toward this end, many approaches have been used,including freeze-fracture,13 freeze-drying,15–18 vitrification intrehalose,19 and imprinting on metal foil.20 We have previouslydeveloped a freeze-fracture protocol based on methods used inelectron microscopy. In this method, freezing of the sample isperformed in liquid ethane to quench the sample, capture dynamic
* To whom correspondence should be addressed. Email: [email protected].
† The Pennsylvania State University.‡ Goteborg University.(1) Simons, K.; Ikonen, E. Nature 1997, 387, 569–572.(2) Simons, K.; Toomre, D. Nat. ReV. 2000, 1, 31–41.(3) Huttner, W. B.; Zimmerberg, J. Curr. Opin. Cell Biol. 2001, 13, 478–484.(4) Burns, A. R. Langmuir 2003, 19(20), 8358–8363.(5) Veatch, S. L.; Polozov, I. V.; Gawrisch, K.; Keller, S. L. Biophys. J. 2004,
86(5), 2910–2922.(6) Burgos, P.; Yuan, C. B.; Viriot, M. L.; Johnston, L. J. Langmuir 2003,
19(19), 8002–8009.(7) Ge, M. T.; Gidwani, A.; Brown, H. A.; Holowka, D.; Baird, B.; Freed, J. H.
Biophys. J. 2003, 85(2), 1278–1288.(8) Ritchie, K.; Iino, R.; Fujiwara, T.; Murase, K.; Kusumi, A. Mol. Membr.
Biol. 2003, 20, 13–18.(9) Mukherjee, S.; Maxfield, F. R. Annu. ReV. Cell DeV. Biol. 2004, 20, 839–
866.(10) Johansson, B. Surf. Interface Anal. 2006, 38(11), 1401–1412.
(11) Roddy, T. P.; Donald, M.; Cannon, J.; Meserole, C. A.; Winograd, N.;Ewing, A. G. Anal. Chem. 2002, 74, 4011–4019.
(12) Roddy, T. P.; Donald, M.; Cannon, J.; Ostrowski, S. G.; Winograd, N.;Ewing, A. G. Anal. Chem. 2002, 74, 4020–4026.
(13) Cannon, D. M. J.; Pacholski, M. L.; Winograd, N.; Ewing, A. G. J. Am.Chem. Soc. 2000, 122, 603–610.
(14) Chandra, S.; Bernius, M. T.; Morrison, G. H. Anal. Chem. 1986, 58,493–496.
(15) McDonnell, L. A.; Piersma, S. R.; Altelaar, A. F. M.; Mize, T. H.;Luxembourg, S. L.; Verhaert, P. D. E. M.; Minnen, J. v.; Heeren, R. M. A. J.Mass Spectrom. 2005, 40, 160–168.
(16) Monroe, E. B.; Jurchen, J. C.; Lee, J.; Rubahkin, S. S.; Sweedler, J. V.J. Am. Chem. Soc. 2005,
(17) Peteranderl, R.; Lechene, C. J. Am. Soc. Mass Spectrom. 2004, 15, 478–485.
(18) Marxer, C. G.; Kraft, M. L.; Weber, P. K.; Hutcheon, I. D.; Boxer, S. G.Biophys. J. 2005, 88(4), 2965–2975.
(19) Parry, S.; Winograd, N. Anal. Chem. 2005, 77, 7950–7957.(20) Nygren, H.; Eriksson, C.; Malmberg, P.; Sahlin, H.; Carlsson, L.; Lausmaa,
J.; Sjovall, P. Colloids Surf., B 2003, 30, 87–92.
7906 Langmuir 2008, 24, 7906-7911
10.1021/la800292e CCC: $40.75 2008 American Chemical SocietyPublished on Web 06/21/2008
membrane processes, and protect the sample from watercrystallization damage. While this technique has the advantageof preserving membranes in their hydrated state, it also hasdisadvantages. When a fracture is performed, very precise controlover the vacuum environment is necessary to maintain areproducible surface amenable to SIMS analysis. Fracture-induceddamage of cells can also occur which may complicate interpreta-tion and degrade the quality of information obtained from SIMS.Lastly, the fracture plane is difficult to reproduce, making manysamples unusable as well as making comparison of cells indifferent populations difficult.
Another challenge facing SIMS imaging is low signal intensityfrom many biologically interesting molecules. Ionization ef-ficiency measurements of membrane lipids demonstrate that lessthan 0.01% of molecules desorbed by the primary ion beamimpact are ionized.21 Improving the ionization efficiency of thetarget molecules could greatly improve the SIMS signal.Significant increases in sputter yield have been achieved usingcluster ion sources for sample bombardment and have attractedthe attention of many in the SIMS community.22–24 Many groupshave been pursuing ways of improving signals through creativesample preparations, coating samples with thin metal films (metA-SIMS),25 deposition of matrix-assisted laser desorption ionization(MALDI)-type matrices (ME-SIMS),15,26–28 and the addition ofmetal nanoparticles.29,30
In this paper, a sample preparation technique is describedutilizing cryogenic sample preparation methods that not onlyimprove the reproducibility of biovacuum interfaces but alsoincrease ionization efficiency. The approach is illustrated usingoligodendrocytes and macrophages, and the key attributes of thesample treatment are examined using various lipid model systems.With this method, adventitious sources of surface water-ice, whichtend to block the emission of biomolecules, are removed bylow-temperature sublimation. Next, a controlled amount ofamorphous ice is redeposited back onto the sample surface. Thisstep yields significant signal enhancement when compared tofreeze-dried sample preparations and also produces a uniformsurface which does not have spatial resolution limited by matrixcrystallization.31
Experimental SectionCell Culture. Oligodendrocytes were harvested from 1 day old
Sprague-Dawley rat pups and separated from cerebral tissue aspreviously described.32 The cells were cultured on 5 mm × 5 mmsilicon shards (Ted Pella, Redding, CA) that were coated with 0.2mg/mL poly(L-lysine) (VWR, West Chester, PA) and 0.1 mg/mLcollagen (Sigma-Aldrich, St. Louis, MO). Cells were incubated untilmaturation was visible under a microscope.
J774 macrophage cells were cultured in sterile, polystyrene cellculture flasks. When confluent, the cells were treated with 25 µg/mL
DiI (Molecular Probes, Eugene OR) in serum-free media (Invitrogen,Carlsbad, CA) for 1 h. Following this treatment, the cells wererinsed with media before being dislodged from the culture dish bygentle tapping. The suspension of cells was added to a new flaskcontaining sterile 5 mm × 5 mm silicon shards.
Cell Preparation for Imaging. Shards containing maturingoligodendrocytes or macrophages were rinsed for 5 s in 18 MΩwater to remove contamination from excess media. To prevent cellrupture, they were quickly frozen in liquid ethane and stored underliquid nitrogen (LN2). The samples were introduced to the ultrahighvacuum (UHV) environment at LN2 temperatures. Details of thisprocess have been described elsewhere.13 Once under vacuum, thesample was warmed 5 °C/min to -80 °C to remove the water whileminimizing crystallization and redistribution of molecules by effluxof water from the surface. This process was monitored using a videocamera mounted on a brightfield microscope, to ensure that microscalesigns of crystallization did not occur. When the water was removed,the sample was quickly returned to liquid nitrogen temperatures.During the cooling process, some residual water in the vacuumenvironment was redeposited on the sample, producing a uniformlayer of water on top of the cells.
Preparation of Patterned Cholesterol Films. Physical vapordeposition (PVD) films were prepared by subliming cholesterolcontained in a crucible by resistive heating of a tungsten filamentfollowed by deposition onto a LN2-cooled sample stage. The filmthickness was monitored using a quartz crystal microbalance (QCM)and subsequently characterized using AFM. AFM images werecollected using a Nanopics 2100 instrument (KLA Tencor, San Jose,CA) by scanning a 200 µm field of view (FOV) in contact mode.
Preparation of Lipid Films. Lipids were dissolved in 9:1 CHCl3/MeOH solution at concentration of 1 mg/mL. Films were preparedby spin-coating 50 µL aliquots of lipid solution onto 5 mm2 siliconshards at a spin rate of 3000 rpm for 60 s. Dipalmitoylphosphati-dylcholine and dilauroylphosphatidylethanolamine were obtainedfrom Avanti Polar Lipids (Alabaster, AL), and cholesterol wasobtained from Sigma Aldrich (St. Louis, MO). All lipids were usedwithout further purification. Each lipid spectrum was taken from asampling area of 132 × 102 µm2 using 5 × 10⁵ primary ion pulses.For enhancement measurements, the integrated peak area for themass of interest was divided by the integrated peak area for theinternal standard fragment (m/z 69), yielding a relative intensity.
Mass Spectrometry. Imaging data using In+ primary ions wereacquired using a Kratos Prism ToF-SIMS spectrometer (Manchester,U.K.) equipped with an In+ liquid metal ion source (FEI, Beaverton,OR). The pulsed primary ion source was operated at an anode voltageof 15 kV angled at 45° to the sample. The beam was focused toapproximately 200 nm in diameter, and it delivered 1 nA of DCcurrent in 50 ns pulses. The sample was mounted onto a LN2-cooledanalysis stage (Kore Tech. Ltd., Cambridge, U.K.) biased at +2.5kV, 2.5 in. from a cold trap also cooled with LN2. An extraction lens,biased at -4.7 kV, collected the secondary ions which then traveledalong a 4.5 m flight path and were detected at a microchannel plate(MCP) detector (Galileo Co., Sturbridge, MA).
Imaging data using C60+ primary ions were acquired using a
BioToF ToF-SIMS spectrometer, described in detail elsewhere.33
The spectrometer was equipped with a 40 keV C60+ primary ion
source34–36 (Ionoptika Ltd., Southampton, U.K.). The source wasoperated with a 300 µm diameter beam defining aperture, yieldingapproximately 20 pA of DC current.
Mass spectrometry images were acquired by raster-scanning theprimary ion beam across the sample region and collecting a massspectrum for each pixel. Using in-house imaging software, VisualC++, molecule-specific images were created by selecting a mass
(21) Ostrowski, S. G.; Szakal, C.; Kozole, J.; Roddy, T. P.; Xu, J. Y.; Ewing,A. G.; Winograd, N. Anal. Chem. 2005, 77(19), 6190–6196.
(22) Winograd, N. Anal. Chem. 2005, 77, 143A–149A.(23) Xu, J.; Ostrowski, S.; Szakal, C.; Ewing, A. G.; Winograd, N. Appl. Surf.
Sci. 2004, 231(2), 159–163.(24) Toubol, D.; Kollmer, F.; Niehus, E.; Brunelle, A.; Laprevote, O. J. Am.
Soc. Mass Spectrom. 2005, 16, 1608–1618.(25) Altelaar, A. F. M.; Klinkert, I.; Jalink, K.; deLange, R. P. J.; Adan, R. A. H.;
Heeren, R. M. A.; Piersma, S. R. Anal. Chem. 2006, 78, 734–742.(26) Wu, K. J.; Odom, R. W. Anal. Chem. 1996, 68, 873–882.(27) Adriaensen, L.; Vangaever, F.; Lenaerts, J.; Gijbels, R. Rapid Commun.
Mass Spectrom. 2005, 19(8), 1017–1024.(28) Altelaar, A. F. M.; van Minnen, J.; Jimenez, C. R.; Heeren, R. M. A.;
Piersma, S. R. Anal. Chem. 2005, 77(3), 735–741.(29) Marcus, A.; Winograd, N. Anal. Chem. 2006, 78(1), 141–148.(30) Kim, Y.-P.; Oh, E.; Hong, M.-Y.; Lee, D.; Han, M.-k.; Shon, H. K.;
Moon, D. W.; Kim, H.-S.; Lee, T. G. Anal. Chem. 2006, 78, 1913–1920.(31) Luxembourg, S. L.; McDonnell, L. A.; Duursma, M. C.; Guo, X. H.;
Heeren, R. M. A. Anal. Chem. 2003, 75(10), 2333–2341.(32) McCarthy, K. D.; DE Vellis, J. J. Cycl. Nucleotide Res. 1978, 4, 15–26.
(33) Braun, R. M.; Blenkinsopp, P.; Mullock, S. J.; Corlett, C.; Willey, K. F.;Vickerman, J. C.; Winograd, N. Rapid Commun. Mass Spectrom. 1998, 12(18),1246.
(34) Wong, S. C. C.; Hill, R.; Blenkinsopp, P.; Lockyer, N. P.; Weibel, D. E.;Vickerman, J. C. Appl. Surf. Sci. 2003, 203, 219–222.
(35) Weibel, D.; Wong, S.; Lockyer, N.; Blenkinsopp, P.; Hill, R.; Vickerman,J. C. Anal. Chem. 2003, 75(7), 1754–1764.
(36) Fletcher, J. S.; Conlan, X. A.; Jones, E. A.; Biddulph, G.; Lockyer, N. P.;Vickerman, J. C. Anal. Chem. 2006, 78(6), 1827–1831.
Freeze-Etching, ToF-SIMS Imaging of Single Cells Langmuir, Vol. 24, No. 15, 2008 7907
peak of interest from the total ion mass spectrum and plotting theintensity of this mass at each pixel in the image. The intensity ofeach peak could then be displayed in false color, and multiple imageswere overlaid. Signal intensities can be relatively compared in massspecific images using the line scan function built into the software.A line scan is a plot of the summed pixel intensities for a givenchemical map as a function of the lateral distance of the line.
The instrument was also equipped with a channeltron detector(Burle, Lancaster, PA) positioned approximately 0.5 cm from thesample which was used to generate scanning ion micrographs (SIM).Scanning ion images were obtained by using the channeltron tomeasure the current of charged species and electrons emitted fromthe sample during direct current ion bombardment.
Results and Discussion
Single Cell Imaging. Analyzing the native morphology andmolecular distributions is crucial to determining the biologicalrole of individual molecules. Several cryogenic methods havebeen developed to achieve this difficult end.14,37 In the methodpresented here, the samples are plunge-frozen in ethane toeliminate sample damage due to water crystallization and thenstored under LN2 until analysis. A sample preparation and transferchamber designed in-house13 is utilized to fracture the samplesandwich and move the sample to the analysis stage withoutsignificant warming. With careful control of the temperature andpressure during this process, a clean fracture surface can begenerated. The limitations of this approach are that control overthe conditions can be difficult to maintain through the transferprocess and that the plane of fracture is unpredictable. This canresult in fractures through the center of a cell or through pureice, leaving the cell damaged or completely buried.
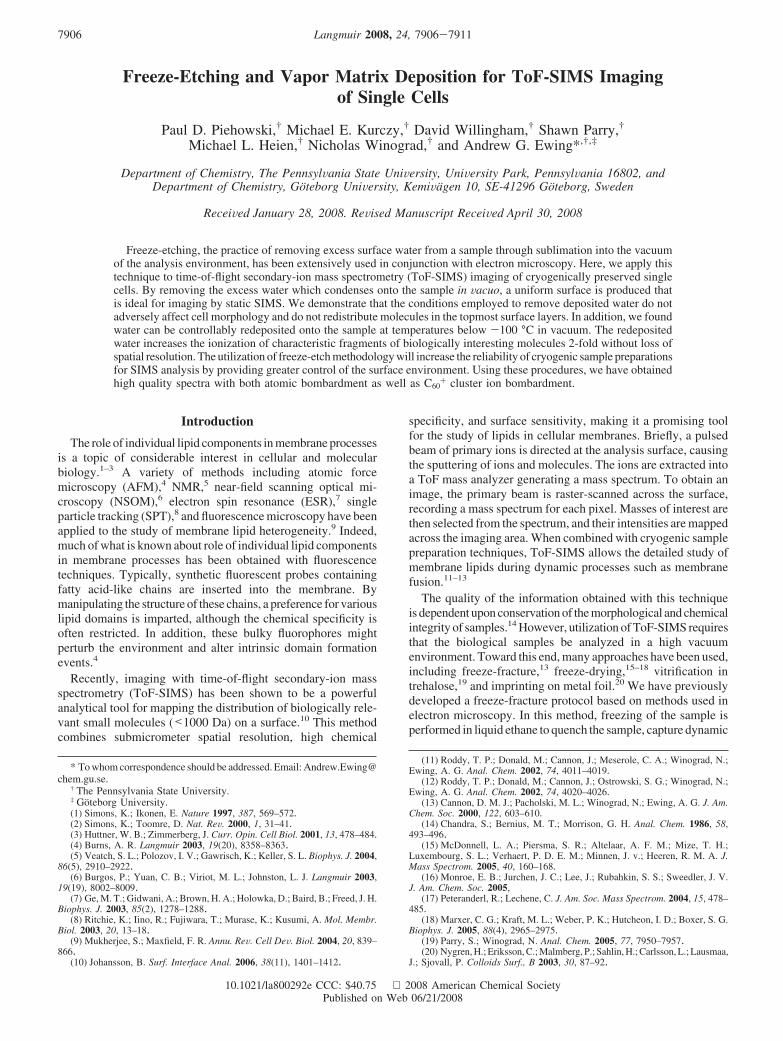
Previous attempts in our laboratory to remove excess surfacewater through sublimation have been unsuccessful. Warming offreeze-fractured liposomes results in images with lipid spreadhomogenously across the surface.13 It appears that large watersublimation fluxes can redistribute molecules across surfaces.We have found here that significant amounts of water can beremoved from the surface without the redistribution of lipids, byensuring that the sample temperature does not exceed -80 °Cbefore being returned to LN2 temperature. Images of cells thathave been prepared in this fashion are shown in Figure 1.
A mature oligodendrocyte in culture, exhibiting the charac-teristic, delicate cellular processes, is shown in Figure 1A. Abrightfield image of a similar oligodendrocyte in vacuum afterundergoing the freeze-etching process is shown in Figure 1B.The SIM image shown in Figure 1C of the same cell shown inpart B demonstrates that the cell maintains its morphology. ASIMS image overlay, where the green pixels represent m/z 184phosphatidylcholine (PC) and blue represents m/z 28 from theSi substrate, is shown in Figure 1D. From this image, we cansee that there is not a measurable redistribution of lipid moleculesfrom the cell to the adjacent surface, as previously seen whenwarming samples.13,38
To demonstrate the damage that occurs when warming is notcontrolled, Figure 1E and F show a cell that has been damagedby the warming process. The brightfield image in part E showsthat the delicate processes of the cell have been destroyed. Inaddition, the SIMS overlay shown in part F demonstrates thatthere is significant smearing of the PC signal that occurs. In fact,the resulting image in these cases rarely resembles what isobserved in the microscope.
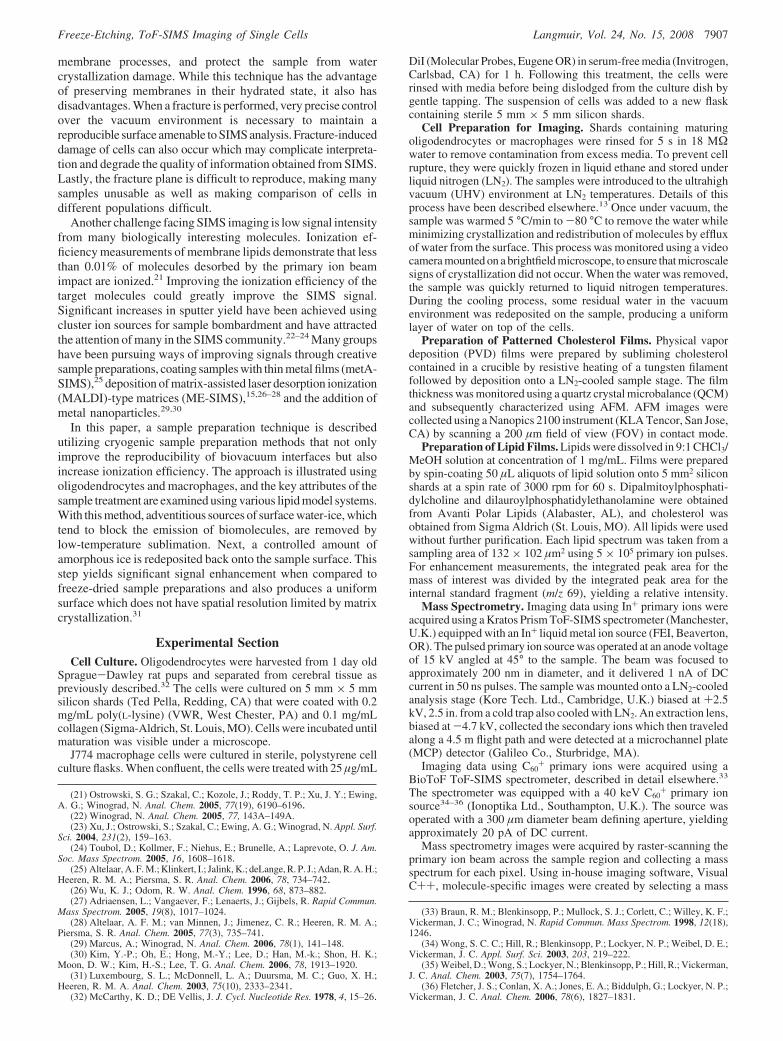
Deposition of Water. To test the effect of water redepositionon the sample, a simple model system consisting of a patternedthin film of cholesterol was used, and this was characterized bySIMS and AFM. The film was created using physical vapordeposition of cholesterol onto a Si substrate with a finder gridin the center. After the deposition, the finder grid was removed,leaving a relief pattern on the Si. SIMS images of the resultingfilm, before (A and B) and after (C and D) the deposition process,are shown in Figure 2.
Images A and C in Figure 2 show all of the ions collected fromthe surface on the same thermal intensity scale. Deposition ofwater was confirmed by monitoring the increase of m/z 18,representing [H2O · ]+, using SIMS (data not shown). Whenqualitatively comparing images A and C, it is evident that moreions are collected from the cholesterol islands after deposition.The inverse is true for the signal from the Si substrate. Figure2B and D shows SIMS overlay images that represent cholesterol(green) and Si (blue). The ionization effect on cholesterol isdemonstrated through the use of a line scan shown in Figure 2E.A more thorough investigation of these ionization effects can befound later. The data in image D shows that there is no measurablechange in the distribution of cholesterol as a result of waterdeposition. Due to the limitations of spot size of the In+ source,
(37) Colliver, T. L.; Brummel, C. L.; Pacholski, M. L.; Swanek, F. D.; Ewing,A. G.; Winograd, N. Anal. Chem. 1997, 69, 2225–2231.
(38) Rapid Freezing, Freeze-Fracture, and Deep Etching; Severs, N. J., Shotton,D. M., Eds.; Wiley-Liss: New York, 1995.
Figure 1. (A) Brightfield image of rat oligodendrocyte in culture. (B)Brightfield image of an oligodendrocyte cultured on silicon andcryogenically preserved using the described sample preparation method.(C) SIM image of rat oligodendrocyte. (D) SIMS image of a preservedoligodendrocyte, m/z 184 (PC) green, m/z 28 (Si) blue, intensity scale0-4. (E) Brightfield image of oligodendrocyte that has been warmedto allow crystallization. (F) SIMS image of a corresponding area shownin (E), m/z 184 (PC) green, m/z 28 (Si) blue, intensity scale 0-2. Imageswere obtained using an In+ primary ion beam; all scale bars are 20 µm.
7908 Langmuir, Vol. 24, No. 15, 2008 Piehowski et al.
measurements of lateral resolution from this analysis have beenlimited to approximately 1 µm, and no change in resolution wasmeasured after deposition. To more fully demonstrate thepreservation of film features, the samples were also analyzedusing AFM.
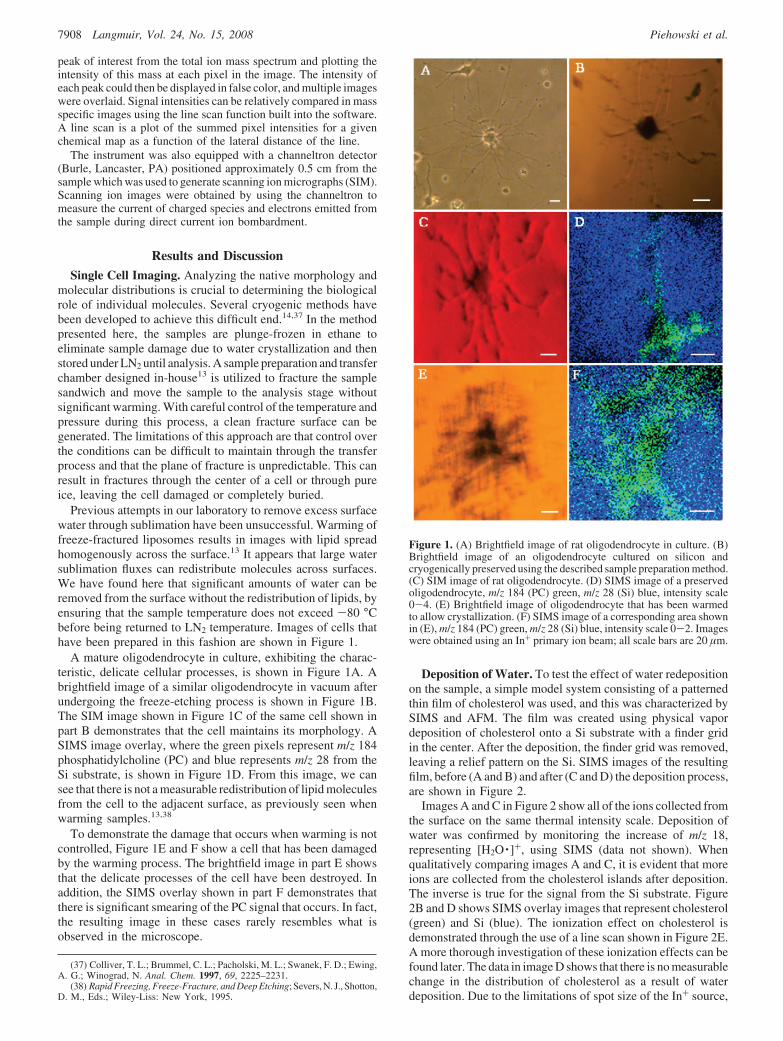
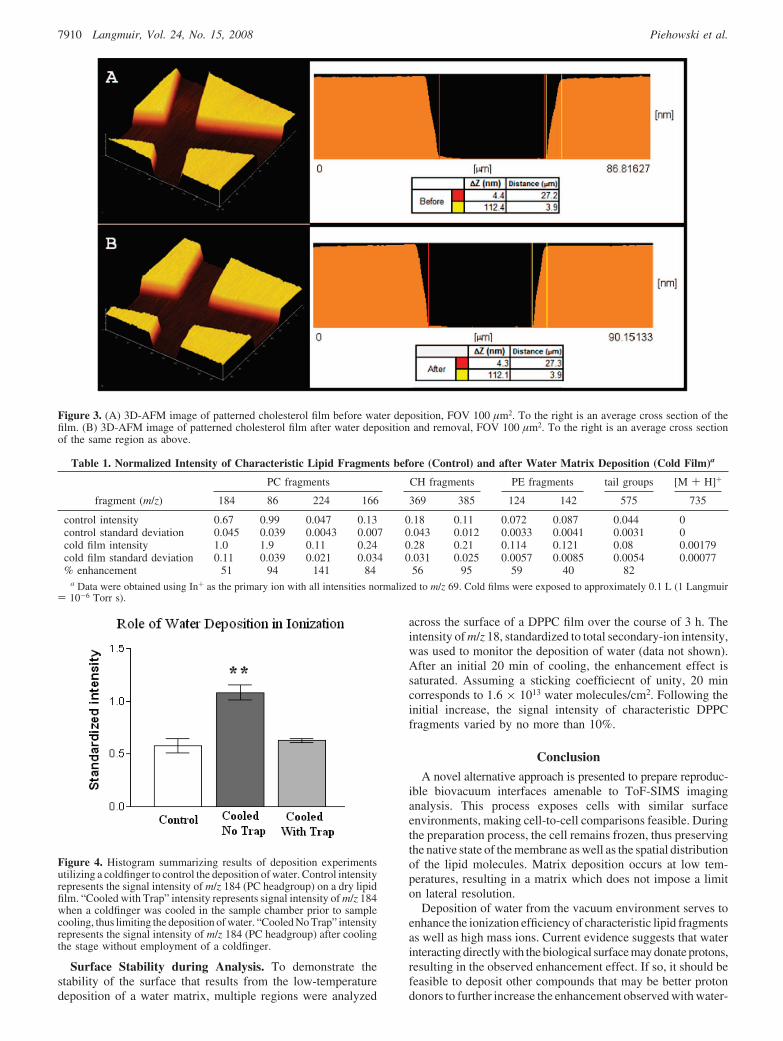
Representative AFM images are shown in Figure 3. ImagesA and B show the same feature on the film before and after beingplaced in vacuum and having water deposited and then removed,respectively. Image B shows that there are no changes resultingfrom the deposition and removal process. The representativeline scans shown correspond to the same feature on the film, andmeasurements of feature size confirm that there is no change.
There is no evidence of damage from deposition or removal,which implies that a matrix can be vapor-deposited withoutimposing a limit on spatial resolution. This result has importantimplications for imaging of single cells with SIMS, as it increasesthe signal without compromising sample preservation. Variouscompounds, other than water, might be deposited in vacuum toyield greater ionization increases.
Signal Enhancement. Water sublimed from the sample is notcompletely removed from the vacuum environment. Thus, thesubsequent return of the sample to liquid nitrogen temperatureresults in the deposition of some water on the sample. Redepositioncan be monitored from the intensity of the mass peak at m/z 18,
in the mass spectrum of freeze-etched samples. Of great potentialinterest, water deposition was found to enhance the signal fromseveral lipid molecules.
To quantify the enhancement observed, films of the lipidsphosphatidylcholine (PC), phosphatidylethanolamine (PE), andcholesterol (CH) were analyzed with SIMS using an In+ primaryion beam (Table 1). The intensity of characteristic fragments39,40
was measured by integrating the peak areas and normalizingthem to the intensity of m/z 69 (C5H9
+). The (C5H9+) fragment
has been used as an internal standard to account for smallvariations in secondary-ion signals that can occur during SIMSanalysis as a result of primary beam current fluctuation, sampletopography, and secondary-ion collection efficiency.16,41 Withthis analysis, variability of less than 10% is achieved using manydifferent samples.
Signal enhancement is observed for all characteristic fragmentsmeasured in the analysis; however, as is seen in previousstudies,25,30,31,42 the amount of enhancement varied for eachfragment analyzed. Some signals, such as m/z 184, resultingfrom the PC headgroup, have already been extensively mappedin previous SIMS imaging experiments.15,16,20,37 Other ions havenot produced sufficient signal intensity for the production ofdetailed images. Of particular interest to lipid mapping experi-ments are the signal enhancements observed for characteristiclipid tail fragments, lipid molecular ions, and the m/z 224 fragment(PC headgroup plus glycerol). Significant increases in the tailgroup signal make it possible to image unique distributions ofacyl chains in lipid models such as liposomes or supportedbilayers. Also significant is the appearance of the molecular ionpeak for dipalmitoylphosphatidylcholine (DPPC). Ion bombard-ment using In+ is known to induce a large amount of fragmentationupon impact, and the DPPC molecular ion is not observed in drylipid preparations. The cold samples of DPPC exhibit aconsiderable signal corresponding to [M + H]+. Enhancementof the 224 fragment is also of significance to biological imagingexperiments because reference spectra43 demonstrate that thisfragment can be used to differentiate between PC derived fromphospholipid species and PC derived from sphingomyelin, whichhas not been possible in previous imaging studies.
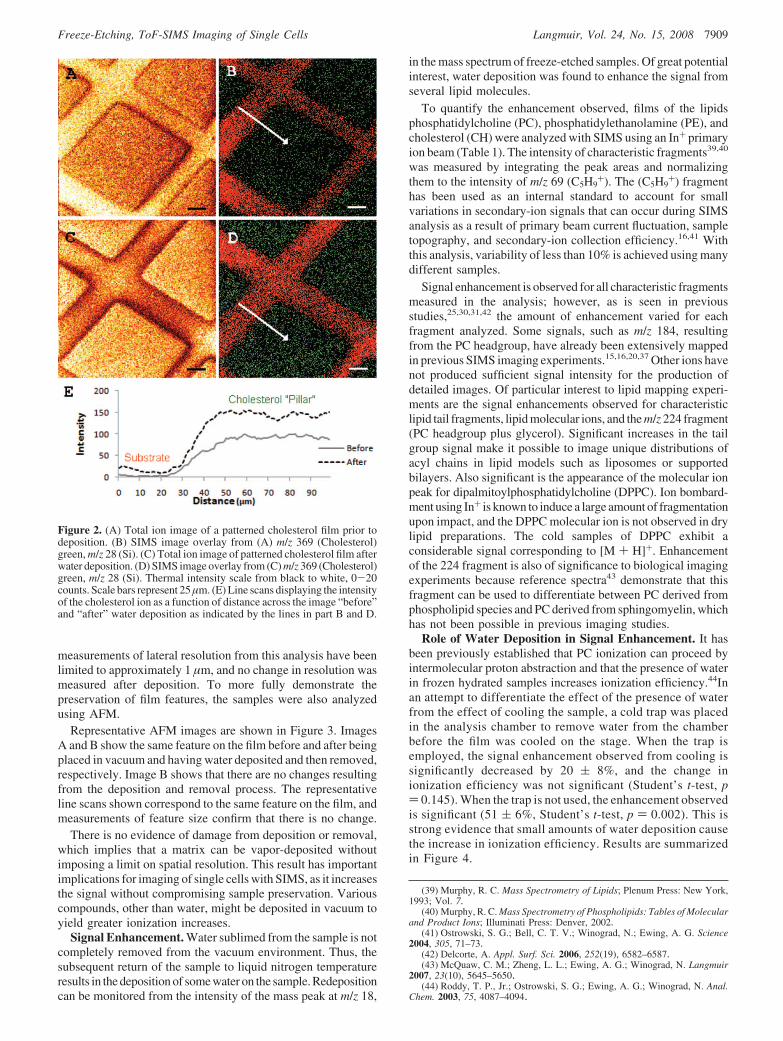
Role of Water Deposition in Signal Enhancement. It hasbeen previously established that PC ionization can proceed byintermolecular proton abstraction and that the presence of waterin frozen hydrated samples increases ionization efficiency.44Inan attempt to differentiate the effect of the presence of waterfrom the effect of cooling the sample, a cold trap was placedin the analysis chamber to remove water from the chamberbefore the film was cooled on the stage. When the trap isemployed, the signal enhancement observed from cooling issignificantly decreased by 20 ( 8%, and the change inionization efficiency was not significant (Student’s t-test, p) 0.145). When the trap is not used, the enhancement observedis significant (51 ( 6%, Student’s t-test, p ) 0.002). This isstrong evidence that small amounts of water deposition causethe increase in ionization efficiency. Results are summarizedin Figure 4.
(39) Murphy, R. C. Mass Spectrometry of Lipids; Plenum Press: New York,1993; Vol. 7.
(40) Murphy, R. C. Mass Spectrometry of Phospholipids: Tables of Molecularand Product Ions; Illuminati Press: Denver, 2002.
(41) Ostrowski, S. G.; Bell, C. T. V.; Winograd, N.; Ewing, A. G. Science2004, 305, 71–73.
(42) Delcorte, A. Appl. Surf. Sci. 2006, 252(19), 6582–6587.(43) McQuaw, C. M.; Zheng, L. L.; Ewing, A. G.; Winograd, N. Langmuir
2007, 23(10), 5645–5650.(44) Roddy, T. P., Jr.; Ostrowski, S. G.; Ewing, A. G.; Winograd, N. Anal.
Chem. 2003, 75, 4087–4094.
Figure 2. (A) Total ion image of a patterned cholesterol film prior todeposition. (B) SIMS image overlay from (A) m/z 369 (Cholesterol)green, m/z 28 (Si). (C) Total ion image of patterned cholesterol film afterwater deposition. (D) SIMS image overlay from (C) m/z 369 (Cholesterol)green, m/z 28 (Si). Thermal intensity scale from black to white, 0-20counts. Scale bars represent 25 µm. (E) Line scans displaying the intensityof the cholesterol ion as a function of distance across the image “before”and “after” water deposition as indicated by the lines in part B and D.
Freeze-Etching, ToF-SIMS Imaging of Single Cells Langmuir, Vol. 24, No. 15, 2008 7909
Surface Stability during Analysis. To demonstrate thestability of the surface that results from the low-temperaturedeposition of a water matrix, multiple regions were analyzed
across the surface of a DPPC film over the course of 3 h. Theintensity of m/z 18, standardized to total secondary-ion intensity,was used to monitor the deposition of water (data not shown).After an initial 20 min of cooling, the enhancement effect issaturated. Assuming a sticking coefficiecnt of unity, 20 mincorresponds to 1.6 × 10¹³ water molecules/cm2. Following theinitial increase, the signal intensity of characteristic DPPCfragments varied by no more than 10%.
Conclusion
A novel alternative approach is presented to prepare reproduc-ible biovacuum interfaces amenable to ToF-SIMS imaginganalysis. This process exposes cells with similar surfaceenvironments, making cell-to-cell comparisons feasible. Duringthe preparation process, the cell remains frozen, thus preservingthe native state of the membrane as well as the spatial distributionof the lipid molecules. Matrix deposition occurs at low tem-peratures, resulting in a matrix which does not impose a limiton lateral resolution.
Deposition of water from the vacuum environment serves toenhance the ionization efficiency of characteristic lipid fragmentsas well as high mass ions. Current evidence suggests that waterinteracting directly with the biological surface may donate protons,resulting in the observed enhancement effect. If so, it should befeasible to deposit other compounds that may be better protondonors to further increase the enhancement observed with water-
Figure 3. (A) 3D-AFM image of patterned cholesterol film before water deposition, FOV 100 µm2. To the right is an average cross section of thefilm. (B) 3D-AFM image of patterned cholesterol film after water deposition and removal, FOV 100 µm2. To the right is an average cross sectionof the same region as above.
Table 1. Normalized Intensity of Characteristic Lipid Fragments before (Control) and after Water Matrix Deposition (Cold Film)a
PC fragments CH fragments PE fragments tail groups [M + H]+
fragment (m/z) 184 86 224 166 369 385 124 142 575 735
control intensity 0.67 0.99 0.047 0.13 0.18 0.11 0.072 0.087 0.044 0control standard deviation 0.045 0.039 0.0043 0.007 0.043 0.012 0.0033 0.0041 0.0031 0cold film intensity 1.0 1.9 0.11 0.24 0.28 0.21 0.114 0.121 0.08 0.00179cold film standard deviation 0.11 0.039 0.021 0.034 0.031 0.025 0.0057 0.0085 0.0054 0.00077% enhancement 51 94 141 84 56 95 59 40 82
a Data were obtained using In+ as the primary ion with all intensities normalized to m/z 69. Cold films were exposed to approximately 0.1 L (1 Langmuir) 10-6 Torr s).
Figure 4. Histogram summarizing results of deposition experimentsutilizing a coldfinger to control the deposition of water. Control intensityrepresents the signal intensity of m/z 184 (PC headgroup) on a dry lipidfilm. “Cooled with Trap” intensity represents signal intensity of m/z 184when a coldfinger was cooled in the sample chamber prior to samplecooling, thus limiting the deposition of water. “Cooled No Trap” intensityrepresents the signal intensity of m/z 184 (PC headgroup) after coolingthe stage without employment of a coldfinger.
7910 Langmuir, Vol. 24, No. 15, 2008 Piehowski et al.

ice. The deposition of water also serves to enhance the ionizationof cholesterol, though the role of water in the mechanism iscurrently not known.
The enhancement effect is stable over a period of hours,resulting in an “analysis window” in which the results of differentimages can be directly compared. The ability to produce aconsistent and uniform surface environment will greatly improvethe reproducibility of SIMS imaging, and it is essential to obtainingquantitative information from SIMS analyses.
These procedures yield high quality spectra both for atomicbombardment in the low dose mode and with cluster bombard-ment. We believe this strategy adds to the options available for
producing cryogenically preserved single cells with high spatialintegrity for SIMS analysis.
Acknowledgment. Oligodendrocytes were a generous con-tribution of Gong Chen. J774 macrophage cells were a generouscontribution of R. A. Schlegel. This work was supported by theNational Institutes of Health. A.G.E. is supported as a MarieCurie Chair from the European Union 6th Framework.
Supporting Information Available: Images of freeze-etchedcells obtained using a C60
+ primary ion. This material is available freeof charge via the Internet at http://pubs.acs.org.
LA800292E
Freeze-Etching, ToF-SIMS Imaging of Single Cells Langmuir, Vol. 24, No. 15, 2008 7911