Embed Size (px)
Citation preview
Manufacturing Processes for Engineering Materials, 5th ed. Kalpakjian • Schmid© 2008, Pearson EducationISBN No. 0-13-227271-7
Temperature & Density for Castings
Manufacturing Processes for Engineering Materials, 5th ed. Kalpakjian • Schmid© 2008, Pearson EducationISBN No. 0-13-227271-7
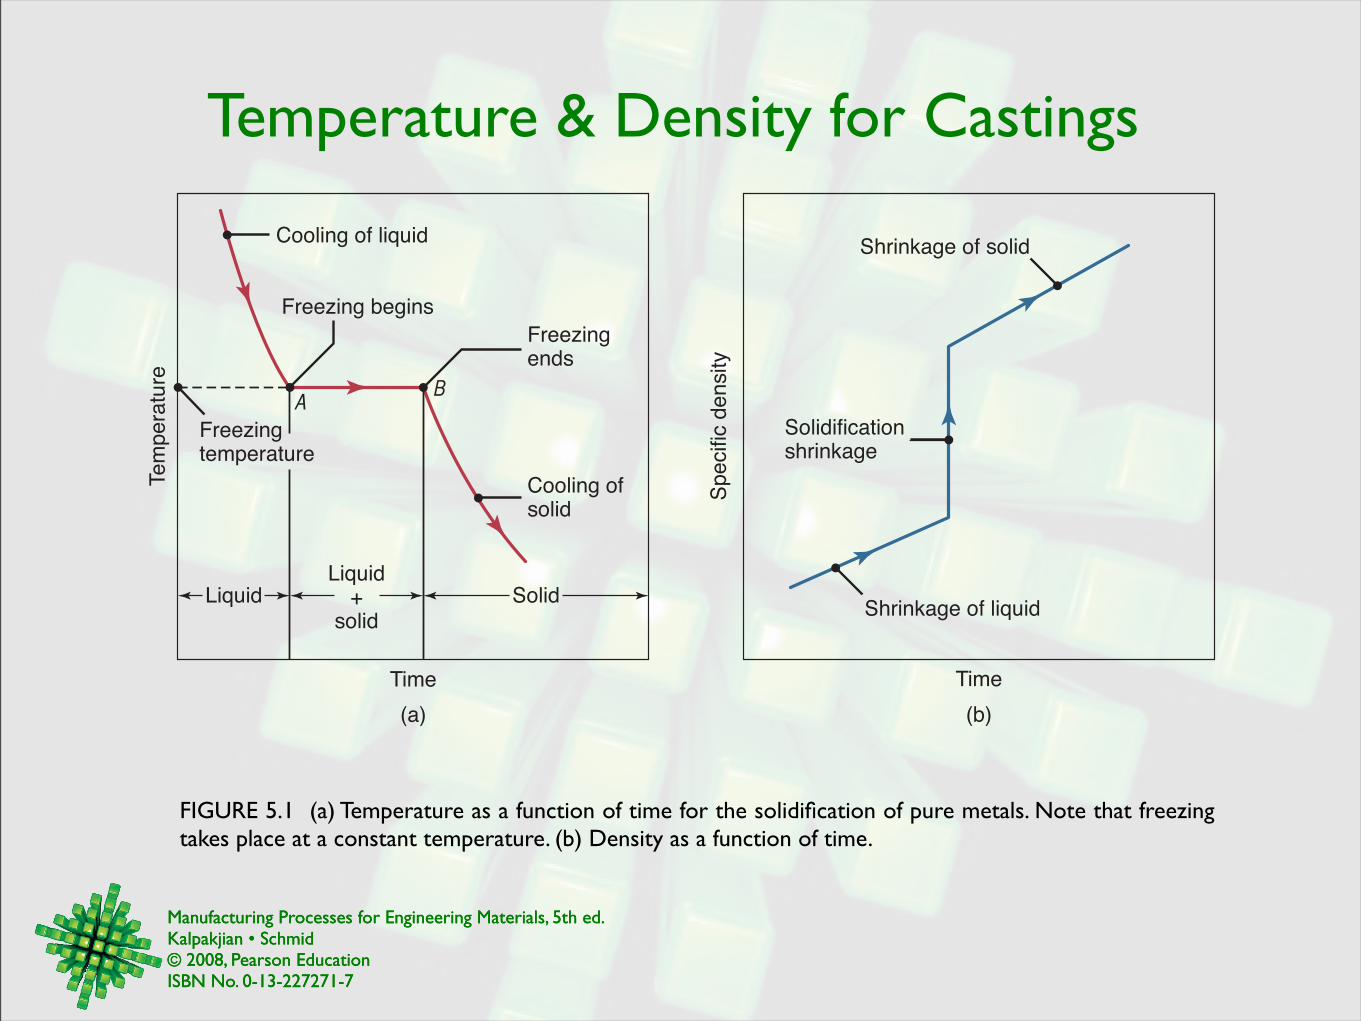
FIGURE 5.1 (a) Temperature as a function of time for the solidification of pure metals. Note that freezing takes place at a constant temperature. (b) Density as a function of time.
Tem
pera
ture
Time
Cooling of liquid
Cooling ofsolid
BA
LiquidLiquid
+solid
Solid
Freezing begins
Freezingends
Freezingtemperature
Specific
density
Time
Shrinkage of liquid
Shrinkage of solid
Solidificationshrinkage
(a) (b)
Manufacturing Processes for Engineering Materials, 5th ed. Kalpakjian • Schmid© 2008, Pearson EducationISBN No. 0-13-227271-7
Two-Phased Alloys
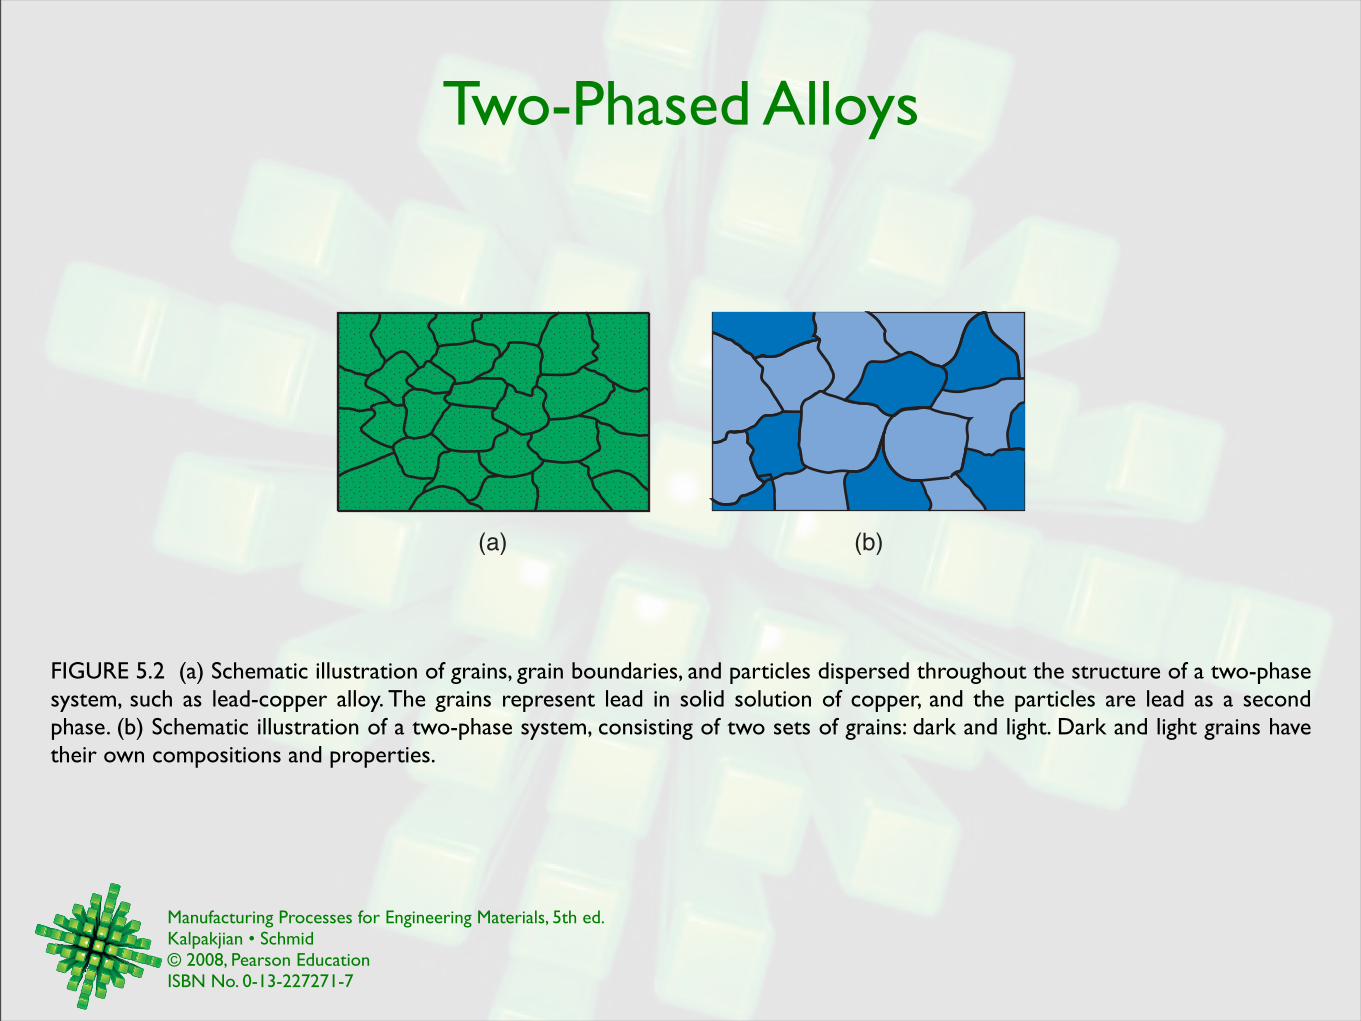
FIGURE 5.2 (a) Schematic illustration of grains, grain boundaries, and particles dispersed throughout the structure of a two-phase system, such as lead-copper alloy. The grains represent lead in solid solution of copper, and the particles are lead as a second phase. (b) Schematic illustration of a two-phase system, consisting of two sets of grains: dark and light. Dark and light grains have their own compositions and properties.
(b)(a)
Manufacturing Processes for Engineering Materials, 5th ed. Kalpakjian • Schmid© 2008, Pearson EducationISBN No. 0-13-227271-7
Phase Diagram for Nickel-Copper
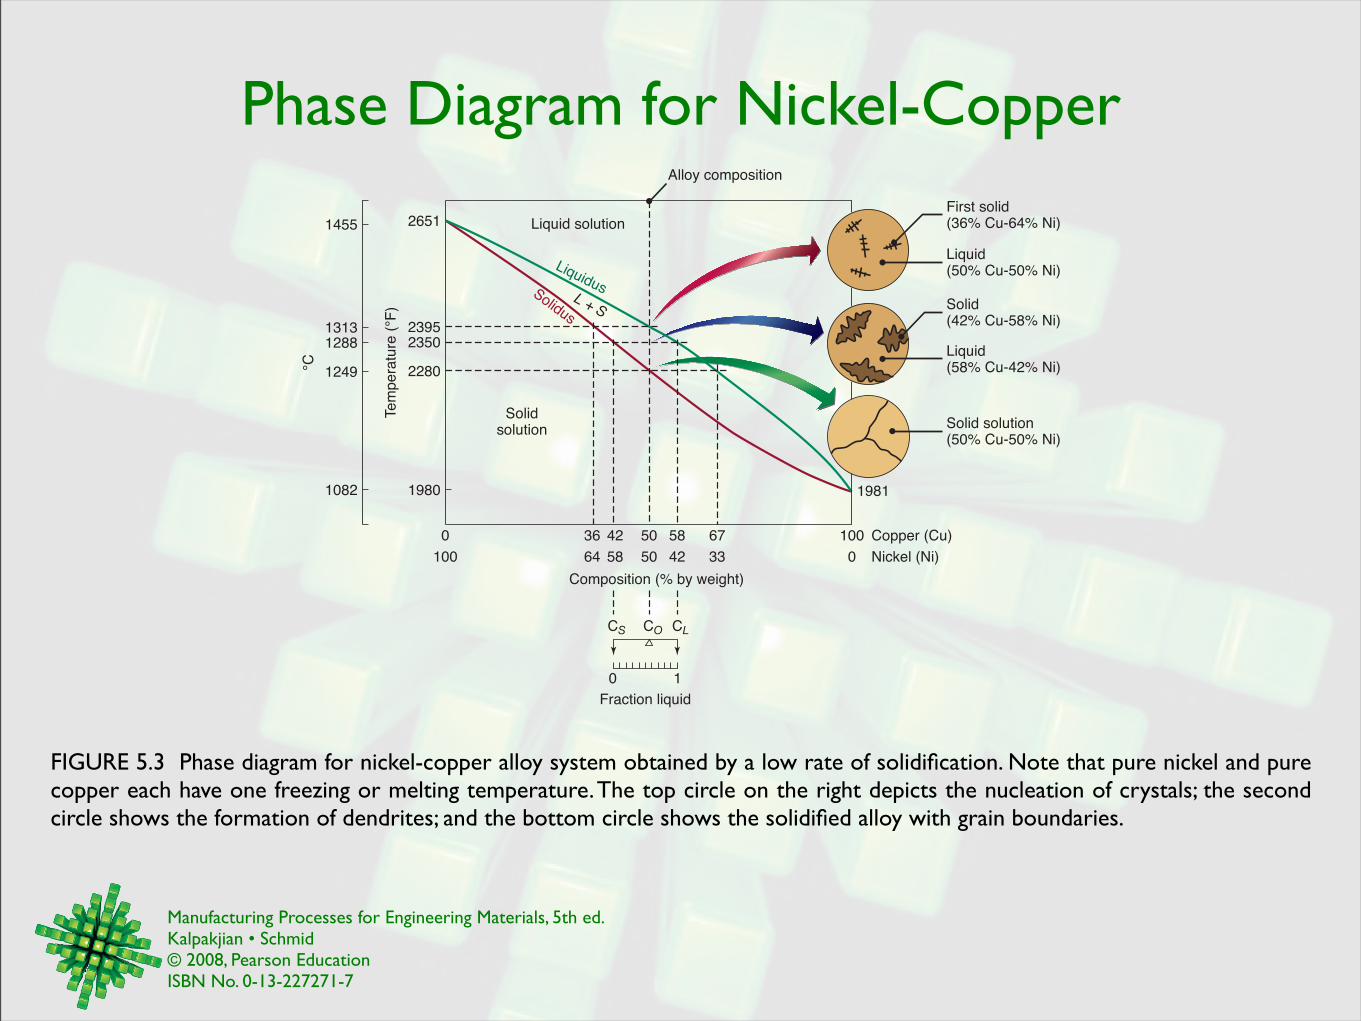
FIGURE 5.3 Phase diagram for nickel-copper alloy system obtained by a low rate of solidification. Note that pure nickel and pure copper each have one freezing or melting temperature. The top circle on the right depicts the nucleation of crystals; the second circle shows the formation of dendrites; and the bottom circle shows the solidified alloy with grain boundaries.
Solid(42% Cu-58% Ni)
Liquid(50% Cu-50% Ni)
First solid(36% Cu-64% Ni)
Liquid(58% Cu-42% Ni)
0 36 42 50 58 67 100
Solidsolution
Alloy composition
Liquid solution
Fraction liquid
0 1
Solidus
LiquidusL + S
Solid solution(50% Cu-50% Ni)
1981
CS CO CL
1082 1980
2280
23502395
26511455
1249
12881313
Te
mp
era
ture
(°F
)
°C
Composition (% by weight)
Copper (Cu)
100 64 58 50 42 33 0 Nickel (Ni)
Manufacturing Processes for Engineering Materials, 5th ed. Kalpakjian • Schmid© 2008, Pearson EducationISBN No. 0-13-227271-7
Irn-Iron Carbide Phase Diagram
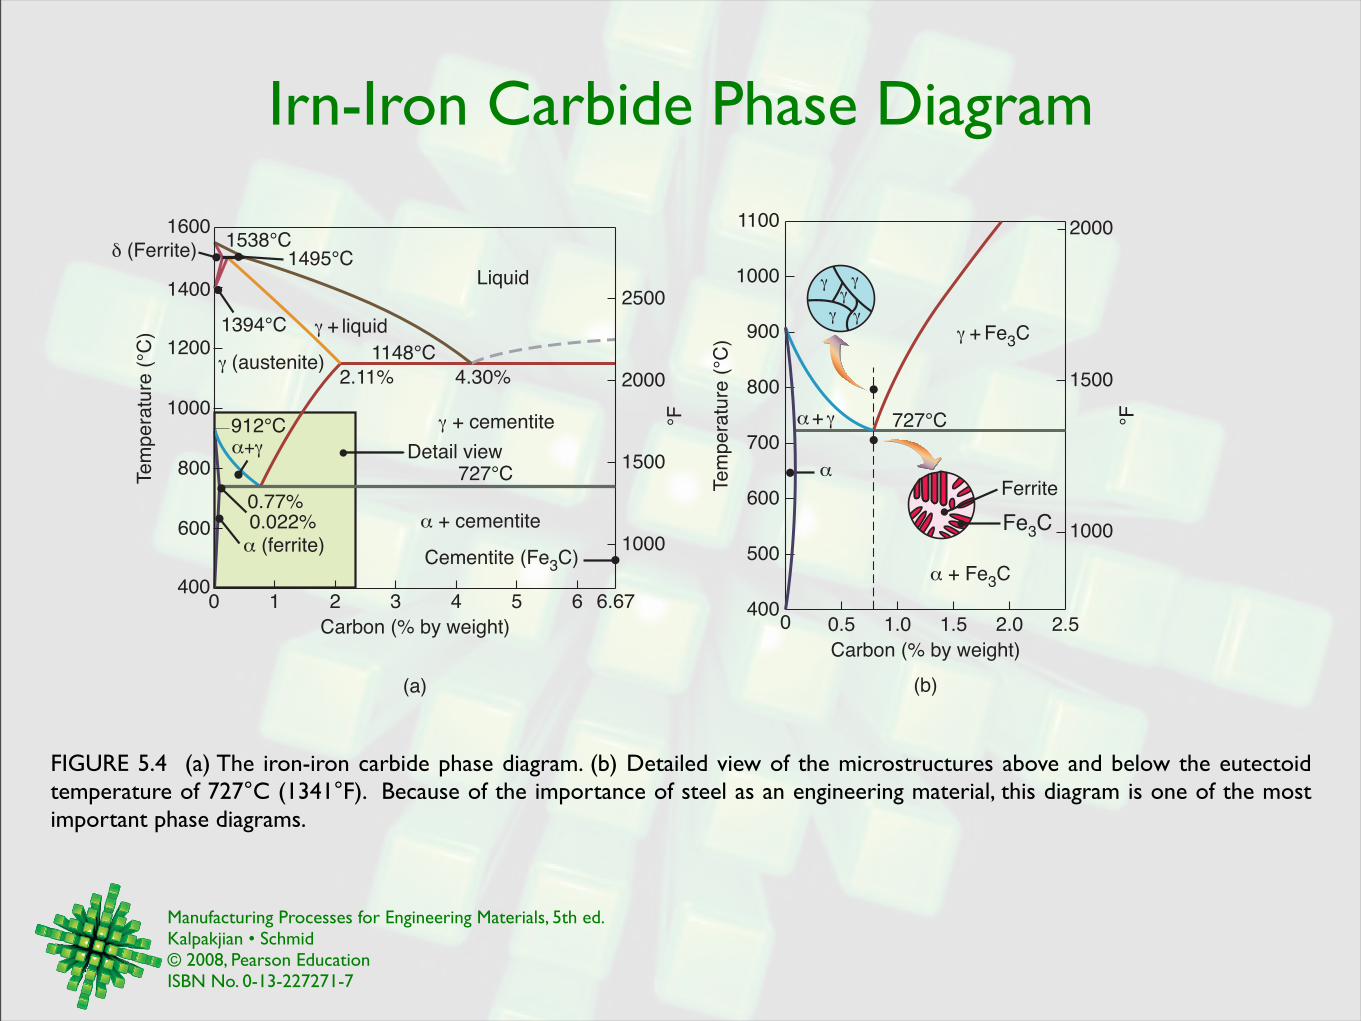
FIGURE 5.4 (a) The iron-iron carbide phase diagram. (b) Detailed view of the microstructures above and below the eutectoid temperature of 727°C (1341°F). Because of the importance of steel as an engineering material, this diagram is one of the most important phase diagrams.
400
500
600
700
800
900
1000
1100
0 0.5 1.0 1.5 2.0 2.5
1000
1500
2000
727°C °F
Te
mp
era
ture
(°C
)
Carbon (% by weight)
! + Fe3C
"
" + Fe3C
Fe3C
Ferrite
!!
! !
!
" + !
Te
mp
era
ture
(°C
)
Carbon (% by weight)
1000
1200
1400
800
600
400
1600
0 1 2 3 4 5 6 6.67
1000
1500
2500
2000
Cementite (Fe3C)
Liquid
727°C
1495°C1538°C
1394°C
912°C °F
0.77%0.022%
4.30%2.11%
1148°C
" (ferrite)
" + cementite
! + cementite
! + liquid
# (Ferrite)
Detail view
(a) (b)
! (austenite)
"+!
Manufacturing Processes for Engineering Materials, 5th ed. Kalpakjian • Schmid© 2008, Pearson EducationISBN No. 0-13-227271-7
Texture in Castings
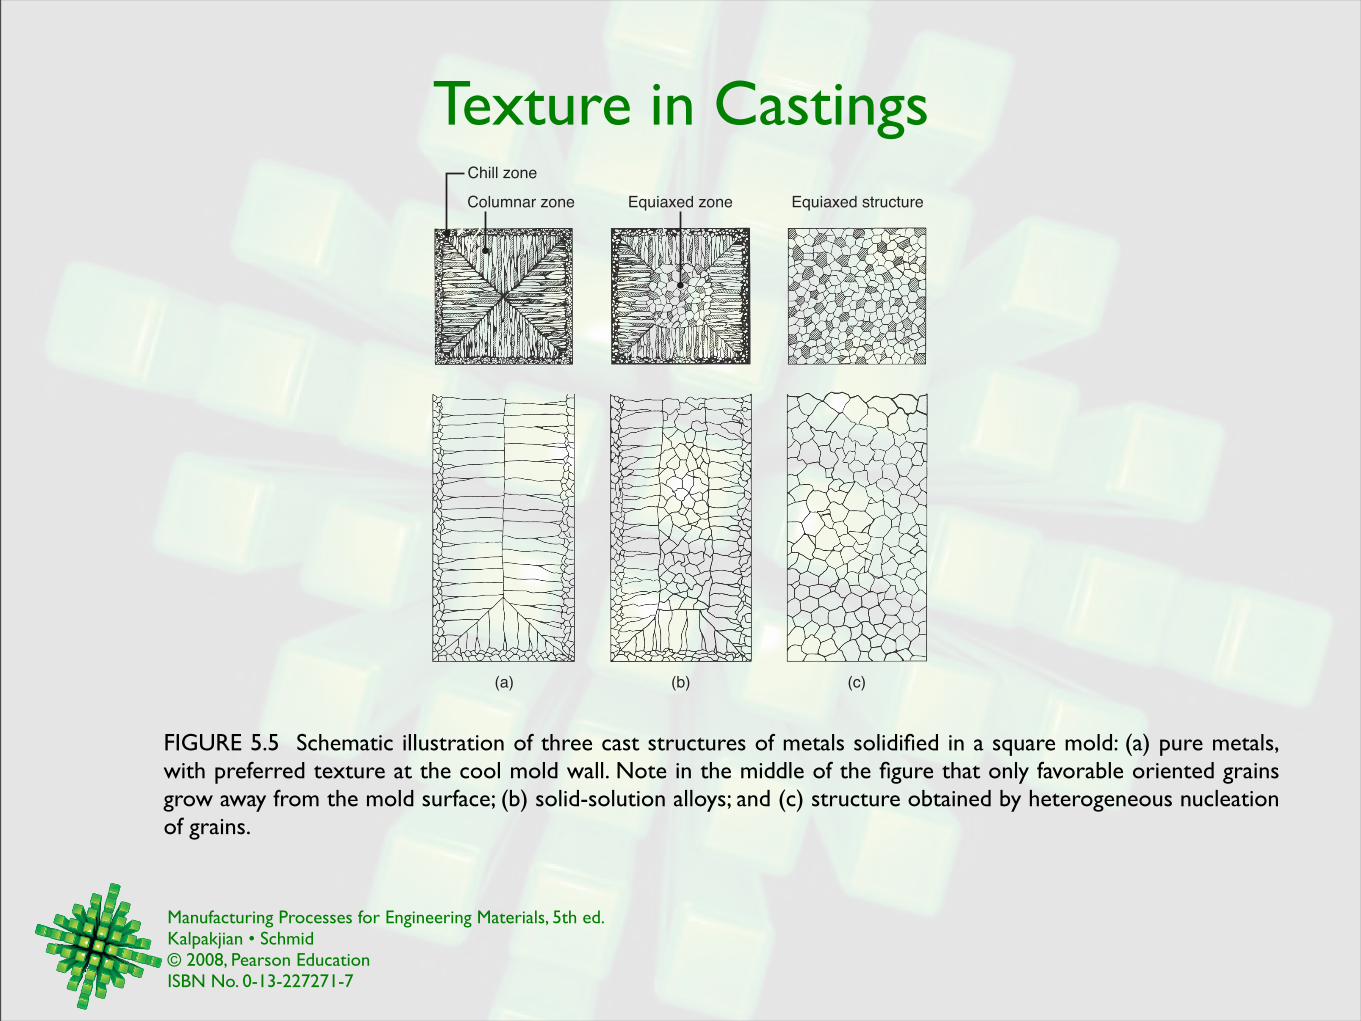
FIGURE 5.5 Schematic illustration of three cast structures of metals solidified in a square mold: (a) pure metals, with preferred texture at the cool mold wall. Note in the middle of the figure that only favorable oriented grains grow away from the mold surface; (b) solid-solution alloys; and (c) structure obtained by heterogeneous nucleation of grains.
(a)
Chill zone
Equiaxed structureEquiaxed zone
(b) (c)
Columnar zone
Manufacturing Processes for Engineering Materials, 5th ed. Kalpakjian • Schmid© 2008, Pearson EducationISBN No. 0-13-227271-7
Alloy Solidification & Temperature
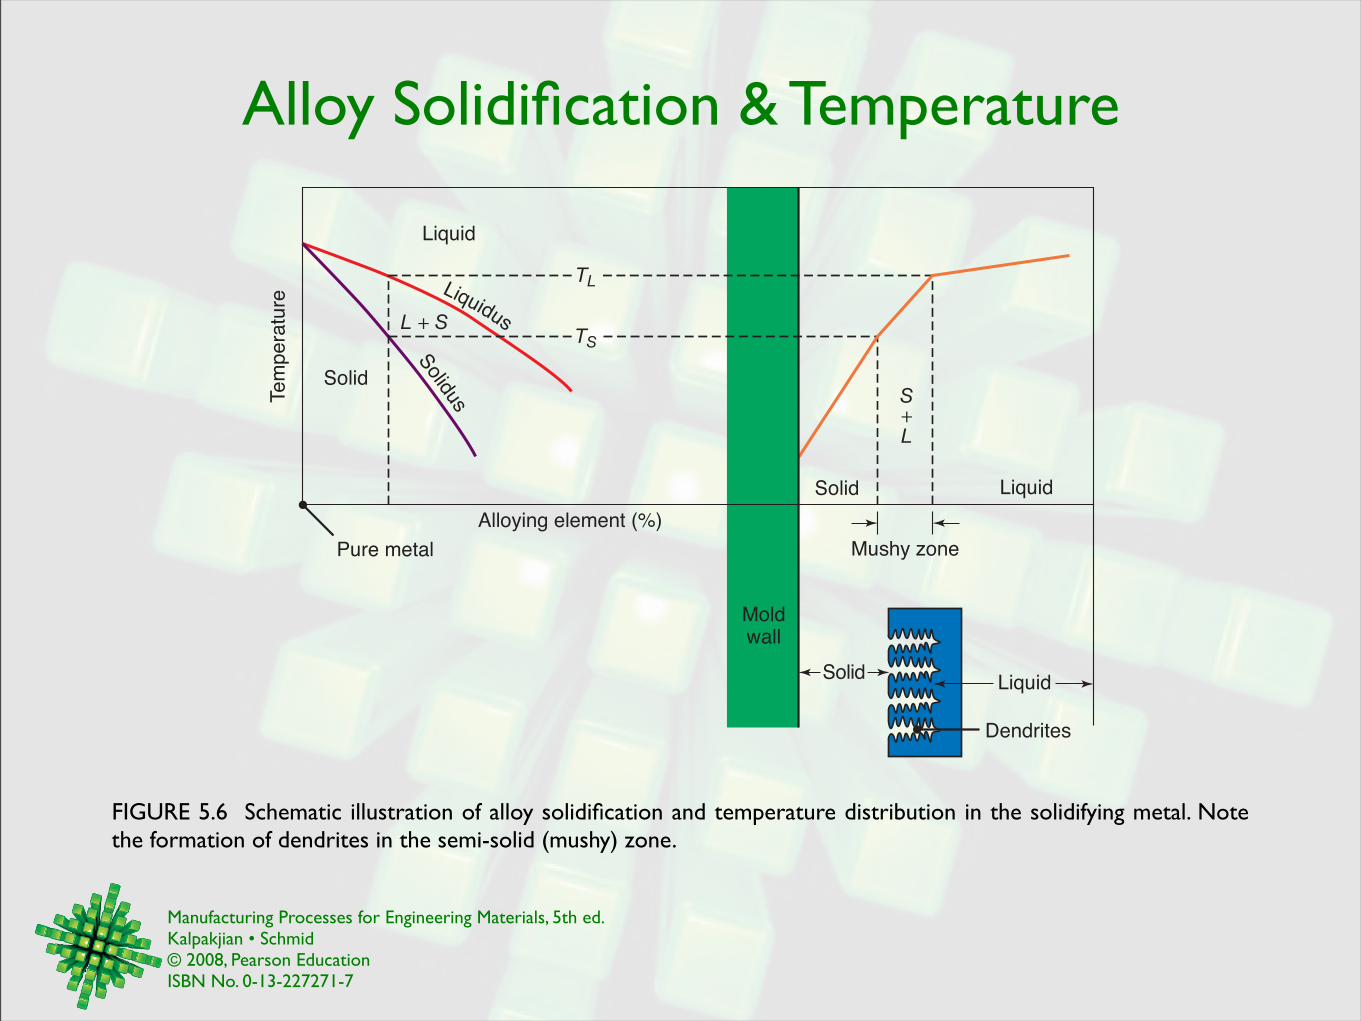
FIGURE 5.6 Schematic illustration of alloy solidification and temperature distribution in the solidifying metal. Note the formation of dendrites in the semi-solid (mushy) zone.
L + STS
TL
Liquid
Solid
Solid
Solid
Mushy zone
Dendrites
Moldwall
Liquid
Liquid
Te
mp
era
ture
Alloying element (%)
S
L
Liquidus
Solidus
Pure metal
Manufacturing Processes for Engineering Materials, 5th ed. Kalpakjian • Schmid© 2008, Pearson EducationISBN No. 0-13-227271-7
Solidification Patterns for Gray Cast Iron
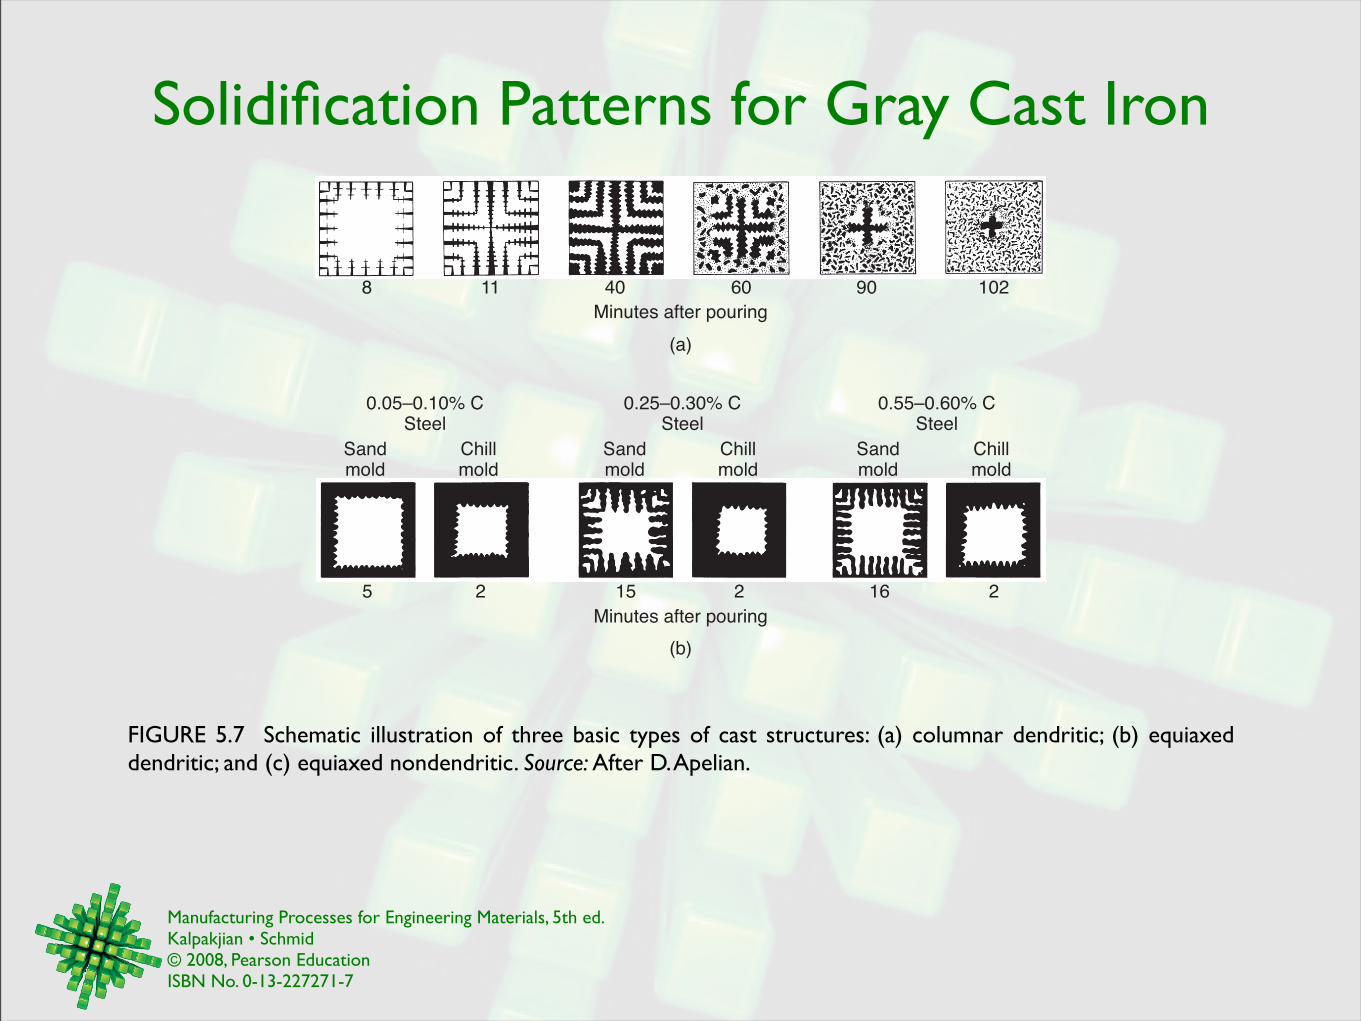
FIGURE 5.7 Schematic illustration of three basic types of cast structures: (a) columnar dendritic; (b) equiaxed dendritic; and (c) equiaxed nondendritic. Source: After D. Apelian.
(a)
(b)
0.05–0.10% CSteel
0.25–0.30% CSteel
Minutes after pouring
Minutes after pouring
0.55–0.60% CSteel
8 11 40 60 90 102
5 2 15 2 16 2
Sandmold
Chillmold
Sandmold
Chillmold
Sandmold
Chillmold
Manufacturing Processes for Engineering Materials, 5th ed. Kalpakjian • Schmid© 2008, Pearson EducationISBN No. 0-13-227271-7
Cast Structures
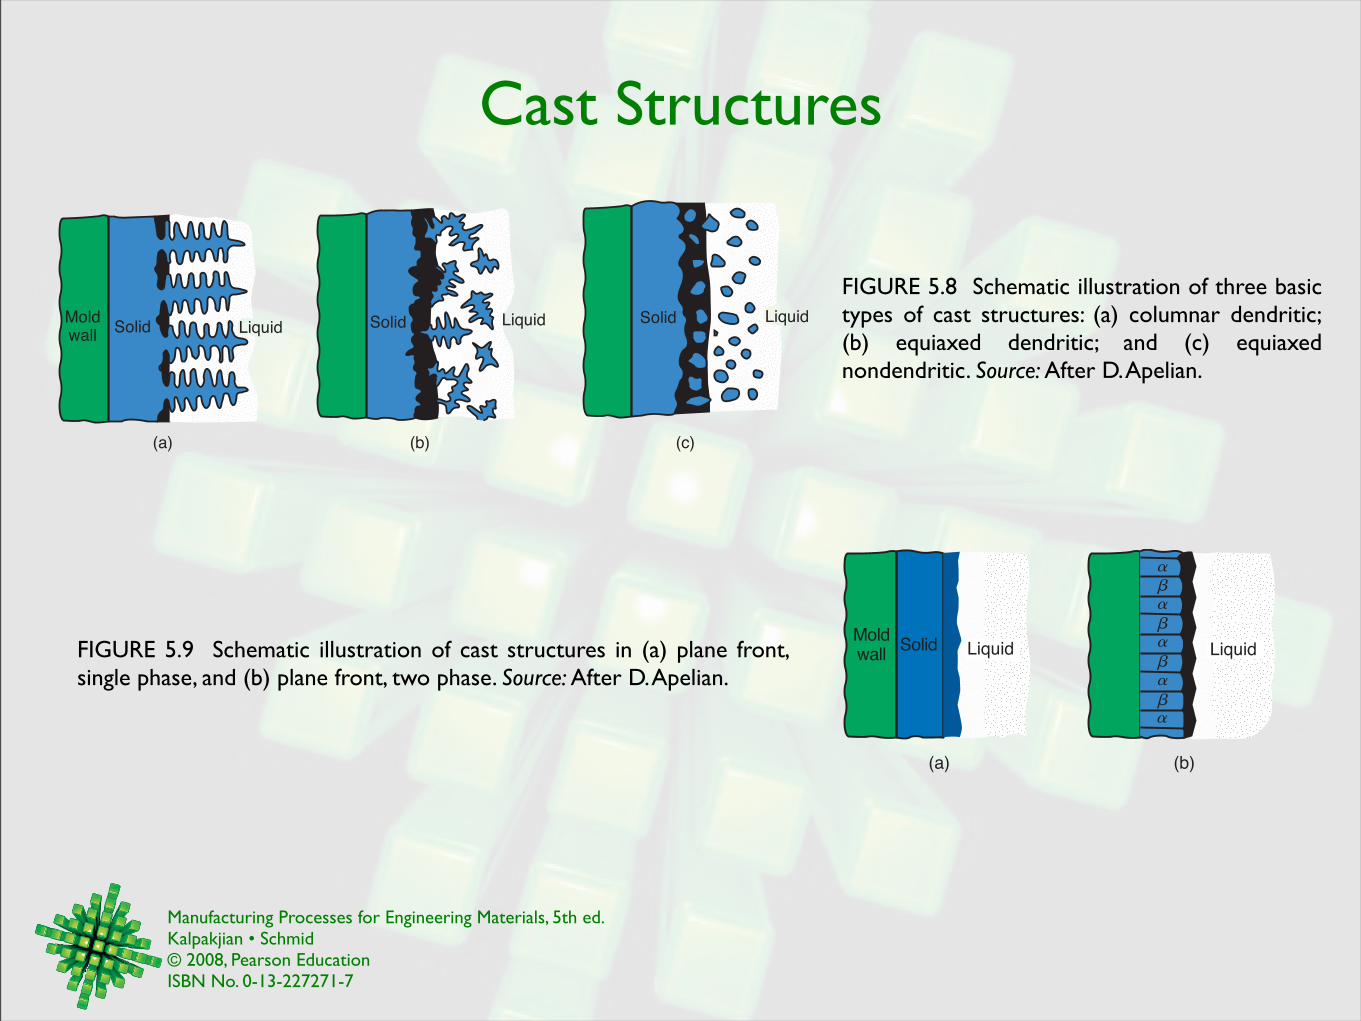
FIGURE 5.9 Schematic illustration of cast structures in (a) plane front, single phase, and (b) plane front, two phase. Source: After D. Apelian.
(a) (b) (c)
SolidSolidSolid Liquid Liquid LiquidMoldwall
(a)
Solid LiquidMoldwall Liquid
(b)
FIGURE 5.8 Schematic illustration of three basic types of cast structures: (a) columnar dendritic; (b) equiaxed dendritic; and (c) equiaxed nondendritic. Source: After D. Apelian.
Manufacturing Processes for Engineering Materials, 5th ed. Kalpakjian • Schmid© 2008, Pearson EducationISBN No. 0-13-227271-7
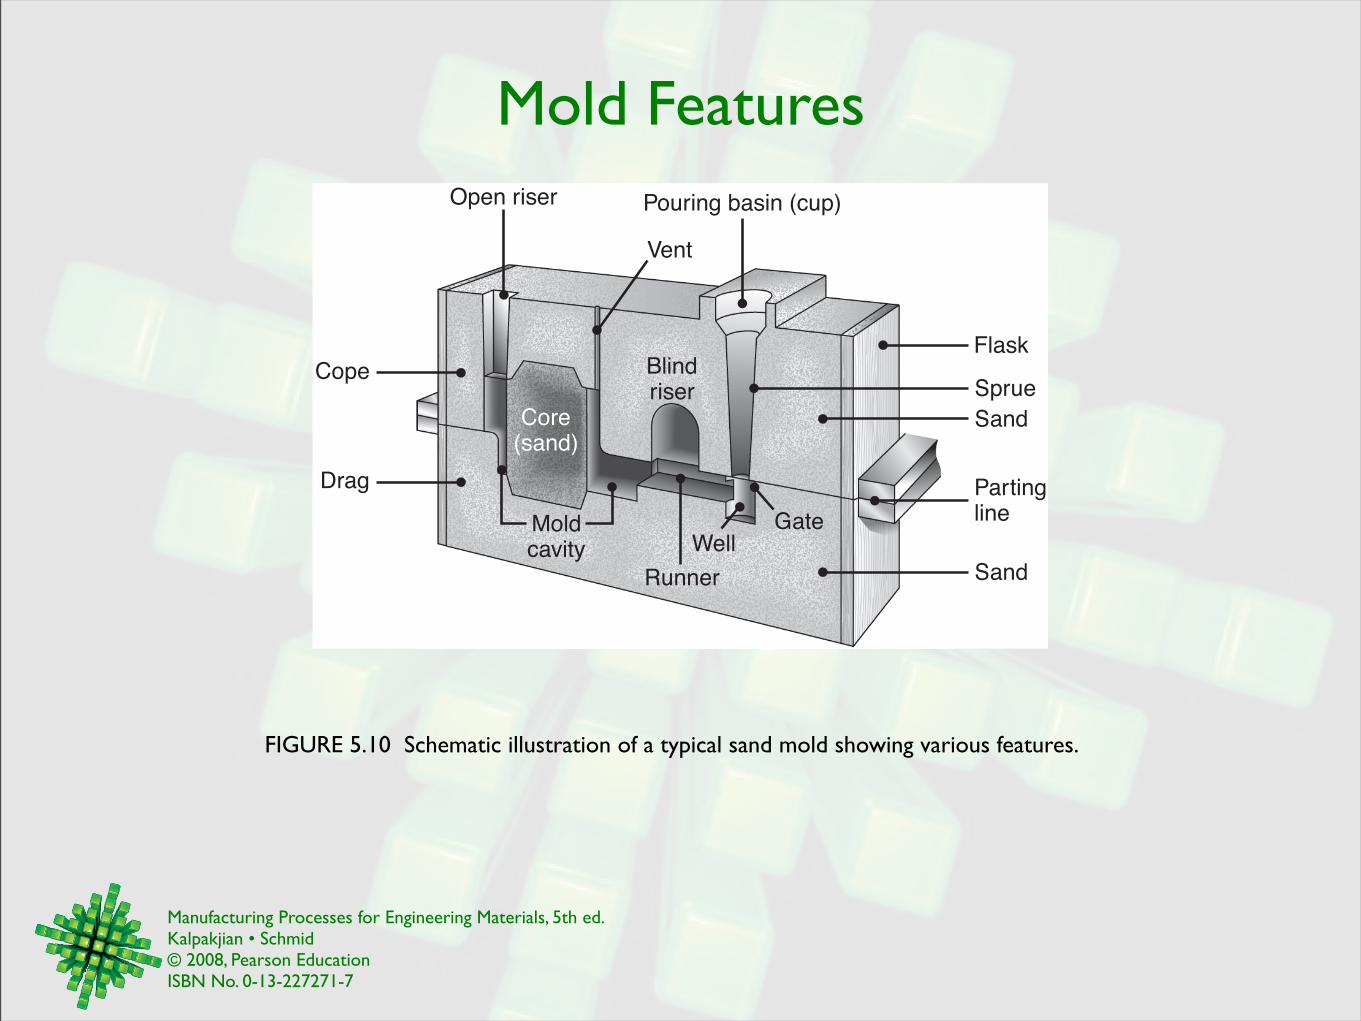
Mold Features
FIGURE 5.10 Schematic illustration of a typical sand mold showing various features.
Open riser
Vent
Pouring basin (cup)
Drag
Cope
Sand
Sprue
Sand
Flask
PartinglineMold
cavity WellGate
Core(sand)
Blindriser
Runner
Manufacturing Processes for Engineering Materials, 5th ed. Kalpakjian • Schmid© 2008, Pearson EducationISBN No. 0-13-227271-7
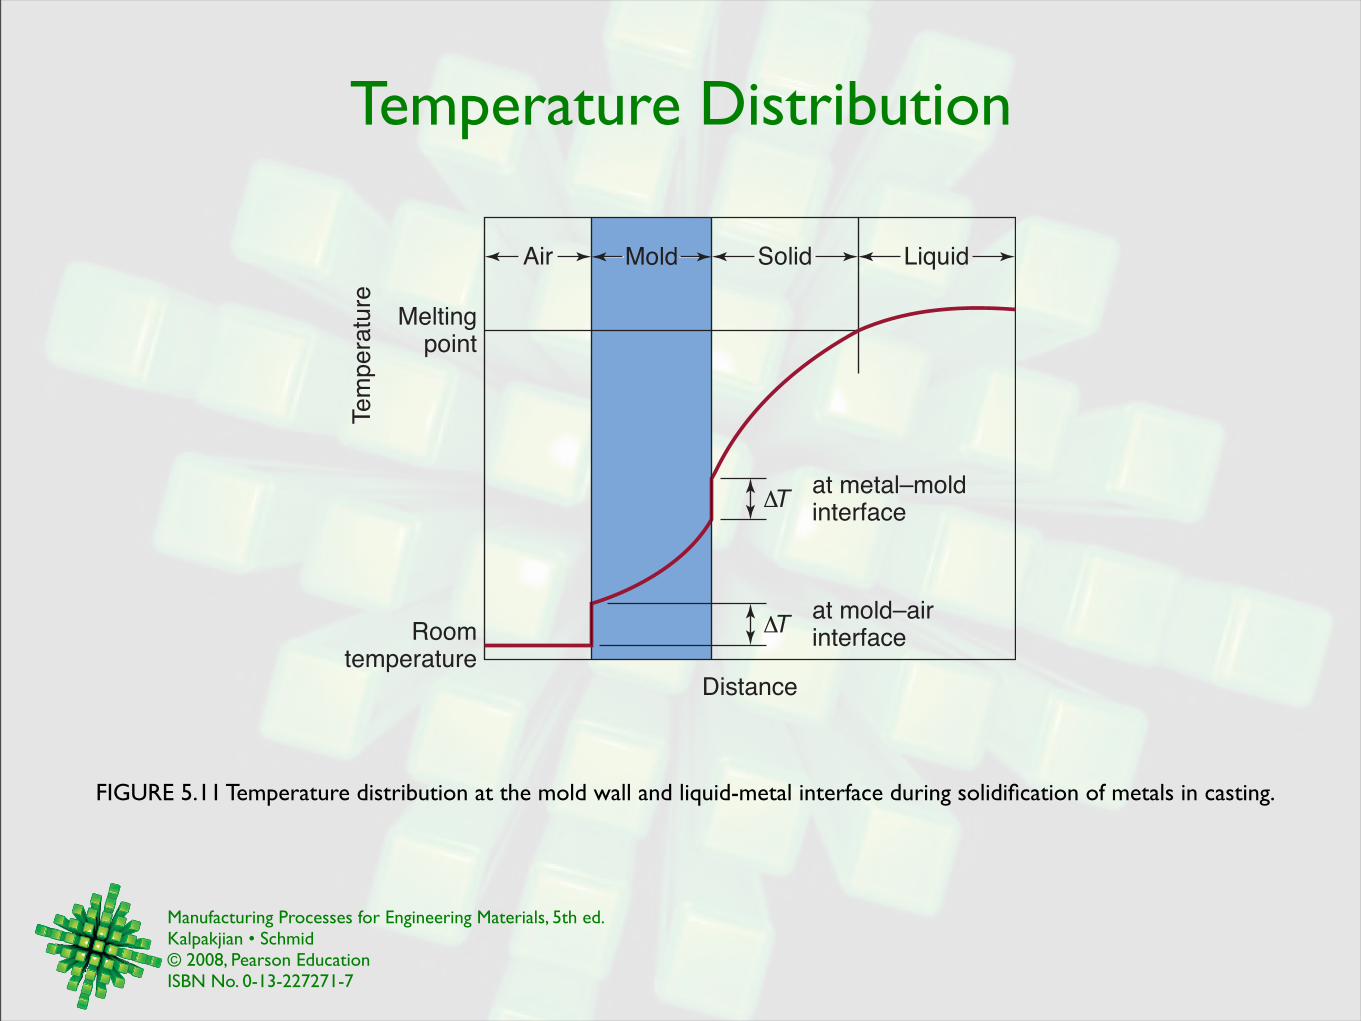
Temperature Distribution
FIGURE 5.11 Temperature distribution at the mold wall and liquid-metal interface during solidification of metals in casting.
Roomtemperature
Distance
at mold–airinterface
at metal–moldinterface
Meltingpoint
Te
mp
era
ture
Air Solid Liquid
!T
!T
Mold
Manufacturing Processes for Engineering Materials, 5th ed. Kalpakjian • Schmid© 2008, Pearson EducationISBN No. 0-13-227271-7
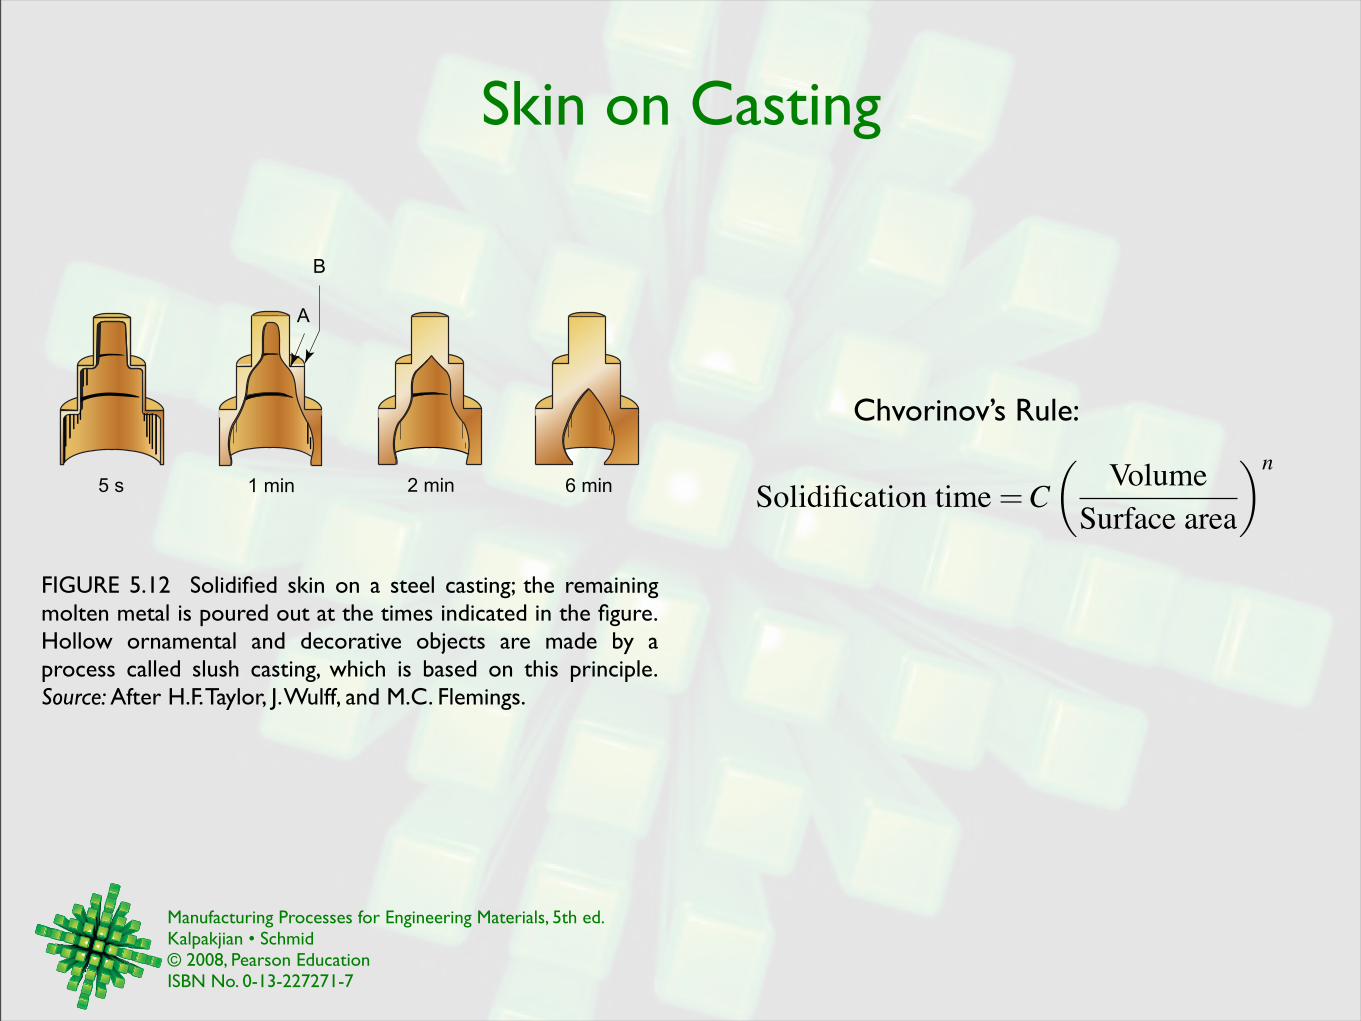
Skin on Casting
FIGURE 5.12 Solidified skin on a steel casting; the remaining molten metal is poured out at the times indicated in the figure. Hollow ornamental and decorative objects are made by a process called slush casting, which is based on this principle. Source: After H.F. Taylor, J. Wulff, and M.C. Flemings.
5 s 1 min 2 min 6 min
A
B
Chvorinov’s Rule:
Solidification time=C!
VolumeSurface area
"n
Manufacturing Processes for Engineering Materials, 5th ed. Kalpakjian • Schmid© 2008, Pearson EducationISBN No. 0-13-227271-7
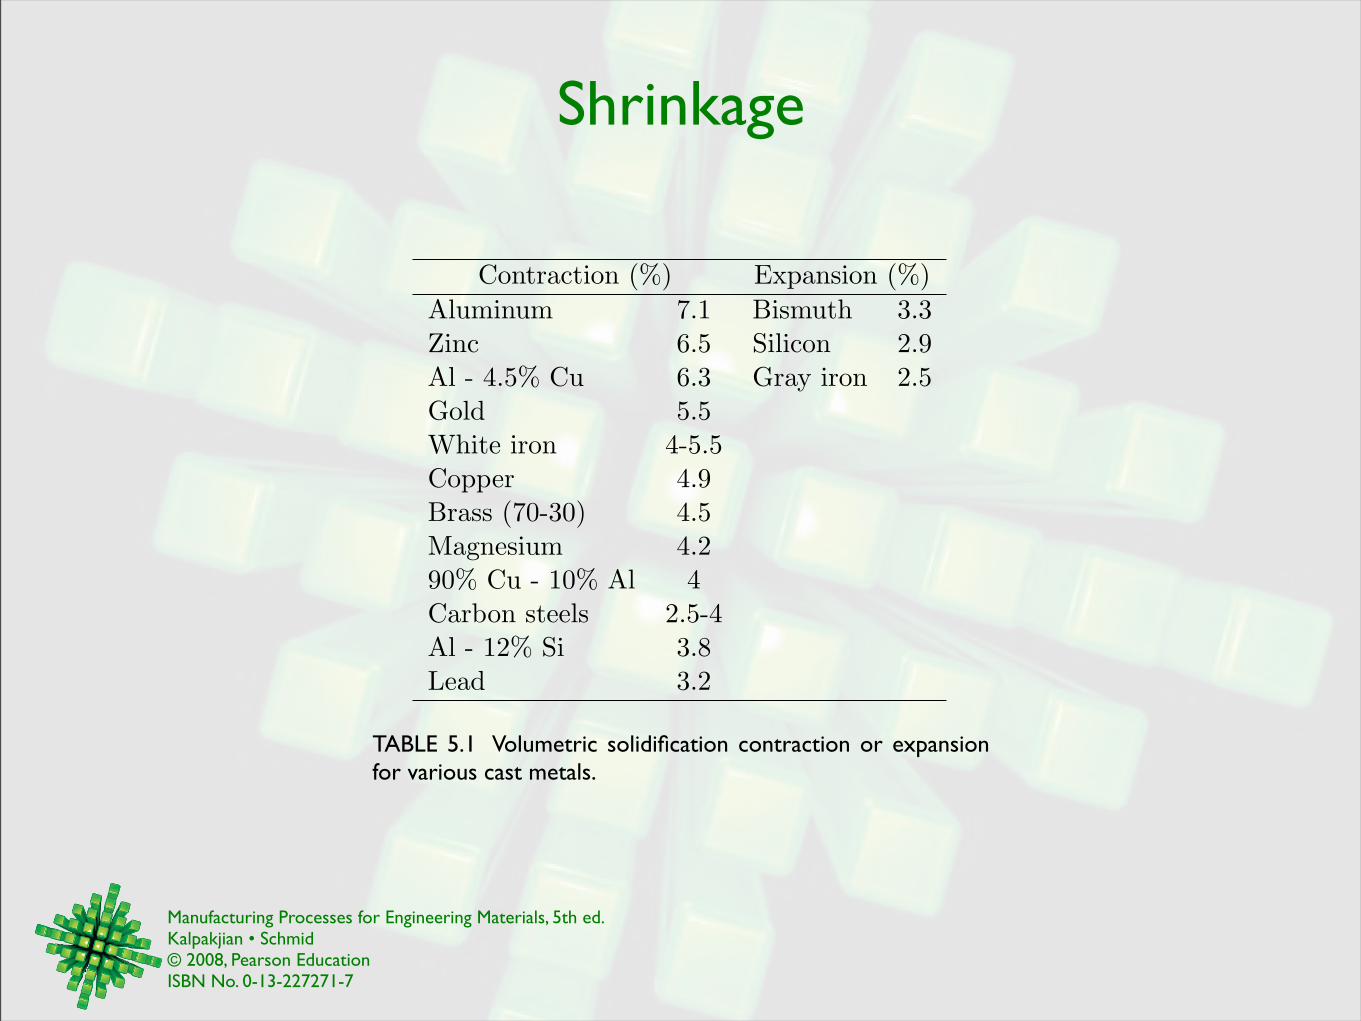
Shrinkage
Contraction (%) Expansion (%)Aluminum 7.1 Bismuth 3.3Zinc 6.5 Silicon 2.9Al - 4.5% Cu 6.3 Gray iron 2.5Gold 5.5White iron 4-5.5Copper 4.9Brass (70-30) 4.5Magnesium 4.290% Cu - 10% Al 4Carbon steels 2.5-4Al - 12% Si 3.8Lead 3.2
TABLE 5.1 Volumetric solidification contraction or expansion for various cast metals.
Manufacturing Processes for Engineering Materials, 5th ed. Kalpakjian • Schmid© 2008, Pearson EducationISBN No. 0-13-227271-7
Cast Material Properties
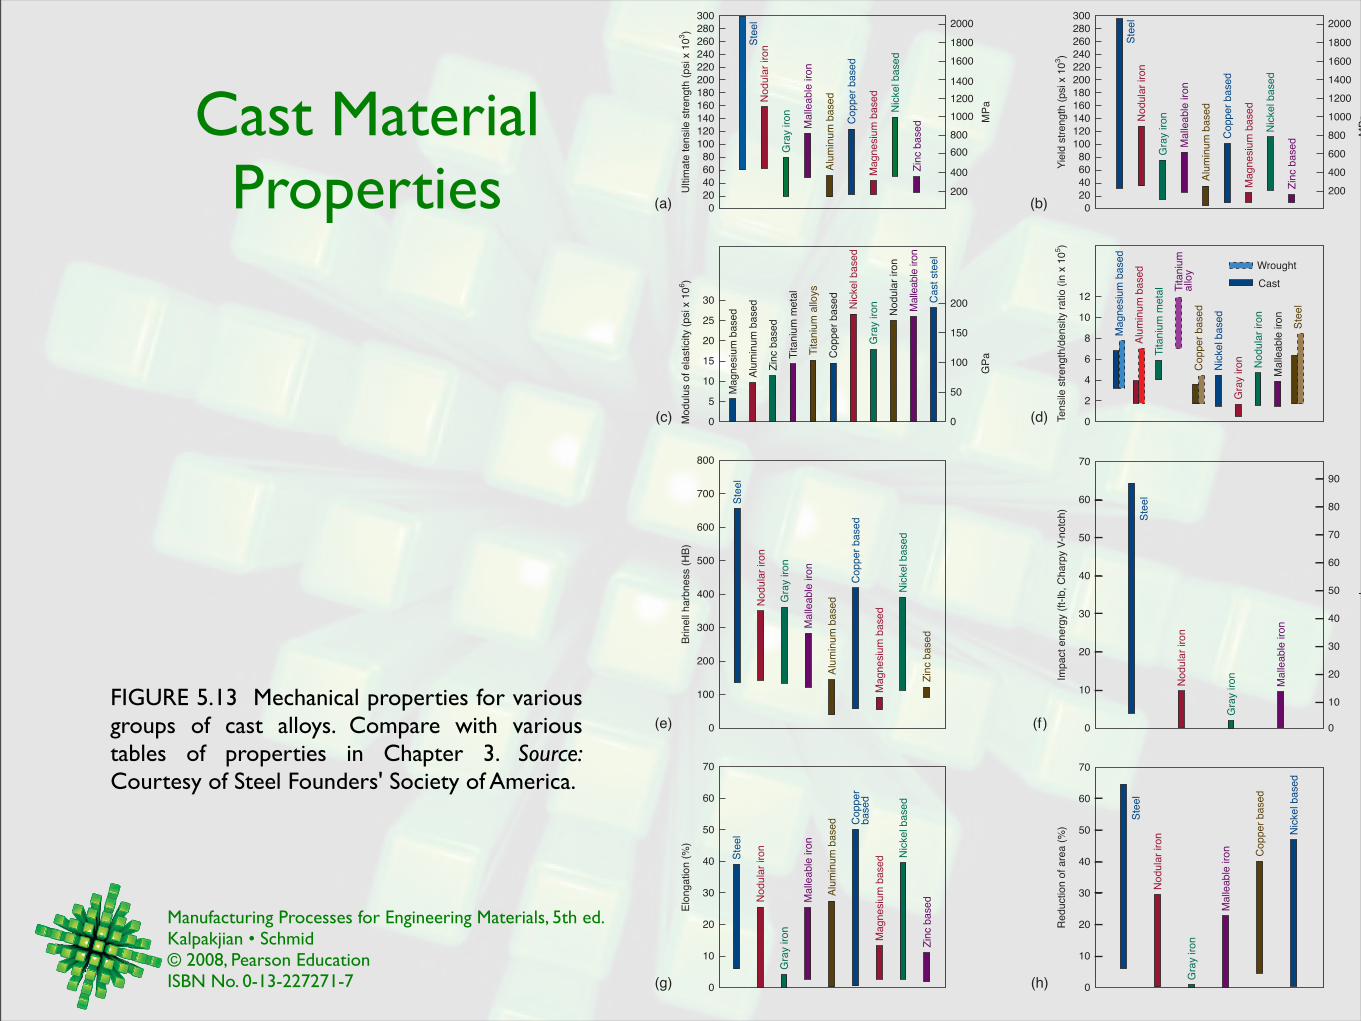
FIGURE 5.13 Mechanical properties for various groups of cast alloys. Compare with various tables of properties in Chapter 3. Source: Courtesy of Steel Founders' Society of America.
Ste
el
Nodula
r iron
Gra
y iro
n
Malle
able
iro
n
Alu
min
um
based
Copper
based
Magnesiu
m b
ased
Nic
kel based
Zin
c b
ased
Ultim
ate
tensile
str
ength
(psi x 1
03)
300
280
260
240
220
200
180
160
140
120
100
80
60
40
20
0
2000
1800
2000
1800
1600
1400
1200
1000
800
600
400
200
MP
a
(a)
300
280
260
240
220
200
180
160
140
120
100
80
60
40
20
0
1600
1400
1200
1000
800
600
400
200
Ste
el
Nodula
r iron
Gra
y iro
n
Malle
able
iro
n
Alu
min
um
based
Copper
based
Magnesiu
m b
ased
Nic
kel based
Zin
c b
ased
Yie
ld s
trength
(psi x 1
03)
MP
a
(b)
Nodula
r iron
Gra
y iro
n Malle
able
iron
Alu
min
um
based
Copper
based
Magnesiu
m b
ased
Nic
kel based
Zin
c b
ased
Titaniu
m m
eta
l
Titaniu
m a
lloys
Cast ste
el
0
5
10
20
25
30
15
0
50
100
200
150
GP
a
Modulu
s o
f ela
sticity (
psi x 1
06)
0
10
12
8
6
4
2
Wrought
Cast
Ste
el
Nodula
r iron
Gra
y iro
n
Malle
able
iro
n
Alu
min
um
based
Magnesiu
m b
ased
Titaniu
m m
eta
l Titaniu
mallo
y
Tensile
str
ength
/density r
atio (
in x
10
5)
(d)(c)
Nodula
r iron
Gra
y iro
n
Alu
min
um
based
Copper
based
Magnesiu
m b
ased
Nic
kel based
Zin
c b
ased
Ste
el
Malle
able
iro
n
800
700
600
500
400
300
200
100
0
Brinell
harb
ness (
HB
)
(e)
Malle
able
iro
n
70
60
50
40
30
20
10
0
90
80
70
60
50
40
30
20
10
0
Ste
el
Nodula
r iron
Gra
y iro
n
J
Impact energ
y (
ft-lb, C
harp
y V
-notc
h)
(f)
70
60
50
40
30
20
10
0
Nodula
r iron
Malle
able
iro
n
Copper
based
Nic
kel based
Ste
el
Gra
y iro
n
Copper
based
Nic
kel based
Reduction o
f are
a (
%)
(h)
Nodula
r iron
Gra
y iro
n
Alu
min
um
based C
opper
based
Magnesiu
m b
ased N
ickel based
Zin
c b
ased
Ste
el
Malle
able
iro
n
70
60
50
40
30
20
10
0
Elo
ngation (
%)
(g)
Manufacturing Processes for Engineering Materials, 5th ed. Kalpakjian • Schmid© 2008, Pearson EducationISBN No. 0-13-227271-7
General Characteristics of Casting
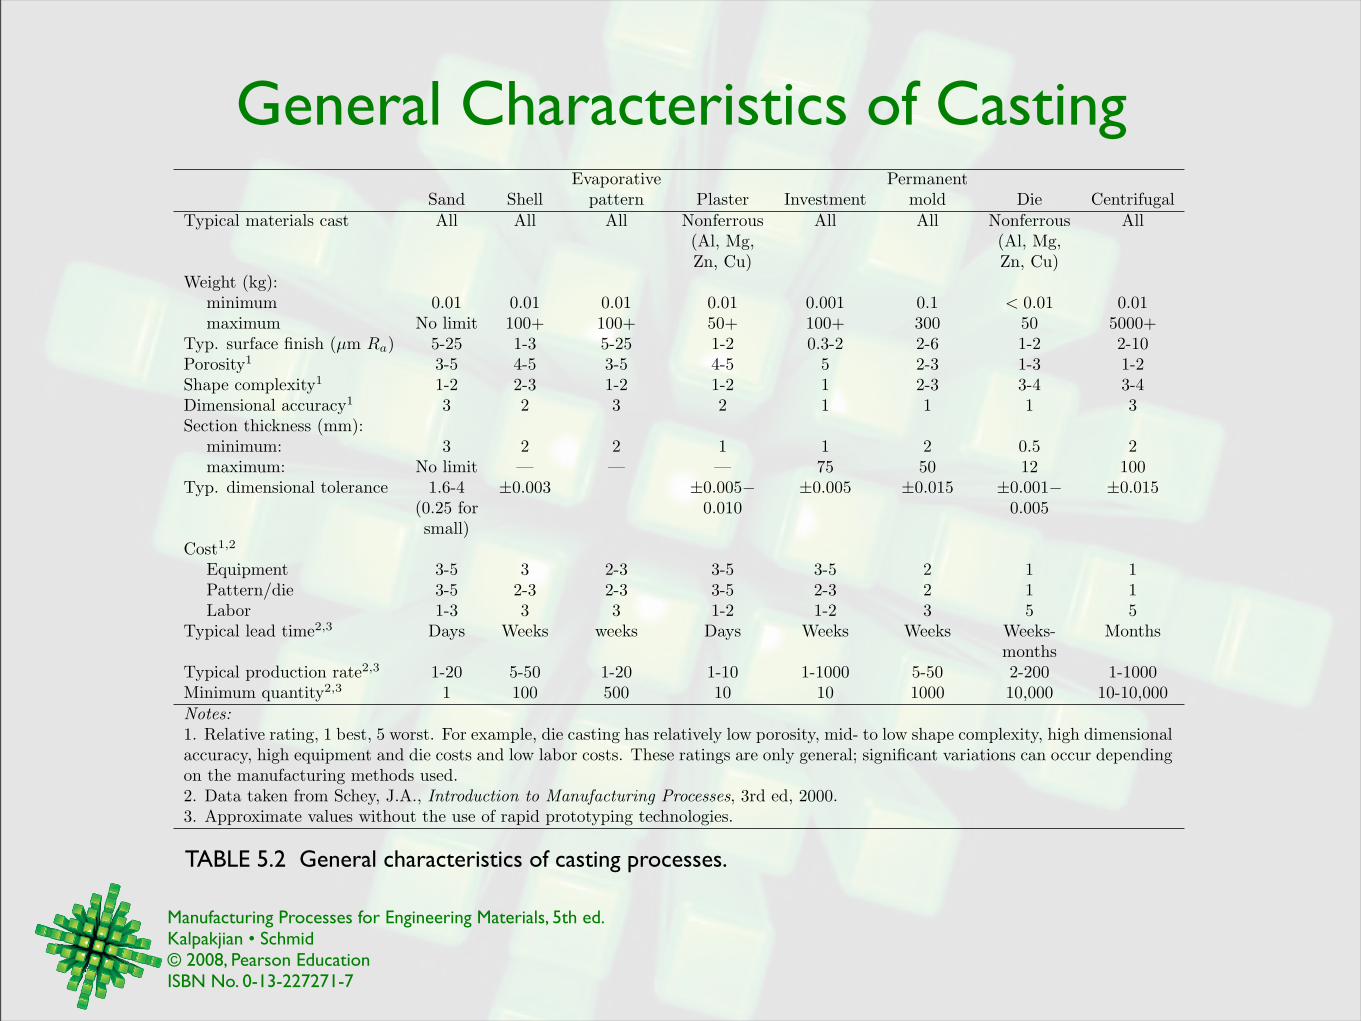
TABLE 5.2 General characteristics of casting processes.
Evaporative PermanentSand Shell pattern Plaster Investment mold Die Centrifugal
Typical materials cast All All All Nonferrous All All Nonferrous All(Al, Mg, (Al, Mg,Zn, Cu) Zn, Cu)
Weight (kg):minimum 0.01 0.01 0.01 0.01 0.001 0.1 < 0.01 0.01maximum No limit 100+ 100+ 50+ 100+ 300 50 5000+
Typ. surface finish (µm Ra) 5-25 1-3 5-25 1-2 0.3-2 2-6 1-2 2-10Porosity1 3-5 4-5 3-5 4-5 5 2-3 1-3 1-2Shape complexity1 1-2 2-3 1-2 1-2 1 2-3 3-4 3-4Dimensional accuracy1 3 2 3 2 1 1 1 3Section thickness (mm):
minimum: 3 2 2 1 1 2 0.5 2maximum: No limit — — — 75 50 12 100
Typ. dimensional tolerance 1.6-4 ±0.003 ±0.005! ±0.005 ±0.015 ±0.001! ±0.015(0.25 for 0.010 0.005small)
Cost1,2
Equipment 3-5 3 2-3 3-5 3-5 2 1 1Pattern/die 3-5 2-3 2-3 3-5 2-3 2 1 1Labor 1-3 3 3 1-2 1-2 3 5 5
Typical lead time2,3 Days Weeks weeks Days Weeks Weeks Weeks- Monthsmonths
Typical production rate2,3 1-20 5-50 1-20 1-10 1-1000 5-50 2-200 1-1000Minimum quantity2,3 1 100 500 10 10 1000 10,000 10-10,000Notes:1. Relative rating, 1 best, 5 worst. For example, die casting has relatively low porosity, mid- to low shape complexity, high dimensionalaccuracy, high equipment and die costs and low labor costs. These ratings are only general; significant variations can occur dependingon the manufacturing methods used.2. Data taken from Schey, J.A., Introduction to Manufacturing Processes, 3rd ed, 2000.3. Approximate values without the use of rapid prototyping technologies.
Manufacturing Processes for Engineering Materials, 5th ed. Kalpakjian • Schmid© 2008, Pearson EducationISBN No. 0-13-227271-7
Typical Applications & Characteristics
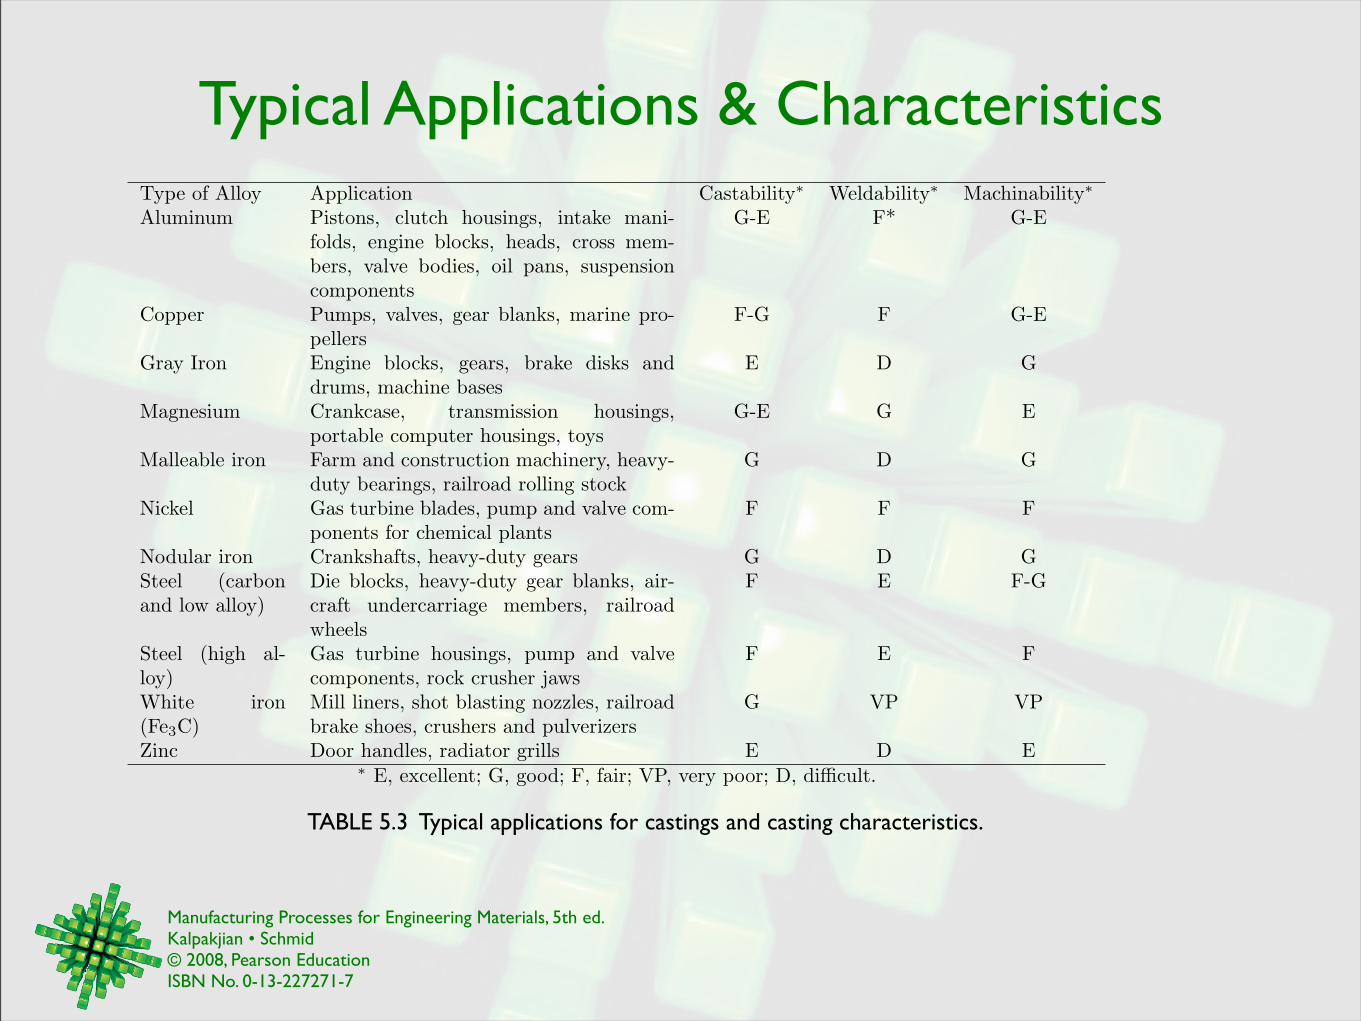
TABLE 5.3 Typical applications for castings and casting characteristics.
Type of Alloy Application Castability! Weldability! Machinability!Aluminum Pistons, clutch housings, intake mani-
folds, engine blocks, heads, cross mem-bers, valve bodies, oil pans, suspensioncomponents
G-E F* G-E
Copper Pumps, valves, gear blanks, marine pro-pellers
F-G F G-E
Gray Iron Engine blocks, gears, brake disks anddrums, machine bases
E D G
Magnesium Crankcase, transmission housings,portable computer housings, toys
G-E G E
Malleable iron Farm and construction machinery, heavy-duty bearings, railroad rolling stock
G D G
Nickel Gas turbine blades, pump and valve com-ponents for chemical plants
F F F
Nodular iron Crankshafts, heavy-duty gears G D GSteel (carbonand low alloy)
Die blocks, heavy-duty gear blanks, air-craft undercarriage members, railroadwheels
F E F-G
Steel (high al-loy)
Gas turbine housings, pump and valvecomponents, rock crusher jaws
F E F
White iron(Fe3C)
Mill liners, shot blasting nozzles, railroadbrake shoes, crushers and pulverizers
G VP VP
Zinc Door handles, radiator grills E D E! E, excellent; G, good; F, fair; VP, very poor; D, di!cult.
Manufacturing Processes for Engineering Materials, 5th ed. Kalpakjian • Schmid© 2008, Pearson EducationISBN No. 0-13-227271-7
Properties & Applications of Cast Iron
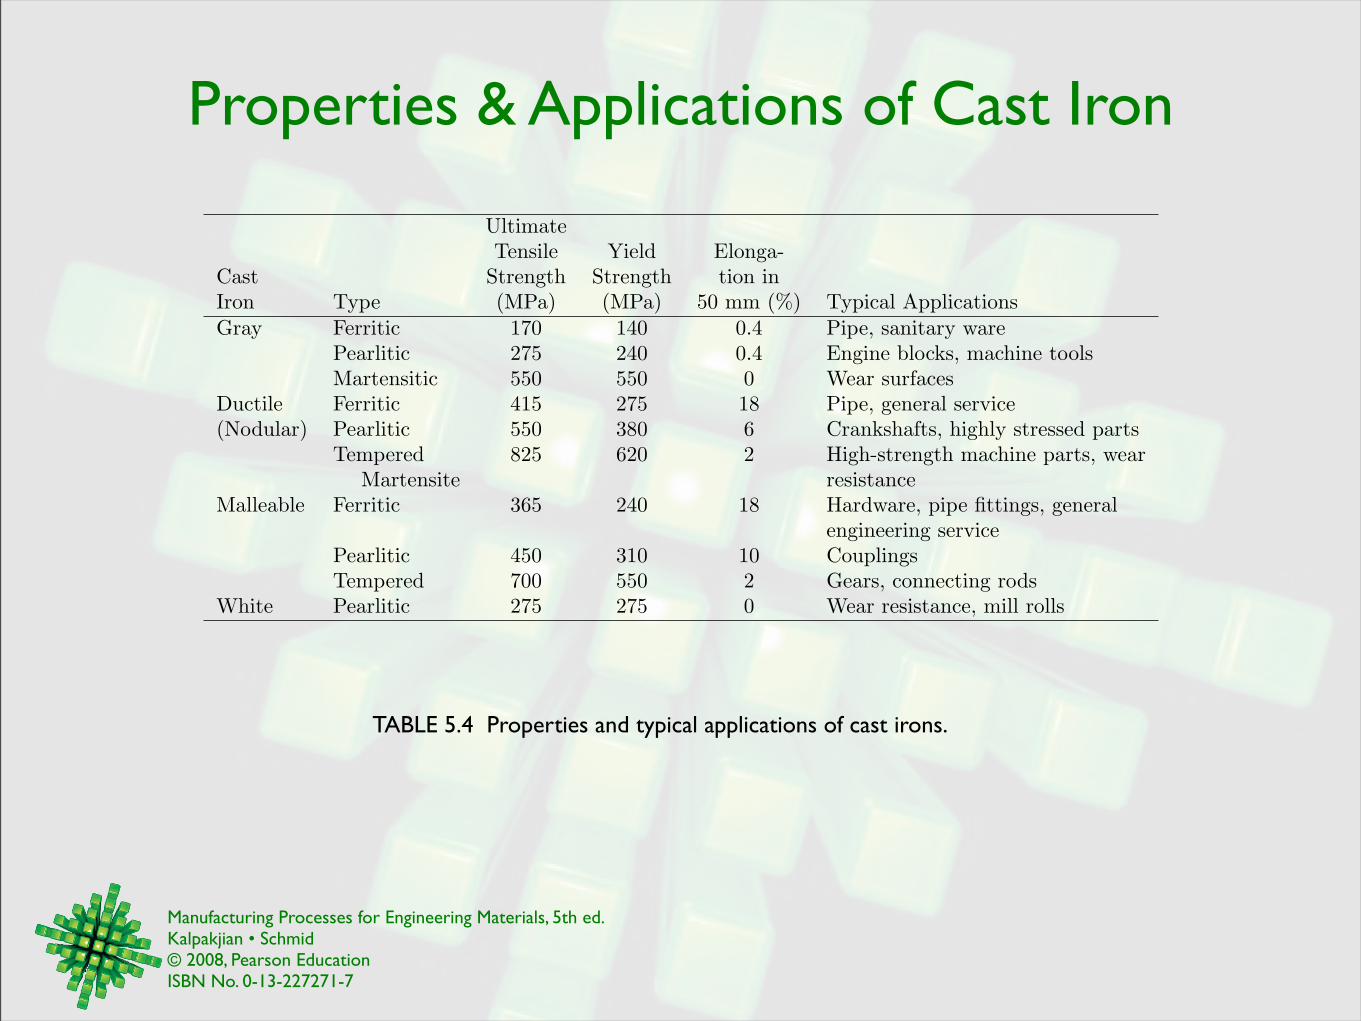
TABLE 5.4 Properties and typical applications of cast irons.
UltimateTensile Yield Elonga-
Cast Strength Strength tion inIron Type (MPa) (MPa) 50 mm (%) Typical ApplicationsGray Ferritic 170 140 0.4 Pipe, sanitary ware
Pearlitic 275 240 0.4 Engine blocks, machine toolsMartensitic 550 550 0 Wear surfaces
Ductile Ferritic 415 275 18 Pipe, general service(Nodular) Pearlitic 550 380 6 Crankshafts, highly stressed parts
Tempered 825 620 2 High-strength machine parts, wearMartensite resistance
Malleable Ferritic 365 240 18 Hardware, pipe fittings, generalengineering service
Pearlitic 450 310 10 CouplingsTempered 700 550 2 Gears, connecting rods
White Pearlitic 275 275 0 Wear resistance, mill rolls
Manufacturing Processes for Engineering Materials, 5th ed. Kalpakjian • Schmid© 2008, Pearson EducationISBN No. 0-13-227271-7
Nonferrous Alloys
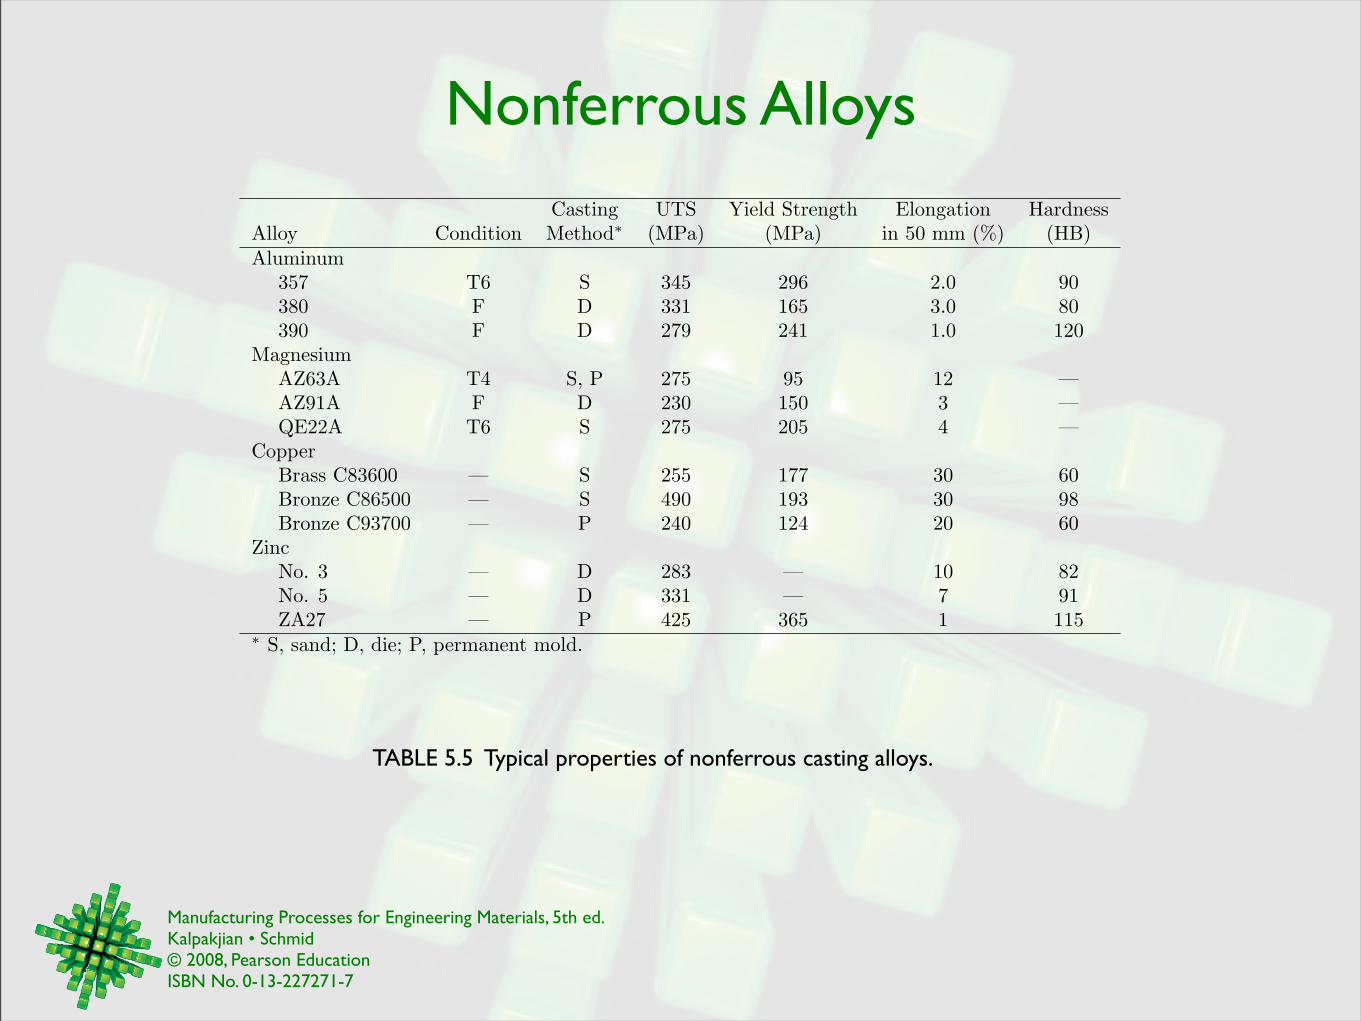
TABLE 5.5 Typical properties of nonferrous casting alloys.
Casting UTS Yield Strength Elongation HardnessAlloy Condition Method! (MPa) (MPa) in 50 mm (%) (HB)Aluminum
357 T6 S 345 296 2.0 90380 F D 331 165 3.0 80390 F D 279 241 1.0 120
MagnesiumAZ63A T4 S, P 275 95 12 —AZ91A F D 230 150 3 —QE22A T6 S 275 205 4 —
CopperBrass C83600 — S 255 177 30 60Bronze C86500 — S 490 193 30 98Bronze C93700 — P 240 124 20 60
ZincNo. 3 — D 283 — 10 82No. 5 — D 331 — 7 91ZA27 — P 425 365 1 115
! S, sand; D, die; P, permanent mold.
Manufacturing Processes for Engineering Materials, 5th ed. Kalpakjian • Schmid© 2008, Pearson EducationISBN No. 0-13-227271-7
Microstructure for Cast Irons
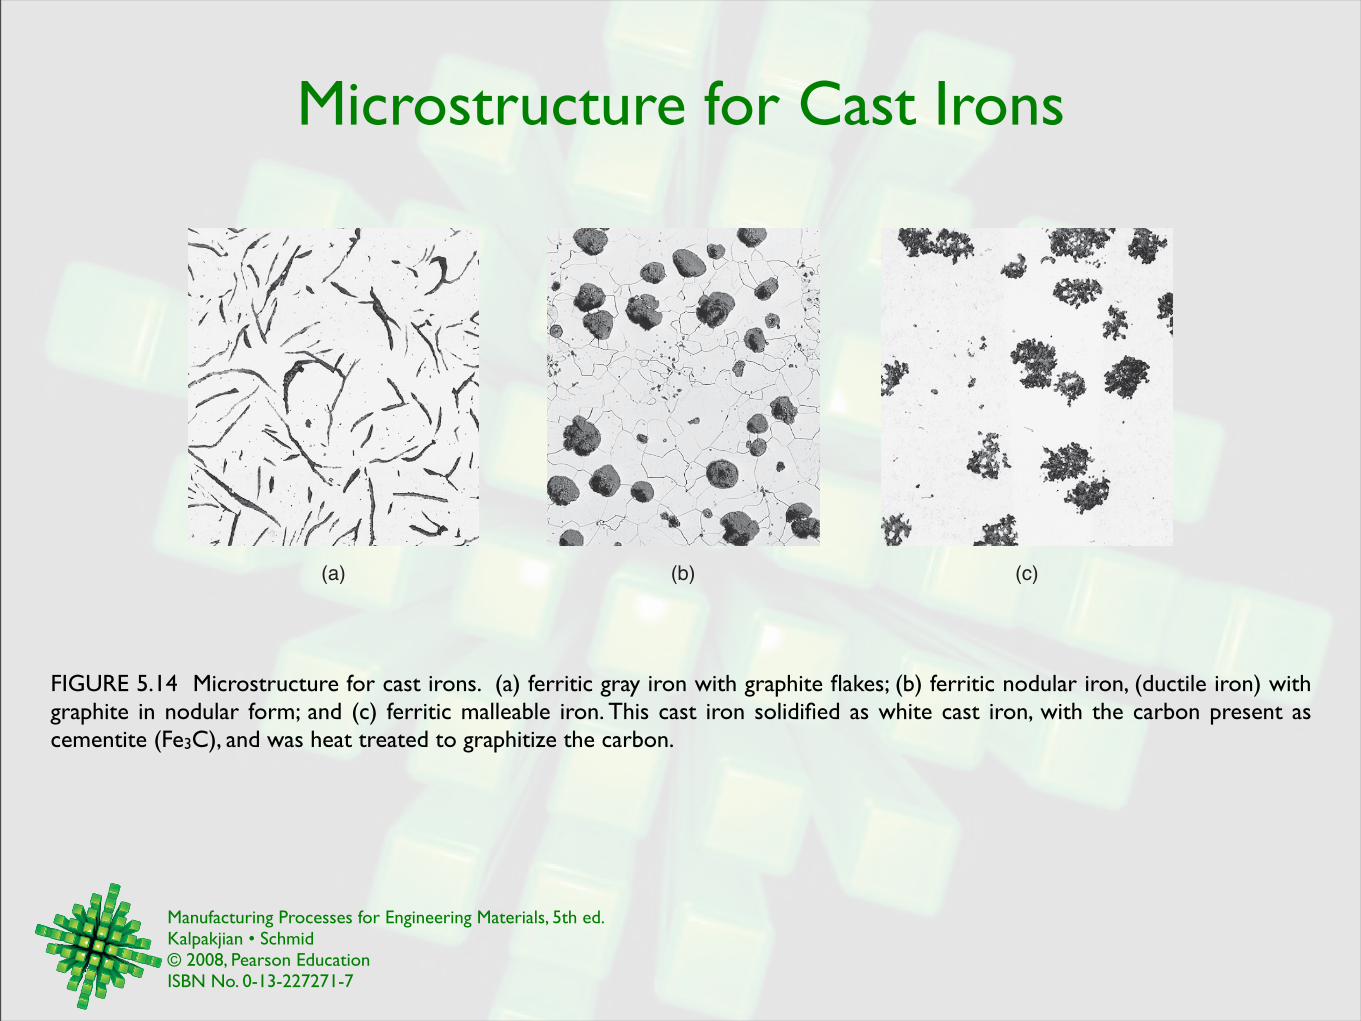
FIGURE 5.14 Microstructure for cast irons. (a) ferritic gray iron with graphite flakes; (b) ferritic nodular iron, (ductile iron) with graphite in nodular form; and (c) ferritic malleable iron. This cast iron solidified as white cast iron, with the carbon present as cementite (Fe3C), and was heat treated to graphitize the carbon.
(a) (b) (c)
Manufacturing Processes for Engineering Materials, 5th ed. Kalpakjian • Schmid© 2008, Pearson EducationISBN No. 0-13-227271-7
Continuous-Casting
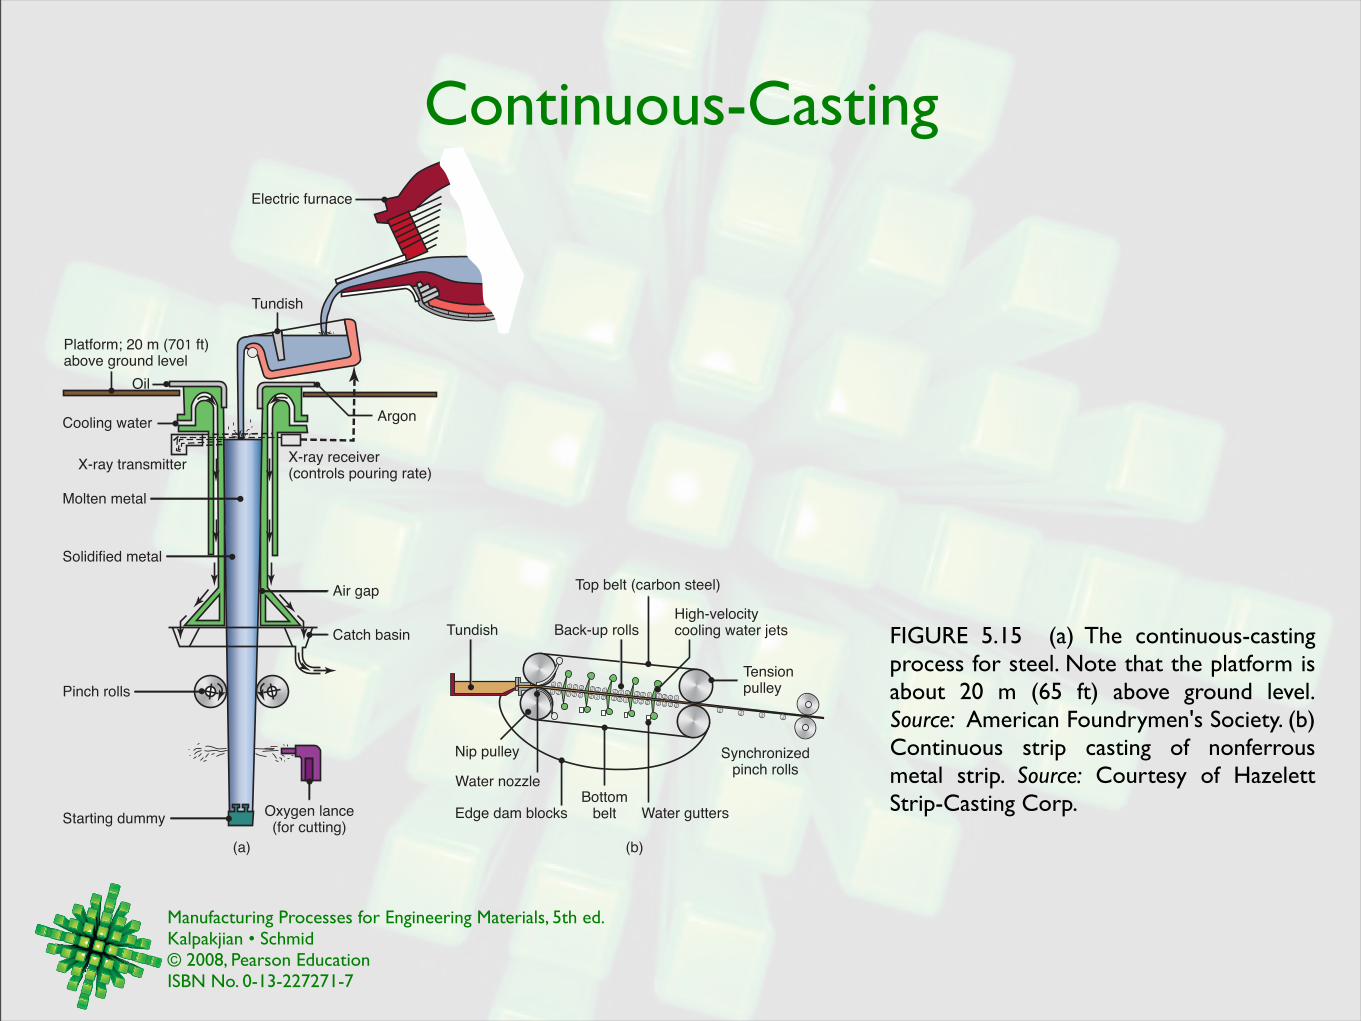
FIGURE 5.15 (a) The continuous-casting process for steel. Note that the platform is about 20 m (65 ft) above ground level. Source: American Foundrymen's Society. (b) Continuous strip casting of nonferrous metal strip. Source: Courtesy of Hazelett Strip-Casting Corp.
Electric furnace
Tundish
Argon
X-ray receiver(controls pouring rate)
X-ray transmitter
Molten metal
Solidified metal
Oil
Cooling water
Platform; 20 m (701 ft)above ground level
Air gap
Catch basin
Pinch rolls
Oxygen lance(for cutting)
Starting dummy
Tundish
Top belt (carbon steel)
High-velocitycooling water jetsBack-up rolls
Bottombelt Water gutters
Nip pulley Synchronizedpinch rolls
Tensionpulley
Edge dam blocks
Water nozzle
(a) (b)
Manufacturing Processes for Engineering Materials, 5th ed. Kalpakjian • Schmid© 2008, Pearson EducationISBN No. 0-13-227271-7
Sand Casting
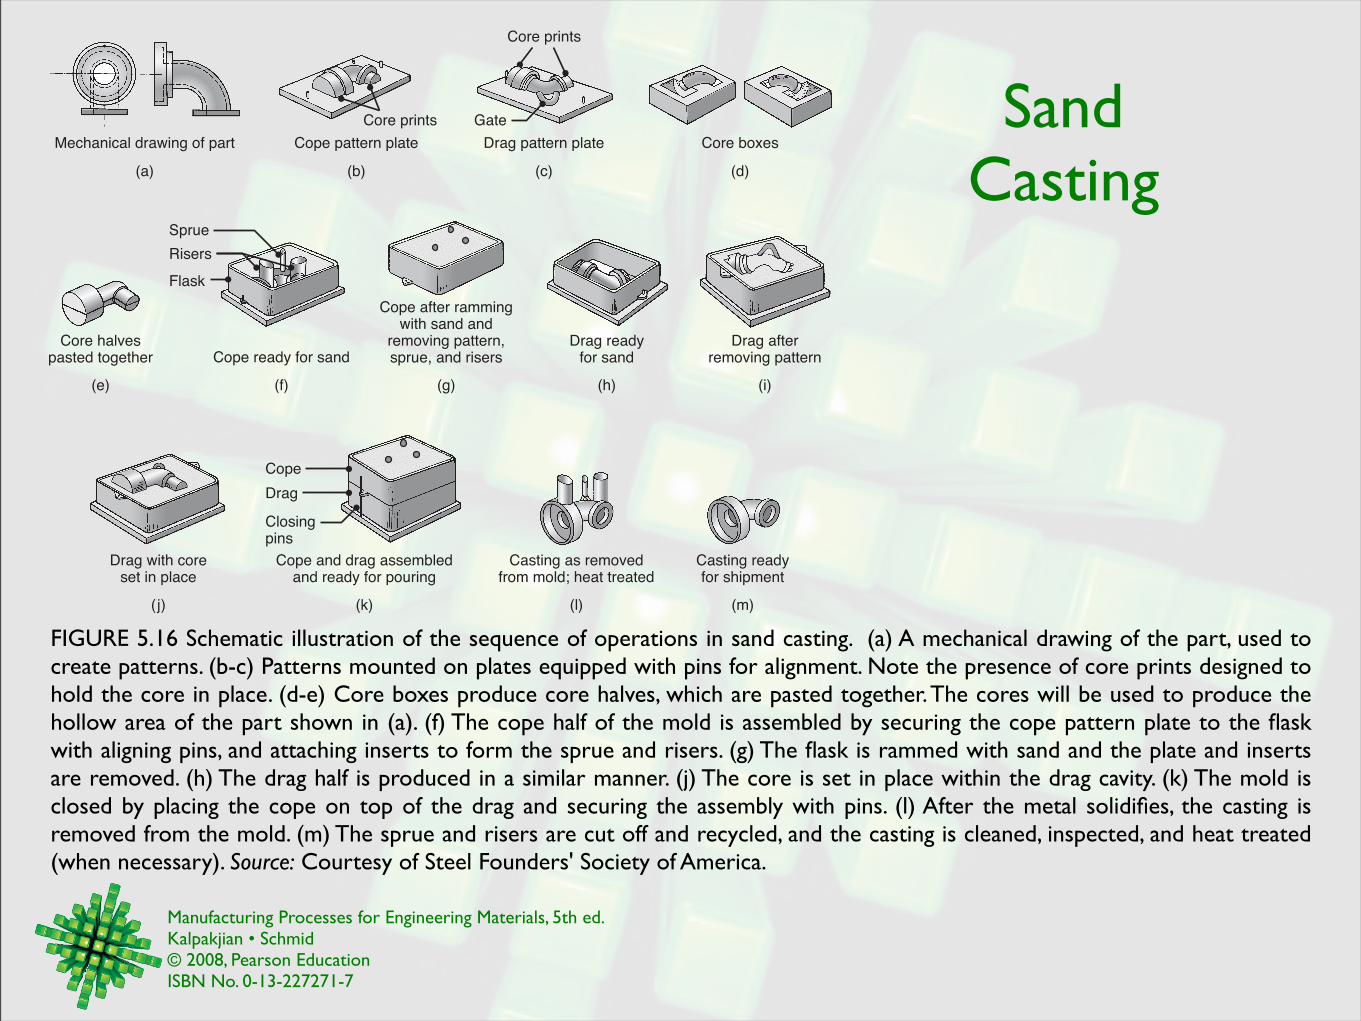
FIGURE 5.16 Schematic illustration of the sequence of operations in sand casting. (a) A mechanical drawing of the part, used to create patterns. (b-c) Patterns mounted on plates equipped with pins for alignment. Note the presence of core prints designed to hold the core in place. (d-e) Core boxes produce core halves, which are pasted together. The cores will be used to produce the hollow area of the part shown in (a). (f) The cope half of the mold is assembled by securing the cope pattern plate to the flask with aligning pins, and attaching inserts to form the sprue and risers. (g) The flask is rammed with sand and the plate and inserts are removed. (h) The drag half is produced in a similar manner. (j) The core is set in place within the drag cavity. (k) The mold is closed by placing the cope on top of the drag and securing the assembly with pins. (l) After the metal solidifies, the casting is removed from the mold. (m) The sprue and risers are cut off and recycled, and the casting is cleaned, inspected, and heat treated (when necessary). Source: Courtesy of Steel Founders' Society of America.
Cope ready for sand
Cope after rammingwith sand and
removing pattern,sprue, and risers
Drag readyfor sand
Drag afterremoving pattern
Core halvespasted together
(e) (f) (g) (h) (i)
Sprue
Risers
Flask
Drag with coreset in place
(j)
Cope and drag assembledand ready for pouring
(k)
Cope
Drag
Closingpins
Casting as removedfrom mold; heat treated
(l)
Casting readyfor shipment
(m)
(a)
Mechanical drawing of part Core boxesCope pattern plate Drag pattern plate
(d)(b) (c)
Core prints Gate
Core prints
Manufacturing Processes for Engineering Materials, 5th ed. Kalpakjian • Schmid© 2008, Pearson EducationISBN No. 0-13-227271-7
Shell-Molding Process
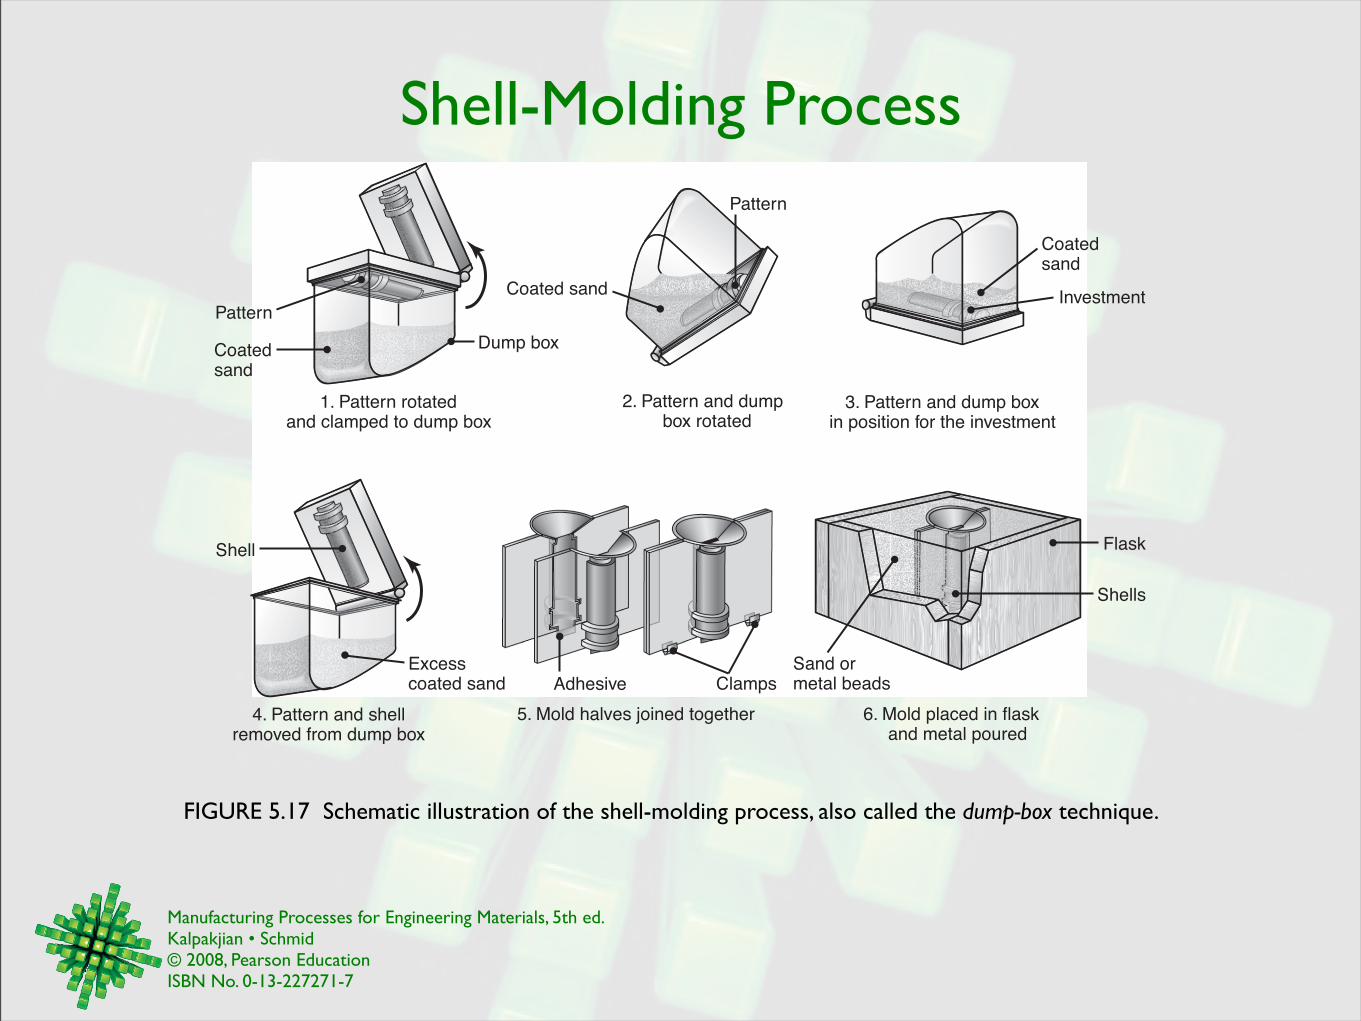
FIGURE 5.17 Schematic illustration of the shell-molding process, also called the dump-box technique.
Pattern
Coatedsand
Dump box
1. Pattern rotatedand clamped to dump box
Shell
Excesscoated sand
4. Pattern and shellremoved from dump box
Coatedsand
3. Pattern and dump boxin position for the investment
Investment
Pattern
Coated sand
2. Pattern and dumpbox rotated
Adhesive Clamps
5. Mold halves joined together
Flask
Sand ormetal beads
Shells
6. Mold placed in flaskand metal poured
Manufacturing Processes for Engineering Materials, 5th ed. Kalpakjian • Schmid© 2008, Pearson EducationISBN No. 0-13-227271-7
Caramic Mold Manufacture
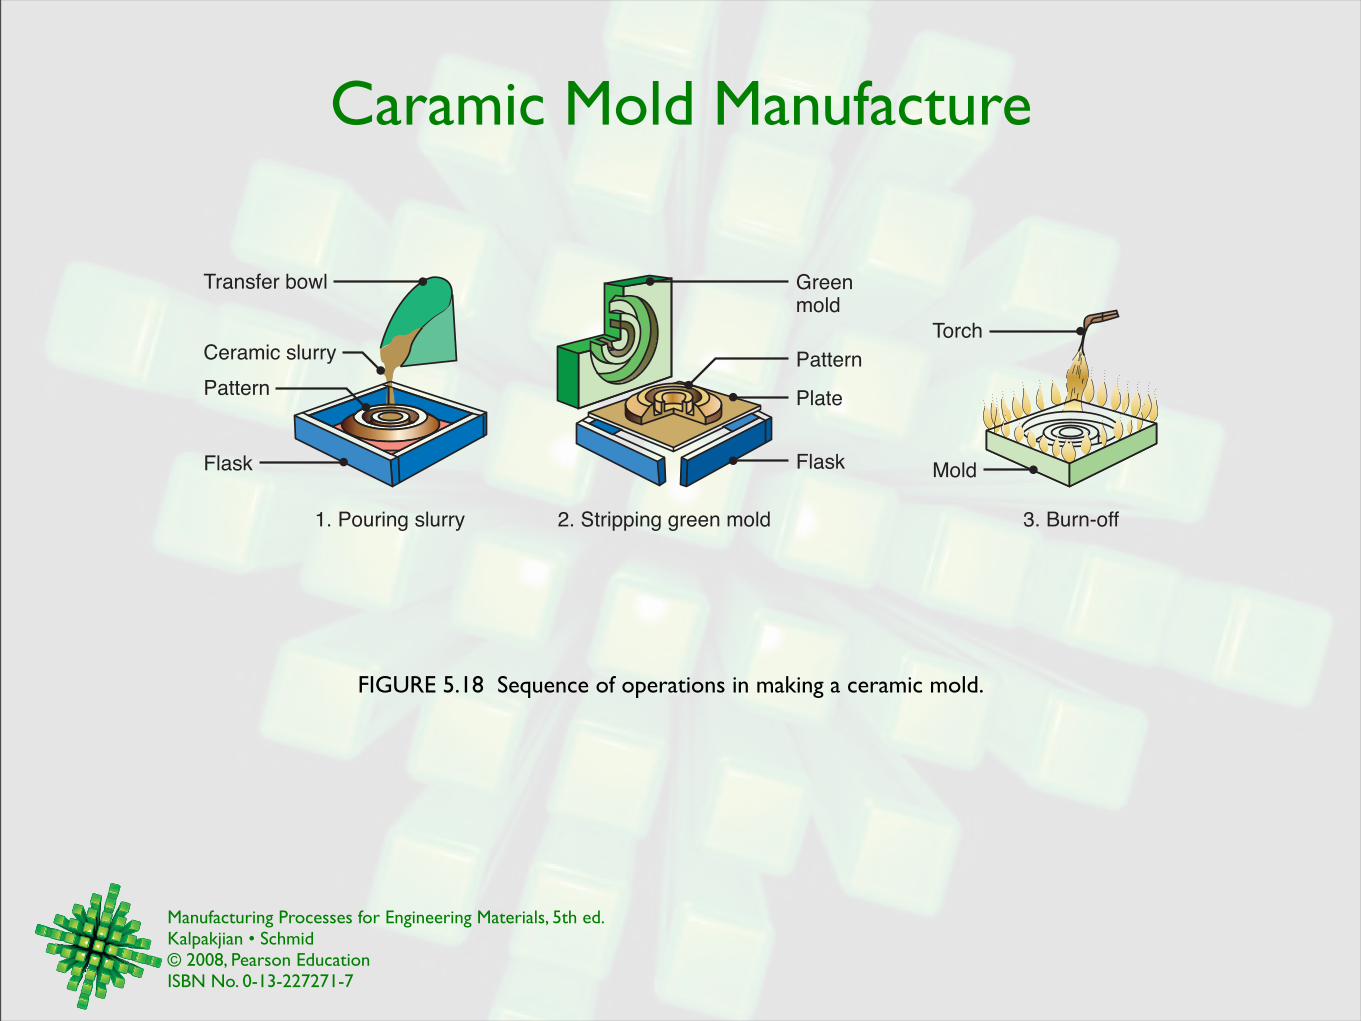
FIGURE 5.18 Sequence of operations in making a ceramic mold.
3. Burn-off2. Stripping green mold1. Pouring slurry
Flask
Greenmold
Pattern
Plate
Ceramic slurry
Pattern
Transfer bowl
Flask
Torch
Mold
Manufacturing Processes for Engineering Materials, 5th ed. Kalpakjian • Schmid© 2008, Pearson EducationISBN No. 0-13-227271-7
Vacuum-Casting Process
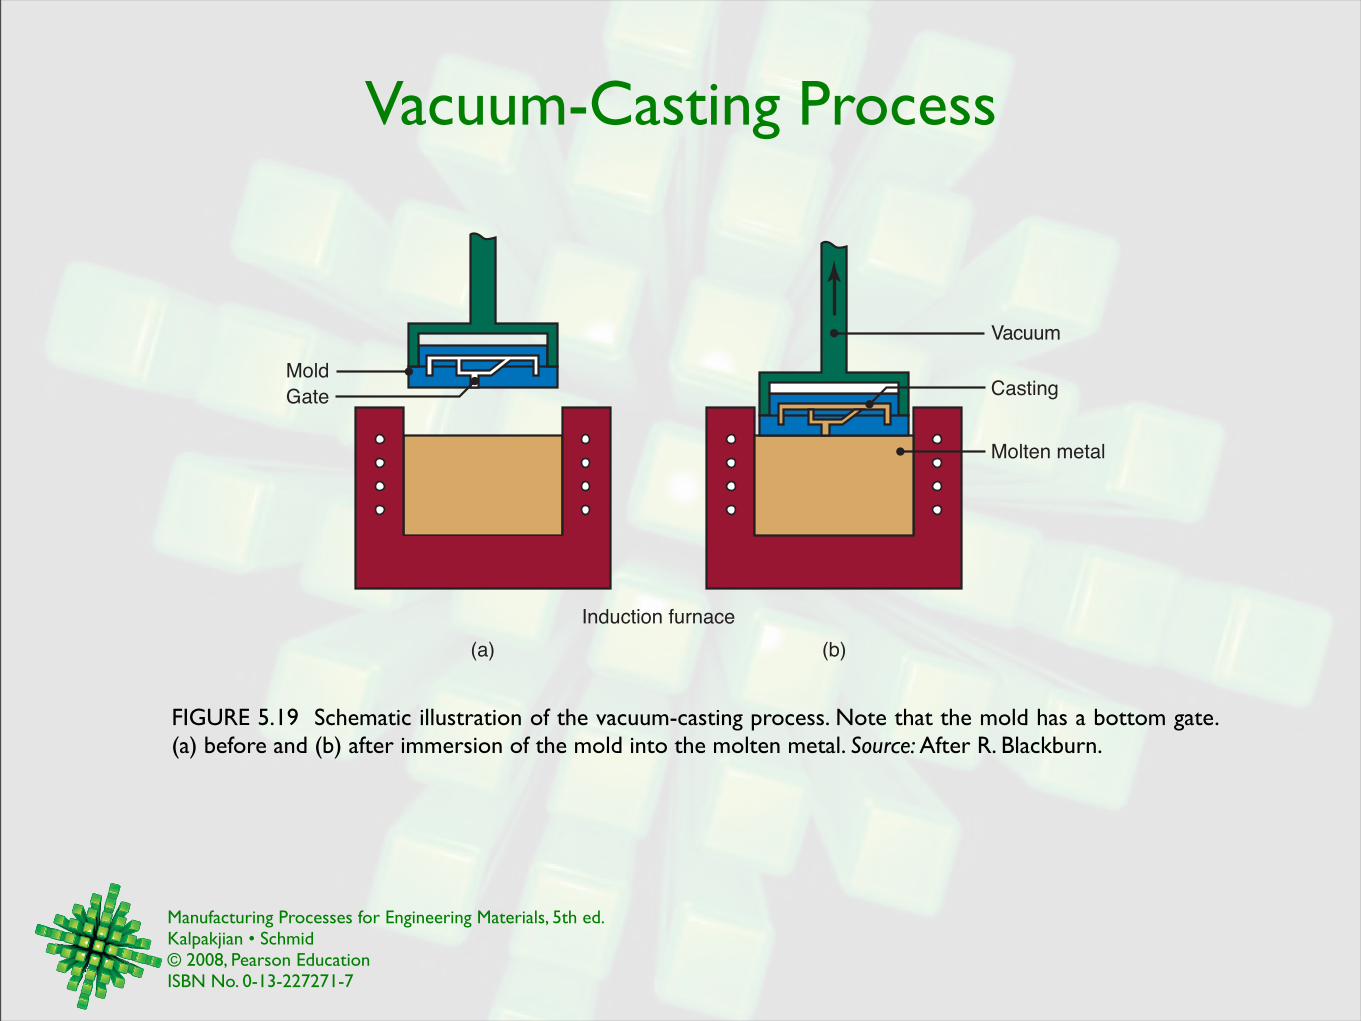
FIGURE 5.19 Schematic illustration of the vacuum-casting process. Note that the mold has a bottom gate. (a) before and (b) after immersion of the mold into the molten metal. Source: After R. Blackburn.
Mold
(a) (b)
Induction furnace
Vacuum
Casting
Molten metal
Gate
Manufacturing Processes for Engineering Materials, 5th ed. Kalpakjian • Schmid© 2008, Pearson EducationISBN No. 0-13-227271-7
Evaporative Pattern Casting
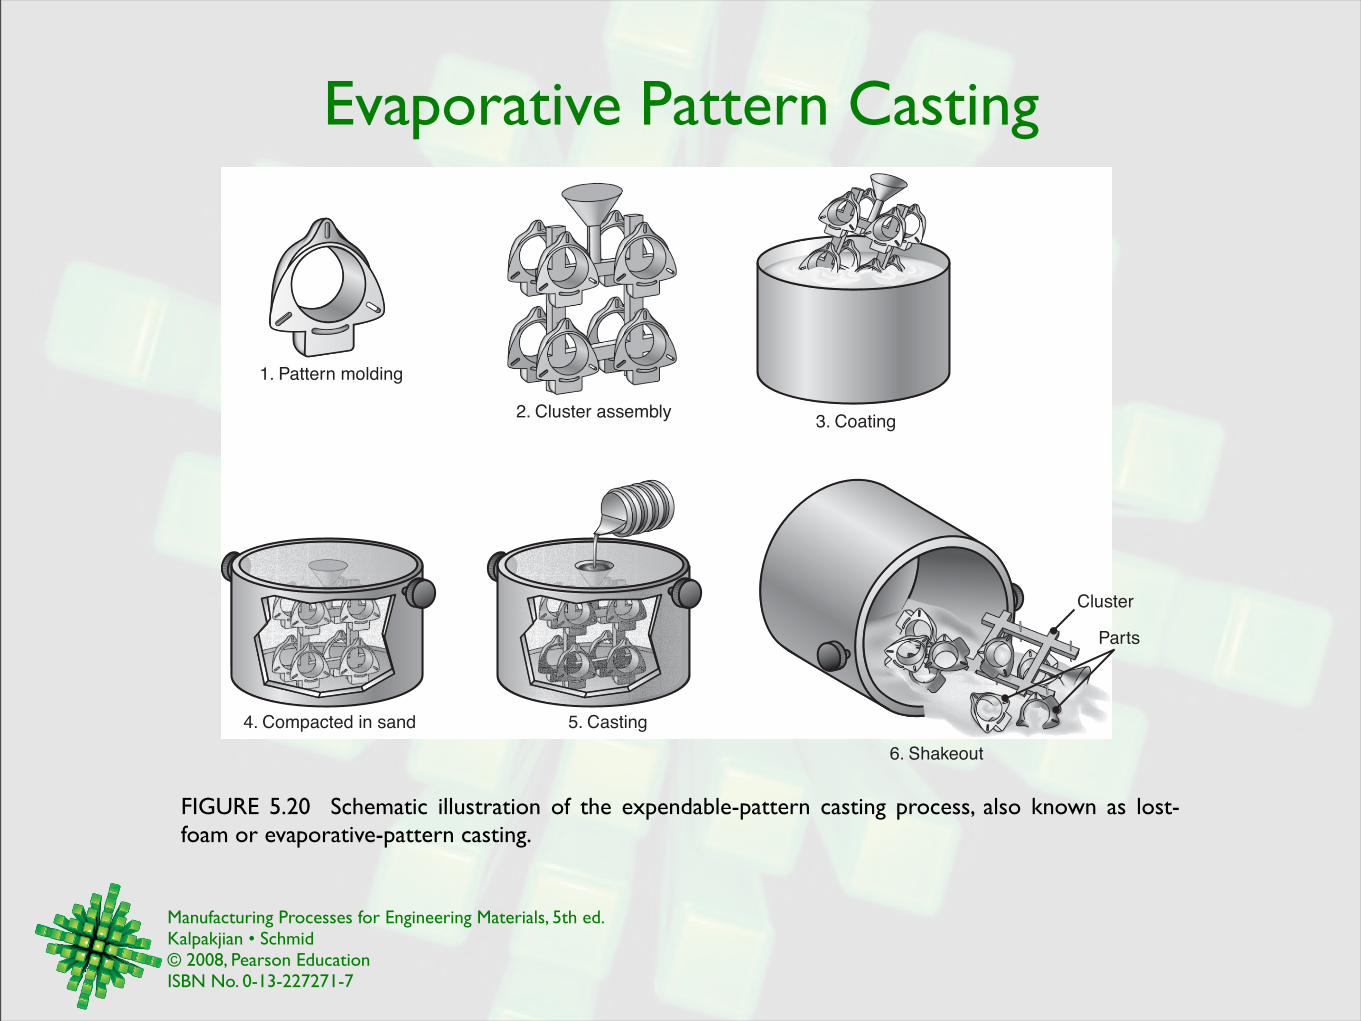
FIGURE 5.20 Schematic illustration of the expendable-pattern casting process, also known as lost-foam or evaporative-pattern casting.
1. Pattern molding
4. Compacted in sand 5. Casting
6. Shakeout
2. Cluster assembly3. Coating
Cluster
Parts
Manufacturing Processes for Engineering Materials, 5th ed. Kalpakjian • Schmid© 2008, Pearson EducationISBN No. 0-13-227271-7
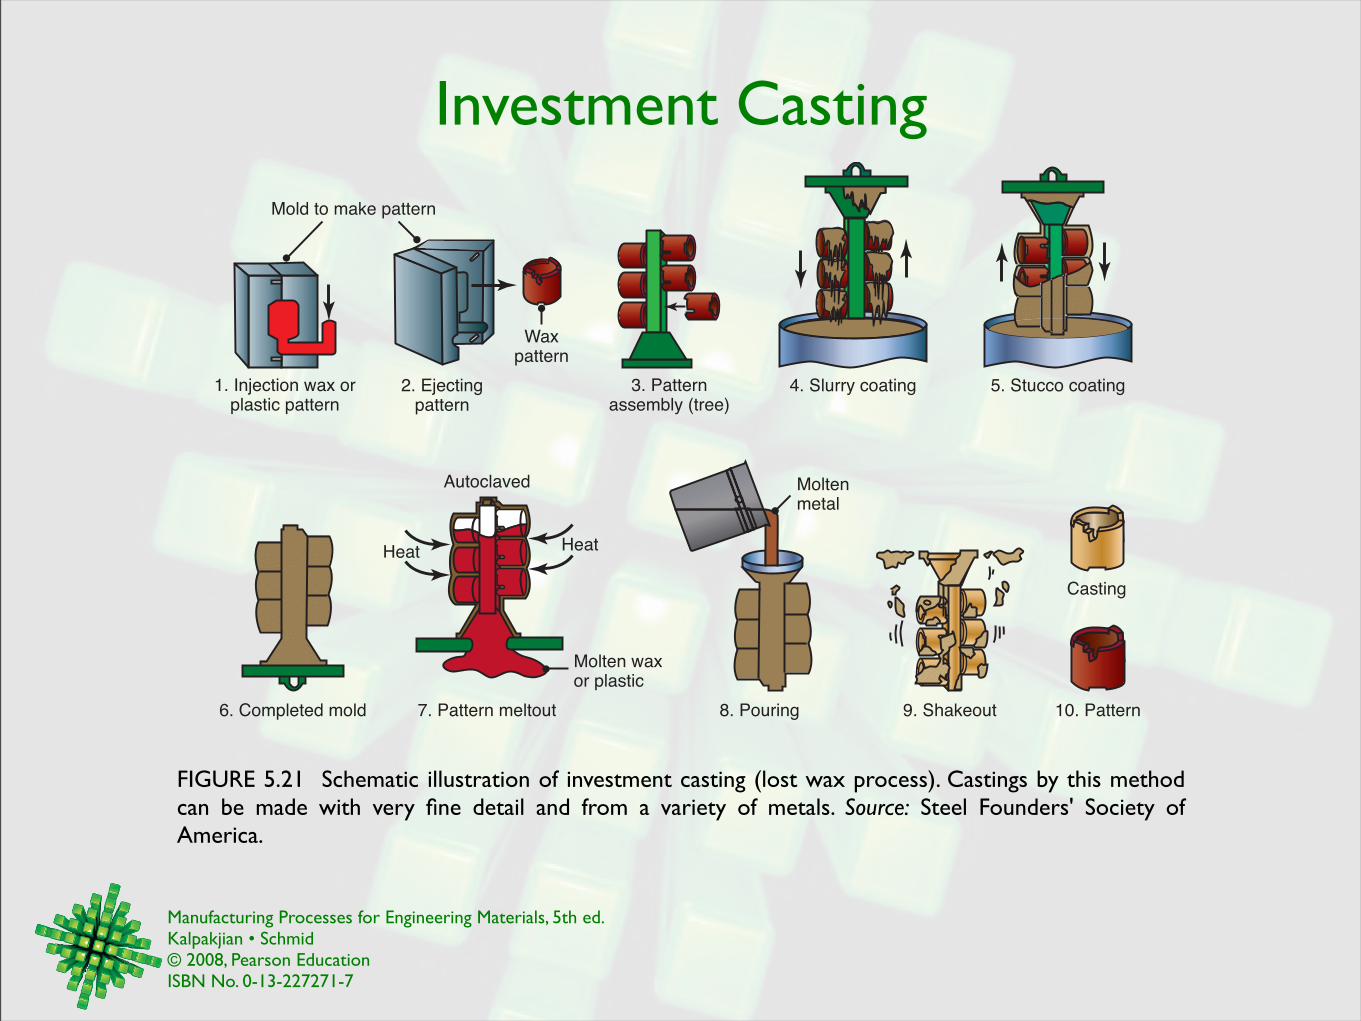
Investment Casting
FIGURE 5.21 Schematic illustration of investment casting (lost wax process). Castings by this method can be made with very fine detail and from a variety of metals. Source: Steel Founders' Society of America.
9. Shakeout8. Pouring7. Pattern meltout6. Completed mold
Casting
10. Pattern
Moltenmetal
Autoclaved
Molten waxor plastic
Heat Heat
1. Injection wax orplastic pattern
4. Slurry coating2. Ejectingpattern
5. Stucco coating3. Patternassembly (tree)
Waxpattern
Mold to make pattern
Manufacturing Processes for Engineering Materials, 5th ed. Kalpakjian • Schmid© 2008, Pearson EducationISBN No. 0-13-227271-7
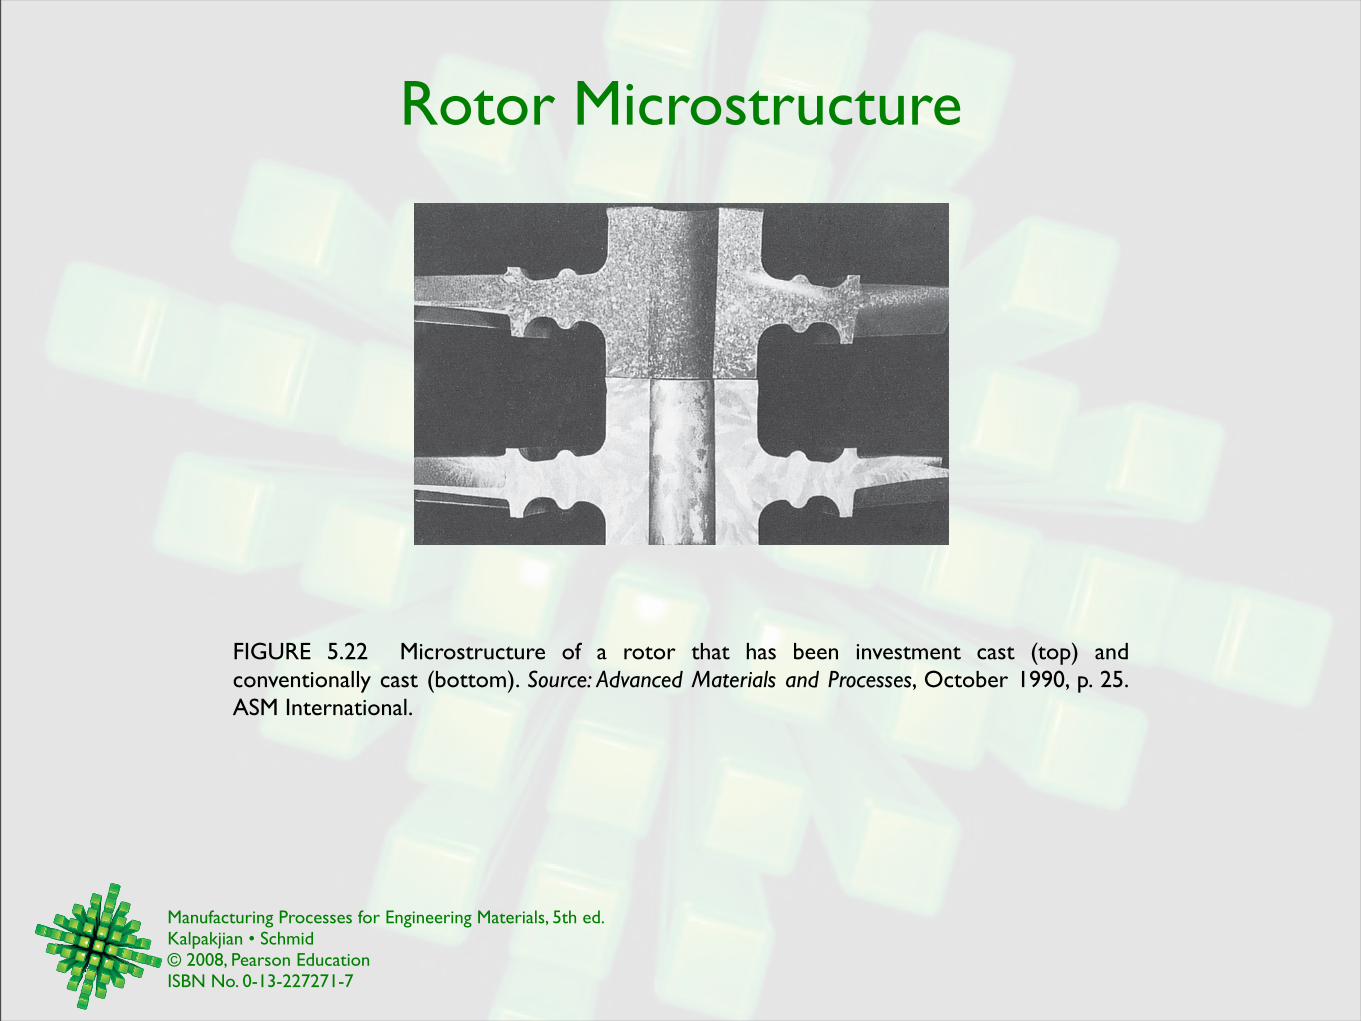
Rotor Microstructure
FIGURE 5.22 Microstructure of a rotor that has been investment cast (top) and conventionally cast (bottom). Source: Advanced Materials and Processes, October 1990, p. 25. ASM International.
Manufacturing Processes for Engineering Materials, 5th ed. Kalpakjian • Schmid© 2008, Pearson EducationISBN No. 0-13-227271-7
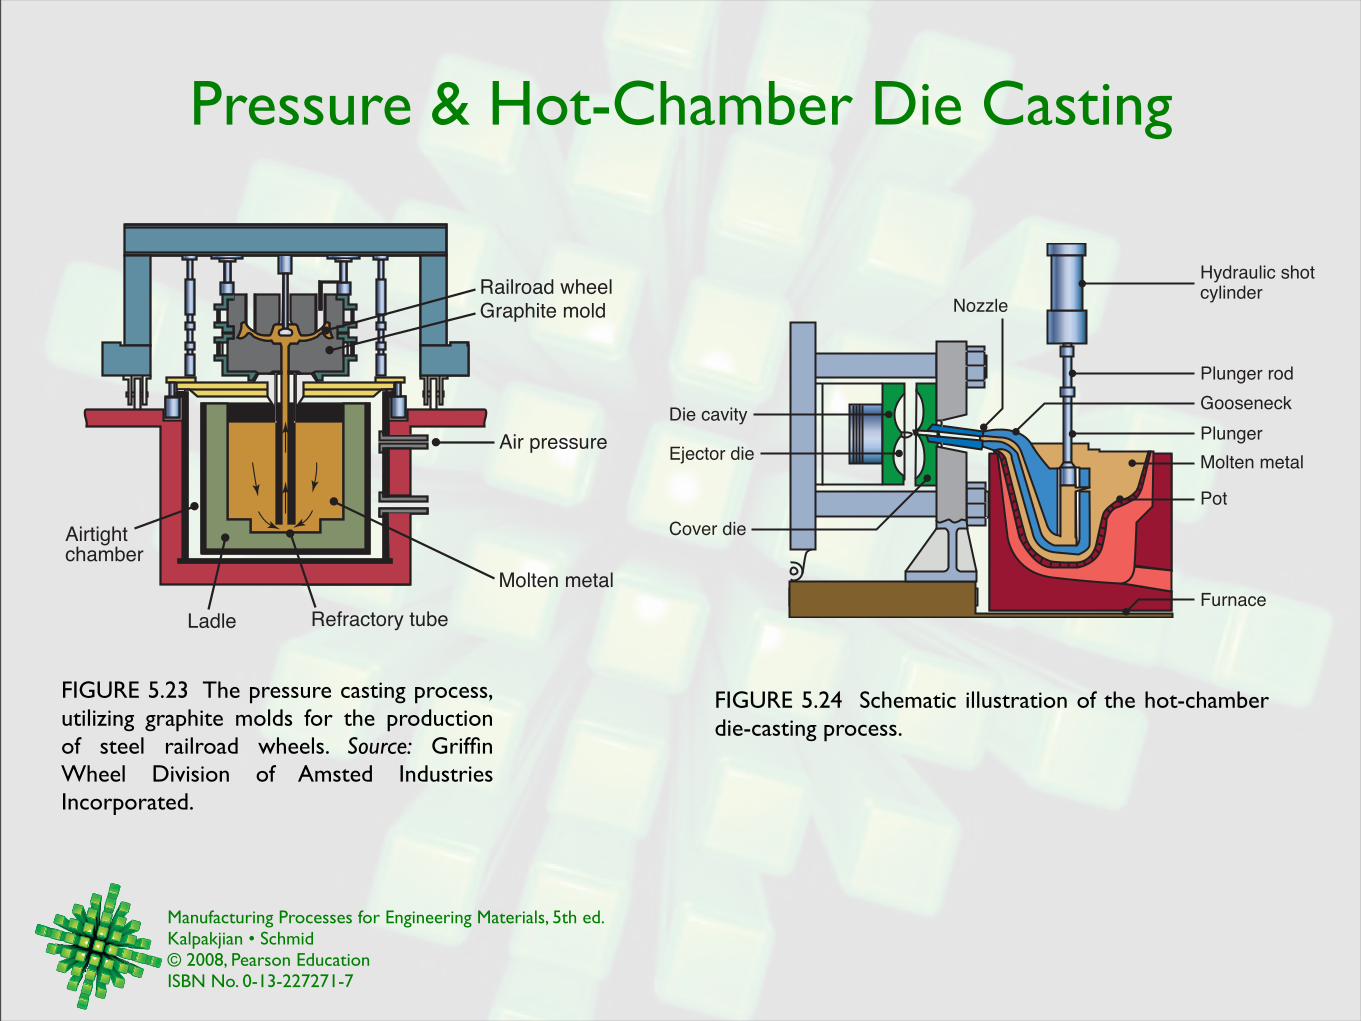
Pressure & Hot-Chamber Die Casting
FIGURE 5.23 The pressure casting process, utilizing graphite molds for the production of steel railroad wheels. Source: Griffin Wheel Division of Amsted Industries Incorporated.
Airtightchamber
Ladle Refractory tube
Molten metal
Air pressure
Railroad wheelGraphite mold
FIGURE 5.24 Schematic illustration of the hot-chamber die-casting process.
Gooseneck
Nozzle
Die cavity
Hydraulic shotcylinder
Plunger rod
Plunger
Molten metal
Pot
Ejector die
Cover die
Furnace
Manufacturing Processes for Engineering Materials, 5th ed. Kalpakjian • Schmid© 2008, Pearson EducationISBN No. 0-13-227271-7
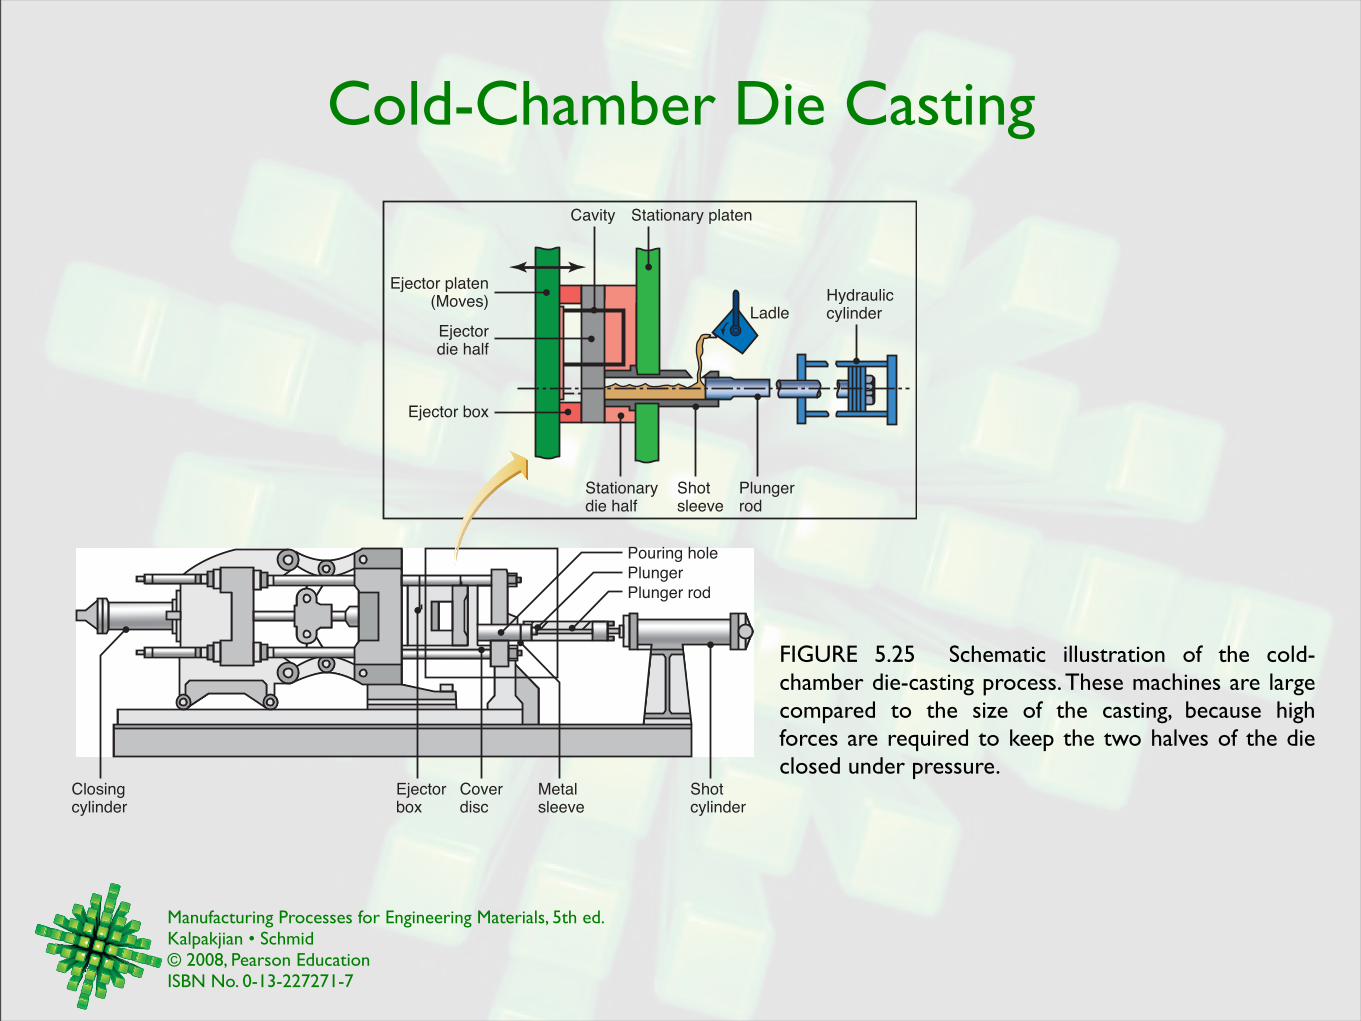
Cold-Chamber Die Casting
FIGURE 5.25 Schematic illustration of the cold-chamber die-casting process. These machines are large compared to the size of the casting, because high forces are required to keep the two halves of the die closed under pressure.
Shotcylinder
Metalsleeve
Coverdisc
Closingcylinder
Ejectorbox
Ejector platen(Moves)
Ejectordie half
Hydrauliccylinder
Shotsleeve
Ejector box
Ladle
Stationarydie half
Plungerrod
Stationary platenCavity
Pouring hole
Plunger
Plunger rod
Manufacturing Processes for Engineering Materials, 5th ed. Kalpakjian • Schmid© 2008, Pearson EducationISBN No. 0-13-227271-7
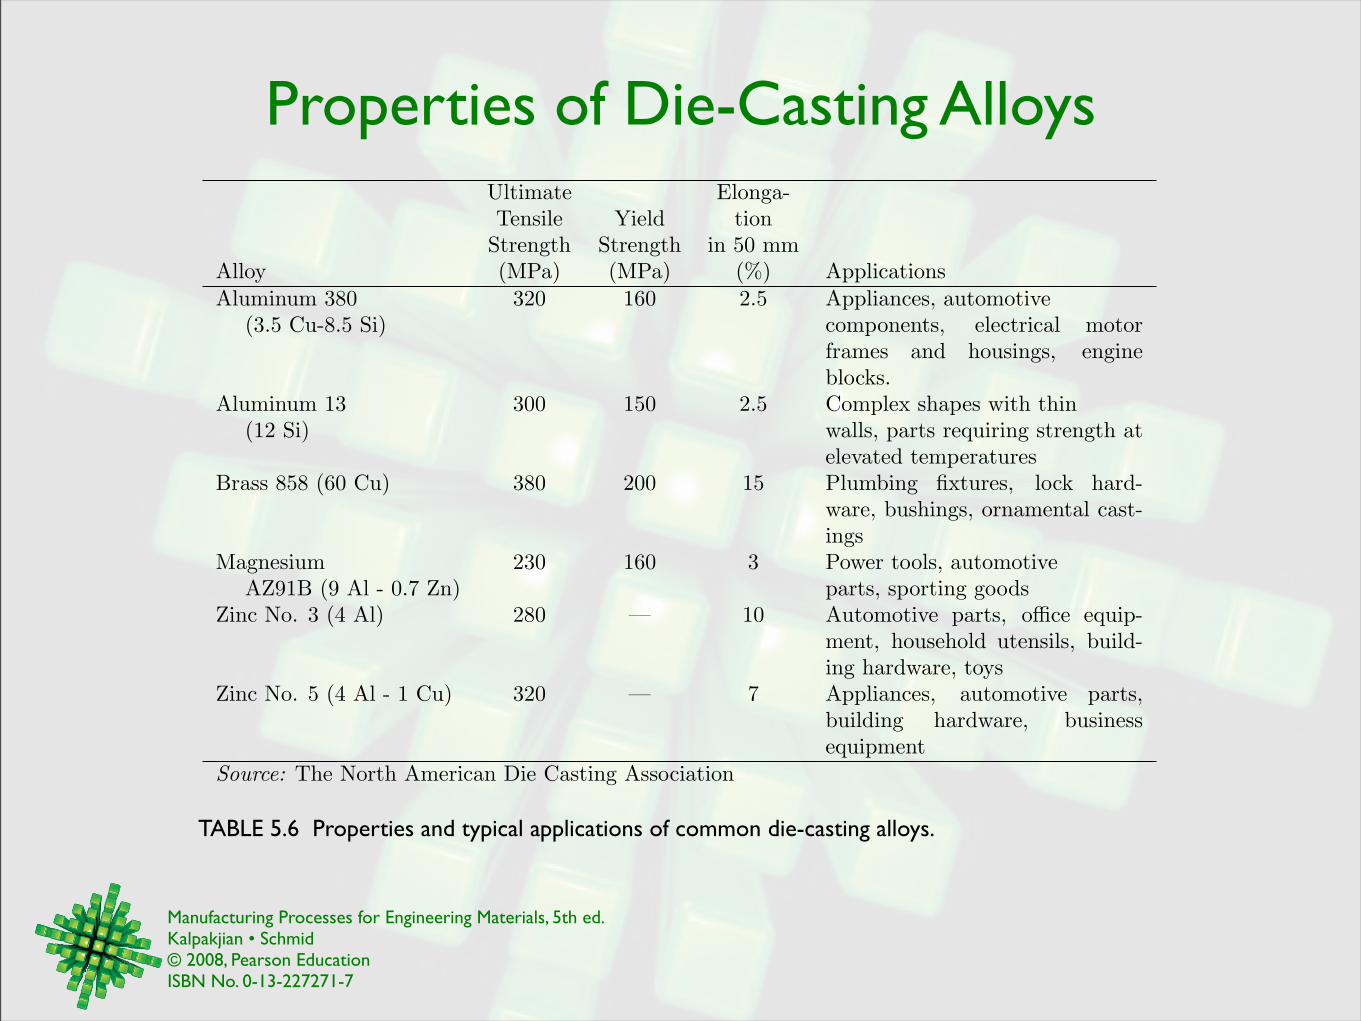
Properties of Die-Casting AlloysUltimate Elonga-Tensile Yield tion
Strength Strength in 50 mmAlloy (MPa) (MPa) (%) ApplicationsAluminum 380 320 160 2.5 Appliances, automotive
(3.5 Cu-8.5 Si) components, electrical motorframes and housings, engineblocks.
Aluminum 13 300 150 2.5 Complex shapes with thin(12 Si) walls, parts requiring strength at
elevated temperaturesBrass 858 (60 Cu) 380 200 15 Plumbing fixtures, lock hard-
ware, bushings, ornamental cast-ings
Magnesium 230 160 3 Power tools, automotiveAZ91B (9 Al - 0.7 Zn) parts, sporting goods
Zinc No. 3 (4 Al) 280 — 10 Automotive parts, o!ce equip-ment, household utensils, build-ing hardware, toys
Zinc No. 5 (4 Al - 1 Cu) 320 — 7 Appliances, automotive parts,building hardware, businessequipment
Source: The North American Die Casting Association
TABLE 5.6 Properties and typical applications of common die-casting alloys.
Manufacturing Processes for Engineering Materials, 5th ed. Kalpakjian • Schmid© 2008, Pearson EducationISBN No. 0-13-227271-7
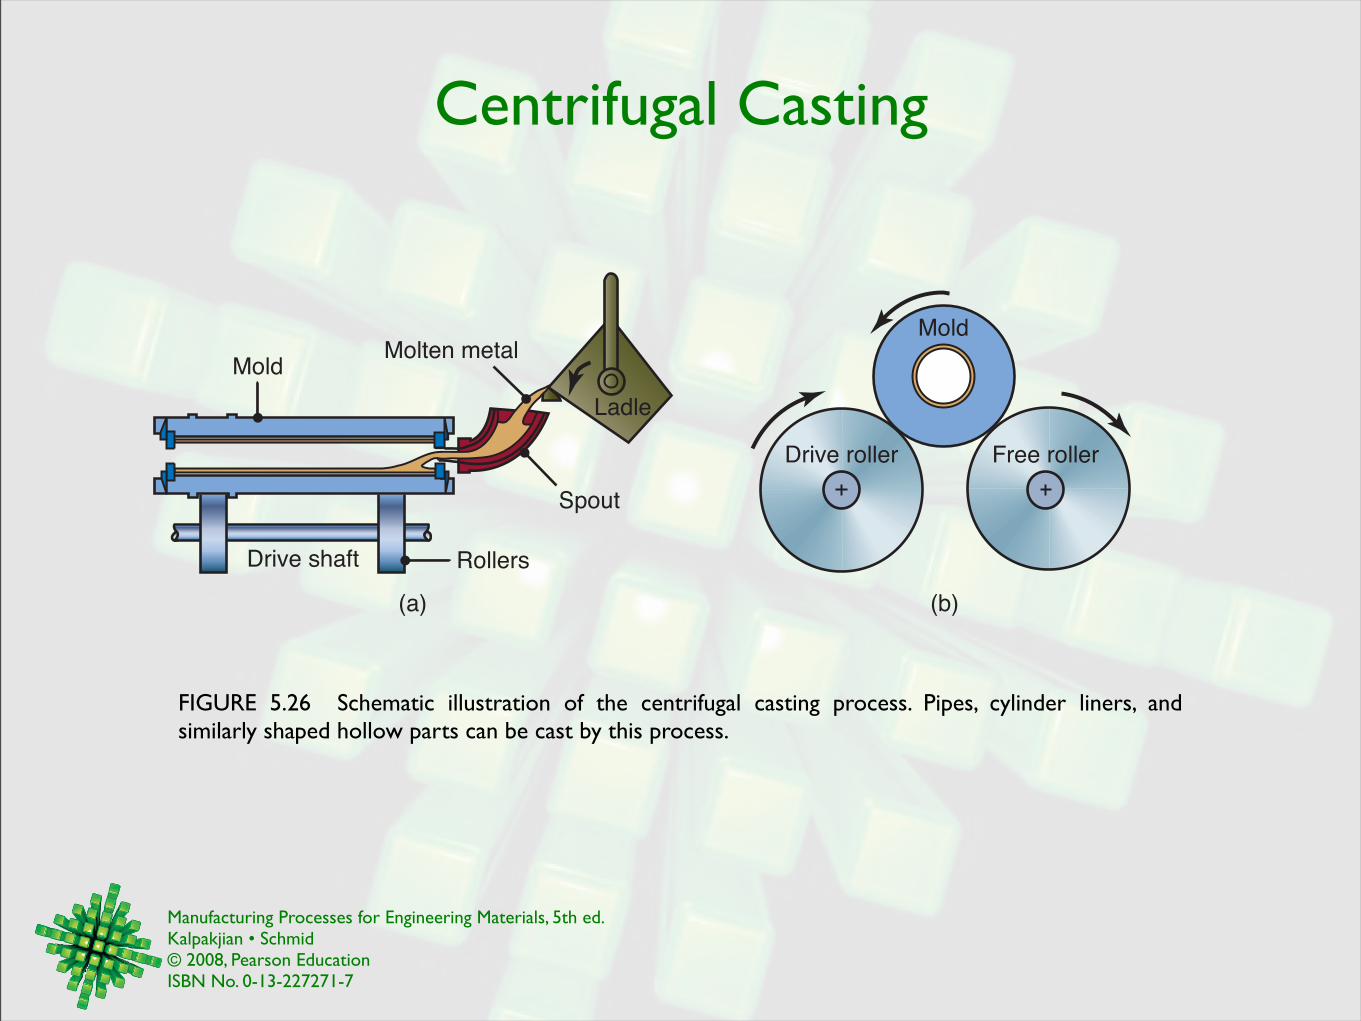
Centrifugal Casting
FIGURE 5.26 Schematic illustration of the centrifugal casting process. Pipes, cylinder liners, and similarly shaped hollow parts can be cast by this process.
Free rollerDrive roller
Mold
(a) (b)
Drive shaft
Spout
Rollers
Ladle
Molten metalMold
Manufacturing Processes for Engineering Materials, 5th ed. Kalpakjian • Schmid© 2008, Pearson EducationISBN No. 0-13-227271-7
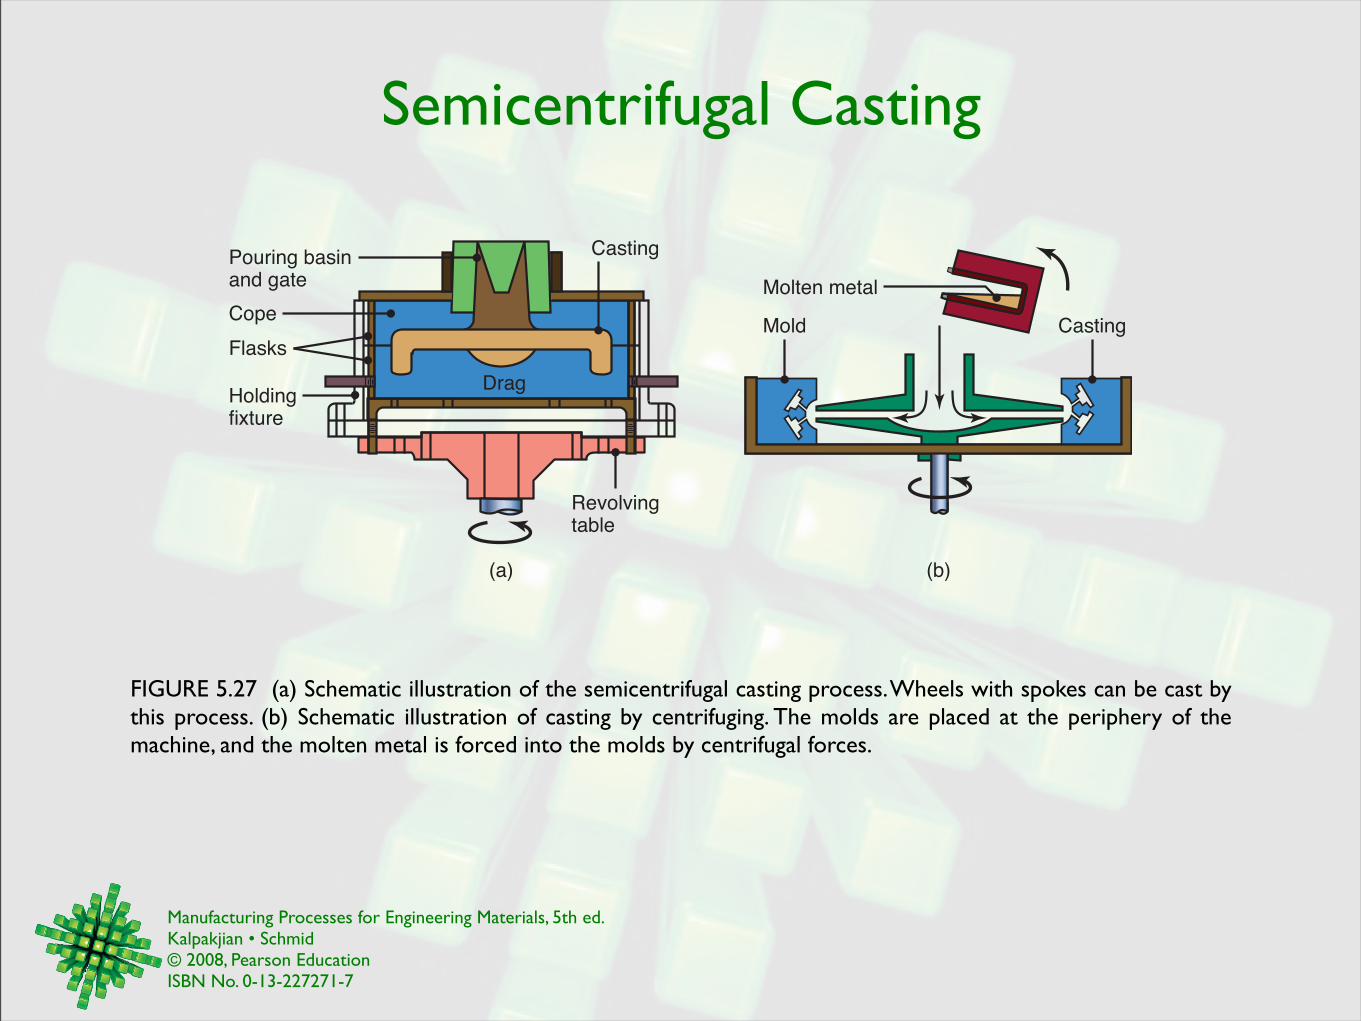
Semicentrifugal Casting
FIGURE 5.27 (a) Schematic illustration of the semicentrifugal casting process. Wheels with spokes can be cast by this process. (b) Schematic illustration of casting by centrifuging. The molds are placed at the periphery of the machine, and the molten metal is forced into the molds by centrifugal forces.
(a) (b)
Mold
Molten metal
CastingFlasks
Holdingfixture
Drag
Revolvingtable
CastingPouring basinand gate
Cope
Manufacturing Processes for Engineering Materials, 5th ed. Kalpakjian • Schmid© 2008, Pearson EducationISBN No. 0-13-227271-7
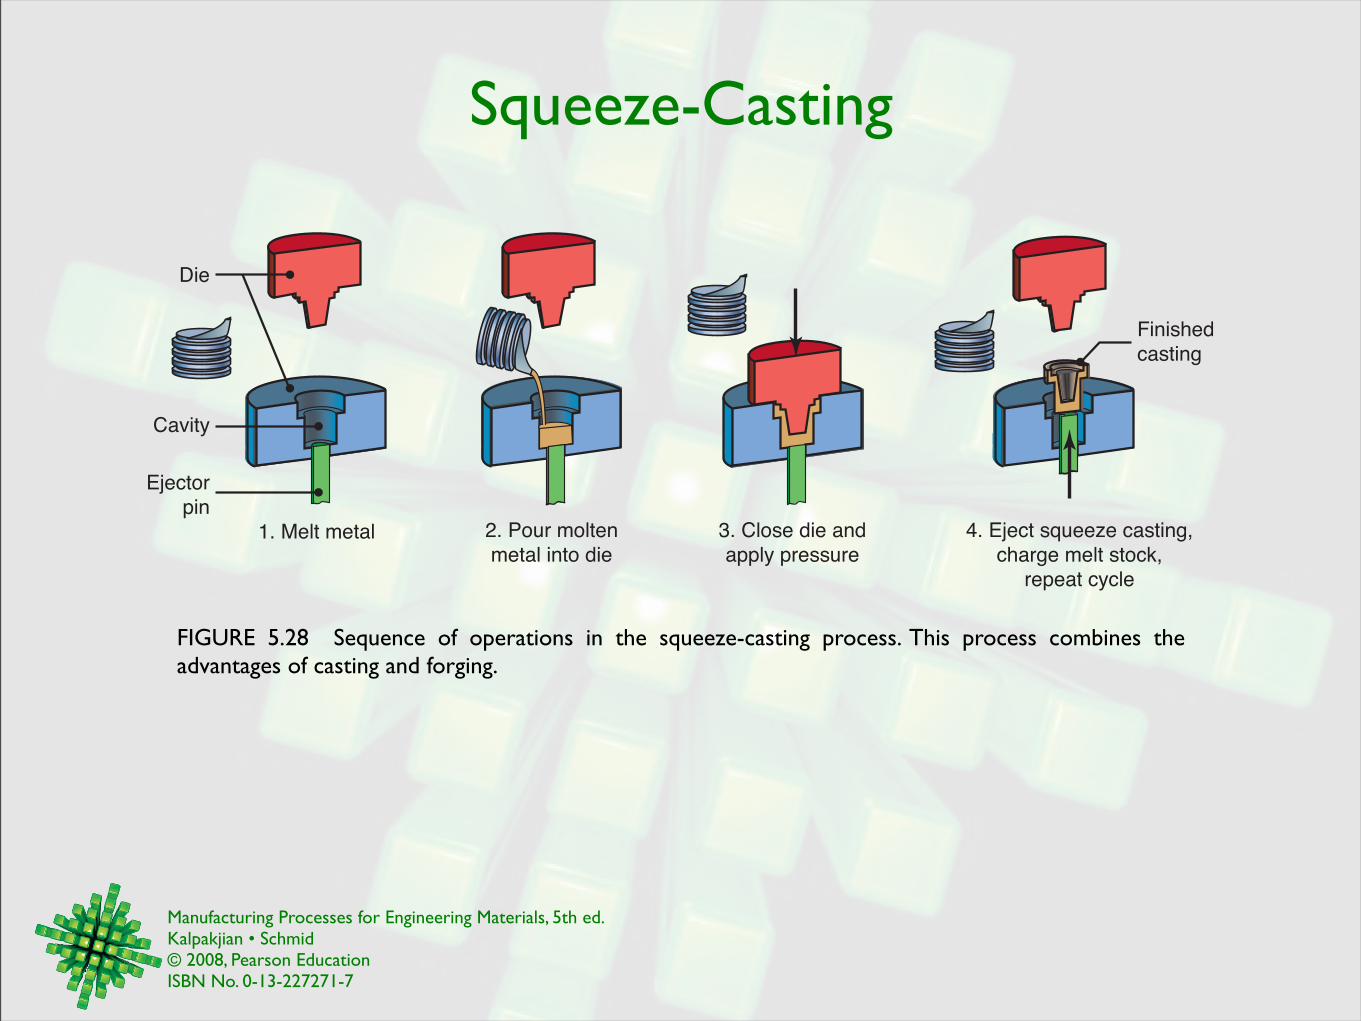
Squeeze-Casting
FIGURE 5.28 Sequence of operations in the squeeze-casting process. This process combines the advantages of casting and forging.
1. Melt metal 2. Pour molten
metal into die
3. Close die and
apply pressure
4. Eject squeeze casting,
charge melt stock,
repeat cycle
Die
Ejector
pin
Finished
casting
Cavity
Manufacturing Processes for Engineering Materials, 5th ed. Kalpakjian • Schmid© 2008, Pearson EducationISBN No. 0-13-227271-7
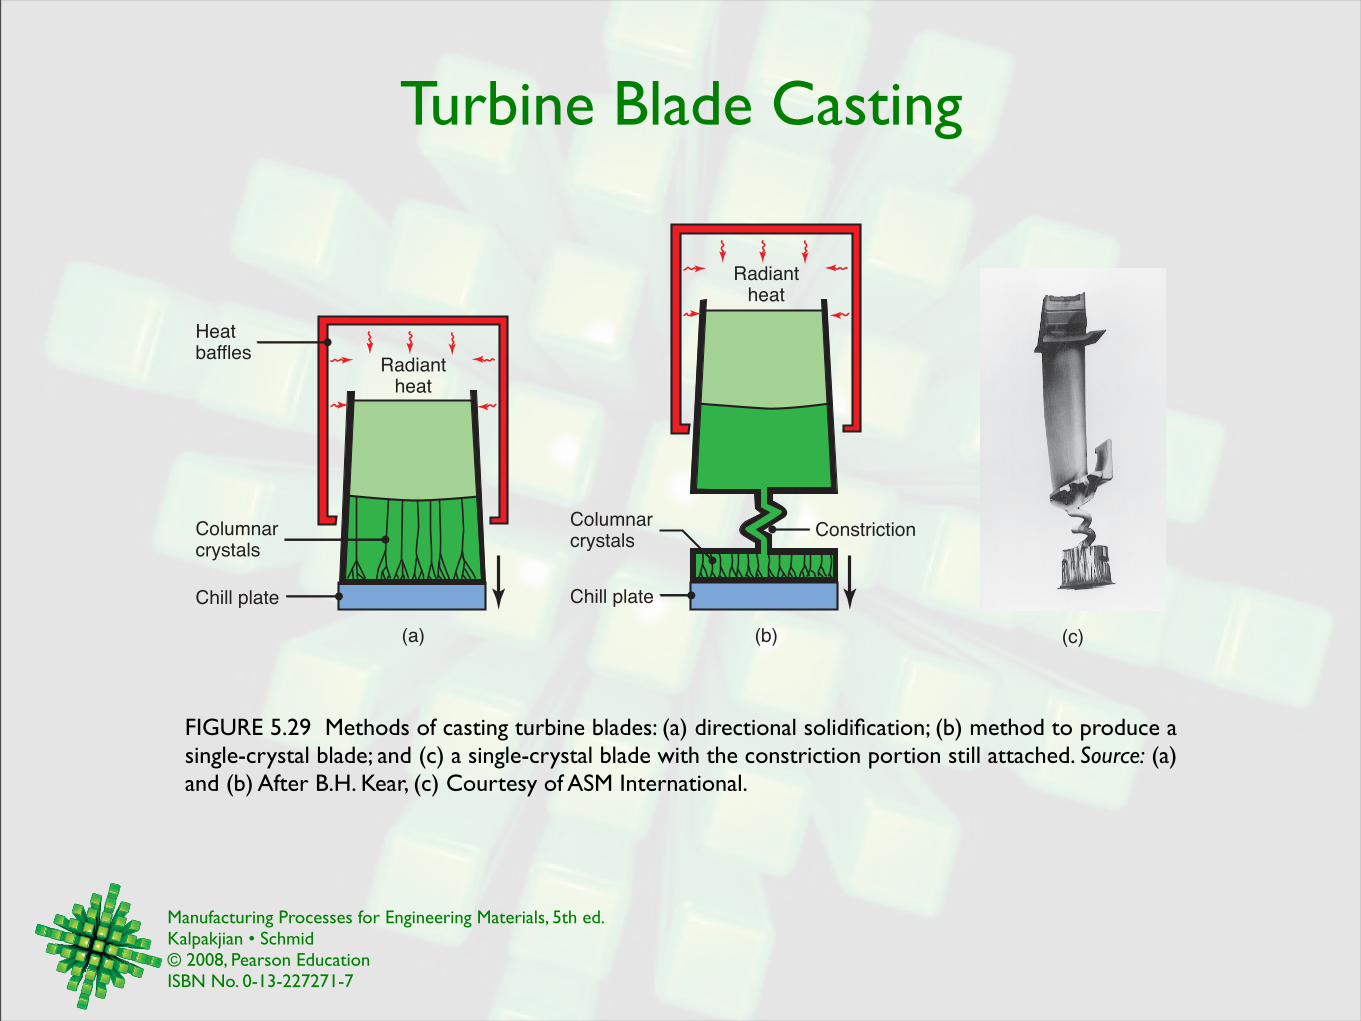
Turbine Blade Casting
FIGURE 5.29 Methods of casting turbine blades: (a) directional solidification; (b) method to produce a single-crystal blade; and (c) a single-crystal blade with the constriction portion still attached. Source: (a) and (b) After B.H. Kear, (c) Courtesy of ASM International.
(c)(a) (b)
Radiantheat
Columnarcrystals
Constriction
Chill plate
Columnarcrystals
Heatbaffles
Radiantheat
Chill plate
Manufacturing Processes for Engineering Materials, 5th ed. Kalpakjian • Schmid© 2008, Pearson EducationISBN No. 0-13-227271-7
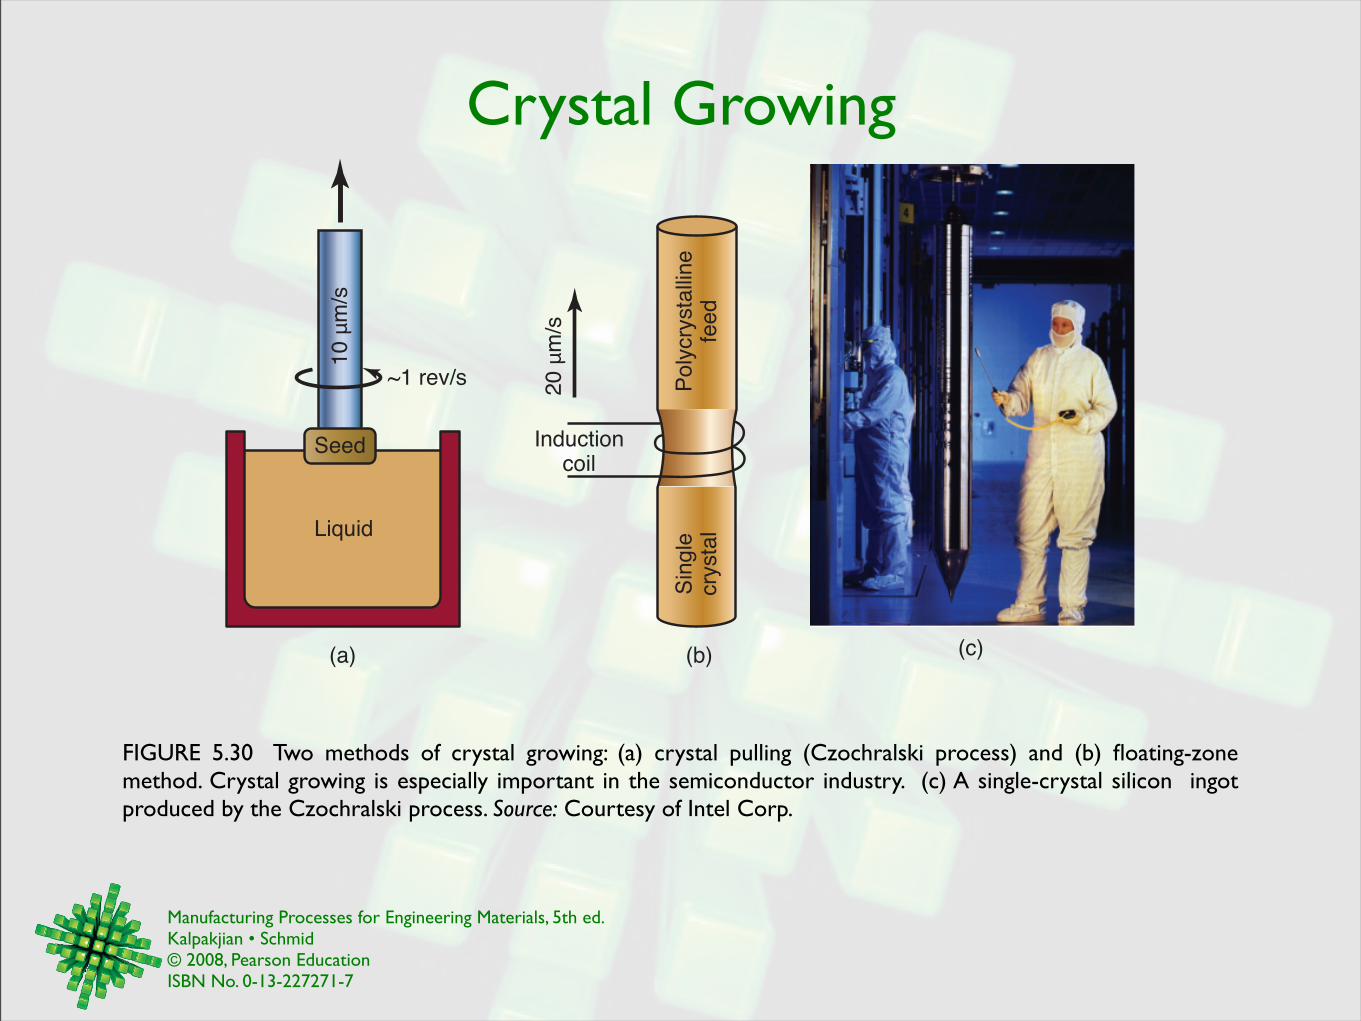
Crystal Growing
FIGURE 5.30 Two methods of crystal growing: (a) crystal pulling (Czochralski process) and (b) floating-zone method. Crystal growing is especially important in the semiconductor industry. (c) A single-crystal silicon ingot produced by the Czochralski process. Source: Courtesy of Intel Corp.
(c)(a) (b)
~1 rev/s
10 µ
m/s
Liquid
Seed
20 µ
m/s
Inductioncoil
Sin
gle
cry
sta
lP
oly
cry
sta
lline
feed
Manufacturing Processes for Engineering Materials, 5th ed. Kalpakjian • Schmid© 2008, Pearson EducationISBN No. 0-13-227271-7
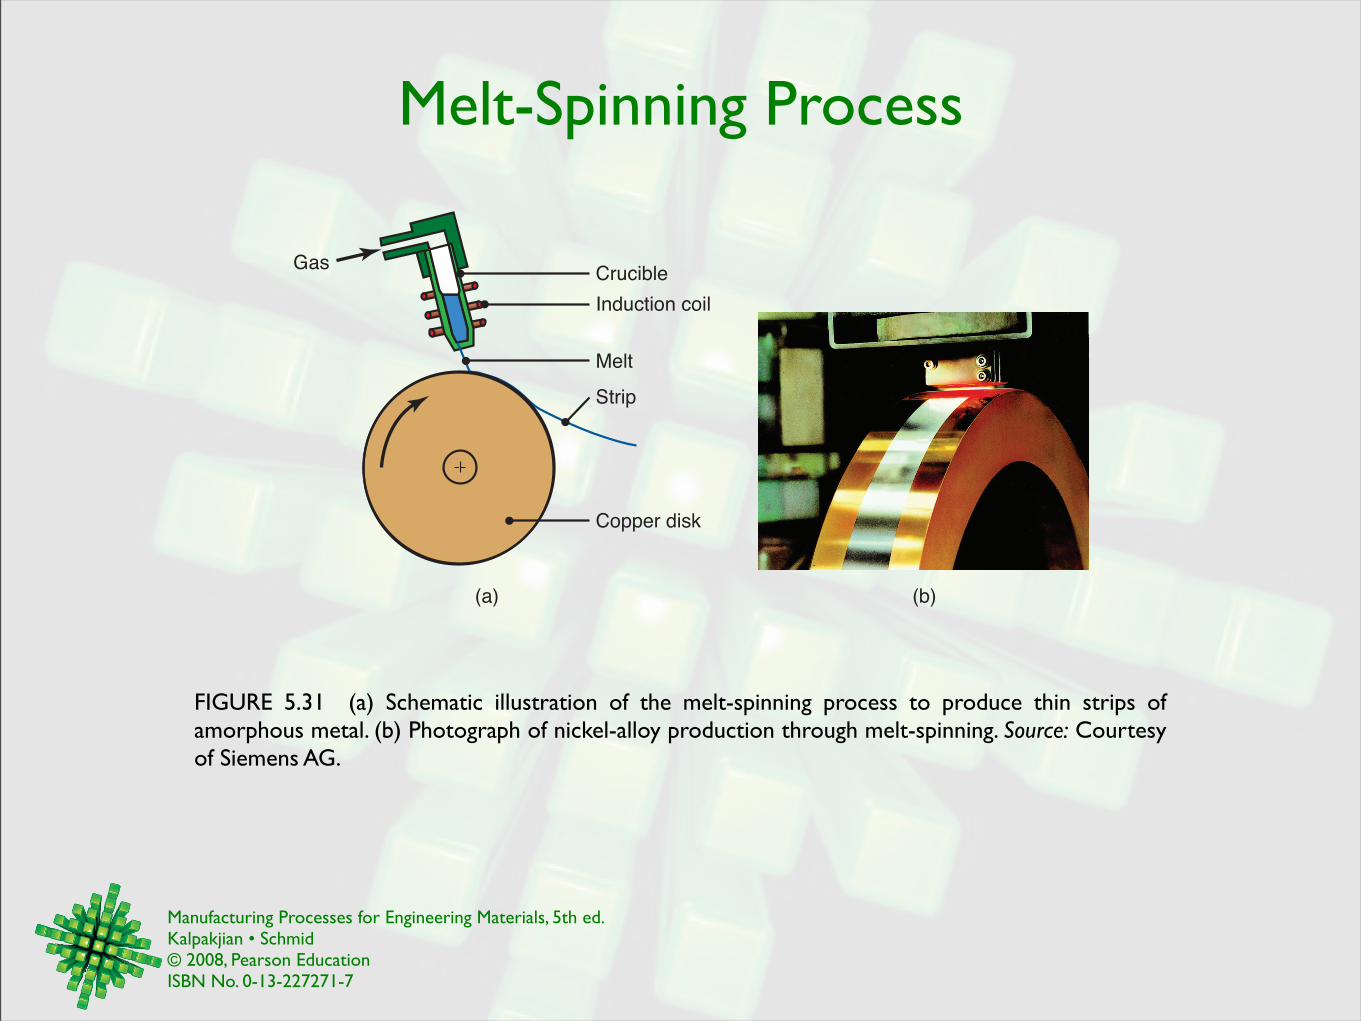
Melt-Spinning Process
FIGURE 5.31 (a) Schematic illustration of the melt-spinning process to produce thin strips of amorphous metal. (b) Photograph of nickel-alloy production through melt-spinning. Source: Courtesy of Siemens AG.
(b)(a)
Crucible
Induction coil
Melt
Strip
Gas
Copper disk
Manufacturing Processes for Engineering Materials, 5th ed. Kalpakjian • Schmid© 2008, Pearson EducationISBN No. 0-13-227271-7
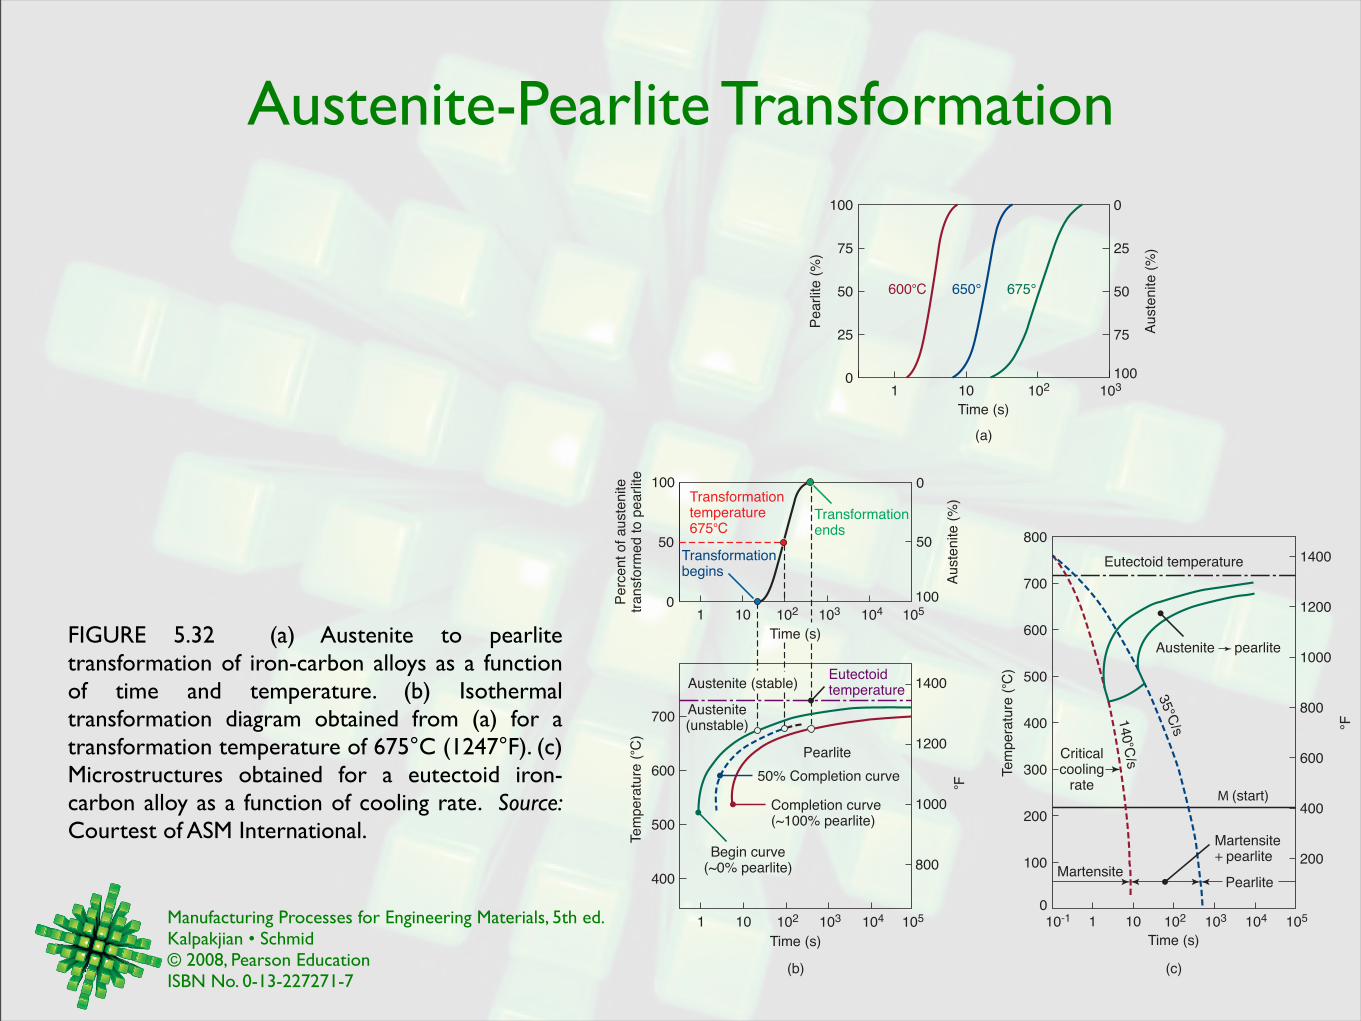
Austenite-Pearlite Transformation
FIGURE 5.32 (a) Austenite to pearlite transformation of iron-carbon alloys as a function of time and temperature. (b) Isothermal transformation diagram obtained from (a) for a transformation temperature of 675°C (1247°F). (c) Microstructures obtained for a eutectoid iron-carbon alloy as a function of cooling rate. Source: Courtest of ASM International.
(a)
25
75
50
0
100
75
25
50
100
0
Au
ste
nite
(%
)
Pe
arlite
(%
)
Time (s)
600°C 650° 675°
1 10 102 103
(b) (c)
50
0
100
Pe
rce
nt
of
au
ste
nite
tr
an
sfo
rme
d t
o p
ea
rlite
Te
mp
era
ture
(° C
)
Au
ste
nite
(%
) ° F
50
100
0
600
400
500
700
800
1000
1200
1400
Time (s)
50% Completion curve
Pearlite
Completion curve (~100% pearlite)
Eutectoid temperature
Austenite (unstable)
Begin curve (~0% pearlite)
Transformationtemperature675°C
Transformation begins
1 10 103 104 105
Transformation ends
1 10 102 103 104 105
Austenite (stable)
102
Time (s)
Te
mp
era
ture
(° C
)
200
100
0
200
400
600
800
1000
1200
1400
300
400
500
35°C
/s
140 °C
/s
600
700
800
Eutectoid temperature
M (start)
Critical cooling
rate
Time (s)
1 10 102 10-1 103 104 105
°F
Pearlite Martensite
Martensite+ pearlite
Austenite pearlite
Manufacturing Processes for Engineering Materials, 5th ed. Kalpakjian • Schmid© 2008, Pearson EducationISBN No. 0-13-227271-7
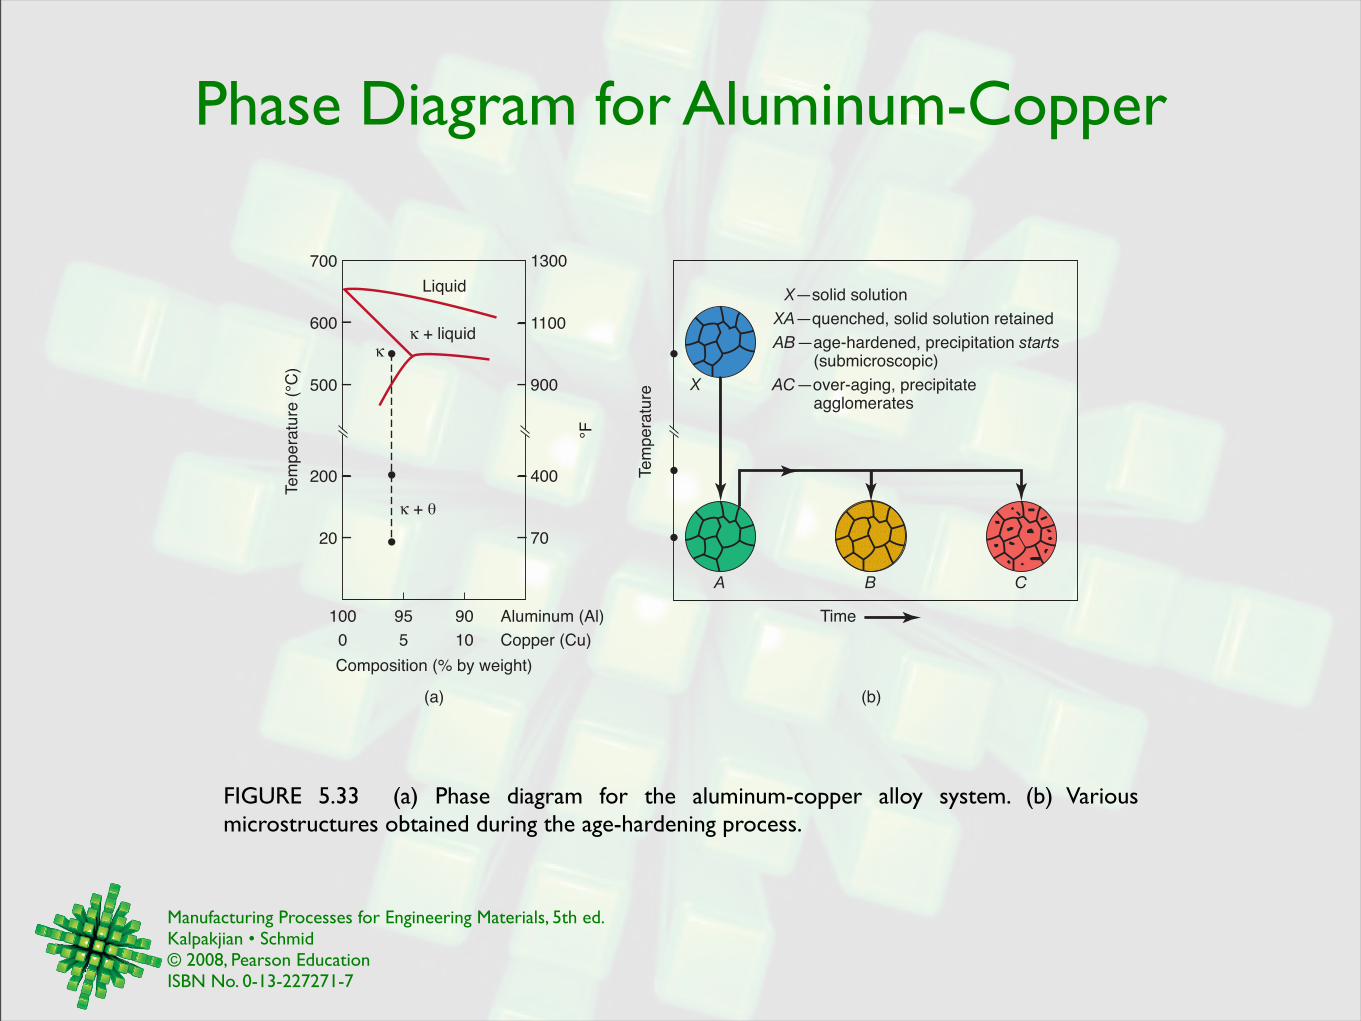
Phase Diagram for Aluminum-Copper
FIGURE 5.33 (a) Phase diagram for the aluminum-copper alloy system. (b) Various microstructures obtained during the age-hardening process.
X
Te
mp
era
ture
X—solid solution
XA—quenched, solid solution retained
AB—age-hardened, precipitation starts
(submicroscopic)
AC—over-aging, precipitate agglomerates
100 95 90 Aluminum (Al)
0 5 10 Copper (Cu)
70
400
900
1100
Liquid
+ liquid
20
200
500
600
700
(b) (a)
1300
Composition (% by weight)
Te
mp
era
ture
(°C
)
°F
A B C
Time
+ !
Manufacturing Processes for Engineering Materials, 5th ed. Kalpakjian • Schmid© 2008, Pearson EducationISBN No. 0-13-227271-7
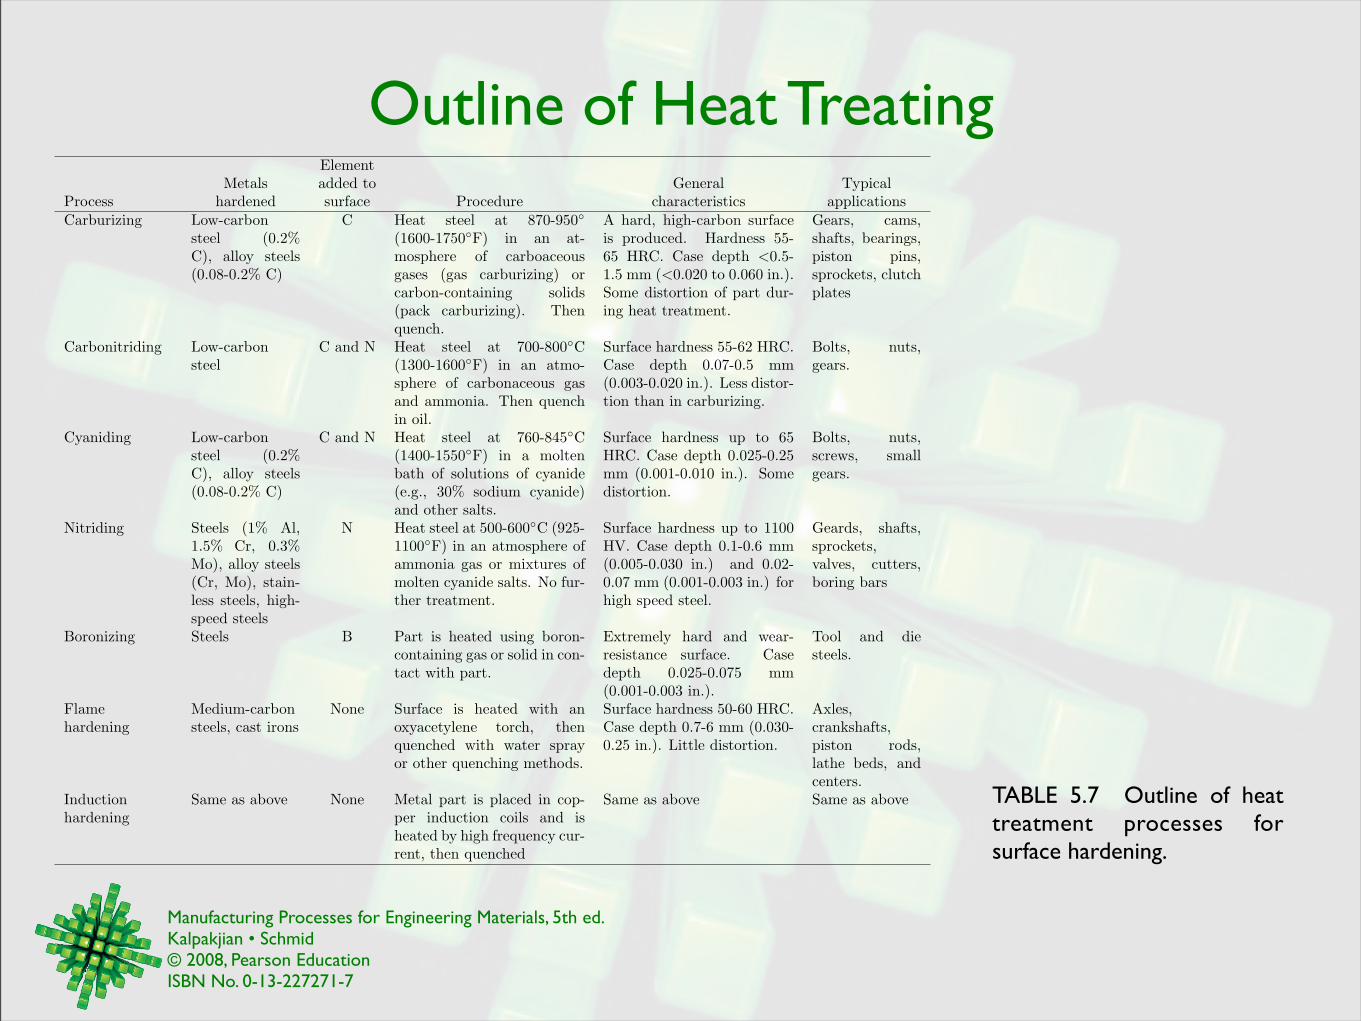
Outline of Heat Treating
TABLE 5.7 Outline of heat treatment processes for surface hardening.
ElementMetals added to General Typical
Process hardened surface Procedure characteristics applicationsCarburizing Low-carbon
steel (0.2%C), alloy steels(0.08-0.2% C)
C Heat steel at 870-950!(1600-1750!F) in an at-mosphere of carboaceousgases (gas carburizing) orcarbon-containing solids(pack carburizing). Thenquench.
A hard, high-carbon surfaceis produced. Hardness 55-65 HRC. Case depth <0.5-1.5 mm (<0.020 to 0.060 in.).Some distortion of part dur-ing heat treatment.
Gears, cams,shafts, bearings,piston pins,sprockets, clutchplates
Carbonitriding Low-carbonsteel
C and N Heat steel at 700-800!C(1300-1600!F) in an atmo-sphere of carbonaceous gasand ammonia. Then quenchin oil.
Surface hardness 55-62 HRC.Case depth 0.07-0.5 mm(0.003-0.020 in.). Less distor-tion than in carburizing.
Bolts, nuts,gears.
Cyaniding Low-carbonsteel (0.2%C), alloy steels(0.08-0.2% C)
C and N Heat steel at 760-845!C(1400-1550!F) in a moltenbath of solutions of cyanide(e.g., 30% sodium cyanide)and other salts.
Surface hardness up to 65HRC. Case depth 0.025-0.25mm (0.001-0.010 in.). Somedistortion.
Bolts, nuts,screws, smallgears.
Nitriding Steels (1% Al,1.5% Cr, 0.3%Mo), alloy steels(Cr, Mo), stain-less steels, high-speed steels
N Heat steel at 500-600!C (925-1100!F) in an atmosphere ofammonia gas or mixtures ofmolten cyanide salts. No fur-ther treatment.
Surface hardness up to 1100HV. Case depth 0.1-0.6 mm(0.005-0.030 in.) and 0.02-0.07 mm (0.001-0.003 in.) forhigh speed steel.
Geards, shafts,sprockets,valves, cutters,boring bars
Boronizing Steels B Part is heated using boron-containing gas or solid in con-tact with part.
Extremely hard and wear-resistance surface. Casedepth 0.025-0.075 mm(0.001-0.003 in.).
Tool and diesteels.
Flamehardening
Medium-carbonsteels, cast irons
None Surface is heated with anoxyacetylene torch, thenquenched with water sprayor other quenching methods.
Surface hardness 50-60 HRC.Case depth 0.7-6 mm (0.030-0.25 in.). Little distortion.
Axles,crankshafts,piston rods,lathe beds, andcenters.
Inductionhardening
Same as above None Metal part is placed in cop-per induction coils and isheated by high frequency cur-rent, then quenched
Same as above Same as above
Manufacturing Processes for Engineering Materials, 5th ed. Kalpakjian • Schmid© 2008, Pearson EducationISBN No. 0-13-227271-7
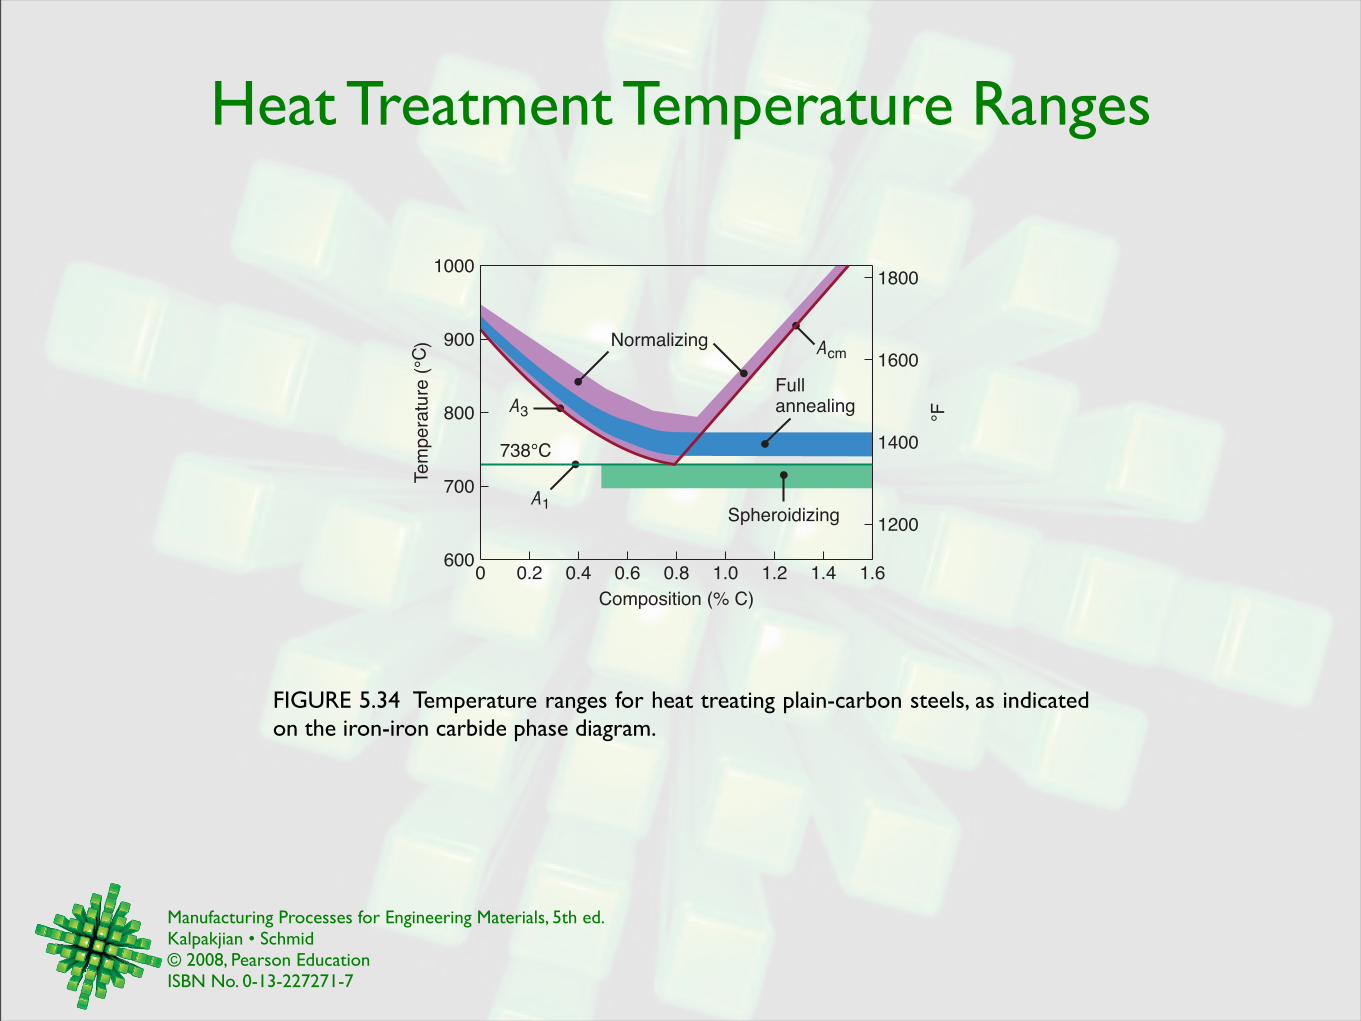
Heat Treatment Temperature Ranges
FIGURE 5.34 Temperature ranges for heat treating plain-carbon steels, as indicated on the iron-iron carbide phase diagram.
0 0.2 0.4 0.6 0.8 1.0 1.2 1.4 1.6
Te
mp
era
ture
(°C
)
600
700
800
900
1000
1200
1400
1600
1800
Normalizing
Full annealing
Acm
Spheroidizing
738°C
A3
A1
Composition (% C)
°F
Manufacturing Processes for Engineering Materials, 5th ed. Kalpakjian • Schmid© 2008, Pearson EducationISBN No. 0-13-227271-7
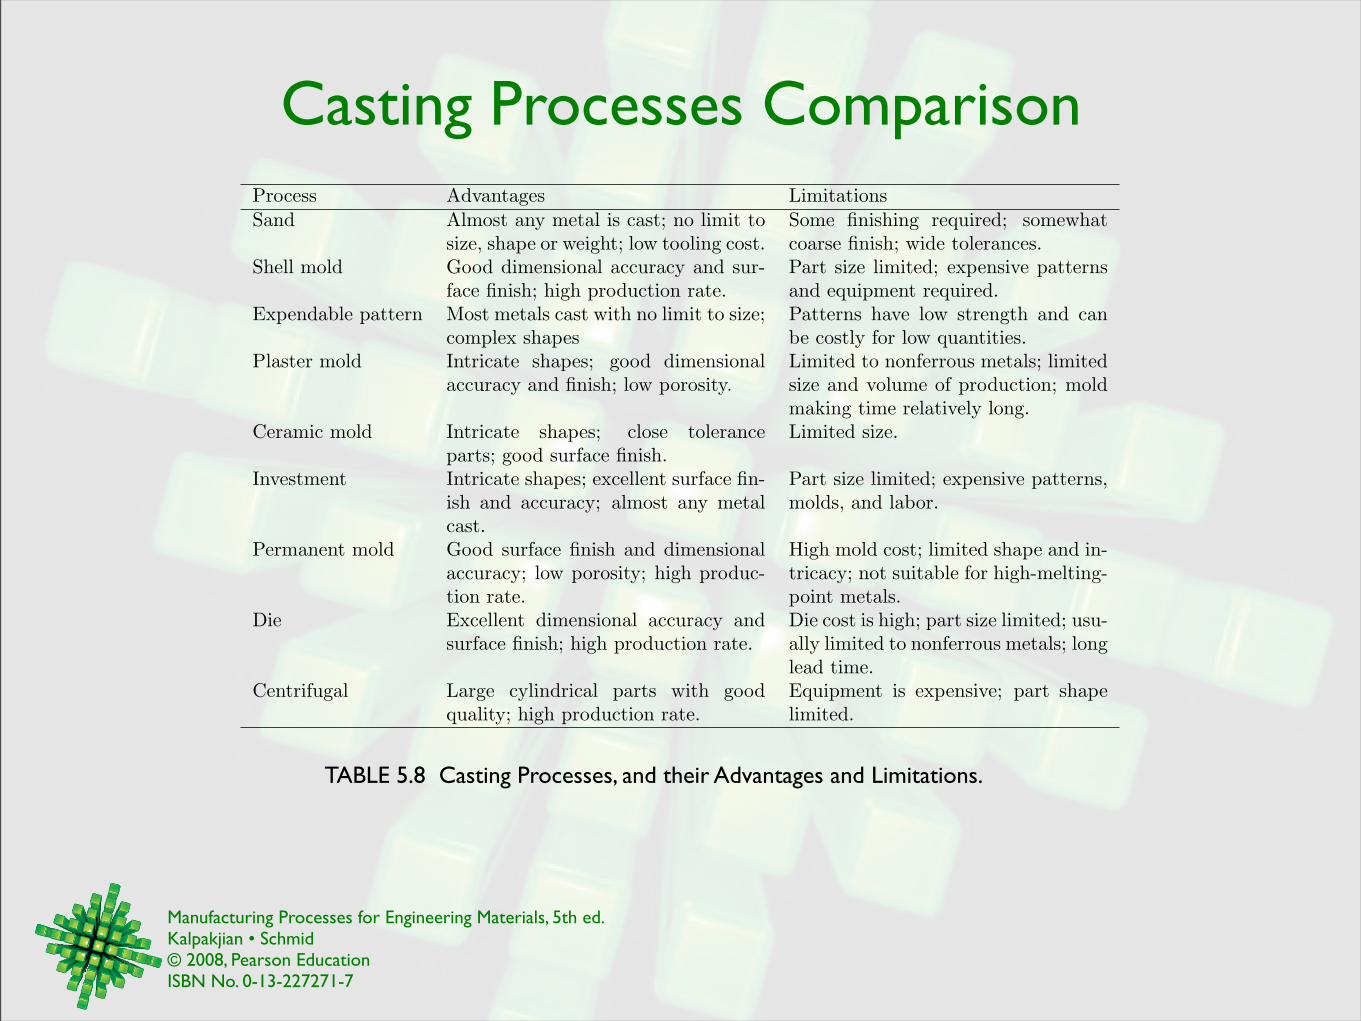
Casting Processes Comparison
TABLE 5.8 Casting Processes, and their Advantages and Limitations.
Process Advantages LimitationsSand Almost any metal is cast; no limit to
size, shape or weight; low tooling cost.Some finishing required; somewhatcoarse finish; wide tolerances.
Shell mold Good dimensional accuracy and sur-face finish; high production rate.
Part size limited; expensive patternsand equipment required.
Expendable pattern Most metals cast with no limit to size;complex shapes
Patterns have low strength and canbe costly for low quantities.
Plaster mold Intricate shapes; good dimensionalaccuracy and finish; low porosity.
Limited to nonferrous metals; limitedsize and volume of production; moldmaking time relatively long.
Ceramic mold Intricate shapes; close toleranceparts; good surface finish.
Limited size.
Investment Intricate shapes; excellent surface fin-ish and accuracy; almost any metalcast.
Part size limited; expensive patterns,molds, and labor.
Permanent mold Good surface finish and dimensionalaccuracy; low porosity; high produc-tion rate.
High mold cost; limited shape and in-tricacy; not suitable for high-melting-point metals.
Die Excellent dimensional accuracy andsurface finish; high production rate.
Die cost is high; part size limited; usu-ally limited to nonferrous metals; longlead time.
Centrifugal Large cylindrical parts with goodquality; high production rate.
Equipment is expensive; part shapelimited.
Manufacturing Processes for Engineering Materials, 5th ed. Kalpakjian • Schmid© 2008, Pearson EducationISBN No. 0-13-227271-7
Chills
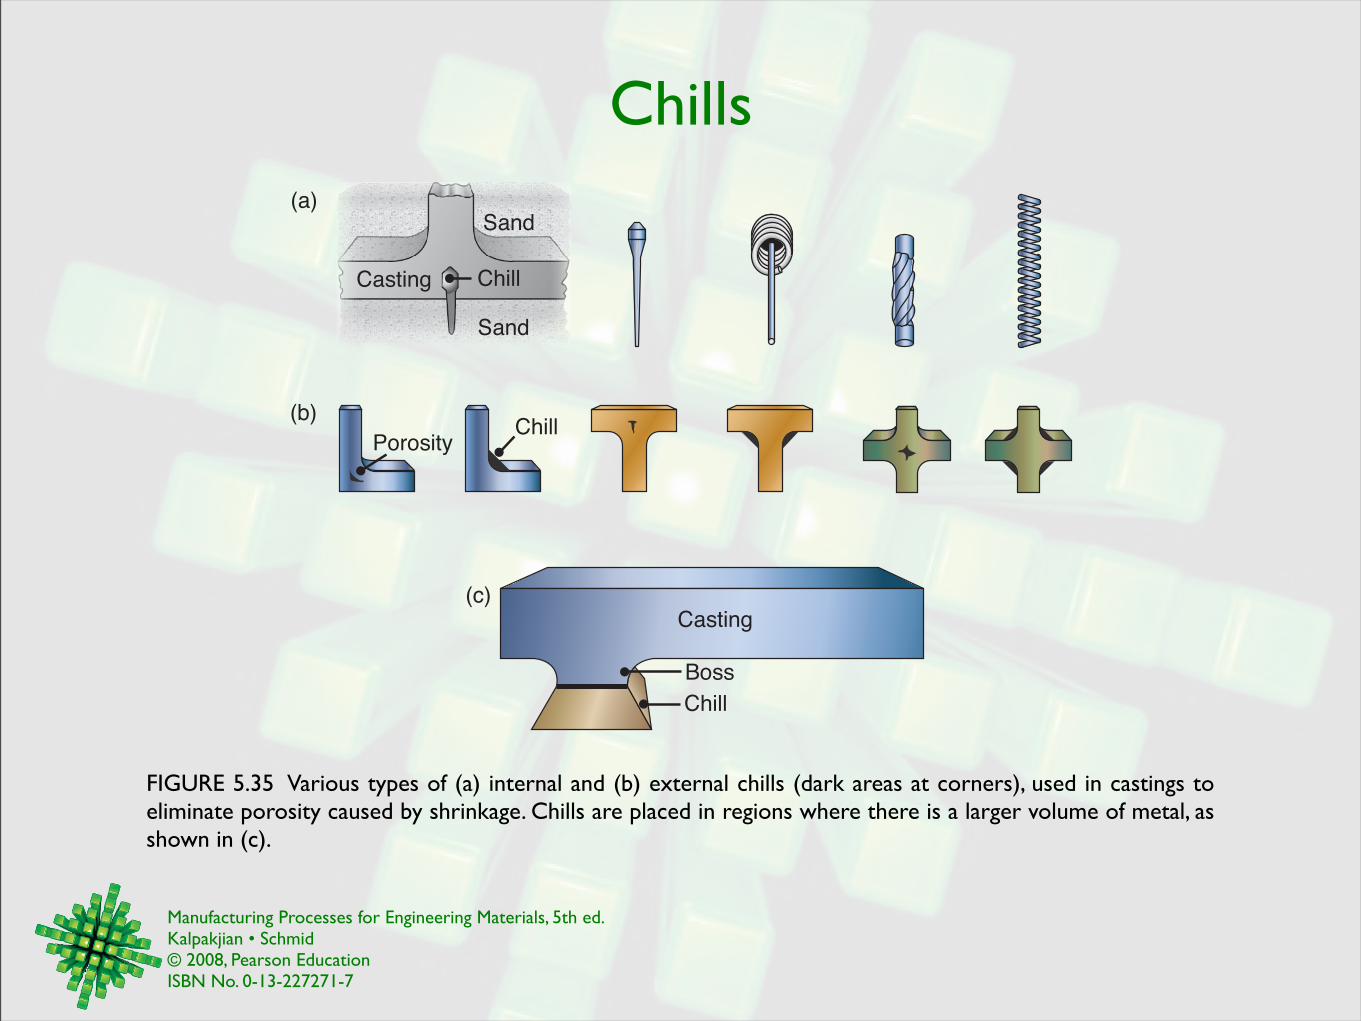
FIGURE 5.35 Various types of (a) internal and (b) external chills (dark areas at corners), used in castings to eliminate porosity caused by shrinkage. Chills are placed in regions where there is a larger volume of metal, as shown in (c).
(a)
(b)
(c)
PorosityChill
Casting
Boss
Chill
Sand
Casting Chill
Sand
Manufacturing Processes for Engineering Materials, 5th ed. Kalpakjian • Schmid© 2008, Pearson EducationISBN No. 0-13-227271-7
Hydrogen Solubility in Aluminum
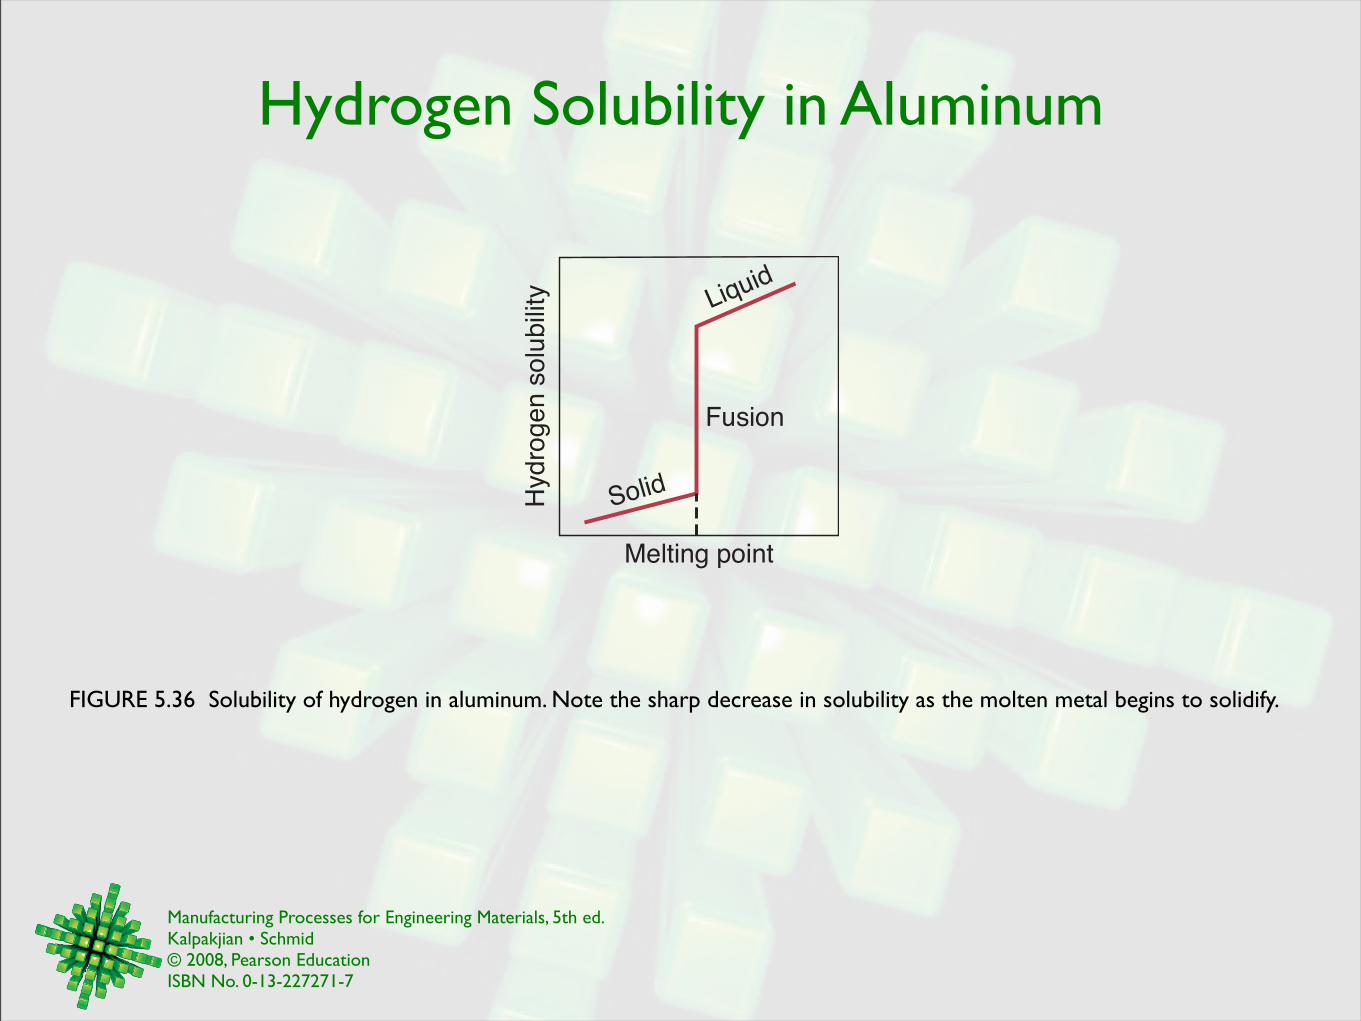
FIGURE 5.36 Solubility of hydrogen in aluminum. Note the sharp decrease in solubility as the molten metal begins to solidify.
Hydro
gen s
olu
bili
ty
Fusion
Solid
Liquid
Melting point
Manufacturing Processes for Engineering Materials, 5th ed. Kalpakjian • Schmid© 2008, Pearson EducationISBN No. 0-13-227271-7
Elimination of Porosity in Castings
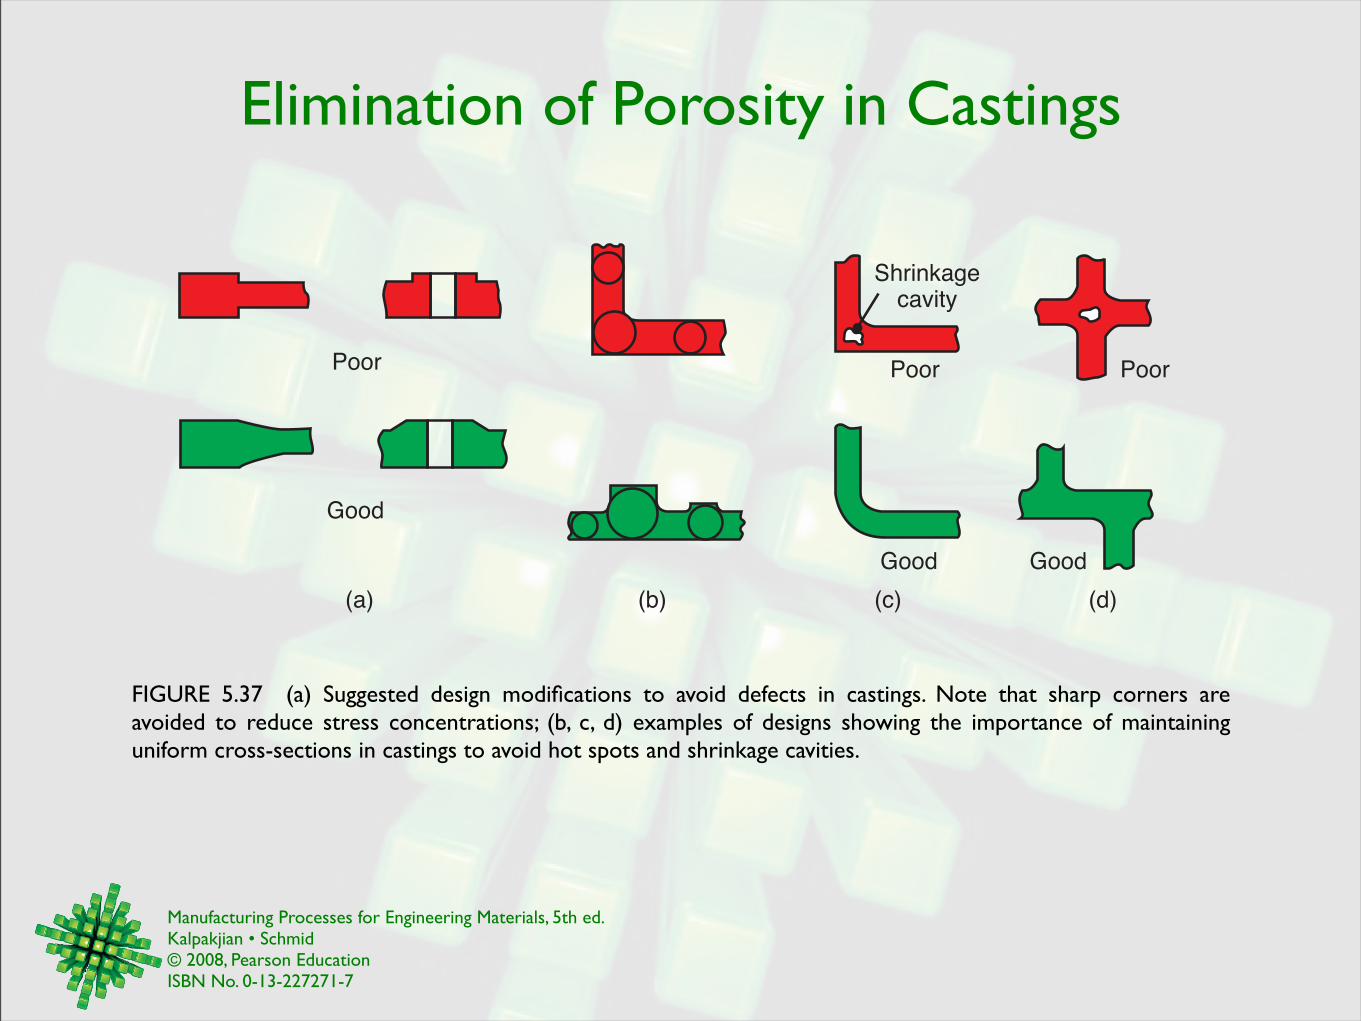
FIGURE 5.37 (a) Suggested design modifications to avoid defects in castings. Note that sharp corners are avoided to reduce stress concentrations; (b, c, d) examples of designs showing the importance of maintaining uniform cross-sections in castings to avoid hot spots and shrinkage cavities.
(a)
Poor
Good
(b) (c) (d)
Shrinkagecavity
Poor Poor
Good Good
Manufacturing Processes for Engineering Materials, 5th ed. Kalpakjian • Schmid© 2008, Pearson EducationISBN No. 0-13-227271-7
Design Modifications
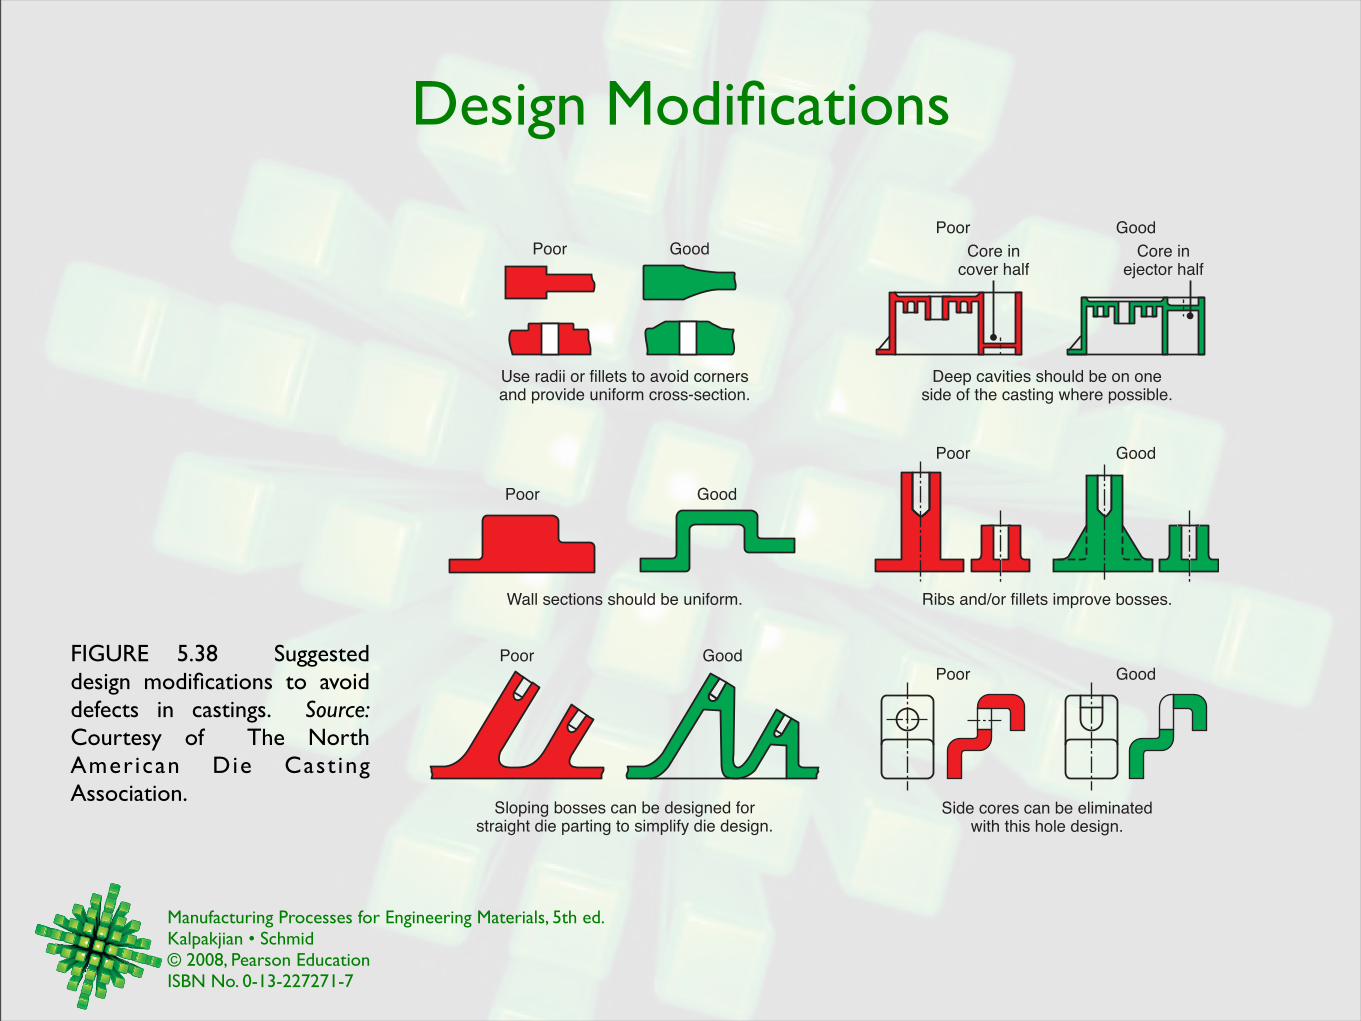
FIGURE 5.38 Suggested design modifications to avoid defects in castings. Source: Courtesy of The North American Die Cast ing Association.
Use radii or fillets to avoid cornersand provide uniform cross-section.
Wall sections should be uniform.
Sloping bosses can be designed forstraight die parting to simplify die design.
Ribs and/or fillets improve bosses.
Side cores can be eliminatedwith this hole design.
Deep cavities should be on oneside of the casting where possible.
Poor Good
Poor Good
Poor GoodPoor Good
Poor Good
Poor Good
Core incover half
Core inejector half
Manufacturing Processes for Engineering Materials, 5th ed. Kalpakjian • Schmid© 2008, Pearson EducationISBN No. 0-13-227271-7
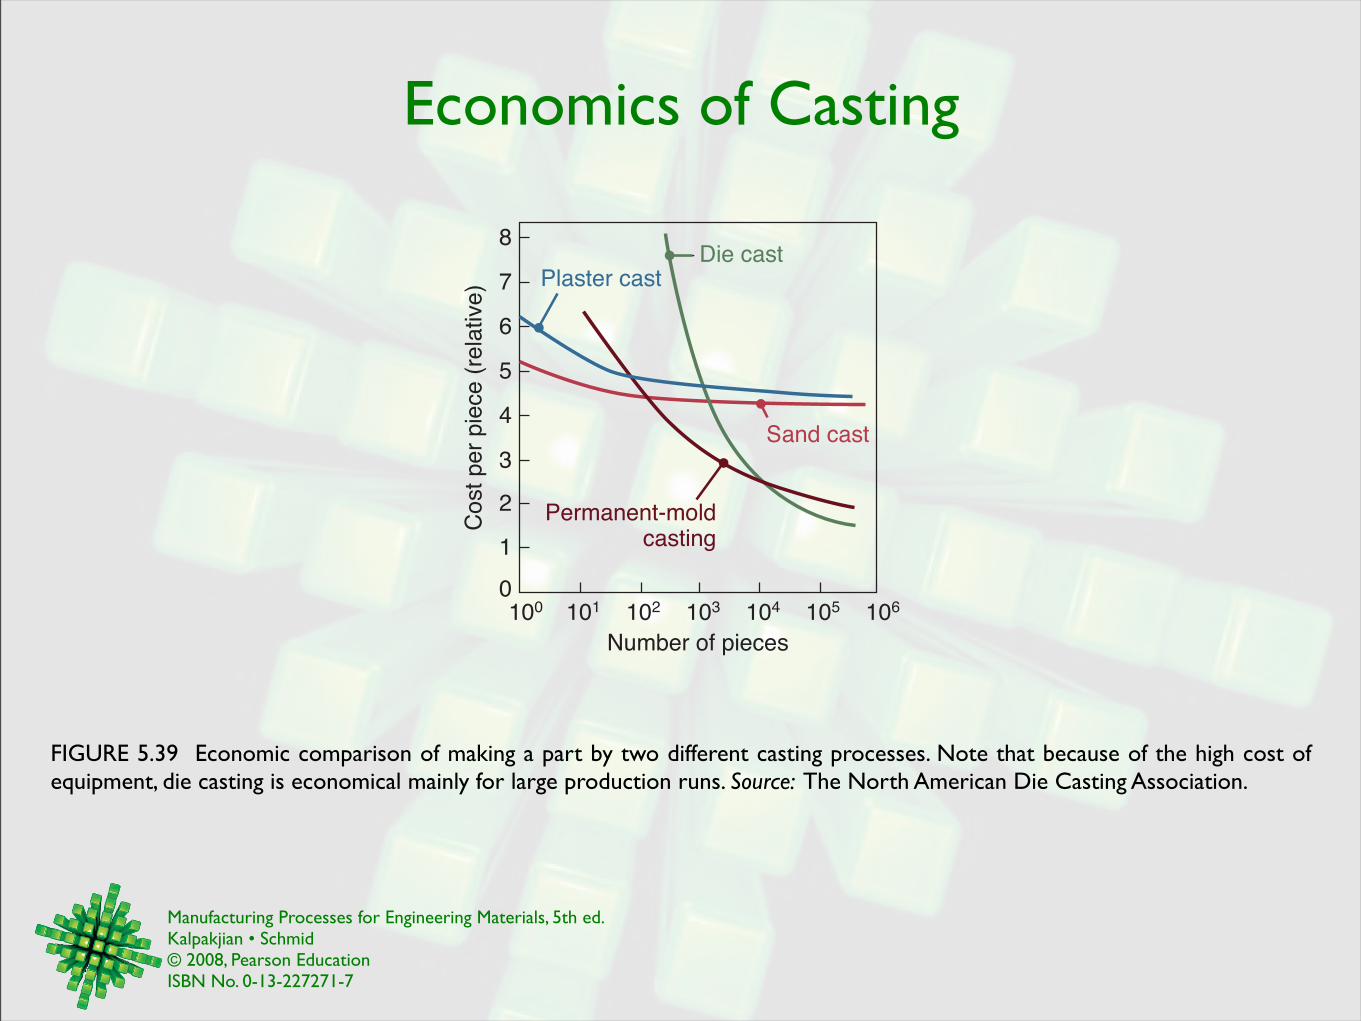
Economics of Casting
FIGURE 5.39 Economic comparison of making a part by two different casting processes. Note that because of the high cost of equipment, die casting is economical mainly for large production runs. Source: The North American Die Casting Association.
Co
st
pe
r p
iece
(re
lative
)
8
7
6
5
4
3
2
1
0100 101 102 103 104 105 106
Number of pieces
Die cast
Sand cast
Permanent-moldcasting
Plaster cast
Manufacturing Processes for Engineering Materials, 5th ed. Kalpakjian • Schmid© 2008, Pearson EducationISBN No. 0-13-227271-7
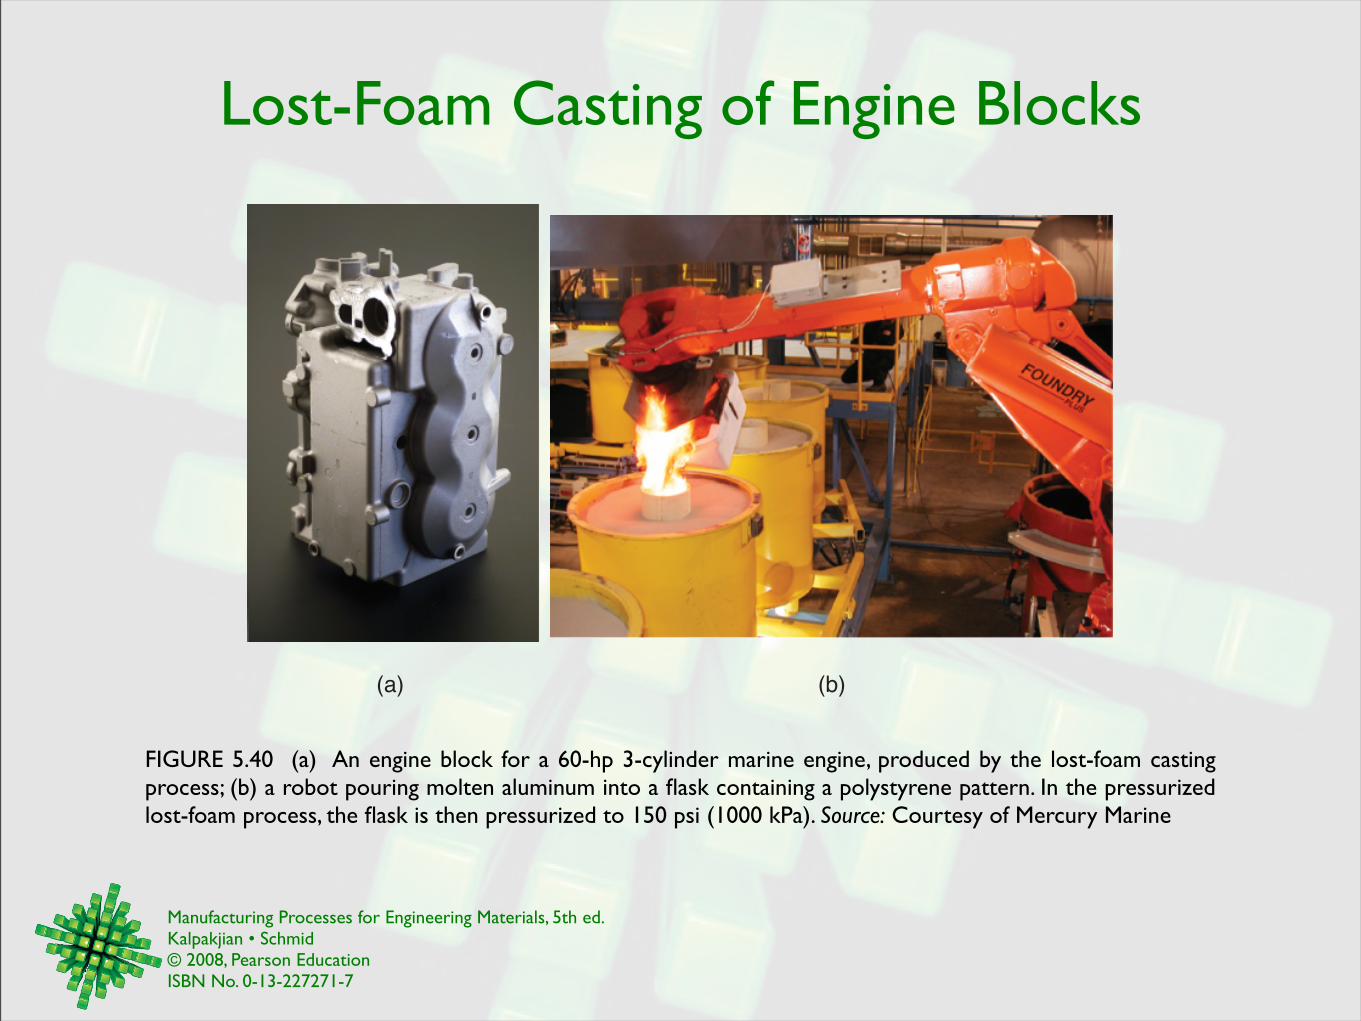
Lost-Foam Casting of Engine Blocks
FIGURE 5.40 (a) An engine block for a 60-hp 3-cylinder marine engine, produced by the lost-foam casting process; (b) a robot pouring molten aluminum into a flask containing a polystyrene pattern. In the pressurized lost-foam process, the flask is then pressurized to 150 psi (1000 kPa). Source: Courtesy of Mercury Marine
(a) (b)