Embed Size (px)
Citation preview
Freight Trends and Rail Capacity
Transportation leadership you can trust.
presented topresented to
2008 Ohio Conference on Freight2008 Ohio Conference on FreightToledo, OhioToledo, Ohio
presented bypresented byLance R. GrenzebackLance R. GrenzebackCambridge Systematics, Inc.Cambridge Systematics, Inc.
September 16, 2008September 16, 2008
2
3
Presentation
Freight Transportation and the Economy
Freight Transportation Demand
Rail Freight Transportation Capacity
Authorization Issues
4
Freight Transportation and the Economy
5
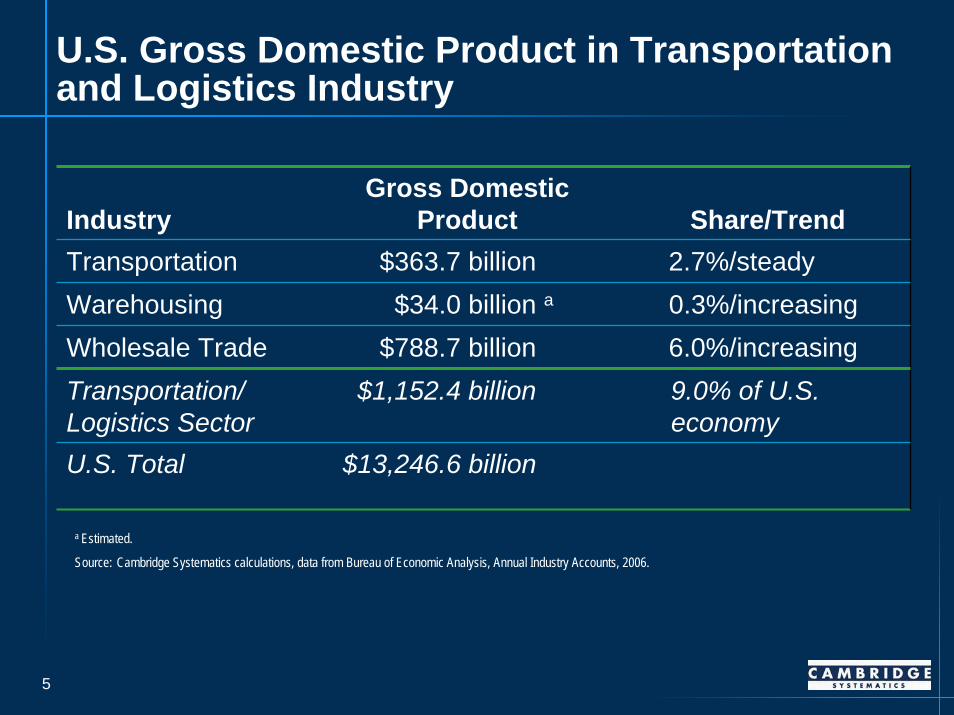
U.S. Gross Domestic Product in Transportation and Logistics Industry
IndustryGross Domestic
Product Share/TrendTransportation $363.7 billion 2.7%/steadyWarehousing $34.0 billion a 0.3%/increasingWholesale Trade $788.7 billion 6.0%/increasingTransportation/ Logistics Sector
$1,152.4 billion 9.0% of U.S.economy
U.S. Total $13,246.6 billion
a Estimated.
Source: Cambridge Systematics calculations, data from Bureau of Economic Analysis, Annual Industry Accounts, 2006.
6
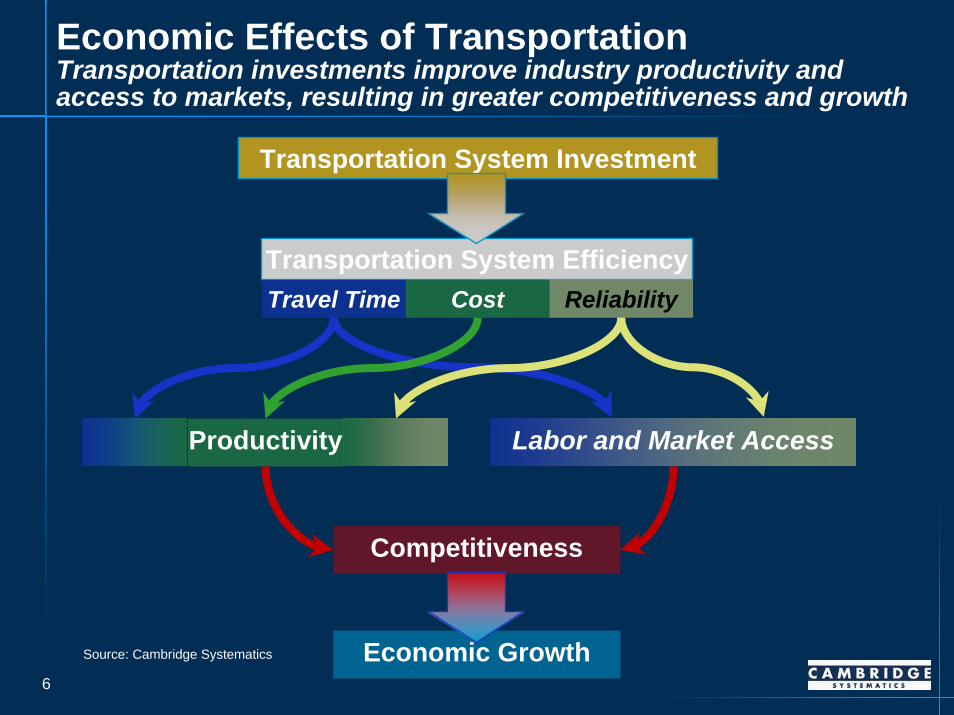
Economic Effects of TransportationTransportation investments improve industry productivity and access to markets, resulting in greater competitiveness and growth
Transportation System Investment
Transportation System EfficiencyTravel Time Cost
Labor and Market Access
Competitiveness
Economic Growth
Reliability
Productivity
Source: Cambridge Systematics
7
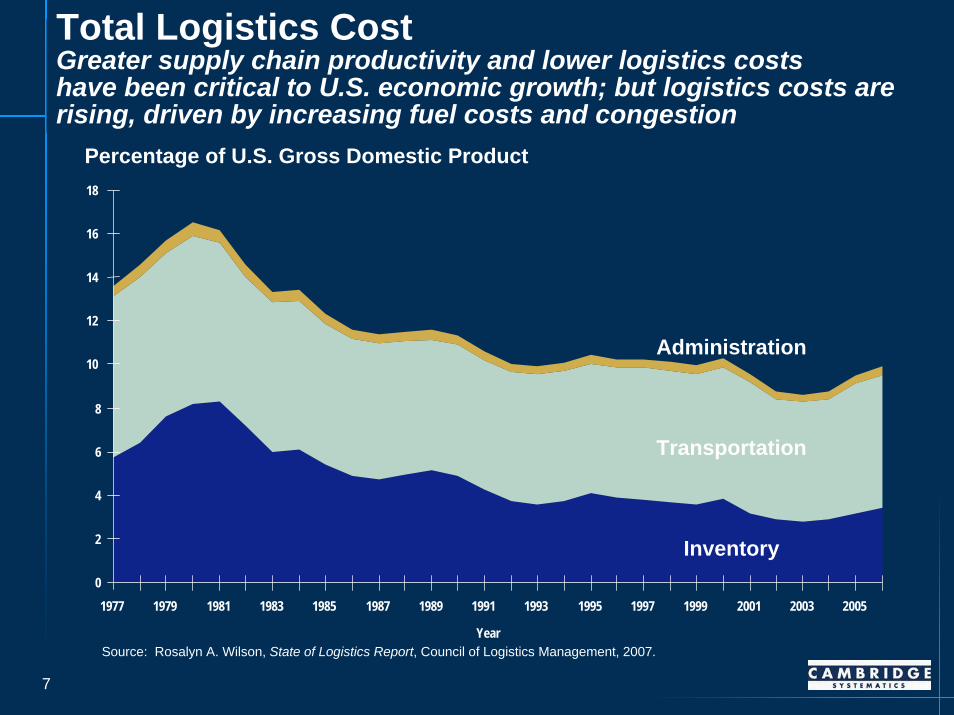
Total Logistics CostGreater supply chain productivity and lower logistics costs have been critical to U.S. economic growth; but logistics costs are rising, driven by increasing fuel costs and congestion
Percentage of U.S. Gross Domestic Product
0
2
4
6
8
10
12
14
16
18
1977 1979 1981 1983 1985 1987 1989 1991 1993 1995 1997 1999 2001 2003 2005
Administration
Transportation
Inventory
YearSource: Rosalyn A. Wilson, State of Logistics Report, Council of Logistics Management, 2007.
8
Freight Transportation Demand
9
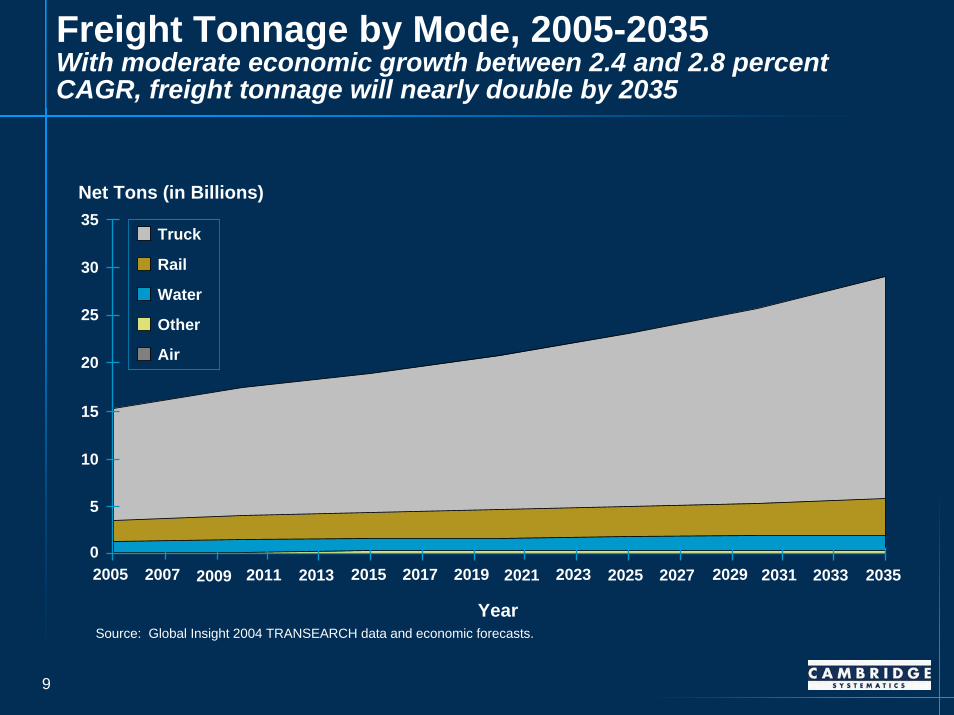
Freight Tonnage by Mode, 2005-2035With moderate economic growth between 2.4 and 2.8 percent CAGR, freight tonnage will nearly double by 2035
Net Tons (in Billions)
Truck
Rail
Water
Other
Air
5
10
15
20
25
30
35
2005 2007 2009 2011 2013 2015 2017 2019 2021 2023 2025 2027 2029 2031 2033 2035
Year
0
Source: Global Insight 2004 TRANSEARCH data and economic forecasts.
10
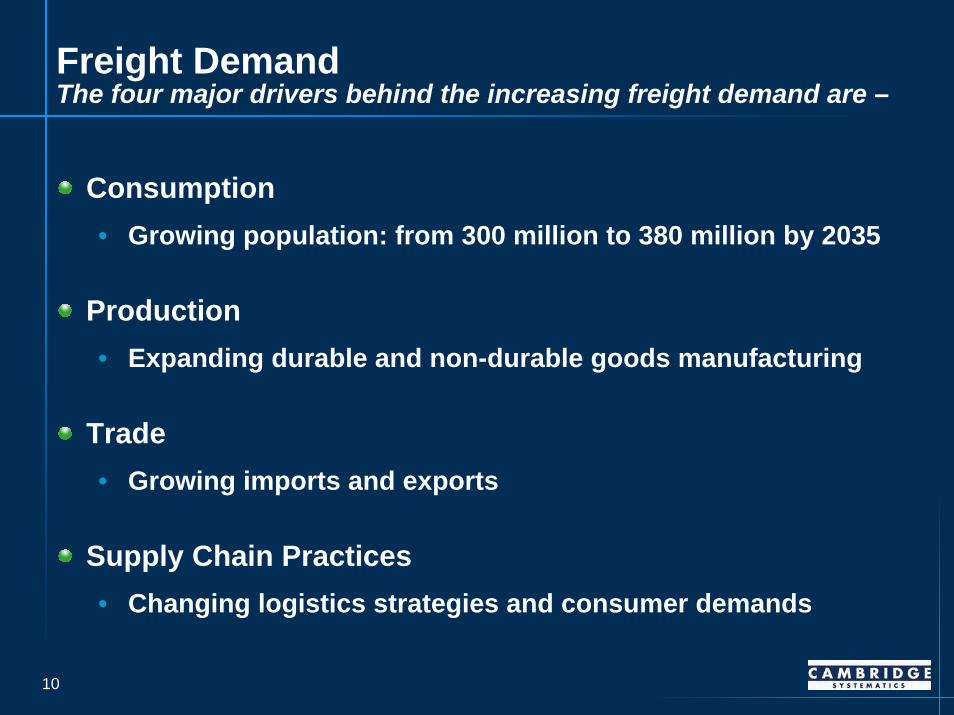
Freight DemandThe four major drivers behind the increasing freight demand are –
Consumption • Growing population: from 300 million to 380 million by 2035
Production• Expanding durable and non-durable goods manufacturing
Trade• Growing imports and exports
Supply Chain Practices• Changing logistics strategies and consumer demands
11
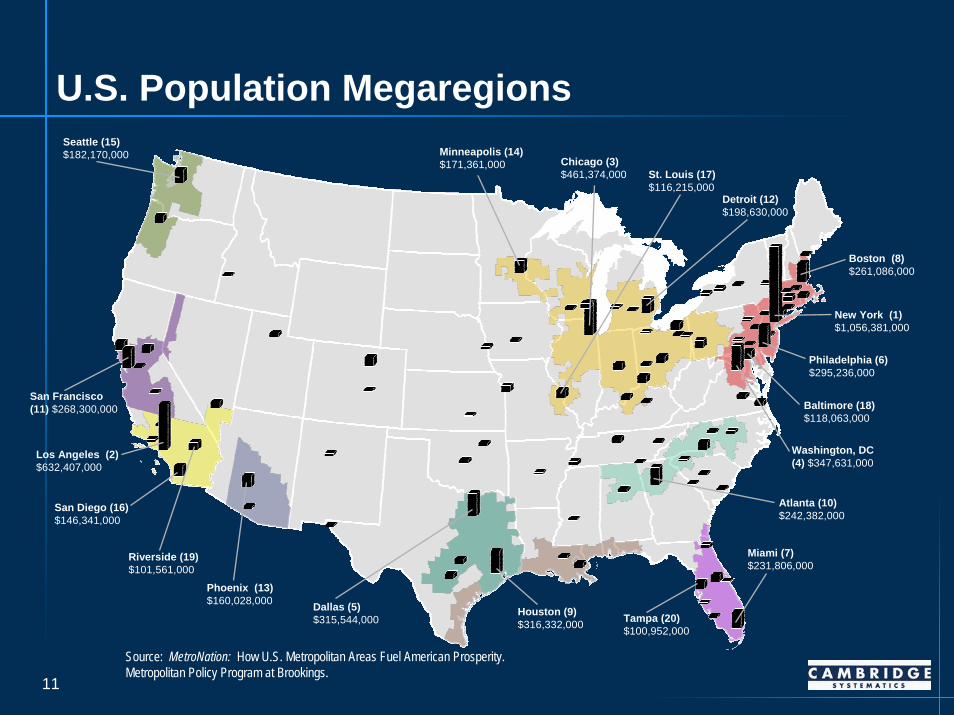
U.S. Population Megaregions
Source: MetroNation: How U.S. Metropolitan Areas Fuel American Prosperity. Metropolitan Policy Program at Brookings.
Seattle (15)$182,170,000
New York (1)$1,056,381,000
Los Angeles (2)$632,407,000
Chicago (3)$461,374,000
Washington, DC (4) $347,631,000
Dallas (5)$315,544,000
Philadelphia (6)$295,236,000
Miami (7) $231,806,000
Boston (8)$261,086,000
Houston (9)$316,332,000
Atlanta (10)$242,382,000
San Francisco (11) $268,300,000
Detroit (12)$198,630,000
Phoenix (13)$160,028,000
Minneapolis (14)$171,361,000
San Diego (16)$146,341,000
St. Louis (17)$116,215,000
Baltimore (18)$118,063,000
Riverside (19)$101,561,000
Tampa (20) $100,952,000
12
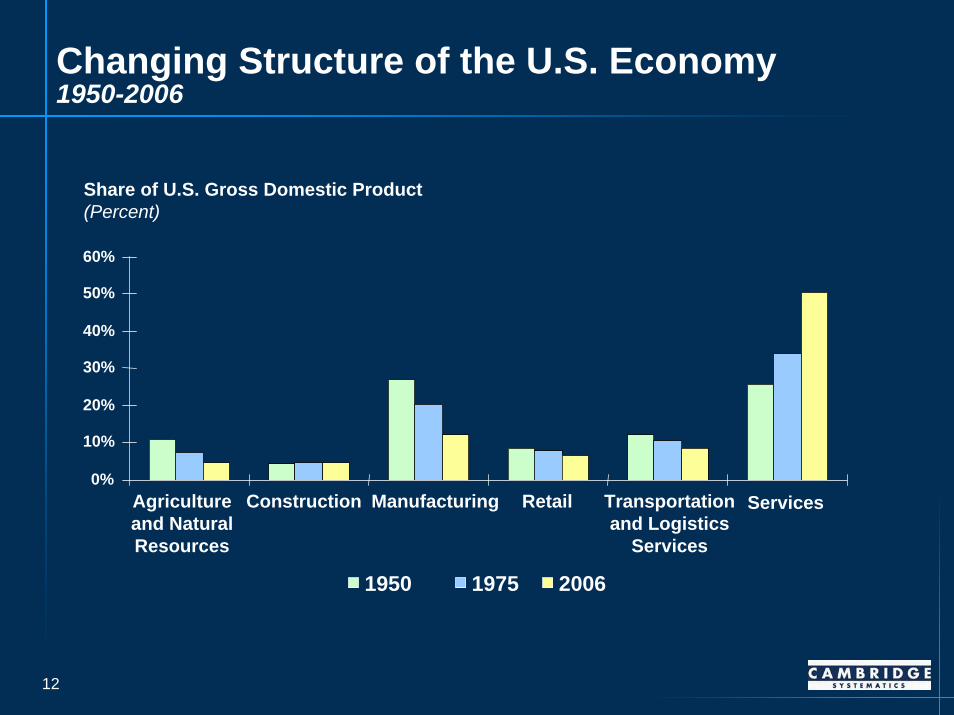
Changing Structure of the U.S. Economy1950-2006
0%
10%
20%
30%
40%
50%
60%
Agriculture and Natural Resources
Construction Manufacturing Retail Transportation and Logistics
Services
Services
Share of U.S. Gross Domestic Product(Percent)
1950 1975 2006
13
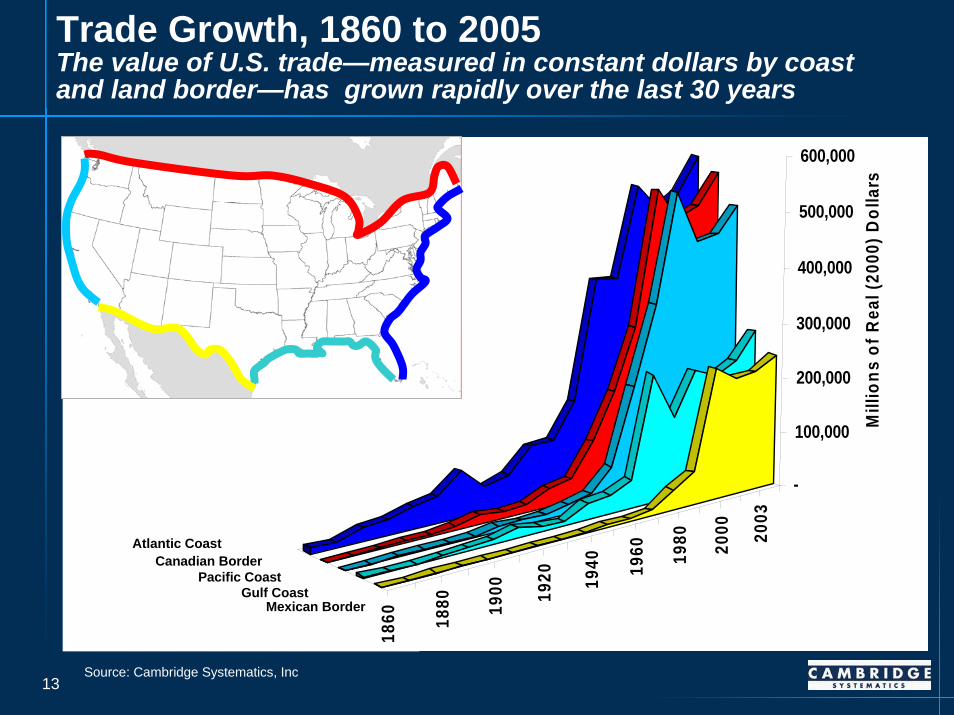
Trade Growth, 1860 to 2005The value of U.S. trade—measured in constant dollars by coast and land border—has grown rapidly over the last 30 years
1860 18
80 1900 19
20 1940 19
60 1980 20
00 2003
-
100,000
200,000
300,000
400,000
500,000
600,000
Mill
ions
of R
eal (
2000
) Dol
lars
Atlantic CoastCanadian Border
Pacific CoastGulf Coast
Mexican Border
Source: Cambridge Systematics, Inc
14
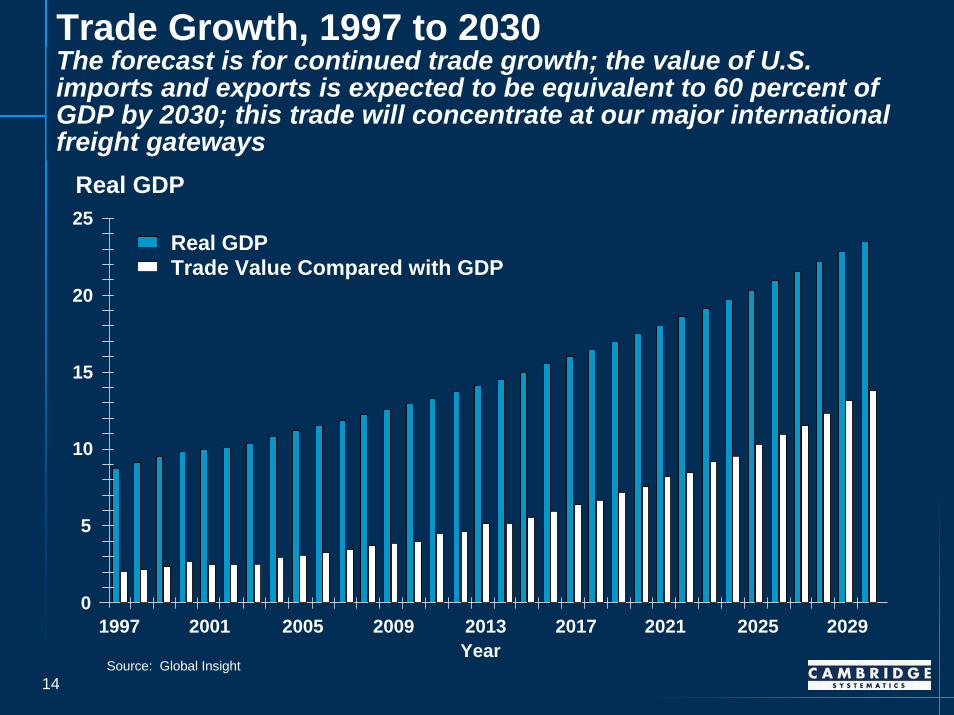
Trade Growth, 1997 to 2030The forecast is for continued trade growth; the value of U.S. imports and exports is expected to be equivalent to 60 percent of GDP by 2030; this trade will concentrate at our major international freight gateways
Real GDP
0
5
10
15
20
25
1997 2001 2005 2009 2013 2017 2021 2025 2029Year
Real GDPTrade Value Compared with GDP
Source: Global Insight
15
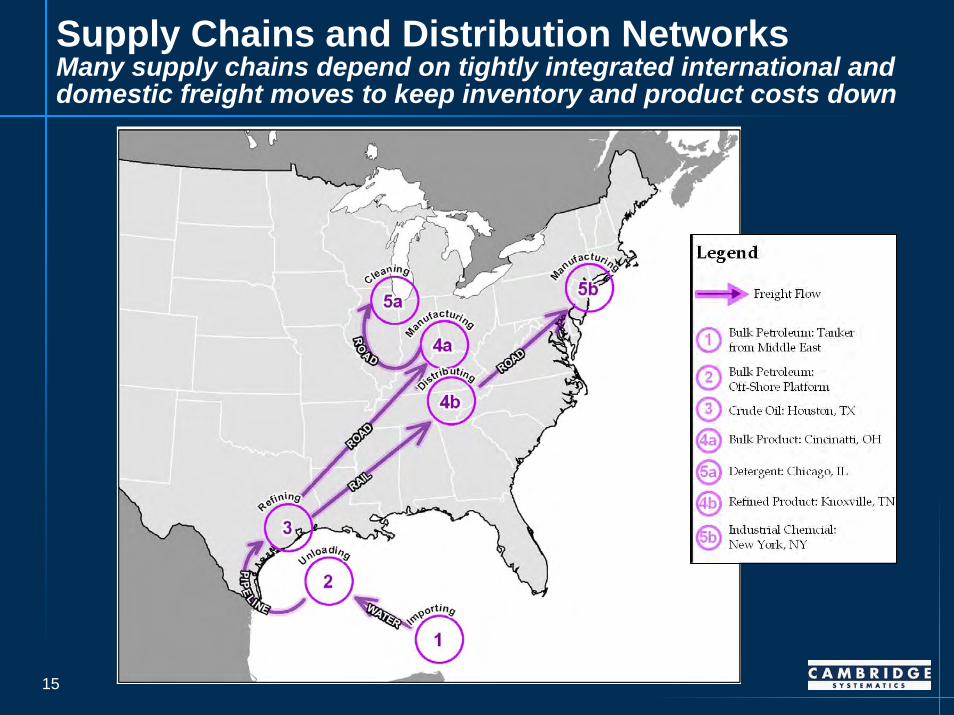
Supply Chains and Distribution NetworksMany supply chains depend on tightly integrated international and domestic freight moves to keep inventory and product costs down
16
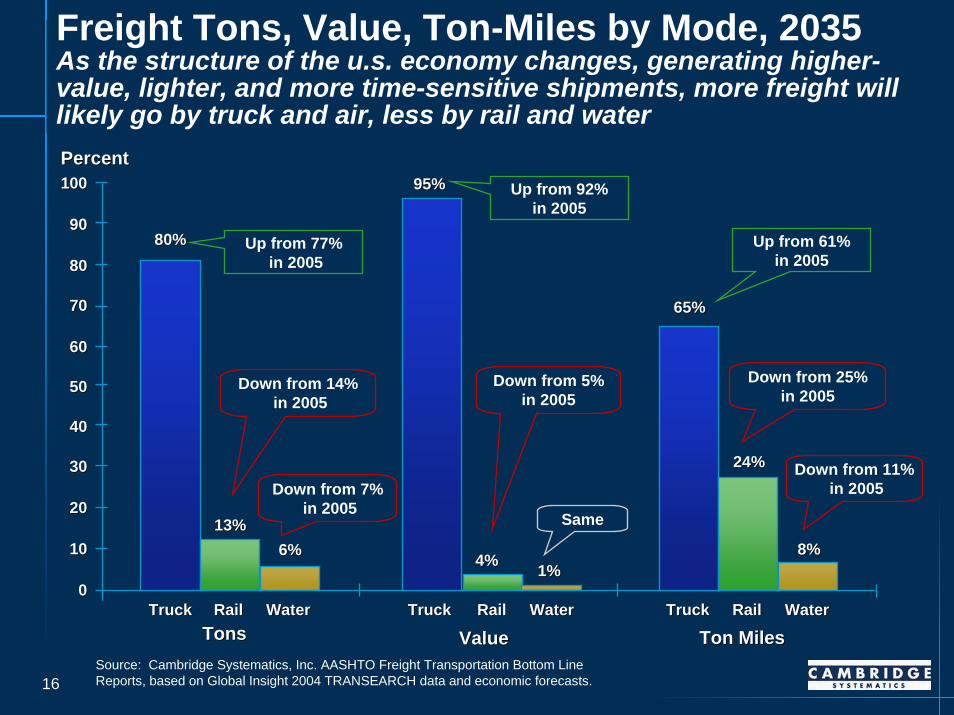
Freight Tons, Value, Ton-Miles by Mode, 2035As the structure of the u.s. economy changes, generating higher-value, lighter, and more time-sensitive shipments, more freight will likely go by truck and air, less by rail and waterPercentPercent100
Up from 77%in 2005
Up from 92% in 2005
Up from 61% in 2005
Down from 14% in 2005
Down from 5% in 2005
Down from 25% in 2005
Same
Down from 11%in 2005
100 95%95%
909080%80%
8080
7070 65%65%
6060
5050
4040
24%24%3030
2020
1010
00
TonsTons ValueValue Ton MilesTon Miles
13%13%
Down from 7%in 2005
6%6% 8%8%4%4%
1%1%
TruckTruck TruckTruck TruckTruckRailRail RailRail RailRailWaterWater WaterWater WaterWater
Source: Cambridge Systematics, Inc. AASHTO Freight Transportation Bottom Line Reports, based on Global Insight 2004 TRANSEARCH data and economic forecasts.
17
Rail Freight Transportation Capacity
18
National Rail Freight Capacity Study
Requested by the National Surface Transportation Policy and Revenue Study Commission
Commissioned by the Association of American Railroads
Prepared by Cambridge Systematics, Inc.
19
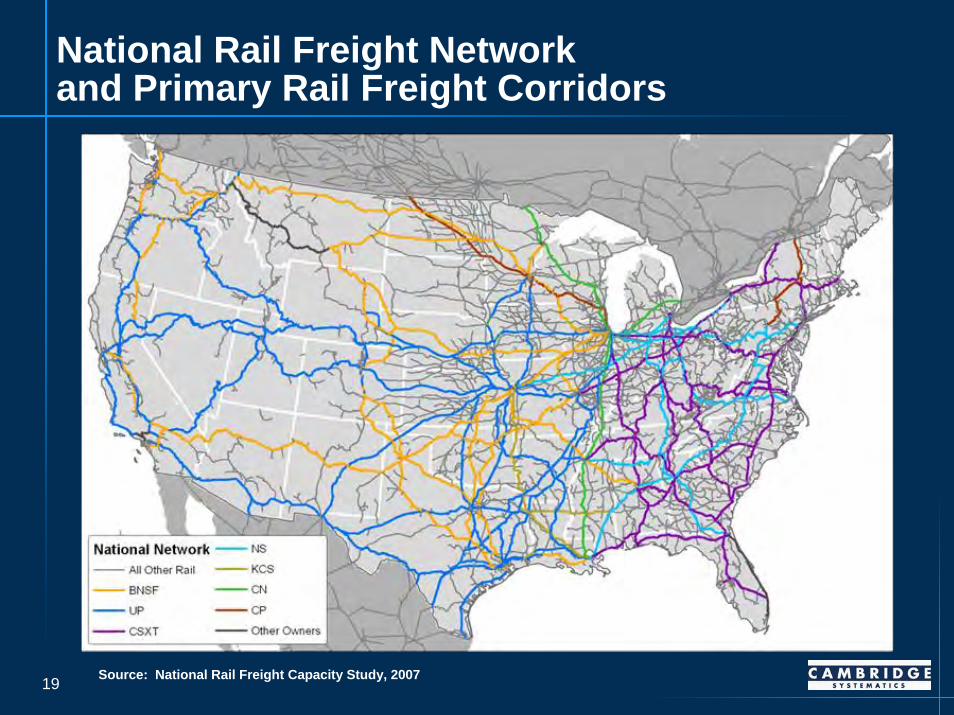
National Rail Freight Networkand Primary Rail Freight Corridors
Source: National Rail Freight Capacity Study, 2007
20
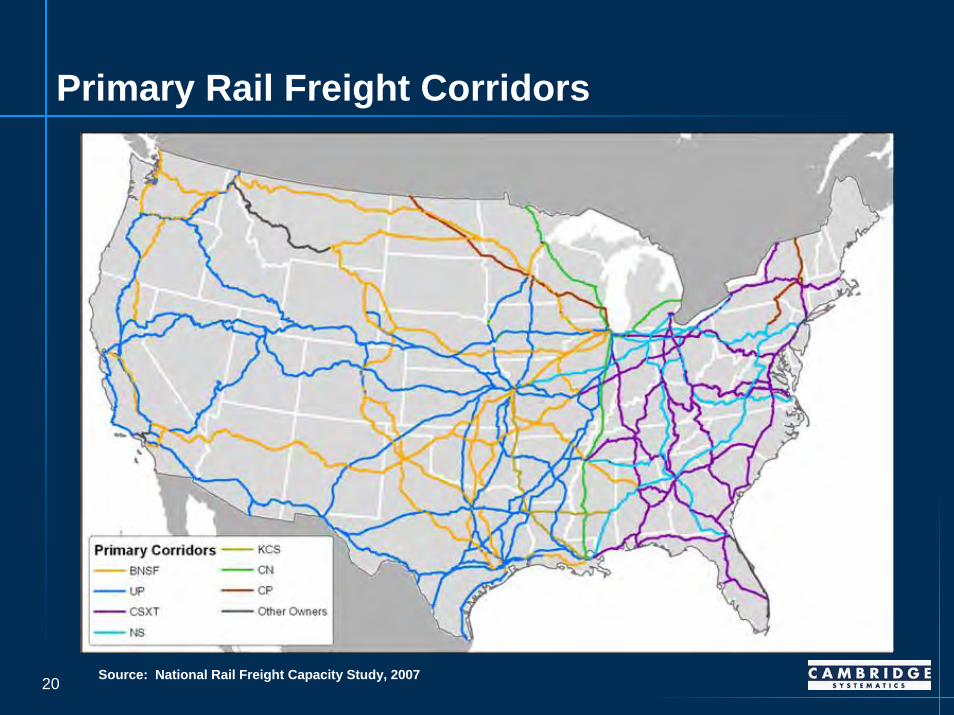
Primary Rail Freight Corridors
Source: National Rail Freight Capacity Study, 2007
21
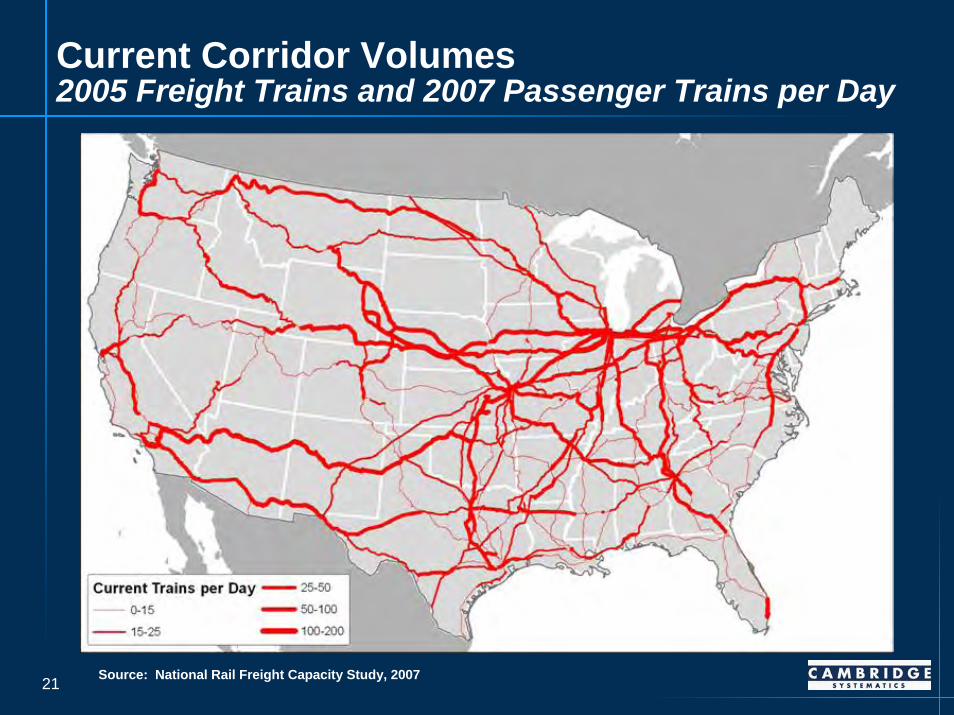
Current Corridor Volumes 2005 Freight Trains and 2007 Passenger Trains per Day
Source: National Rail Freight Capacity Study, 2007
22
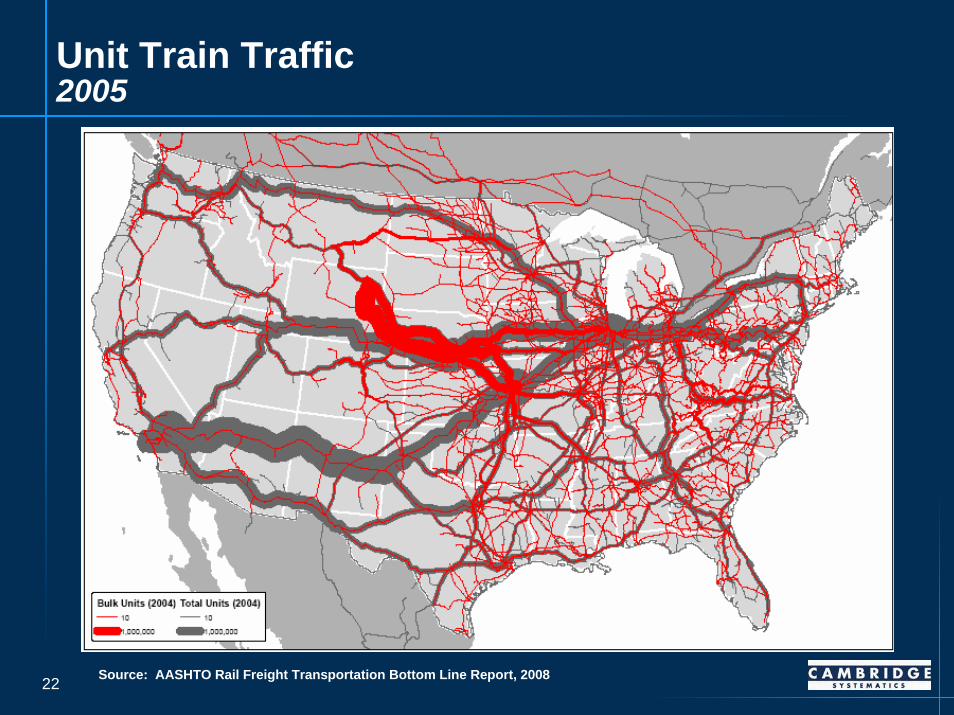
Unit Train Traffic2005
Source: AASHTO Rail Freight Transportation Bottom Line Report, 2008
23
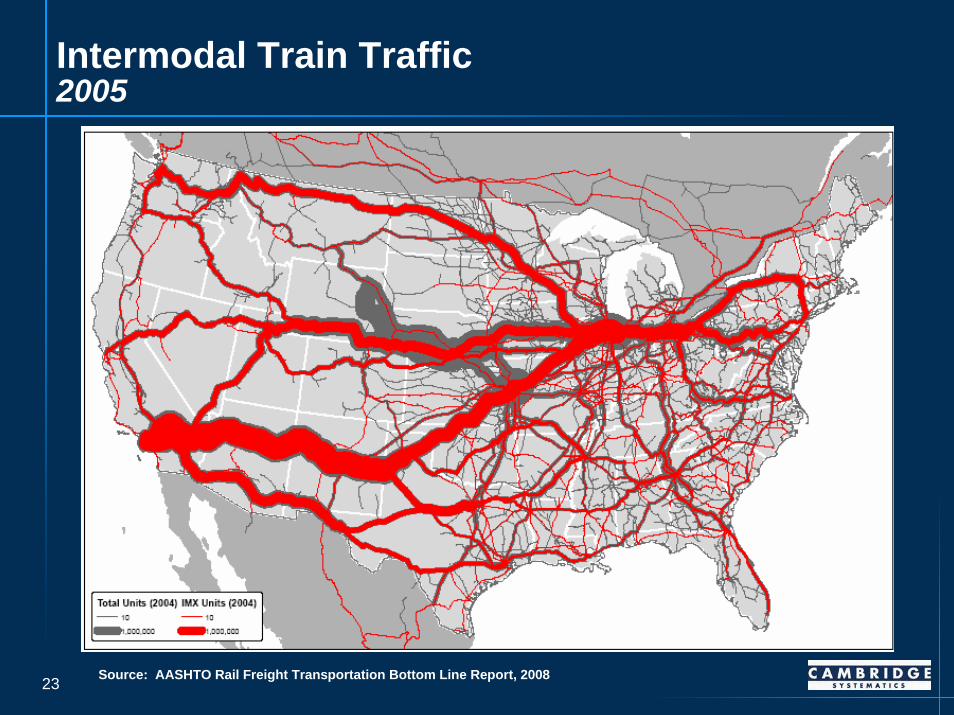
Intermodal Train Traffic2005
Source: AASHTO Rail Freight Transportation Bottom Line Report, 2008
24
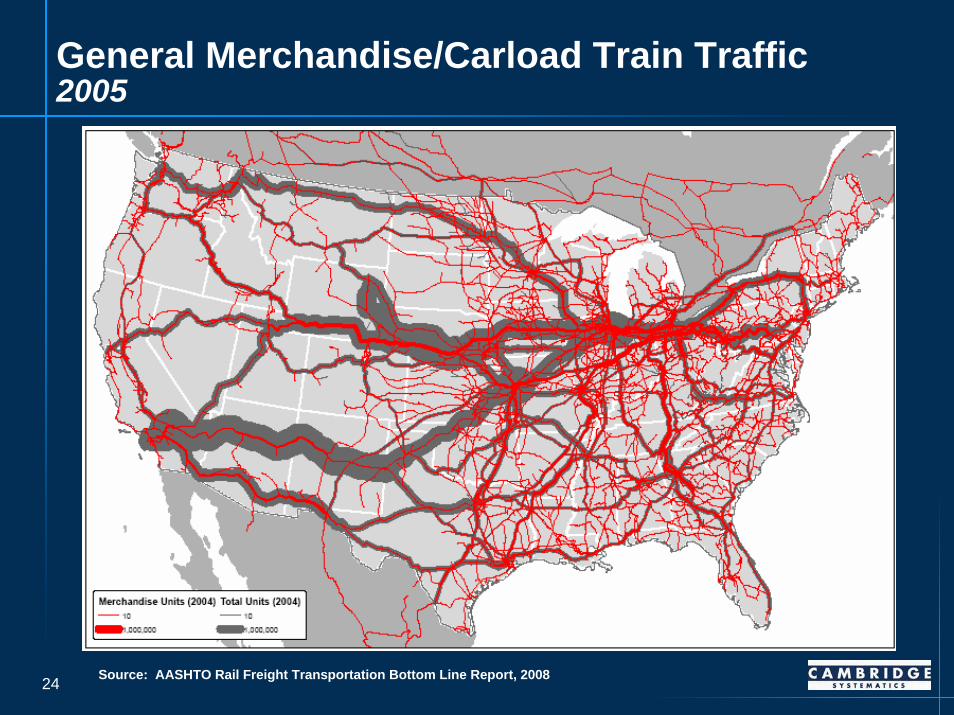
General Merchandise/Carload Train Traffic2005
Source: AASHTO Rail Freight Transportation Bottom Line Report, 2008
25
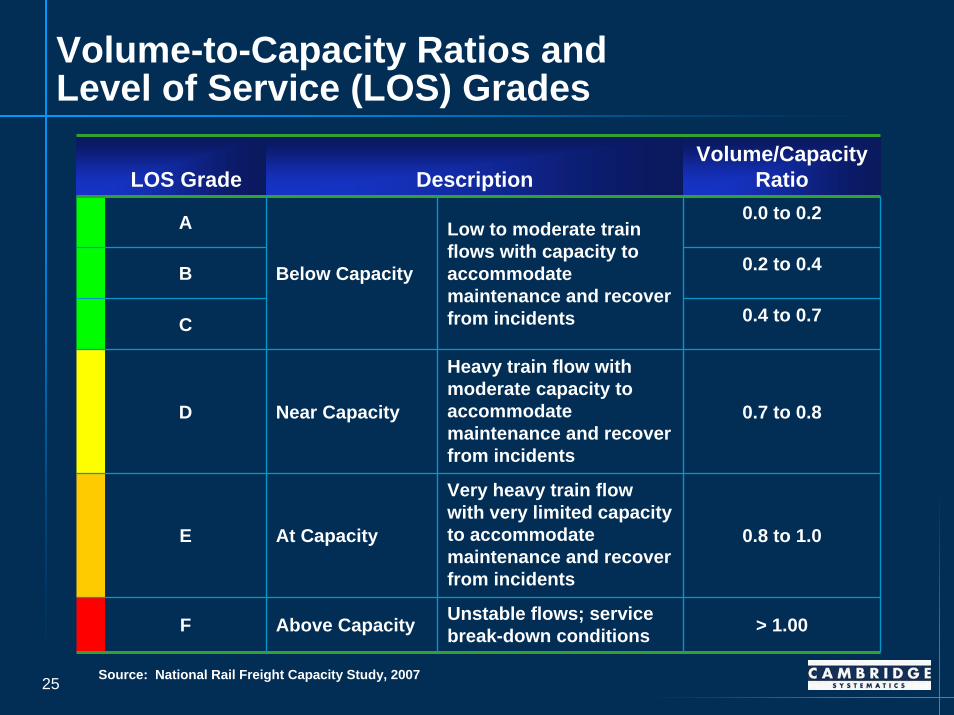
Volume-to-Capacity Ratios and Level of Service (LOS) Grades
LOS Grade DescriptionVolume/Capacity
Ratio
A 0.0 to 0.2
B 0.2 to 0.4
C 0.4 to 0.7
D Near Capacity
Heavy train flow with moderate capacity to accommodate maintenance and recover from incidents
0.7 to 0.8
E At Capacity
Very heavy train flow with very limited capacity to accommodate maintenance and recover from incidents
0.8 to 1.0
F Above Capacity Unstable flows; service break-down conditions > 1.00
Below Capacity
Low to moderate train flows with capacity to accommodate maintenance and recover from incidents
Source: National Rail Freight Capacity Study, 2007
26
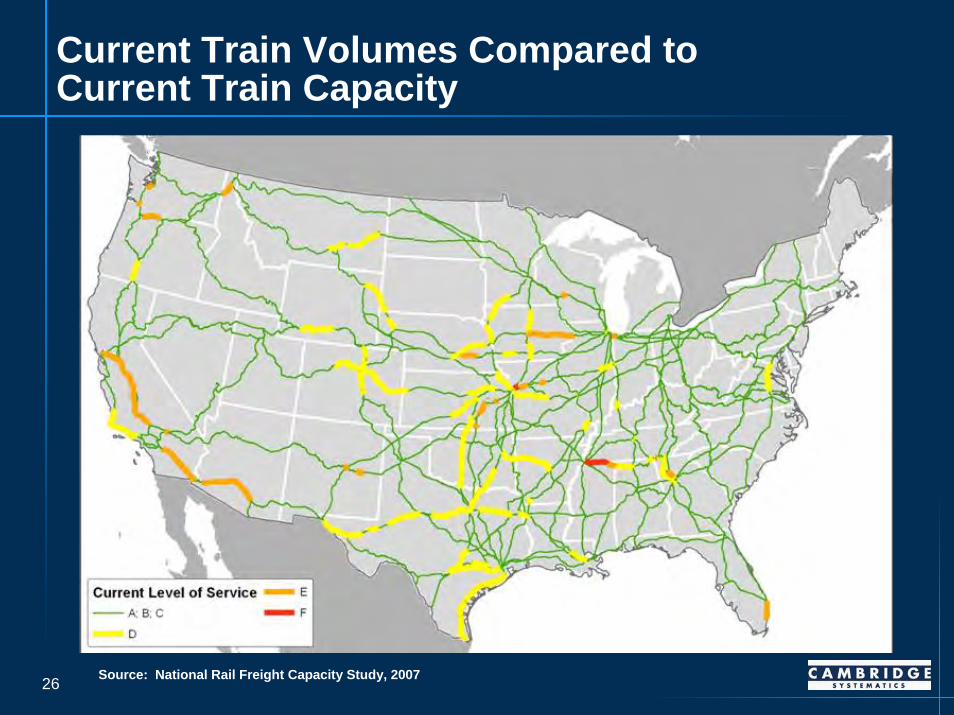
Current Train Volumes Compared to Current Train Capacity
Source: National Rail Freight Capacity Study, 2007
27
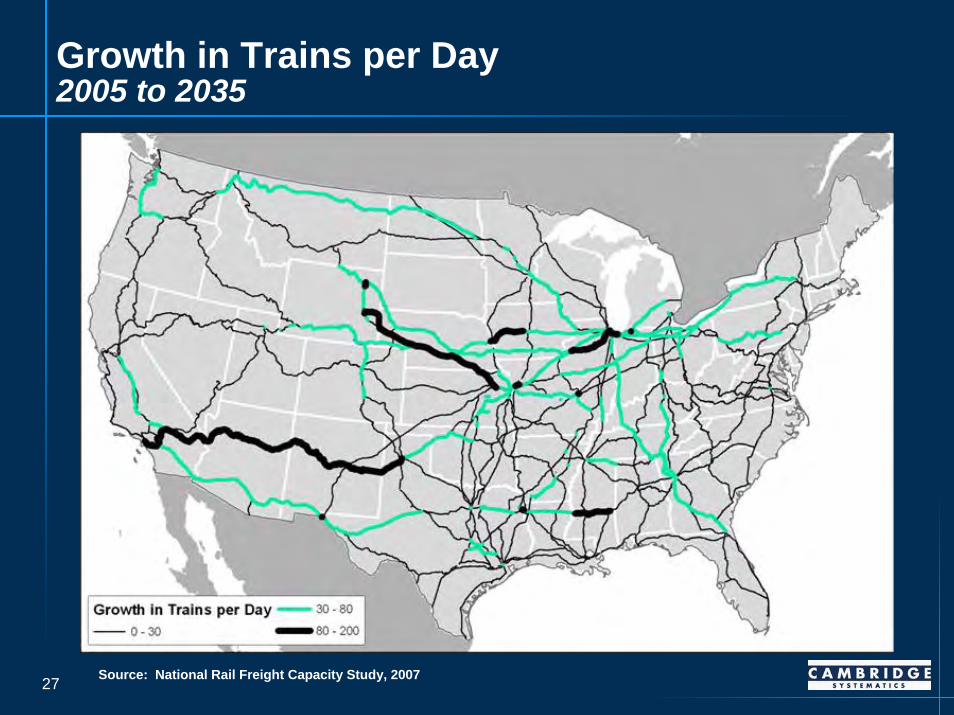
Growth in Trains per Day2005 to 2035
Source: National Rail Freight Capacity Study, 2007
28
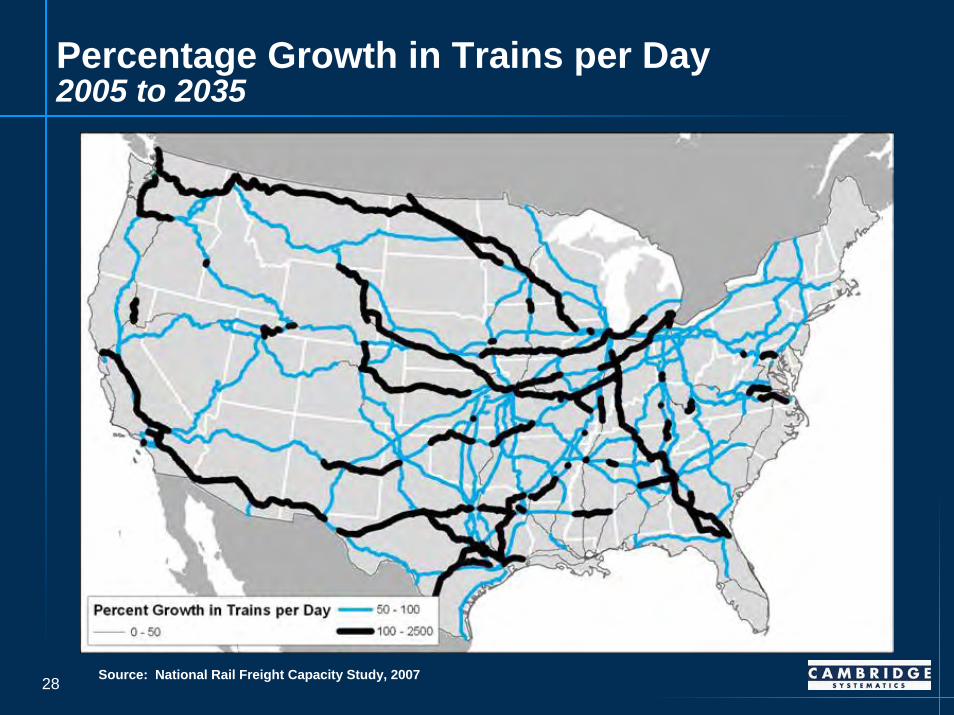
Percentage Growth in Trains per Day2005 to 2035
Source: National Rail Freight Capacity Study, 2007
29
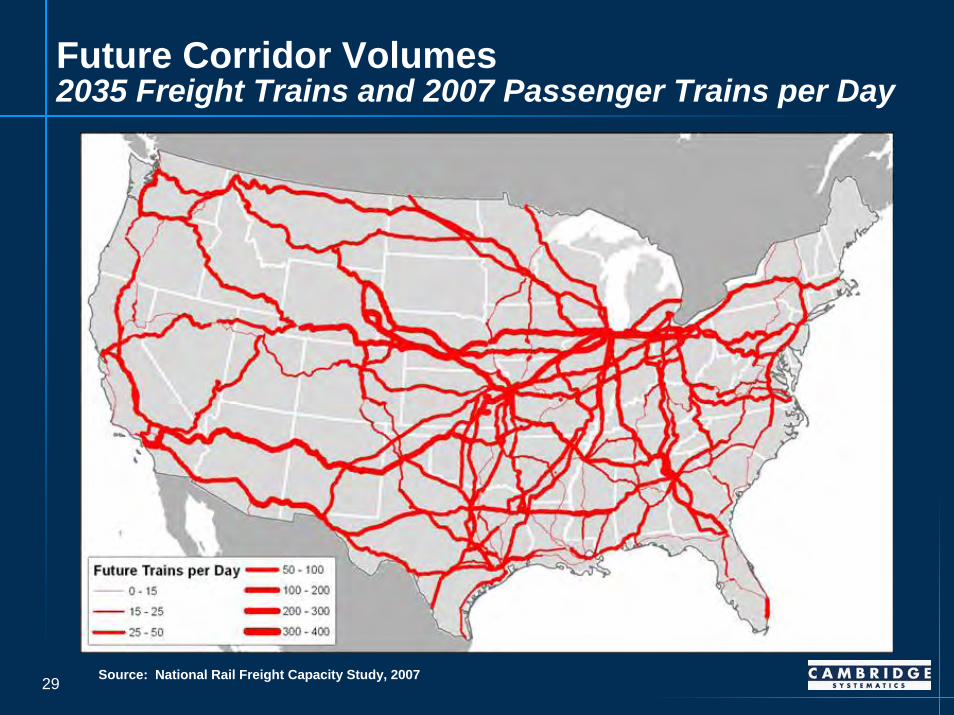
Future Corridor Volumes 2035 Freight Trains and 2007 Passenger Trains per Day
Source: National Rail Freight Capacity Study, 2007
30
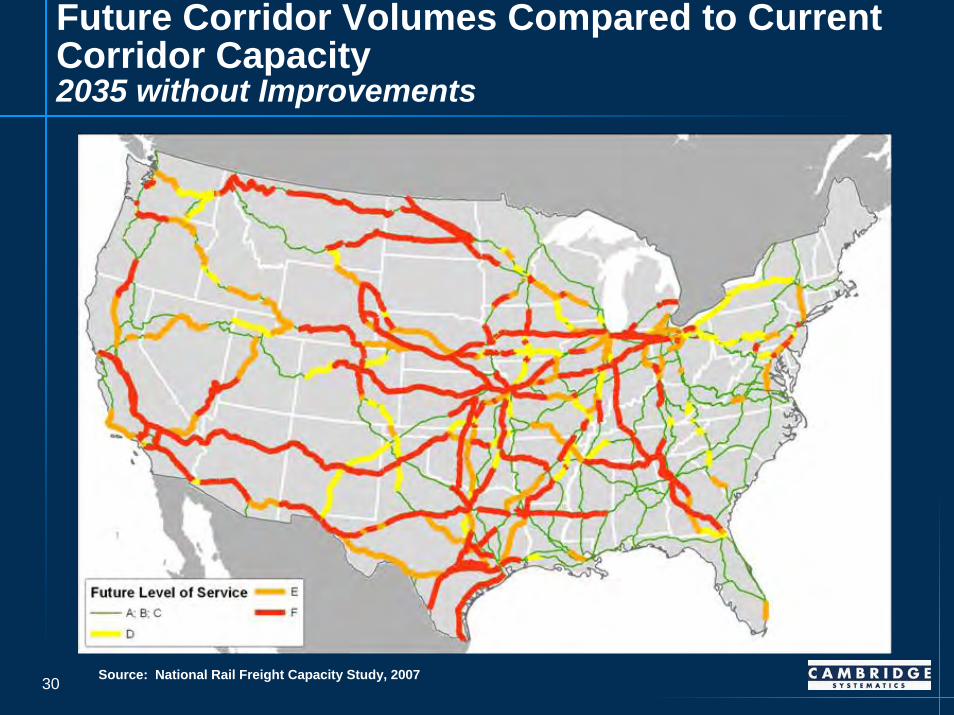
Future Corridor Volumes Compared to Current Corridor Capacity2035 without Improvements
Source: National Rail Freight Capacity Study, 2007
31
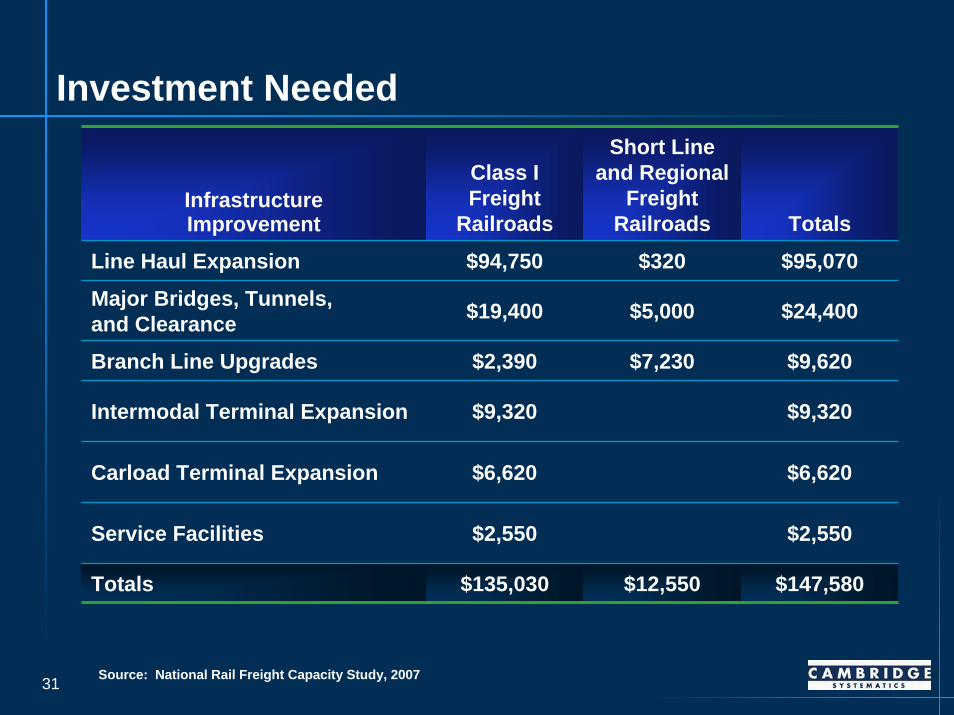
Investment Needed
Infrastructure Improvement
Class IFreight
Railroads
Short Line and Regional
FreightRailroads Totals
Line Haul Expansion $94,750 $320 $95,070
Major Bridges, Tunnels,and Clearance $19,400 $5,000 $24,400
Branch Line Upgrades $2,390 $7,230 $9,620
Intermodal Terminal Expansion $9,320 $9,320
Carload Terminal Expansion $6,620 $6,620
Service Facilities $2,550 $2,550
Totals $135,030 $12,550 $147,580
Source: National Rail Freight Capacity Study, 2007
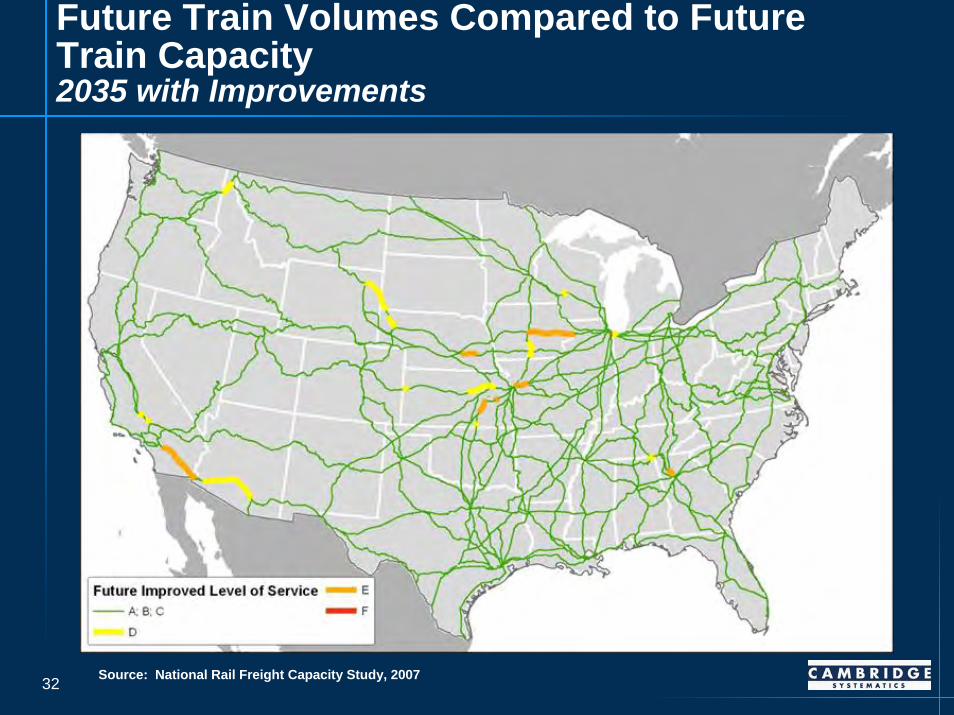
32
Future Train Volumes Compared to Future Train Capacity2035 with Improvements
Source: National Rail Freight Capacity Study, 2007
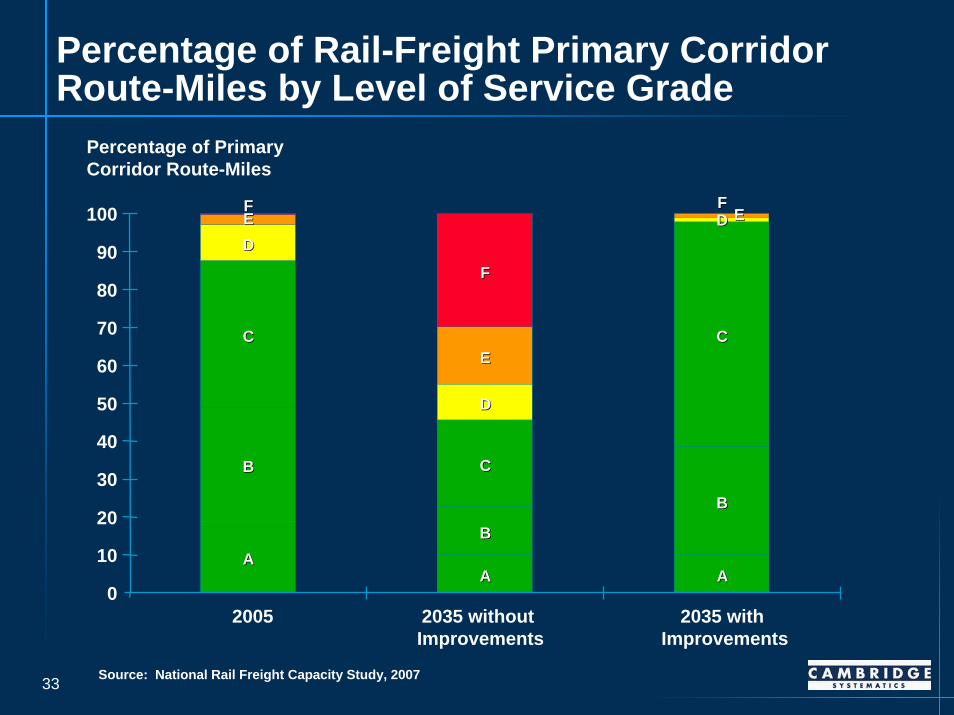
33
Percentage of Rail-Freight Primary Corridor Route-Miles by Level of Service Grade
Percentage of Primary Corridor Route-Miles
AAAA AA
BB
BB
BB
CC
CC
CC
DD
DD
DDEE
EE
EEFF
FF
FF
0
10
20
30
40
50
60
70
80
90
100
2005 2035 without Improvements
2035 with Improvements
Source: National Rail Freight Capacity Study, 2007
34
Authorization Issues
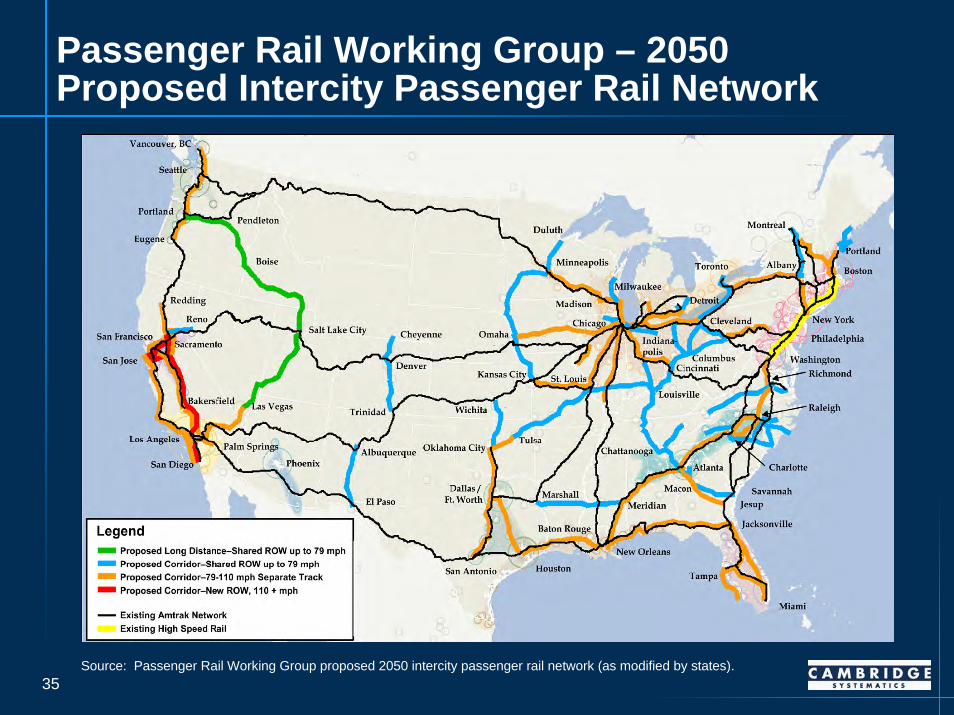
35
Passenger Rail Working Group – 2050 Proposed Intercity Passenger Rail Network
Source: Passenger Rail Working Group proposed 2050 intercity passenger rail network (as modified by states).
36
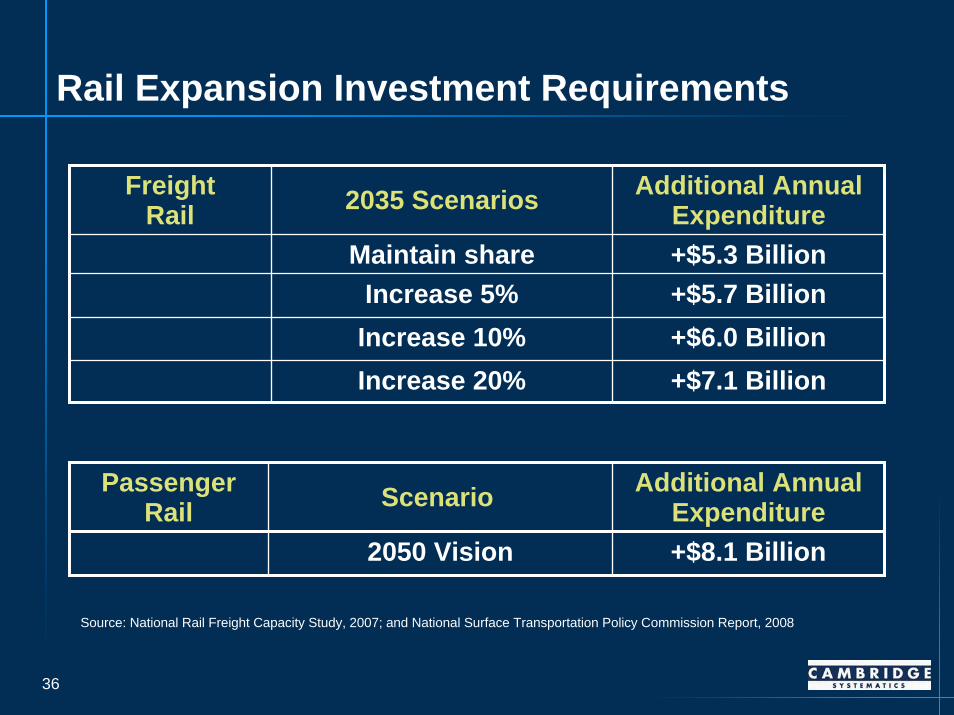
Rail Expansion Investment Requirements
FreightRail 2035 Scenarios Additional Annual
ExpenditureMaintain share +$5.3 Billion
Increase 5% +$5.7 BillionIncrease 10% +$6.0 BillionIncrease 20% +$7.1 Billion
Passenger Rail Scenario Additional Annual
Expenditure2050 Vision +$8.1 Billion
Source: National Rail Freight Capacity Study, 2007; and National Surface Transportation Policy Commission Report, 2008
37
Restructuring Urban Freight Terminals and Services
Consolidated shipments, integrated logistic centers, and inland ports
Gathering and distribution networks
38
Addressing Community and Economic Impacts
Turning up the volume• Grade crossings, noise, vibration, safety and land us
Pricing for volume• Intermodal and bulk• General merchandise/mixed carload
39
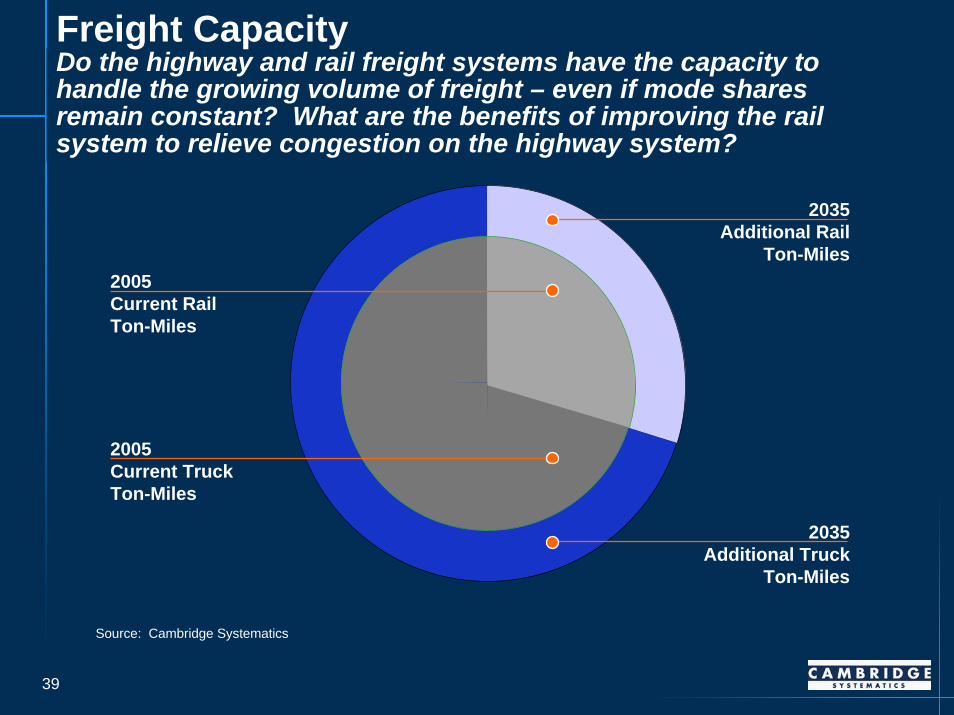
Freight CapacityDo the highway and rail freight systems have the capacity to handle the growing volume of freight – even if mode shares remain constant? What are the benefits of improving the rail system to relieve congestion on the highway system?
2035Additional Rail
Ton-Miles
2035Additional Truck
Ton-Miles
2005Current TruckTon-Miles
2005Current RailTon-Miles
Source: Cambridge Systematics

Freight Trends and Rail Capacity
Transportation leadership you can trust.
presented topresented to
2008 Ohio Conference on Freight2008 Ohio Conference on FreightToledo, OhioToledo, Ohio
presented bypresented byLance R. GrenzebackLance R. GrenzebackCambridge Systematics, Inc.Cambridge Systematics, Inc.
September 16, 2008September 16, 2008