Embed Size (px)
Citation preview
Frequency-domain photon migrationmeasurements of normal and malignant tissueoptical properties in a human subject
Joshua B. Fishkin, Olivier Coquoz, Eric R. Anderson, Matthew Brenner,and Bruce J. Tromberg
A 1-GHz multifrequency, multiwavelength frequency-domain photon migration instrument is used tomeasure quantitatively the optical absorption ~ma! and effective optical scattering ~ms9! of normal andmalignant tissues in a human subject. Large ellipsoidal ~;10-cm major axis, ;6-cm minor axes!subcutaneous malignant lesions were compared with adjacent normal sites in the abdomen and back.Absorption coefficients recorded at 674, 811, 849, and 956 nm were used to calculate tissue hemoglobinconcentration ~oxyhemoglobin, deoxyhemoglobin, and total!, water concentration, hemoglobin oxygensaturation, and blood volume fraction in vivo. Our results show that the normal and the malignanttissues measured in the patient have clearly resolvable optical and physiological property differences thatmay be broadly useful in identifying and characterizing tumors. © 1997 Optical Society of America
Key words: Light propagation in tissues, in vivo, diode lasers, near infrared, absorption, scattering,tumor, hemoglobin, water.
1. Introduction
Considerable interest has been generated in the useof optical techniques for locating, identifying, andmonitoring malignant transformations. Opticalmethods are particularly attractive because not onlydo they offer the possibility of providing tissue func-tional information, they are relatively inexpensiveand do not employ ionizing radiation. However, theprecise relationship between in vivo optical proper-ties and in vivo tissue physiology is not well under-stood. Extensive in vitro measurements of theoptical properties of various tissues have been re-ported in the literature1–3 but it is not clear fromthese studies how the optical properties of varioustypes of biological tissue differ from each other invivo. Consequently our goal is to determine quanti-tatively absolute optical and physiological properties
J. B. Fishkin, O. Coquoz, M. Brenner, and B. J. Tromberg arewith the Beckman Laser Institute and Medical Clinic, Universityof California at Irvine, 1002 Health Sciences Road East, Irvine,California 92612. E. R. Anderson is with EA Photonics, 2515 FiskLane, Redondo Beach, California 90278.Received 10 May 1996; revised manuscript received 23 August
1996.0003-6935y97y010010-11$10.00y0© 1997 Optical Society of America
10 APPLIED OPTICS y Vol. 36, No. 1 y 1 January 1997
of human tissues in vivo and correlate this informa-tion with conventional structural data derived fromother sources ~e.g., x-ray imaging, histopathology!.Because optical properties ~absolute absorption andscattering parameters! are the fundamental determi-nants of contrast in optical images, we believe thatquantitative in vivo measurements are essential forrealistically estimating the feasibility of optical de-tection of tumors.To obtain accurate quantitative measurements of
the absolute optical parameters of various types oftissue, we have constructed a portable, high-bandwidth ~0.3 MHz–1 GHz!, multiwavelengthfrequency-domain photon migration ~FDPM! instru-ment.4,5 The focus of our efforts in performing thefrequency-domain measurements presented in thispaper is to characterize normal and malignant tissuetransformations encountered in a human subject.FDPM is an optical technique that can be used todetermine quantitatively absolute tissue optical ab-sorption and reduced scattering parameters in a sin-gle, noninvasive measurement. In FDPM theintensity of light incident upon an optically turbidsample is modulated at high frequencies, and thediffusely reflected or transmitted signal is measuredwith a phase-sensitive detector. Amplitude-modulated light propagates through multiple-scattering media with a coherent front, forming

photon density waves ~PDW’s!.6–8 PDW dispersionis highly dependent on the optical properties of themedium.9 Thus measurements of the frequency- ordistance-dependent phase and amplitude of PDW’scan be used to derive absolute optical absorption andreduced scattering coefficients within a turbid me-dium.In this paper we concentrate on the relationship
between in vivo optical properties and tissue physio-logical parameters in a single human subject. It isnot our intent to present a library of optical proper-ties obtained from multiple human subjects, and it isunclear whether simple cataloging will provide suffi-cient predictive power for identifying malignanciesby the use of optical imaging methods. Rather, wepresent a detailed study on a single patient withmultiple normal andmalignant sites in order to char-acterize a system with built-in internal controls. Inthis manner, we expect to gain fundamental insightinto the precise nature of optical and physiologicalproperty changes that can occur in the case of malig-nant transformation. By obtaining individual pa-tient information, we hope to clarify specificdetectable physiological changes that can be ex-ploited by optical diagnostic methods. Conse-quently we use the absolute optical propertiesextracted from in vivo FDPM measurements at mul-tiple wavelengths to calculate hemoglobin ~Hb! con-centration ~oxygenated, deoxygenated, and totalforms!, blood volume fraction ~BVF! in the tissue, O2saturation of Hb, and H2O concentration. Our re-sults clearly show that tumor and normal tissue op-tical properties and physiological parametersmeasured in vivo differ substantially within the indi-vidual we studied.
2. Theory: Frequency-Domain Diffusion Model for aSemi-infinite Medium
Frequency-domain methods, in which the lightsource intensity is modulated at high frequency, havebeen successfully applied to in vitro spectroscopystudies of turbid media.5,9–12 Analytical solutions tothe frequency-domain standard diffusion equation~SDE! were employed in these studies to extract ac-curate absolute absorption and reduced scatteringcoefficient spectra from frequency-domain data ac-quired in turbid media. The frequency-domain SDEhas been estimated to be applicable to the study ofthick, turbid, macroscopically homogeneous turbidmedia when the source–detector separation is typi-cally greater than 1 cm and the source modulationfrequency is less than 1 GHz.13 The frequency-domain measurements presented in this paper werenoninvasively performed with the light source andthe light detector placed directly on the turbid me-dium surface in a reflection geometry under condi-tions in which the SDE is applicable. We havetherefore employed analytical frequency-domainSDE expressions derived by Haskell et al.14 to extractabsolute absorption and reduced scattering coeffi-cients from our frequency-domain phase-shift data.These frequency-domain SDE expressions, which
take into account the index of refraction mismatch atthe interface between air and the turbid medium,assume that the turbid medium under study is semi-infinite in extent and macroscopically homogeneous.The equations that describe the phase shift F of aPDW propagating in a macroscopically homogeneoussemi-infinite medium ~equations 2.7.1 and 2.7.2 inthe paper by Haskell et al.14! are given as
F~ma, m9s, r, v! 5 kimagro 2 arctan~IMAGyREAL!, (1)
where
REAL 5exp~2krealro!
ro2 cos@kimag~rob 2 ro!#
3exp~2krealrob!
rob, (2)
IMAG5 sin@kimag~rob 2 ro!#exp~2krealrob!
rob, (3)
kreal 5 S32 mam9sD1y2HF11 S v
cmaD2G1y2
1 1J1y2
, (4)
kimag 5 S32 mam9sD1y2HF11 S v
cmaD2G1y2
2 1J1y2
, (5)
ro 5 FS 1m9sD2 1 r2G1y2
,
rob 5 FS2zb 11m9sD2 1 r2G1y2
, (6)
zb 51 1 Reff
1 2 ReffS 23m9s
D . (7)
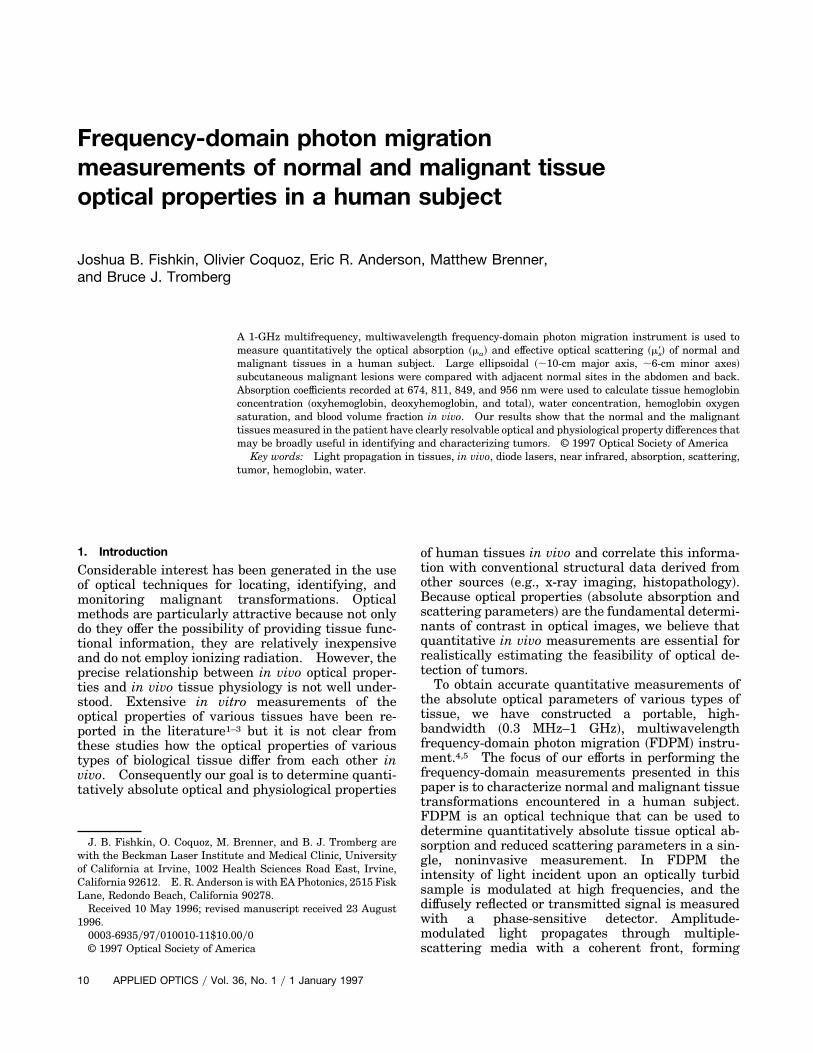
Here, ma is the absolute absorption coefficient in unitsof inverse centimeters, m9s is the reduced scatteringcoefficient in units of inverse centimeters, r is thedistance separating the source and the detector onthe surface of the turbid medium in units of centime-ters, v is the angular intensity-modulation frequencyof the light source, c is the speed of light in the trans-portingmedium surrounding the scattering particles,andReff is the effective reflection coefficient. Reff ~de-fined in equation 2.3.7 in the paper byHaskell et al.14!represents the fraction of the diffusing light in thesemi-infinite turbid medium that is internally re-flected because of the index of refraction mismatch atthe medium boundary. Equations ~1!–~7! describean extrapolated boundary condition, which is sche-matically represented in Fig. 1. Zb is the distancefrom the medium surface to the extrapolated bound-ary. We calculate Reff from indices of refraction nand nout ~see Fig. 1 for definitions!, utilizing theFresnel reflection coefficient for unpolarized light.14We use Eq. ~1! to extract the absolute optical ab-
sorption coefficient ma and reduced scattering coeffi-cient m9s from frequency-domain data acquired in vivo
1 January 1997 y Vol. 36, No. 1 y APPLIED OPTICS 11
in biological tissue. Our goal is to calculate in vivotissue physiological properties from in vivo measure-ments of ma and m9s at multiple light source wave-lengths l and multiple source–detector separationsr.
3. Experimental Apparatus and Method
A. Portable, Multisource, High-BandwidthFrequency-Domain Photon Migration Instrument
A portable, multilight source, high-bandwidth,FDPM instrument is used to perform all of our mea-surements.5 A network analyzer ~Hewlett-PackardModel 8753C! is used to produce modulation sweptfrom 300 kHz to 1 GHz that is superimposed on thedirect current of a diode laser. Four different lasersare currently available on this instrument ~SDL, Inc.Models 7421, 5420, 5421, and 6321 at 674, 811, 849,and 956 nm, respectively! and each diode is ad-dressed serially by a rf switch. The optical powercoupled into the tissue on the day of our measure-ments on the human subject averaged approximately30 mW for the 674-, 811-, and 849-nm laser diodesand approximately 1 mW for the 956-nm laser diode.An avalanche photodiode ~HamamatsuModel C5658!is used to detect the diffuse optical signal that prop-agates through the biological tissue. A 100-mm-diameter gradient-index fiber is coupled to the lightsource used for tissue measurements, with the ava-lanche photodiode and the probe end of the sourceoptical fiber in direct contact with the patient ~i.e., asemi-infinite medium measurement geometry, Fig.1!. Measurement time depends on the precision re-quired and the number of sweeps performed. Forthe measurements performed on the human subject,the time used to sweep over the 1-GHz band of mod-ulation frequencies was 1 s. The network analyzeris controlled by a computer ~Macintosh Quadra! andvirtual instrument software ~LABVIEW, National In-struments!. The source–detector separations usedfor our FDPM measurements on the human subjectwere 1.7, 2.2, and 2.7 cm.
Fig. 1. Source and image configuration for the extrapolatedboundary condition.14 The placement of the image is scaled ap-proximately for an air–medium interface, with the refractive indexof the medium equal to that of tissue.15
12 APPLIED OPTICS y Vol. 36, No. 1 y 1 January 1997
B. Calibration of the Frequency-Domain Apparatus
A measurement of the phase shift of intensity-modulated light at source wavelength l propagatingthrough a turbid medium at a given source–detectorseparation r can be expressed as
Fmeasured~ma, m9s, r, v! 5 Fmedium~ma, m9s, r, v!
1 Finstrument~v, l!, (8)
where Fmeasured~ma, m9s, r, v! is the phase shift mea-sured at r at angular modulation frequency v andsource wavelength l, Fmedium~ma, m9s, r, v! is theactual phase shift of the intensity-modulated lightcaused only by the medium optical properties,and Finstrument~v, l! is the instrument phase.Finstrument~v, l! is dependent on the properties of thelight source, detector, optical fibers, and the electricalresponse of the phase-sensitive detection system.Because ma~l! and m9s~l! are the immediate quantitiesof interest in a FDPM measurement, an accuratedetermination of these optical parameters from thephase-shift data necessitates an analysis ofFmedium~ma, m9s, r, v! data rather than a direct anal-ysis of Fmeasured~ma, m9s, r, v! data. Thus we subtractFinstrument~v, l! from Fmeasured~ma, m9s, r, v! data be-fore the data analysis in order to yield more accuratevalues of ma~l! and m9s~l! from our FDPM data fits.One method for eliminating the instrument re-
sponse from FDPM data acquired in a macroscopi-cally homogeneous turbid medium is to comparePDW properties measured at two different source–detector separations, r and ro. Assuming that theinstrument response at a given source wavelength isconstant for separate measurements at r and ro, thebehavior of the resulting FDPM data should be en-tirely reflective of the optical properties of the turbidmedium under investigation and independent of theabove-mentioned instrument response. When thistwo-distances measurement technique is used, Eq.~8! yields
Fmedium~ma, m9s, r, v! 2 Fmedium~ma, m9s, ro, v! 5
Fmeasured~ma, m9s, r, v! 2 Fmeasured~ma, m9s, ro, v!, (9)
where Finstrument~v, l! has been eliminated from themeasured data, thereby allowing SDE phase-shiftequations to be applied directly to the resultantFDPM data. Accurate ma~l! and m9s~l! spectra havebeen obtained by Fishkin et al. for a macroscopicallyhomogeneous 2.5-mM methemoglobiny1.5% Lyposynmedium; they used the frequency-domain SDE to fitFDPM data acquired with the two-distances tech-nique.10 Accurate absolute optical spectra of turbidmedia have also been acquired by Fantini et al., whoused this same technique.11 This approach workswell under macroscopically homogeneous measure-ment conditions because the frequency-domain SDEassumes that ma~l! and m9s~l! are independent of thesource–detector separation.However, in human biological tissues, the assump-
tion that the ma~l! and m9s~l! values are constantthroughout the tissue is not necessarily valid. The

Fig. 2. ~a! CT scan of the subject’s trunk, which was made one month before our FDPM measurements on the subject. The abdominaltumor is indicated by the right arrow ~this right arrow also indicates the source–detector location for the FDPM tumor measurement!.The left arrow indicates the source–detector location for the FDPM measurements on the opposite-side normal abdominal tissue. A,anterior; P, posterior; R, right; L, left. Note the distance scale ~in centimeters! above the L. ~b! Same as ~a!, except the CT scan shownhere yields an image of a different cross section of the subject’s trunk. The back tumor is indicated by the left arrow. The right arrowindicates the source–detector location for the FDPM measurements on the opposite-side normal back tissue.
two-distances measurement technique may com-pound inaccuracies inherent in applying the SDE~which assumes macroscopic homogeneity! to macro-scopically heterogeneous systems. For this reason,we determine optical properties from in vivo FDPMdata acquired at a single source–detector separationr. Although the application of the SDE to FDPMdata acquired at a single r may still not be strictlyaccurate, we assume that the ma~l! and m9s~l! valuesmeasured represent an average for the heteroge-neous region probed. By using this approach, wecan estimate the degree of tissue heterogeneity byevaluating the optical properties at multiple values ofr.In order to extract Fmedium~ma, m9s, r, v! from
Fmeasured~ma, m9s, r, v! at a single source–detectorseparation r, Finstrument~v, l! must be explicitly eval-uated @see Eq. ~8!#. We account for the contributionof Finstrument~v, l! to Fmeasured~ma, m9s, r, v! by cali-brating the FDPM instrument at each l on a macro-scopically homogeneous tissuelike reference materialof known optical properties. The optical propertiesma~l!ref and m9s~l!ref of the homogeneous standard areobtained from FDPM data acquired with the two-distances technique. We note from Eq. ~8! that theuncertainty in Finstrument~v, l! must propagate intoFmedium~ma, m9s, r, v!. The magnitude of these un-certainties has a direct impact on errors in opticaland physiological property calculations.
C. Measurements on a Human Subject
We have conducted noninvasive optical property mea-surements of palpable tumors in a human subject.Experiments were conducted under the guidelines ofthe University of California at Irvine, Institutional Re-
view Board-approved protocol 95-563. The patientwas a 62-year-old white male with poorly differenti-ated, large-cell primary lung carcinoma. Threemonths after his initial staging workup, multiple sub-cutaneous masses began appearing over his trunk andextremities. Histological examination of needle bi-opsy specimens revealed poorly differentiated large-cell adenocarcinoma, similar to the primary lungcancer.FDPM measurements were performed on two pal-
pable subcutaneous lesions ~one abdominal, one back,ellipsoidal shape with ;10-cm major axis, ;6-cm mi-nor axes! and compared with opposite-side normaltissue. Figure 2 shows computer-aided tomography~CT! images of the subject’s trunk obtained onemonth before the FDPM measurements. Tumorsappeared to increase in size during the time intervalbetween CT and FDPM scans. The patient receivedoral and intravenous iodine-based contrast agents forthis CT scan. The Fig. 2~a! CT image shows theabdominal tumor measurement site, indicated by theright arrow, and the adjacent normal tissue measure-ment location, indicated by the left arrow. In Fig.2~b!, images of the back tumor and normal measure-ment sites are indicated by the left and the rightarrows, respectively. The CT scans clearly showthat for the 1.7–2.7-cm range of source–detector sep-arations employed, FDPM data were primarily influ-enced by tumor and subcutaneous fat. Although theabdominal tumor had approximately a 1-cm-thicklayer of skin and fat above it, this zone is likely tohave been depleted by the time FDPMmeasurementswere performed, because of rapid tumor growth dur-ing the 1-month interval between the CT scan andthe FDPM measurement. The back tumor did not
1 January 1997 y Vol. 36, No. 1 y APPLIED OPTICS 13

Fig. 3. ~a! Phase shift versus FDPM data obtained on normal and malignant tissue on the human subject’s abdomen. These phase-shiftdata were acquired at a distance of 1.7 cm from the light source at a wavelength of 674 nm. ~b! Same as ~a!, except the source wavelengthwas 811 nm. ~c! Same as ~a!, except the source wavelength was 849 nm. ~d! Same as ~a!, except the source wavelength was 956 nm.
appear to have an appreciable layer of normal tissueabove it. Of course, CT images do not necessarilyreveal the exact zone of malignant tissue. Thus it ispossible that the tumor optical property measure-ments may, to some extent, contain a small contribu-tion from surrounding normal structures. However,we believe that this effect is probably minimal in viewof the high tumor–normal tissue optical property con-trast and the good agreement between the measure-ments of the stomach and back malignant sites ~seeSection 4!.The patient was breathing O2 from a tank ~through
a nasal cannula at 2 Lymin! before and throughoutthe duration of our FDPM measurements. All fourof the diode laser sources currently available on ourFDPM instrument were used in these measure-ments: 674, 811, 849, and 956 nm ~average powercoupled to the tissue surface was approximately 30mW for the 674-, 811-, and 849-nm sources and ap-proximately 1 mW for the 956-nm diode because ofpoor coupling of the optical fiber with the diode lasersource!. As described above, the source modulation
14 APPLIED OPTICS y Vol. 36, No. 1 y 1 January 1997
frequencies ranged from 300 kHz to 1 GHz, andFDPM data were recorded in 5-MHz increments.Average phase shift Fmeasured~ma, m9s, r, v! valueswere obtained over this ;1-GHz bandwidth by theperformance of two multifrequency sweeps per mea-surement. The uncertainty in Fmeasured~ma, m9s, r, v!is the standard deviation from this quantity ~deter-mined by the averaging of the deviations from thisquantity over the total number of frequency sweeps!.The uncertainty in Fmeasured~ma, m9s, r, v! togetherwith the uncertainty in Finstrument~v, l! ~which, as wementioned above in Subsection 3.B, is determined bymaking a calibration measurement on a macroscop-ically homogeneous standard phantom! determinesthemagnitude of the error bars on theFmedium~ma, m9s,r, v! data shown in Fig. 3. A handheld probe wasused that accommodated several source–detectorseparations, ranging from 1.2 to 2.7 cm in 0.5-cmincrements. The FDPM instrument was calibratedas described above by the performance of measure-ments at a fixed source–detector separation on astandard reference material.

Phase-shift data obtained from FDPM measure-ments on tissue @see Fmedium~ma, m9s, r, v! data, Fig. 3#were fit to Eq. ~1! to extract the absolute optical ab-sorption coefficient ma and the absolute optical re-duced scattering coefficient m9s at a given l andsource–detector separation r. Each point of thephase shift versus frequency data fit to Eq. ~1! wasweighted in that fit according to the magnitude of itserror bar. Minimization of the x2 surface in the fit-ting of the phase shift versus frequency data wasobtained by the use of a Marquardt–Levenberg algo-rithm for minimizing x2 with respect to the fittingparameters ma and m9s in Eq. ~1!. A tissue refractiveindex of 1.40 was assumed in these data fits15; hencethe value calculated for the effective reflection coeffi-cient @see Eq. ~7!# was Reff 5 0.493.14We assume that the chomophores contributing to
ma in the human subject are principally oxyhemoglo-bin, deoxyhemoglobin,16 and H2O. The concentra-tion of each component in the tissue is determinedfrom the FDPM measurements of ma at three differ-ent wavelengths. A system of three equations of theform
e@Hb#l @Hb# 1 e@HbO2#
l @HbO2# 1 e@H2O#l @H2O# 5 ma
l (10)
is solved, where e@chrom.#l is the extinction coefficient
~in units of square centimeters per mole! of a givenchromophore at wavelength l and @Hb#, @HbO2#, and@H2O# are, respectively, the concentration of Hb, ox-ygenated Hb, and H2O ~in units of mole per cubiccentimeter! in the tissue under study. Becausemeasurements of ma are made at four different lightwavelengths, we use two different sets of three equa-tions to determine the three unknown quantities@Hb#, @HbO2#, and @H2O#. e@Hb#
l , e@HbO2#l , and e@H2O#
l areobtained from literature values ~note that we reportthese literature values in a natural logarithmscale!.17,18 For the wavelengths of 674, 811, and 956nm, the matrix representation of the system of threeequations given by Eq. ~10! is
F6.5783 3 106
1.8331 3 106
1.5006 3 106
0.7401 3 106
2.1539 3 106
3.0486 3 106
0.07480.4277.24
G3 S@Hb#
@HbO2#@H2O#
D 5 Sma674
ma811
ma956D . (11)
Each column of the matrix in Eq. ~11! contains theextinction coefficients of a given chromophore at eachof the above-mentioned wavelengths. Each row ofthe matrix corresponds to a different light wave-length l. Multiplication of the above equation bythe inverse of the above matrix of extinction coeffi-cients yields values for @Hb#, @HbO2#, and @H2O# in thetissue interrogated by our FPDM instrument. Forthe wavelengths of 674, 849, and 956 nm, the matrixrepresentation of the system of three equations given
by Eq. ~10! is
F6.5783 3 106
1.8089 3 106
1.5006 3 106
0.7401 3 106
2.6588 3 106
3.0486 3 106
0.07480.7817.24
G3 S@Hb#
@HbO2#@H2O#
D 5 Sma674
ma849
ma956D . (12)
Given the comparable magnitude and relativelysmall values of e@H2O#
l at 811 and 849 nm ~i.e., e@H2O#l at
811 and 849 nm is more than a factor of 106 less thanthe Hb extinction coefficients e@Hb#
l and e@HbO2#l at 811
and 849 nm!, we did not find it useful to use the 811-and 849-nm wavelengths together in our system ofthree equations and three unknowns to extract abso-lute concentration of @Hb#, @HbO2#, and @H2O# in thetissue. Rather, we found it preferable to include thema value measured at only one or the other of thesewavelengths with the 674- and 956-nm ma values inour system of three equations. This allowed for thesimultaneous extraction of @Hb#, @HbO2#, and @H2O#concentration from our ma data. @Please refer to theabove matrix Eqs. ~11! and ~12! for the e@H2O#
l values#.Confirmation of the validity of this approach is pro-vided by our observation that the use of either 674-and 811-nm ma data, or 674- and 849-nm ma data in asystem of ~two equations!y~two unknowns! yields,within experimental uncertainties, the same resultfor @Hb# and @HbO2#. We therefore stress that inclu-sion of the ma value determined at 956 nm into oursystem of three equations was essential for extractingabsolute H2O concentration from our in vivo tissuemeasurements.Finally, for a system of equations of the form of Eq.
~11! or Eq. ~12!, in which the 3 3 3 matrix in theseequations is given as
M ; Fadg
beh
cfiG , (13)
the total uncertainties d for each parameter @Hb#,@HbO2#, and @H2O# can be determined, i.e.,
d@Hb# 51
det~M!@~Dma
l1!2~ei2 hf !2 1 ~Dmal2!2
3 ~bi2 hc!2 1 ~Dmal3!2~bf2 ec!2#1y2 , (14)
d@HbO2# 51
det~M!@~Dma
l1!2~di2 fg!2 1 ~Dmal2!2
3 ~ai2 gc!2 1 ~Dmal3!2~af2 dc!2#1y2 , (15)
d@H2O# 51
det~M!@~Dma
l1!2~dh2 ge!2 1 ~Dmal2!2
3 ~ah2 gb!2 1 ~Dmal3!2~ae2 db!2#1y2 . (16)
1 January 1997 y Vol. 36, No. 1 y APPLIED OPTICS 15

Fig. 4. ~a! Absolute absorption coefficient ma versus source wavelength obtained for normal and malignant tissue on the human subject’sabdomen. The ma values were extracted from best fits of Eq. ~1! to the abdomen phase shift versus modulation frequency data ~shownin Fig. 3!. The source–detector separation was 1.7 cm. ~b! Reduced scattering coefficient m9s versus source wavelength obtained fornormal andmalignant tissue on the human subject’s abdomen. The m9s values were extracted from best fits of Eq. ~1! to the abdomen phaseshift versus modulation frequency data ~shown in Fig. 3!. The source–detector separation was 1.7 cm. ~c! Same as ~a!, except that thema values were obtained for normal and tumor tissue on the subject’s back. The source–detector separation was 2.2 cm for thesemeasurements. ~d! Same as ~b!, except that the m9s values were obtained for normal and tumor tissue on the subject’s back. Thesource–detector separation was 2.2 cm for these measurements.
4. Results and Discussion
Figure 3 compares the phase versus frequency re-sponse obtained on normal and malignant abdominaltissue. These phase-shift data were acquired at a1.7-cm source–detector separation for four differentwavelengths. Phase values have been corrected forFinstrument~v, l!, as described above, by the use of astandard reference material. The information pre-sented in Fig. 3 is therefore entirely a consequence ofthe tissue optical properties, the source modulationfrequency, and the 1.7-cm source–detector separa-tion on the tissue surface. Note that at all wave-lengths and modulation frequencies, the normalabdominal tissue phase lag is greater than that of thetumor. In addition, the normal tissue phase versusfrequency response displays greater curvature thanthe tumor phase versus frequency data. Figure 3~d!
16 APPLIED OPTICS y Vol. 36, No. 1 y 1 January 1997
data are relatively noisy because of the lower averageoptical power of the 956-nm diode laser ~only 1-mWaverage power!.Figure 4 shows plots of ma and m9s values extracted
from best fits of the abdomen phase shift versus mod-ulation frequency data ~shown in Fig. 3! and frombest fits of phase shift versus frequency data ~notshown! obtained from normal and malignant tissueon the human subject’s back. The fitting expressionis given by Eq. ~1!. The uncertainties shown for thema and m9s values were estimated for each fit from thex2 distribution by the use of a 0.67 confidence inter-val. Tables 1 and 2 show the optical parameters maand m9s extracted from the fits to all the phase-shiftdata acquired from the human subject’s abdomen andback ~both normal and malignant tissue! at allsource–detector separations ~i.e., 1.7, 2.2, and 2.7 cm!

Table 1. Summary of the Optical Parameters ma and m*s Extracted from the Best Fits to the Phase-Shift Data Acquired from the Human Subject’sNormal Abdomen and Tumor Abdomen
l ~nm! r ~cm!
Normal Abdomen Tumor Abdomen
ma ~cm21! m9s ~cm21! ma ~cm21! m9s ~cm21!
1 0.035 1 1.06674 1.7 0.0627 6 0.0046 9.23 6 0.26 0.184 7.66
2 0.025 2 0.75
1 0.020 1 0.58811 1.7 0.0755 6 0.0036 9.29 6 0.18 0.190 7.78
2 0.017 2 0.47
1 0.036 1 1.1849 1.7 0.0801 6 0.0030 9.07 6 0.14 0.294 10.5
2 0.029 2 0.8
1 0.024 1 0.72 1 0.100 12.2956 1.7 0.139 7.39 0.380 6.3
2 0.020 2 0.61 2 0.066 2 1.0
1 0.023 1 0.83674 2.2 0.0589 6 0.0036 8.94 6 0.19 0.169 8.48
2 0.018 2 0.63
1 0.016 1 0.53811 2.2 0.0645 1 0.0032 8.82 6 0.18 0.190 8.30
2 0.014 2 0.45
1 0.033 1 0.97849 2.2 0.0690 6 0.0025 8.77 6 0.14 0.276 9.93
2 0.026 2 0.77
1 0.016 1 0.70956 2.2 0.111 7.00 — —
2 0.013 2 0.55
1 0.0085 1 0.24 10.020 1 0.72674 2.7 0.0583 9.16 0.168 8.22
2 0.0055 2 0.35 2 0.016 2 0.56
1 0.019 1 0.65811 2.7 0.0626 6 0.0030 9.11 6 0.15 0.214 8.55
2 0.016 2 0.50
1 0.021 1 0.59849 2.7 0.0696 6 0.0030 9.03 6 0.15 0.227 8.14
2 0.018 2 0.51
1 0.70956 2.7 0.107 6 0.010 6.97 — —
2 0.50
r and at each wavelength l. These results confirmsignificant absorption differences between normaland tumor tissue at all wavelengths. Scatteringchanges are less significant, but exhibit consistentwavelength-dependent behavior. Lower tumor scat-tering parameters ~versus normal tissue! may be dueto a loss of cellularity and increased H2O content ofnecrotic zones. This could diminish both the density
and the efficiency of available scatterers. Conse-quently we expect that m9s measurements may bemore sensitive to early-stage highly cellular tumors.Figure 5 shows quantitative bar graphs of in vivo
physiological properties of the human subject’s nor-mal and malignant abdominal tissue calculated bythe use of combinations of ma values obtained at threedifferent wavelengths @see Eqs. ~11! and ~12!#. The
Table 2. Summary of the Optical Parameters ma and m*s Extracted from the Best Fits to the Phase-Shift Data Acquired from the Human Subject’sNormal Back and Tumor Backa
l~nm!
Normal Back Tumor Back
ma ~cm21! m9s ~cm21! ma ~cm21! m9s ~cm21!
1 0.0063 1 0.024 1 1.0674 0.0883 10.7 6 0.4 0.174 10.4
2 0.0058 2 0.019 2 0.8
1 0.014 1 0.53811 0.0892 6 0.0050 9.99 6 0.27 0.177 9.23
2 0.012 2 0.47
1 0.34849 0.0915 6 0.0030 9.65 6 0.15 0.190 6 0.010 9.20
2 0.32
1 0.035 1 1.1 1 0.233 1 4.0956 0.127 6.3 0.186 4.7
2 0.026 2 0.8 2 0.083 2 1.3
aFor all measurements in this table, r 5 2.2 cm.
1 January 1997 y Vol. 36, No. 1 y APPLIED OPTICS 17

Fig. 5. ~a! Hb concentrations ~deoxyhemoglobin, oxyhemoglobin, and total! for normal and tumor locations on a human abdomen that arecalculated from wavelength-dependent ma values @refer to matrix Eqs. ~11! and ~12! for calculation method#, ~b! H2O concentrations fornormal and tumor locations on human abdomen that are calculated from wavelength-dependent ma values @refer to matrix Eqs. ~11! and~12! for calculation method#.
ma values used to generate the numbers shown in Fig.5 were extracted from the best fits of our phase dataacquired at a 1.7-cm source–detector separation.The in vivo physiological parameters displayed inFigs. 5~a! and 5~b! are, respectively, deoxygenatedand oxygenated Hb concentrations ~i.e., @Hb# and@HbO2#, in units of millimolar concentration! andH2O concentration ~@H2O# in units of molar concen-tration!. The combinations of ma values used in ourcalculations of @Hb#, @HbO2#, and @H2O# were chosento minimize the uncertainty in these parameters thatwe calculated from Eqs. ~14!–~16!. For the reasonsalready given above in Subsection 3.C., we did notfind it useful to use the ma values acquired at 811 and849 nm together in the system of three equationsgiven by Eq. ~10!. We believe that the best way toreduce the uncertainty in the H2O concentration ex-tracted from our data will be to improve the precisionof the ma values acquired at 956 nm. Improvementin the signal-to-noise ratio of our measurements at956 nm by an increase in the optical power coupled tothe tissue should be useful in improving the precisionwith which we may determine ma and hence absoluteH2O concentration in future in vivo measurements.The average power of the 956-nm light coupled to thetissue in the measurements presented here can be
increased from 1 to approximately 30 mW. Figure5~a! shows that both @Hb# and @HbO2# ~and hencetotal Hb concentration! in the abdominal tumor tis-sue were approximately double that of the normalabdominal tissue. Figure 5~b! shows the abdominaltumor tissue to have a higher H2O concentrationthan the normal abdominal tissue, although it mustbe noted that the error on the abdominal tumor tissueH2O concentration is large because of the large un-certainty in ma
956 used in the calculation of this quan-tity @see Fig. 4~a! and the columns under TumorAbdomen in Table 1. Although the relative values of@H2O# are probably correct, it is important to pointout that the accuracy of the absolute @H2O# quantityis not easy to estimate. This is because we deter-mined @H2O# from e@H2
lO# values measured in pure
systems.17 Although these are probably the mostaccurate H2O extinction coefficients available, theymay not be exact for biological systems in which H2Ois found in a variety of states ~e.g., protein bound,free! that can have an impact on e@H2O#
l .Table 3 shows the results of the calculation of @Hb#,
@HbO2#, and @H2O# by the use of ma values measuredat given source–detector separations r on the abdo-men and the back ~both normal and malignant tis-sue!. In cases in which the phase-shift data
Table 3. Summary of Physiological Parameters for Normal and Tumor Locations on a Human Abdomen and Back Calculated fromWavelength-Dependent Optical Absorption Coefficients given in Tables 1 and 2a
Location r ~cm! @Hb# ~mM! @HbO2# ~mM! @H2O# ~M! @Hbtotal# ~mM! % Oxygenation
Normal abdomen 1.7 6.25 6 0.82 28.6 6 2.2 5.87 6 1.31 34.8 6 2.3 82.2 6 8.32.2 6.22 6 0.64 23.9 6 1.9 4.00 6 2.23 30.1 6 2.0 79.4 6 8.22.7 6.23 6 1.19 23.0 6 2.1 3.95 6 1.94 29.2 6 2.4 78.8 6 9.7
Tumor abdomen 1.7 20.2 6 5.2 67 6 12 20.1 6 10.8 87 6 13 77 6 182.2 17.4 6 3.6 73.4 6 8.3 NyA 90.8 6 9.0 81 6 122.7 15.9 6 3.2 86.0 6 9.6 NyA 102 6 10 84 6 13
Normal back 2.2 9.68 6 1.04 33.2 6 2.7 NyA 42.9 6 2.9 77.4 6 8.2Tumor back 2.2 19.1 6 3.7 66.0 6 7.4 NyA 85.1 6 8.2 78 6 12
aRefer to matrix Eqs. ~11! and ~12! for calculation method.
18 APPLIED OPTICS y Vol. 36, No. 1 y 1 January 1997

acquired at 956 nm was too poor to determine ma956
precisely, we were unable to calculate tissue H2Oconcentration. Under these conditions, measure-ments of ma at two wavelengths, e.g., ma
674 and ma811 or
ma674 and ma
849, were used to calculate the @Hb# and@HbO2#.The BVF range in the subject’s normal abdominal
tissue is derived from the @Hbtotal# values given inTable 3 and hemotologic values obtained when bloodwas drawn from the subject on the day of the opticalFDPM measurements. The subject’s hemotologicvalues obtained from his drawn blood were 318 gHbtotaly~L of erythrocytes! and a hematocrit ~redblood cell volumeyblood volume! of 33.6%. Giventhat Hbtotal molecular weight is 64.5 3 103 gymole,19the concentration of Hb in the subject’s whole bloodwas approximately ~318 gyL! 3 0.336y~64.5 3 103
gymole! 5 1.66 3 103 mM Hbtotal on the day of theFDPM measurements. Because @Hbtotal# valuesmeasured by FDPM in the subject’s normal abdomi-nal tissue ranged from 29.2 to 34.8 mM, we obtain atissue BVF of ~29.2 to 34.8 mM!y~1.66 3 103 mM! 3100 5 1.8%–2.1% in the subject’s normal abdominaltissue. Given that the @Hbtotal# values we measuredby FDPM in the subject’s abdominal tumor tissuerange from 87 to 102 mM, we obtain a ~87 to 102mM!y~1.66 3 103 mM! 5 5.2%–6.1% BVF range in thesubject’s abdominal tumor tissue. This is a factor of;3 greater than measured normal abdominal tissueBVF.The H2O volume fraction in the subject’s normal
abdominal tissue is derived from the @H2O# valuesgiven in Table 3. Given that the molecular weight ofwater is 18 gymole and the density of water is 1000gyL, the concentration of water is approximately~1000 gyL!y~18 gymole! 5 55.6 M. The @H2O# valueswe measured by FDPM in the subject’s normal ab-dominal tissue range from 3.95 to 5.87 M; hence weobtain a H2O volume fraction range of ~3.95 to 5.87mM!y~55.6 M! 3 100 5 7.1%–10.6% in the subject’snormal abdominal tissue. This is comparable withthe lower end of the 11.4%–30.5% range given in theliterature for H2O percentage in human fatty adiposetissue.20 Abdominal tumor tissue H2O percentageranged from 16% to 56%, or roughly twofold–fivefoldhigher than that of normal abdominal tissue.These values neglect the possibility that fat absorp-
tion contributes to ma956. In practical terms, fat ab-
sorption is difficult to quantify and is, at thewavelengths used in this study, less significant thanother tissue components. Nevertheless, H2O con-centration measurements of normal, adipose-dominated abdominal and back tissues may beartificially elevated because of an underestimation onour part of fat absorption to our measured values ofma956. Of course, if this were the case, it would pro-
vide even further evidence of contrast between nor-mal and malignant tissues. In any event, H2Ocontrast is likely to be primarily a reflection of differ-ences in tumor versus normal tissue vascularity ~i.e.,BVF! rather than intrinsic variations in tissue H2Ocontent. Other possible sources of H2O concentra-
tion variations include increased fluid retention asindicated by elevated tumor interstitial fluid pres-sure levels.21
5. Conclusion
Overall, optical property data from normal and ma-lignant sites are remarkably consistent. FDPMmeasurements sample a combination of necrotic coreand high blood volume cortex tumor regions. Re-gardless of the precise locations probed, we have ob-served that total Hb ~which is proportional to bloodvolume! and H2O content are of the order of twofold–fivefold higher in tumor versus normal tissue. Scat-tering spectra suggest smaller, but detectable,differences in wavelength-dependent behavior be-tween tissue types. Although these preliminarydata were not recorded from breast tissues, we be-lieve that these definitive results obtained from ade-nocarcinoma lesions growing in host adipose tissue~i.e., comparable with breast disease! suggest thatFDPM will have utility in breast cancer diagnostics.
We are grateful to Harold Fry for his generouscontribution to these studies. This work was madepossible, in part, through access to the Laser Mi-crobeam and Medical Program and the Clinical Can-cer Center Optical Biology Shared Resource at theUniversity of California at Irvine. These facilitiesare supported by the U.S. National Institutes ofHealth under grants RR-01192 and CA-62203, re-spectively. Beckman Laser Institute programmaticsupport was provided by the U.S. Department of En-ergy ~DOE DE-FG03-91ER61227! and the U.S. Officeof Naval Research ~ONR N00014-91-C-0134!. O.Coquoz acknowledges the Swiss National ScienceFoundation and the Cancer Research Switzerland~BIL KFS 205-9-1995!. B. J. Tromberg acknowl-edges the U.S. National Institutes of Health~GM50958!, the Whitaker Foundation ~WF16493!,and Beckman Instruments, Inc.
References1. W. F. Cheong, S. A. Prahl, and A. J. Welch, “A review of the
optical properties of biological tissues,” IEEE J. QuantumElec-tron. 26, 2166–2185 ~1990!.
2. V. G. Peters, D. R. Wyman, M. S. Patterson, and G. L. Frank,“Optical properties of normal and diseased human breast tis-sues in the visible and near infrared,” Phys. Med. Biol. 335,1317–1334 ~1990!.
3. T. L. Troy, D. L. Page, and E. M. Sevick-Muraca “Opticalproperties of normal and diseased breast tissue,” in OSATrends in Optics and Photonics, Vol. 3, Biomedical OpticalSpectroscopy and Diagnostics, E. Sevick-Muraca and D. Ben-aron, eds. ~Optical Society of America, Washington, D.C.,1996!, pp. 59–61.
4. B. J. Tromberg, R. C. Haskell, S. J. Madsen, and L. O.Svaasand, “Characterization of tissue optical properties usingphoton density waves,” Comments Mol. Cell. Biophys. 8, 359–386 ~1996!.
5. S. J. Madsen, E. R. Anderson, R. C. Haskell, and B. J. Trom-berg, “Portable high-bandwidth frequency-domain photon mi-gration instrument for tissue spectroscopy,” Opt. Lett. 19,1934–1936 ~1994!.
6. J. B. Fishkin and E. Gratton, “Propagation of photon density
1 January 1997 y Vol. 36, No. 1 y APPLIED OPTICS 19

waves in strongly scattering media containing an absorbingsemi-infinite plane bounded by a straight edge,” J. Opt. Soc.Am. A 10, 127–140 ~1993!.
7. M. A. O’Leary, D. A. Boas, B. Chance, and A. G. Yodh, “Re-fraction of diffuse photon density waves,” Phys. Rev. Lett. 69,2658–2661 ~1992!.
8. D. A. Boas, M. A. O’Leary, B. Chance, and A. G. Yodh, “Scat-tering and wavelength transduction of diffuse photon densitywaves,” Phys. Rev. E 47, R2999–R3002 ~1993!.
9. B. J. Tromberg, L. O. Svaasand, T. Tsay, and R. C. Haskell,“Properties of photon density waves in multiple-scattering me-dia,” Appl. Opt. 32, 607–616 ~1993!.
10. J. B. Fishkin, P. T. C. So, A. E. Cerussi, S. Fantini, M. A.Franceschini, and E. Gratton, “Frequency-domain method formeasuring spectral properties in multiple-scattering media:methemoglobin absorption spectrum in a tissuelike phantom,”Appl. Optics 34, 1143–1155 ~1995!.
11. S. Fantini, M. A. Franceschini, J. B. Fishkin, B. Barbieri, andE. Gratton, “Quantitative determination of the absorptionspectra of chromophores in strongly scattering media: alight-emitting-diode-based technique,” Appl. Opt. 33, 5204–5213 ~1994!.
12. M. S. Patterson, J. D.Moulton, B. C.Wilson, K.W. Berndt, andJ. R. Lakowicz, “Frequency-domain reflectance for the deter-mination of the scattering and absorption properties of tissue,”Appl. Opt. 30, 4474–4476 ~1991!.
13. J. B. Fishkin, S. Fantini, M. J. vandeVen, and E. Gratton,“Gigahertz photon density waves in a turbid medium: theoryand experiments,” Phys. Rev. E 53, 2307–2319 ~1996!.
20 APPLIED OPTICS y Vol. 36, No. 1 y 1 January 1997
14. R. C. Haskell, L. O. Svaasand, T.-T. Tsay, T.-C. Feng, M. S.McAdams, and B. J. Tromberg, “Boundary conditions for thediffusion equation in radiative transfer,” J. Opt. Soc. Am. A 11,2727–2741 ~1994!.
15. F. P. Bolin, L. E. Preuss, R. C. Taylor, and R. J. Ference,“Refractive index of some mammalian tissues using a fiberoptic cladding method,” Appl. Opt. 28, 2297–2303 ~1989!.
16. E. M. Sevick, B. Chance, J. Leigh, S. Nioka, and M. Maris,“Quantitation of time- and frequency-resolved optical spectrafor the determination of tissue oxygenation,” Anal. Biochem.195, 330–351 ~1991!.
17. G. M. Hale and M. R. Querry, “Optical constants of water inthe 200 nm to 200 m wavelength region,” Appl. Opt. 12, 555–563 ~1973!.
18. M. Cope, “The development of a near infrared spectroscopysystem and its application for non invasive monitoring of ce-rebral blood and tissue oxygenation in the newborn infant,”Ph.D. dissertation ~Department of Medical Physics and Bio-engineering, University of London, University College London,UK, 1991!.
19. A. C. Guyton, Textbook of Medical Physiology ~Saunders, Phil-adelphia, Pa., 1991!, p. 360.
20. F. A. Duck, Physical Properties of Tissue ~Academic, London,1990!, p. 320.
21. R. A. Zlotecki, L. T. Baxter, Y. Boucher, and R. K. Jain, “Phar-macologic modification of tumor blood flow and interstitialfluid pressure in a human tumor xenograft: network analysisand mechanistic interpretation,” Microvasc. Res. 50, 429–443~1995!.

![Case Report Malignant triton tumor of the prostate: a case …glandular epithelium, adipose tissue, or even squamous cells [1]. Tumors with rhabdomyo-blastic differentiation and malignant](https://img.pdfslide.net/doc/110x75/60f7b7a2384f7b44a45f45b5/case-report-malignant-triton-tumor-of-the-prostate-a-case-glandular-epithelium.jpg)