Embed Size (px)
Citation preview

Frequency Reuse, Cell Separation, and Capacity Analysis of VHF Digital Link Mode 3 TDMA
Mohammed A. S h a m ' , Thanh C. Nguyenl, and Rafael D. Apaza2 Analex Corporatiod'FAA Aviation Research Office
NASA Glenn Research Center 21000 Brookpark Road Cleveland, Ohio 44135
1
Abstract:
The most recent studies by the Federal Aviation Administration (FAA) and the aviation industry have indicated that it has become increasingly difficult to make new VHF frequency or channel assignments to meet the aviation needs for air-ground communications. FAA has planned for several aggressive improvement measures to the existing systems, but these measures would not meet the projected voice communications needs beyond 2009. FAA found that since 1974 there has been, on the average, a 4 percent annual increase in the number of channel assignments needed to satisfy the air-ground communication traffic (approximately 300 new channel assignments per year). With the planned improvement measures, the channel assignments are expected to reach a maximum number of 16615 channels by about 2010. Hence, the FAA proposed the use of VDL Mode 3 as a new integrated digital voice and data communications systems to meet the future air traffic demand.
This paper presents analytical results of frequency reuse; cell separation and capacity estimation of VDL Mode 3 TDMA systems that FAA has planned to implement the future VHF air-ground communications system by the year 2010. For TDMA, it is well understood that the frequency reuse factor is a crucial parameter for capacity estimation. Formulation of this frequency reuse factor is shown, taking into account the limitation imposed by the requirement to
have a sufficient Signal to Co-Channel Interference Ratio. Several different values for the Signal to Co-Channel Interference Ratio were utilized corresponding to the current analog VHF DSB-AM systems, and the future digital VDL Mode 3. The required separation of Co-Channel cells is computed for most of the Frequency Protected Service Volumes (FPSV's) currently in use by the FAA. Additionally, the ideal cell capacity for each FPSV is presented. Also, using actual traffic for the Detroit air space, a FPSV traffic distribution model is used to generate a typical cell for channel capacity prediction. Such prediction is useful for evaluating the improvement of future VDL Mode 3 deployment and capacity planning.
Introduction:
The aeronautical frequency spectrum assignment in the CS is operating at near capacity and expecting to reach its limitations by the year 2009. The growth rate of 4 percent annually in spectrum utilization, which corresponds to 300 new channel assignments yearly, suggests a new approach to information transmission and frequency management is needed [l], [2]. The use of VDL-3 in the NEXCOM transceiver replacement program is designed to provide the needed channel capacity and to meet aviation growing demands for the near future. Very High Frequency Digital Link (VDL) Mode 3 provides both Aeronautical Telecommunication Network (ATN) data and digital voice services. It was proposed to the International Civil
This is a preprint or reprint of a paper intended for presentation at a conference. Because changes may be made before formal publication, this is made available with the understanding that it will not be cited or reproduced without the permission of the author.
Aviation Organization (ICAO) in 1994 by the United States Federal Aviation Administration (FAA) as an alternative to using 8.33 KHz channel spacing to relieve VHF congestion. VDL Mode 3 works by providing four logical independent channels in a 25 kHz frequency assignment. Each channel can be used for voice or data transfer. The appealing capability of VDL Mode 3 is that it uses a frequency channel that can carry one analog voice transmission and turns it into three or four simultaneous transmissions using Time Division Multiple Access (TDMA). There are seven configurations defined for VDL Mode 3 in the ICAO VDL Mode 3 Standards and Recommended Practices (SAFWs) . VDL Mode 3 uses the same modulation scheme as VDL Mode 2, which is Differential 8 Phase Shift Keying (DSPSK) at a data rate of 3 1.5 kbps [3].
Considering the existing system will reach its limitations by year 2009, this paper presents an analysis of frequency reuse, cell separation, and capacity using VDL Mode 3 TDMA. The analysis was performed utilizing existing FAA Air Traffic Control airspace sector boundaries and VHF frequency allocation [4]. The service volume included En-route such as Super high (SE) altitude, High altitude (HE), Intermediate altitude (E) and Low altitude En-route (LE). In addition, terminal service volumes such as Approach control, Departure control, and Local control among others were utilized. The frequency allocations were obtained via two methods; one utilized frequency allocations specified by FAA [4] to obtain maximum ideal limits on frequency reuse, cell separation and capacity for each of the service volumes using the 524 Air Traffic Control (ATC) channels presently available. The second method attempted to get a more realistic distribution of the frequency allocations per service volume based on actual air traffic data. The air traffic data used was obtained for the terminal area over the Detroit Airspace and en-route data for sectors serving the southeast part of Michigan.
The next few sections cover, formulation of the cell capacity, frequency reuse, and cell separation showing the mathematical equations utilized in the following section on Results for different FF'SV using FAA and actual air traffic data. The last section is the Conclusion.
Formulation of Cell Capacity, Frequency Reuse and Cell Separation:
We start by following a mathematical formulation based on work by [5-71 for the capacity of a single cell of a TDMA system:
With the following parameters
to the total available bandwidth in the VHF band, the number of time slots of the TDMA channel, the bandwidth of each VHF channel, and the Frequency Reuse factor. The frequency reuse factor is defined as the number of times the total bandwidth has to be divided to use in each cell. Note that other definitions of frequency factor correspond to the inverse of that defined here, meaning the number of times a frequency can be reused in a network of cells.
B W r o t o l ? Nslors 7 B W c h n n e l , f,, ConesPonding
Here we rely mainly on [4], [5-71 for the derivation of the frequency factor to be used in the capacity formulas. The derivation is summarized for convenience. In Figure 1, the distance from the undesired user to the desired user is shown by the parameter D, while the distance from the center of the cell to the desired user is approximated by the radius of that cell Rd. On the other end, the radius of the cell serving the undesired user is assumed to have a radius R,. The intent is to allocate frequencies to cells in a most efficient manner. That in turn implies having the maximum possible reuse of frequencies with minimum possible distance such that there would not be an unacceptable

performance level at the desired user. Two factors come into play, one is the radio line of sight between the two users (desired and undesired), and the second is the given requirements on signal to interference ratios (for co-channel interference only for this
interference ratio is specified in order to
provide a given level of performance with respect to Bit Error Rates Bit Error Rate (BER) for the digital VDL-3 link, assuming all measures that can tolerate better levels are taken into account such as the Forward Error Correction (FER) and the modulation
study). The signal to co-channel tY Pe.
Undesired Distance D,,
Service Volume A
Service Volume B
t hd
Hexag approximation of a circle
I - Reuse Distance D,, c c
Figure 1 Illustration of two co-channel cells (hexagon approximated), service volume height and desired and undesired users.
Frequency Reuse based on Line of Sight:
In this case the radio line of sight RLOS is defined as the distance from the radio transceiver to the horizon point, of “effective radio horizon” (see Figure 2). For large bodies such as the earth, the radio signals tend to bend toward the body causing a large decrease in the power levels that is assumed significant enough to eliminate the signal strength. This assumes no anomalous propagation conditions along the signal path and a spherical earth. The formula for the RLOS of a single transceiver
(assume it is for the desired user) is given by:
RLOS, (nmi) = 1 .23Jh, (2)
Now looking at the RLOS for the second transceiver (assume it is for the undesired user):
(3) RLOS, (nrni) = 1.23Jhy
We want to make the distance between the desired and undesired user sufficiently enough such that their radio signal do not

overlap. That means that distance has to be the two cells servicing the desired and the sum of the two RLOSs shown above or: undesired users would have to be then
sufficiently large such that the radius of the two cells are taken into account or: D, 2 1.23(.& + Jh,) (4)
Using the above formulation, we also note D o c = 1.23 * (&+ &) + R, + Ru that the distance between the two centers of
I 4 D d c u c * I
Figure 2 Radio Line of Sight Distance
Next a formulation for the theoretical distance of the centers of the two cells using the same frequencies where our desired and undesired users are located is given. This assumes an inscribed hexagon type cells with all of them having the same radius R and a frequency reuse factor f,, [ 5 ] , [7 ] :
Finally assuming the same heights for now on the desired and undesired users, we get that the distance Ddu based on (4) should be greater than two RLOS.
D, 2 2 * 1.23(&) = 2 * RLOS (7)
Again with the radius of the desired and undesired cells assumed equal (R) for the moment, and using same heights for desired and undesired users, the RLOS of the two users will then be the same. Also assume desired and undesired users are R distance from their respective centers at the closest two points possible (see Figure 1).
Positioning the desired and undesired users at the edge of their corresponding cells for a worst-case interference scenarios, is equivalent to subtracting 2R from formula (6). Substituting the result into (7) produces the formula for the frequency reuse factor [5] in terms of the RLOS (or height h) and the cell radius R. That need to be satisfied so that the center of the desired and undesired cells are sufficiently separated to not allow any two aircrafts (one in each cell) to see each other in terms of radio signals or RLOS:
(8) 4((1.23&/ R ) + 1)2
3 f r u 2
Note that although the actual formulation for the sufficient distances should be based on (7), the assumptions and formulation done to obtain (8) in [ 5 ] is to produce a formula for the frequency re-use factor, and specifically to be able to use the formula (6) for the center distances for a generic hexagon cell arrangement.
Frequency Reuse based on Signal to total co-channel interference:
Next we formulate the frequency reuse factor with the limitation imposed by the requirement to have a sufficient Signal to Co-channel Interference Ratio. What this basically gives us is the possibility of having closer distances of the centers of the desired and undesired cells than that given by (6) or (7). In other words it allows the two aircrafts to be within line of sight of each other (or 2.RLOS) as long as the signal level of the undesired signal I,, is 1olog(sd/Iu) dbs lower than the desired one s d , since the effects on the performance (i.e. BER) will be within specification.
Using Figures 1 and 2, define the distances to the desired aircraft from the center of its own cell by Dd, which will be approximated by the desired cell radius Rd. Also define the distance of the undesired user to its own cell by D, with again approximating it with its cell radius R,. Then again define the distance between the desired user and undesired user as before by Ddu, except this time that distance is limited by the sd/I,, and do not have to satisfy (7). Hence assuming a distance square approximation for the free path loss, we have that the signal received at the desired user from its own cell tower given by:
Similarly looking at the power received due to an interfering user, or from the interfering tower, we have:
Where P, ,Gtu is the power transmitted from undisired user in the undesired cell, the gain of the antenna of the undesired user. The distance in the above formula is from desired user to undesired user, the gain of the desired aircraft antenna, and the wavelength of the frequency of the channel respectively. Note the wavelength is same as clf where c is speed of light and f is the frequency of the channel.
Assuming similar power setting for user and tower Effective Radiated Power above an Isotropic Antenna (EIRP) (a reasonable assumption given the tower power and VHF aircraft transmit powers are currently 10 W, with some aircraft transmitter being as large as 20 W for high altitude certification as shown in Table 1 in next section). Also assume setting for both user and undesired user (i.e. antenna gains the aircrafts involved), we get:
2
S d I I u =[%I 3
(9) 2
Where p, ,G**<,G~ ,A is the power transmitted from the desired cell tower, the gain of the desired cell antenna tower, the gain of the desired aircraft antenna, and the wavelength of the frequency of the channel respectively. Note the wavelength is same as clf where c is speed of light and f is the frequency of the channel.
Finally, in [ 5 ] a more accurate assessment of the interference source is discussed. There the assumption is made that we can have up to 6 interfering users from cells in the first tier in a hexagon type setting, and possibly more in a non-uniform type of setting. Hence keeping that in mind the formulation for the signal to interference of co-channels should account for six such sources at least assuming all aircrafts are transmitting at the same time, which is a worst case. With that we would then have:

2
'd "total -int erf = Sd 161, =. [&- s
Frequency Reuse Factor VHF band for Aeronautical use
The above formula we feel is more appropriate given that the specification for signal to interference ratios do not specify that it is from a single user. In [8] Lab testing was done to show that a 20-db signal to total co-channel interference ratio satisfied the specification of BER for VDL Mode 3.. Hence if the interference assumed there is from all total sources, it would then have to be distributed over all the interfering users which justifies the favorable worst case formula rather than that used in FAA manual [4]. We will use both of those for the tables to be shown in the next section.
fRU
BWtotal
Finally again we utilize the formulations in [5] to relate the frequency reuse with the signal to interference ratio so that we can relate to earlier formulation of frequency reuse factor with respect to RLOS and R.
Number of VDL-3 TDMA slots
Using (7),(8),( 1 I),( 12), and assuming for this case only that the radius of the undesired user and the desired users are the same (R), we have:
Nslots
[for total interference from 6 sources:
Results for different Frequency Protected Service Volume (FPSV)
Results using FAA channel allocations
Using the equations shown in the previous section, along with the parameters for the VLD-3 system shown in Table 1 below, we can tabulate some of the results desired. We compare with some of the results in [4] for a more realistic approach to the problem.
I
Each VHF channel bandwidth 1 BW.-h,.n,l Channel Data Rate
Tower Transmitter power
Airplane Transmitter power Required Signal to Co-channel lo!dsd ztoral - mt erf ) required I interference ratio I= lo requiied
From previous section 760*25 M z total 524*25 khz ATC only 3 max data channels 4 max voice 2 v,2 data 25 lcHz
Table 1: VDL 3 System parameters
A generic plot of the frequency reuse factor vs. the RLOSR as in [5] is shown using the formula (8) for the linear part. For the minimum required levels based on signal to
Co-Channel Interference requirements, we used a 20 db requirement [8] for the Signal to Co-channel Interference ratio (total or single), or:

number was chosen. Also in [4] a 14 db is specified for VHF analog, hence it is felt 'OlOg('d 'total -int e$ )required =
Required Signal to co channel Interference Ratio (total or single)
(14) that the 20 db number ismore appropriate due to testing done in [8] for VDL-3. Table 'OlOg(Sd '1, )required = 20"
Minimum frequency reuse factor required based on equation (13) first part for Total Interference
Note a maximum of 26 db is actually 2 below shows the required minimum specified and is also found in [8] although frequency reuse factors for those three testing was done for 20 db hence why that levels:
14 db min (analog system [4]) 20 db FAA tested VDL3 181
assumption 67.9 (plotted in Figure 3) 234
. A
26 db a maximum specified [ 81 I 862.7
Minimum frequency reuse factor required based on equation (13) second part for Single Interferer assumption 16.4 9 (plotted in Figure 3) 48.9 (plotted in Figure 3) 160.6
Table 2: Minimum Frequency Reuse Factor based on Signal to Interference Ratio
Minimum Frequency Reuse factor vs. RLOS/R
.......... . ................
RLOS/R=1.23*sqrt(h)/R
Figure 3: Minimum Frequency Reuse factor based on RLOS/R and S/I (Equations 8 and 13)
Given the values shown in the Table 3, and at the same time comparing to plot of Figure 3 for minimum required frequency reuse factor for a 2RLOS distance between user and interferer, it is evident that the numbers in the plot are less than the limits shown for
the interference limited case for at least up to RLOS=4 with the exception of the 16.4 single user case with 14 db which would be reached at approximately an RLOSR or 2.5. Since the more appropriate case of 20 db is
recommended, that limit is not within the plots range shown.
(nmi) 150
To effectively control the large volume of air traffic in the US and meet the growing demands aviation places on the system, the National Airspace has been sectioned into smaller more manageable areas. The Air Route Traffic Control Center (ARTCC) is responsible for controlling aircraft that are in the en-route stage of flight; there are 21 ARTCC’s in the United States. Terminal Radar Approach Control (TRACON) has been developed to handle aircraft in the approacWdeparture stage of flight and other type of flight procedures that are not in the en-route domain. Airspace controlled by both the ARTCC and TRACON is further
formula (2) ~260.9 ~ 1 . 7 4
Service Type .
Super High Altitude En Route (SE) High Altitude En Route Intermediate Altitude En Route (E) Low Altitude En Route (LE) Approach Control (AC), Departure Control (DC), Arrival Automated Terminal Information Service (ATIS) Local Control (LC) Weather (AWOS/ASOS) Ground Control (GC) , Clearance Delivery (CD), Departure ATIS
60 165
Altitudes h (ft)
~45000
2.75
45000
30
25
2-5
25000
194.48 6.5
123 4.92
12.3 6.15-2.46
18000
25000
25000
10000
100
divided into sectors. Sectors have been designed to increase efficiency, safety, and to make the air space more manageable; sectors vary in the airspace size they cover. Furthermore, ARTCC’s divide their airspace by altitude to maximize air traffic system efficiency creating different types of FPSVs. To meet the communication requirements of the existing system, careful reuse of existing frequencies by spectrum engineering has produced a system that uses almost all channel allocations available to Air Traffic Control.
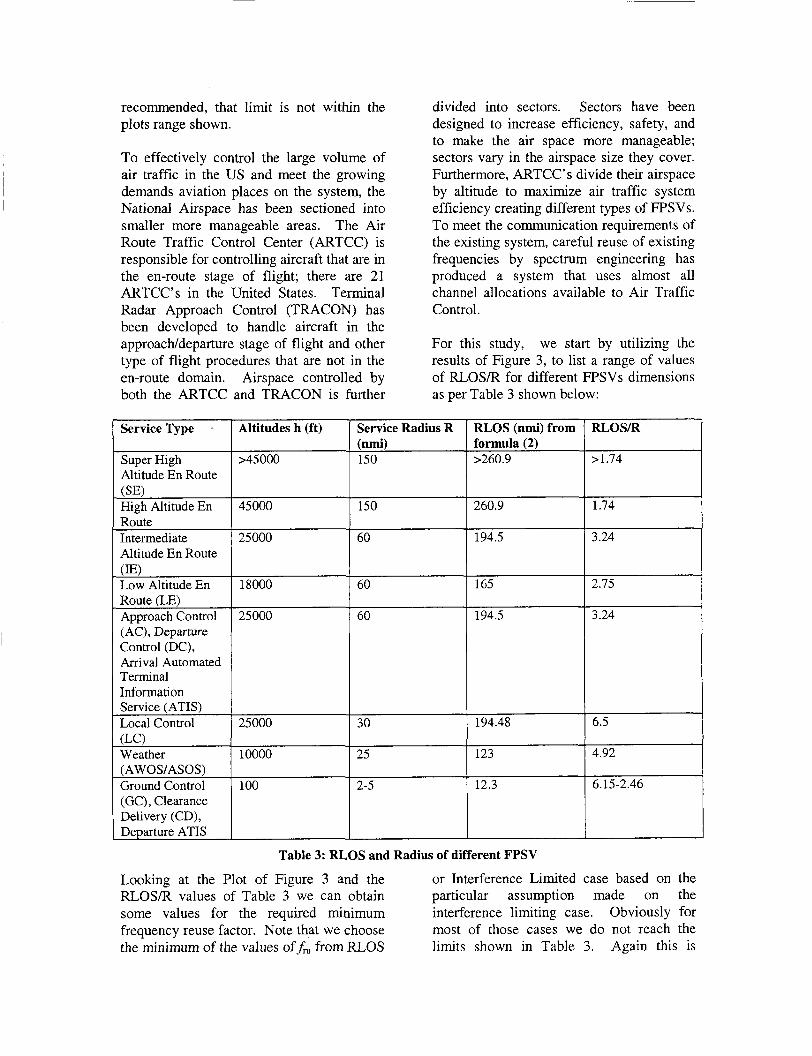
For this study, we start by utilizing the results of Figure 3, to list a range of values of RLOS/R for different FPSVs dimensions as per Table 3 shown below:
Service Radius R 1 RLOS (nmi) from 1 RLOS/R
260.9
194.5
Table 3: RLOS and Radius of different FPSV
Looking at the Plot of Figure 3 and the or Interference Limited case based on the RLOSR values of Table 3 we can obtain particular assumption made on the some values for the required minimum interference limiting case. Obviously for frequency reuse factor. Note that we choose most of those cases we do not reach the the minimum of the values of fm from RLOS limits shown in Table 3. Again this is

mainly due to the more stringent ratios involved. Table 3 below shows some requirements on the signal to interference of those results:
fru from minimum value shown on Plot in Figure 3 with 14 db signal to Interference ratio (single Interferer) >10
Service Type 5" from minimum value shown on Plot in Figure 3 with 14 db signal to Interference ratio total Interferers)
>10 Super High Altitude En Route (SEI High Altitude En Route Intermediate Altitude En Route (E) Low Altitude En Route (LE)
Approach Control (AC), Departure Control (DC), Arrival Automated Terminal Information Service (ATIS)
fru from minimum value shown on Plot in Figure 3 with 20 db signal to Interference ratio (single Interferer) >10
Local Control (LC)
fru from minimum value shown on Plot in Figure 3 with 20 db signal to Interference ratio (total Interferers)
>10
Weather (AWOS/ASOS)
10
Ground Control (GC), Clearance Delivery (CD), Departure ATIS
10
RLOS/ R
23.98
18.76
23.98
48.9 (interference limited) 46.74
48.9 (interference limited)- 15.97
>1.74
1.74
3.24
2.75
3.24
23.98
18.76
23.98
75
46.74
68.18-15.97
6.5
4.92
6.15- 2.46
(interference
(interference limited)
(interference I limited)
(interference limited 16.49 I 67.9
limited) - limited) -
Table 4: Frequency Reuse Factors based on Figure 3
Having the information in Table 4 on the frequency reuse factors enable us to compute capacity per cell (or total for any geographic area) using the formula (1) initially shown. In addition to that we list the corresponding distances that would be required between center of desired cell to the center or a co- channel cell. All of the numbers are show for the least stringent case based on a 14 db signal to interference ratio with a single
user, and the recommended case of 20 db with total users (or 6 in our case). The results are shown next in Table 5 for a total number of 524 channel (out of the grand total of 760), which is documented in [4] as the allocated channels for Air Traffic Control. Note, the remaining frequencies are used for other services such as emergency crews, flight training, guard bands, and more [4]. Furthermore, in Table 5 below, notice that giving all 524 ATC

channels for each FPSV is unrealistic, but is in the next example. Nonetheless those very useful in determining maximum maximum values shown in Table 5 serve as possible values on cell capacities. In reality a guideline for initial planning and for each all FPSV types will share the 524 channels type FPSV evaluation. Cell Separation is not (as oppose to 100% to each), hence the dependent on the number of ATC channel capacity values will be much lower as seen and its allocation.
Service Type
Super High Altitude En Route (SE) High Altitude En Route Intermediate Altitude En Route
Low Altitude En Route (LE) Approach Control (AC), Departure Control (DC), Arrival Automated Terminal Information Service (ATIS) Local Control (LC) Weather (AWOS/ASOS) Ground Control (GC), Clearance Delivery (CD), Departure ATIS
(E)
Required Separation (nmi) to a similar cell, using frequency reuse factors of 14 db single interferer (Table 4) and formula (6) ' d o u c = Ra
S21.58
821.58
422.01
422.01
422.01
211.00
175.84
14.07- 34.61
Single Cell Capacity using frequency reuse factors of 14 db single interferer (Table 4) and formula (1)
with Nslots=3 and
524 with all 100 % distribution to each Fpsv
BWtoollmWchannel=
4 5 7
157
95
95
95
95
95
95- 98
Required Separation (nmi) to a similar cell, using frequency reuse factors of 20 db total interferers (Table 4) and formula (6) ' d p C = Rz
S21.58
821.58
508.90
450
508.90
450
296.04
28.60- 34.61
Single Cell Capacity using frequency reuse factors of 20 db total interferers (Table 4) and formula (1) Cell - Copuciry = BW,,,N,,,
B W,,.,,fau
with Nslots=3 and
524 with all 100 % distribution to each Fpsv
BWtotalmWchannel=
4 5 7
157
65
83
65
20
33
23- 98
Table 5: Cell Separation and Capacity for two S/I levels and all FPSVs with all 524 ATC per FPSV

Results using radar track data collection over the Detroit Air Space
Heights Range (ft) > 35000 24000-35000 10000-24000 640 - 10000 Approach Control Local Control
A tool that collected aircraft position information data over the Detroit airspace for 24-hours was used to make very crude estimate on a reasonable ATC channel distribution. Note that a 100% allocation of all the channels to a single altitude sector across the continental United States is not realistic since this approach leaves no frequencies for allocation to other altitudes and services as mentioned earlier. Obviously those numbers are very large for low altitudes FSVS due to the ability of reusing the frequencies many times in dose proximity.
Number of aircraft 4 3.96 Yo 17 16.83 %
10 9.90 % 47 46.53 %
16 15.84 %
7 6.93 %
Percentage from total
Table 6 shows traffic volume captured using the Detroit Metropolitan Airport (DTW) ASR-9 Radar system and the Enhanced Traffic Management System (ETMS). The DTW ASR-9 Radar system has a coverage radius of 60 nmi. ETMS uses radar target information obtained from Long Range Radar Systems. Radar target infomation is forwarded to the ARTCC for processing and then is sent forward for processing and formatting into ETMS format. Traffic information for evaluation was collected
from both ETMS and ASR systems on January 22, 2003. The time selected for evaluation was 22:45 GMT, at this time the sectors of interest had the most air traffic volume. Table 6 shows that out of a total of 101 aircraft, 46.53 percent of them can be found at altitudes between 640 and 10000 feet. Air traffic at this altitude is under the control of Cleveland Air Route Traffic Control Center (ZOB ARTCC) low altitude en-route. At altitudes between 10000 and 24000 feet only 10 of 101 aircraft are being controlled by ZOB low altitude control sector. ZOB en-route at altitudes between 24000 and 35000 is controlling 17 aircraft or 16.83 percent of total for the area under consideration. The remaining 3.96% traffic consists of en-route aircraft above 35000 feet; this traffic is under the control of ZOB ARTCC. TRACON approach control is handling 16 aircraft or about 16 percent of total of 101 aircraft and Local Control is working 7 aircraft. Note that the height ranges in Table 6 differ from those used in previous tables (obtained from [4]). Nonetheless, these heights will vary from one ARTCC to another. Only the Low altitude range resided outside the FAA [4] limits and hence results there may be slightly different but is still a good approximation.
Table 6: Detroit and ZOB ARTCC actual flight distribution at 22:45 GMT on January, 22,2003.
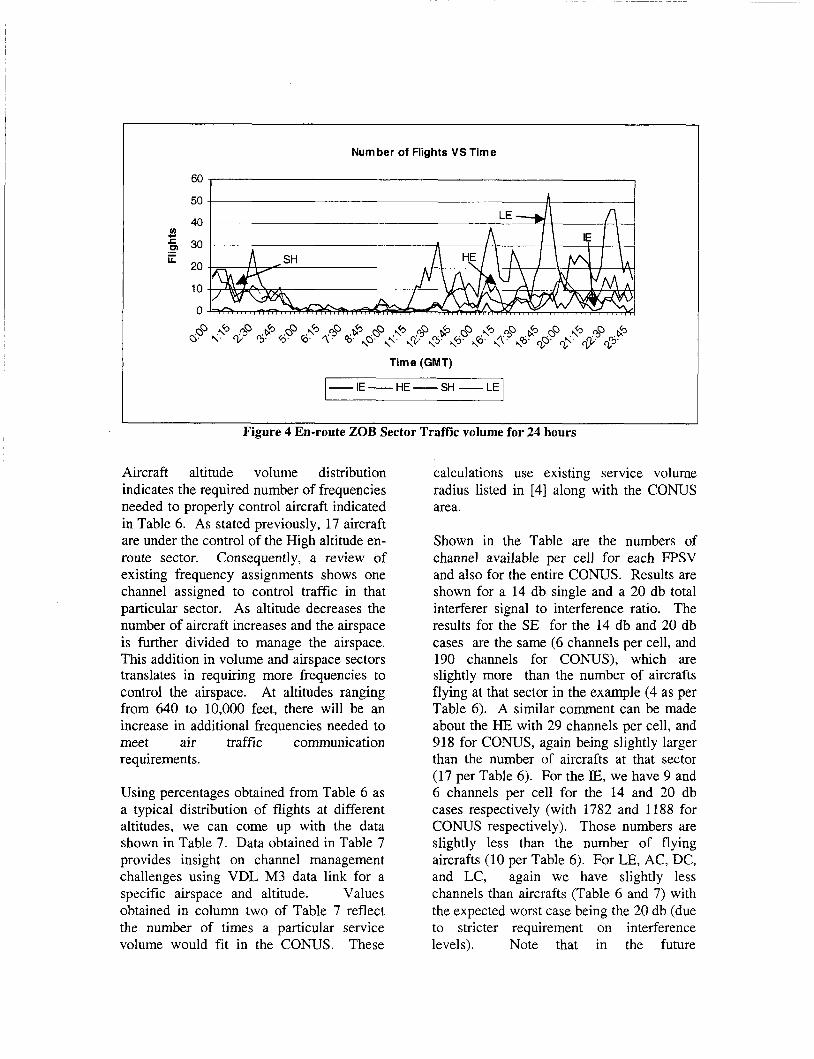
Air Traffic volume varies at different times of the day and different days of the week. Air Traffic loads are greater during the day and early evening, and volume starts to diminish as evening progresses, this is evident by the flights versus time graph shown in Figure 4. Figure 4 shows traffic volume progression over a 24 hour time
period for four different en-route sectors. The graph shows that as nighttime approaches, traffic loads start to decrease until a minimum of zero aircraft occurs at about 2:OO AM (EST). Then, as daytime approaches, traffic starts to increase with maximums occurring at about 5:OO PM (EST).
Number of Flights VS Time
60
50
40
6 30
20 ii
10
0
I u) L
.-
Time (GMT)
-IE-HE-SH LE^ I I I
Figure 4 En-route ZOB Sector Traffic volume for 24 hours
Aircraft altitude volume distribution indicates the required number of frequencies needed to properly control aircraft indicated in Table 6. As stated previously, 17 aircraft are under the control of the High altitude en- route sector. Consequently, a review of existing frequency assignments shows one channel assigned to control traffic in that particular sector. As altitude decreases the number of aircraft increases and the airspace is further divided to manage the airspace. This addition in volume and airspace sectors translates in requiring more frequencies to control the airspace. At altitudes ranging from 640 to 10,000 feet, there will be an increase in additional frequencies needed to meet air traffic communication requirements.
Using percentages obtained from Table 6 as a typical distribution of flights at different altitudes, we can come up with the data shown in Table 7. Data obtained in Table 7 provides insight on channel management challenges using VDL M3 data link for a specific airspace and altitude. Values obtained in column two of Table 7 reflect the number of times a particular service volume would fit in the CONUS. These
calculations use existing service volume radius listed in [4] along with the CONUS area.
Shown in the Table are the numbers of channel available per cell for each FPSV and also for the entire CONUS. Results are shown for a 14 db single and a 20 db total interferer signal to interference ratio. The results for the SE for the 14 db and 20 db cases are the same (6 channels per cell, and 190 channels for CONUS), which are slightly more than the number of aircrafts flying at that sector in the example (4 as per Table 6). A similar comment can be made about the HE with 29 channels per cell, and 918 for CONUS, again being slightly larger than the number of aircrafts at that sector (17 per Table 6). For the E, we have 9 and 6 channels per cell for the 14 and 20 db cases respectively (with 1782 and 1188 for CONUS respectively). Those numbers are slightly less than the number of flying aircrafts (10 per Table 6). For LE, AC, DC, and LC, again we have slightly less channels than aircrafts (Table 6 and 7) with the expected worst case being the 20 db (due to stricter requirement on interference levels). Note that in the future

implementation of VDL 3 (as is the case for can be safely assumed to be larger than the current voice service), a time slot and a those number shown. If on the other hand frequency may be reused by more than one the implementation assumed one time aircraft at different times based on need and TDMA time slot is reserved per one aircraft only if the data rates required do not exceed for the entire flight period, then this means the TDMA rate. Hence the actual capacity one channel per one aircraft.
Service Type
Super High Altitude En Route (SE) High Altitude En Route (HE9 Intermediate Altitude En Route
Low Altitude En Route (LE) Approach Control [AC), Departure Control (DC), Local Control (LC)
(E)
Number of service volume that fits in CONUS.
CONUS - area 7IR'
(using nmi2 for CONUS area)
~
31.68
31.68
198
198
198
792
Available number of channels, Single Cell Capacity using frequency reuse factors of 14 db single interferer (Table 1) and formula (1)
BW*,".,f,"
with Nslots=3 and BWtotalmWcbannel= 524 with Table 6 distribution to each Fpsv 6
Cell - Capaclry = !!!!LJL
29
9
44
15
7
Available number of channels for all CONUS using percentages obtained in table 6 using single cell capacity frequency for 14db.
190
918
1782
8712
2970
5544
Available number of channels, Single Cell Capacity using frequency reuse factors of 20 db total interferers (Table 1) and formula (1)
BWe-,fR"
with Nslots=3 and
524 with Table 6 distribution to each Fpsv 6
Cell - capoc;ry = - BWto ta l~Wchanne l=
29
6
39
10
Available number of channels for all CONUS using percentages obtained in table 6 using single cell capacity frequency for 20 db.
190
918
1188
7722
1980
792
Table 7: Cell Capacity, and CONUS capacity based on Detroit data of table 6.
Conclusions and Future Recommendations
The limited number of channels available for Air traffic control under the current system is reaching its limitations. New innovative methods need to be devised to meet existing and future frequency requirements. Using the approach described in this paper provides an alternate approach to engineering and managing spectrum for VDL Mode 3 communications. This paper showed a parametric study of the frequency reuse, cell separation, and capacity for
different FAA FpSVs. Frequency assignment for an ATRCC considers a variety of parameters, some of which are based on radio system characteristics and others are based on the way the En-route airspace is portioned. The results obtained from a combination of actual and theoretical analysis shows sufficient channel assignments for the air traffic volume with little margin based on one channel per aircraft. It expected that aircraft will be sharing channels in the VDL 3 setting, in which case there will be a considerable margin exceeding future volume increase.

For future studies it is recommended that traffic volume of other ARTCC air space be used for more optimal frequency plans. Also, it is highly recommended that new frequency planning approaches be considered in the future that are not dependent on the current sectorization methods. For example an approach can be devised that enables the use of frequency assignments on a per aircraft basis as opposed to a sector basis. This is ideal given the future digital implementation and all the integrated features that it will have which will rely less on the controller workload capacity and more on automation capabilities.
Acknowledgement
The work here was done as part of the Advanced Communications for Air Traffic Management Project at NASA Glenn Research Center in Cleveland, Ohio. The authors also want to acknowledge the work done and referenced within by D. Matolak of MITRE, which inspired some of the initial ideas in this paper.
References [ 11 GAO-02-7 10, “National Air Space System“, Report to Congressional Requesters, United States General Accounting Office, July 2002.
[2] National Airspace System Architecture- FAA,httu://www.faa.g.ov/nasarchitecture.
[3] AMCPIWG-D. February 1999, “VHF Digital Link (VDL) TDMA Mode 3 Standards and Recommended Practices,” Draft Version 1.8. [4] Document 6050.32A, ‘‘Spectrum Management Regulation and Procedures Manual”, Dept. of Transportation, FAA.
[5] D. Matolak., S. Smith. “Estimation of TDMA and CDMA capacities for an air-to- ground communication system,” Digital Avionics Systems Conference, 1997. 16th DASC., AIAAIIEEE , Volume: 2 , 26-30 Oct 1997.
[6] D. Matolak, “3-D outside cell interference factor for an air-ground CDMA “cellular” system,” Vehicular Technology, IEEE Transactions on , Volume: 49 Issue: 3, , Page(s): 706 -71 , May 2000.
[7] G. Stuber, Principles of Mobile Communication, Norwell, MA: Kluwer Academic Publishers, 2001.
[ 81 AMCP-WGB-1, “Compatibility Testing of VDL Mode 3” Working Group B, Aeronautical Mobile Communications Panel (AMCP), St Petersburg, Russia, August 26- 30, 2003.