Embed Size (px)
Citation preview
Professional journal advertising swung to a loss in the first half of 2012, from an 11.9% gain during the prior-year period. The decline means that print spending has faltered in its attempt
to climb beyond recent highs, making a two-year-long rally which MM&M had characterized as one of “restrained recovery” now look more like restraint, plain and simple.
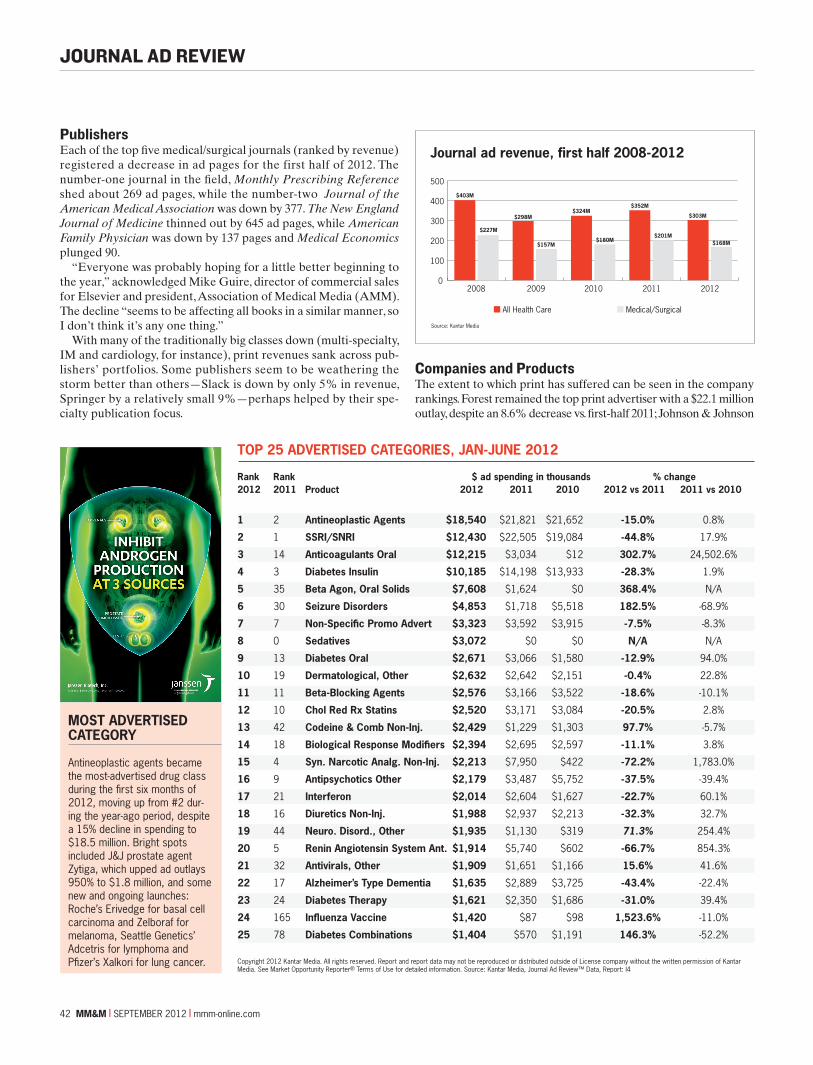
In the first six months of this year, medical/surgical print spend-ing took a 16.5% dive year-on-year, dropping to $168.2 million. On an ad-page basis, the decline was 20.1%. The greater healthcare market (which includes pharmacy, nurse prac-t it ioners/physicians assistants, managed care, etc.) registered a 13.9% loss, coming in at $303.1 million, while pharmaceutical spending dropped 20.1% to $169.9 million. For the top 100 most advertised pharmaceuticals, outlays were decreased by a whopping 57% to $57.7 million.
The main reason behind the print market’s softening is one that has become all too familiar: The number of new product launches is not big enough to fill the breach left by expiring drug patents and delayed approvals. There are a few specialty products on the horizon that could inject ad dollars, but no one expects a return to growth this year.
At the journal level, multi-specialty titles were the loss leader. They were down 21.9% year-on-year, representing $14.5 million less in the market. Dollar growth vs. the year-ago period was con-fined to several niche sectors—healthcare business management, neurology and gastroenterology were the top-performing markets. Twenty-nine of the 37 markets that are tracked by Kantar Media posted losses; among the doctor books, psychiatry, oncology and rheumatology declined most steeply.
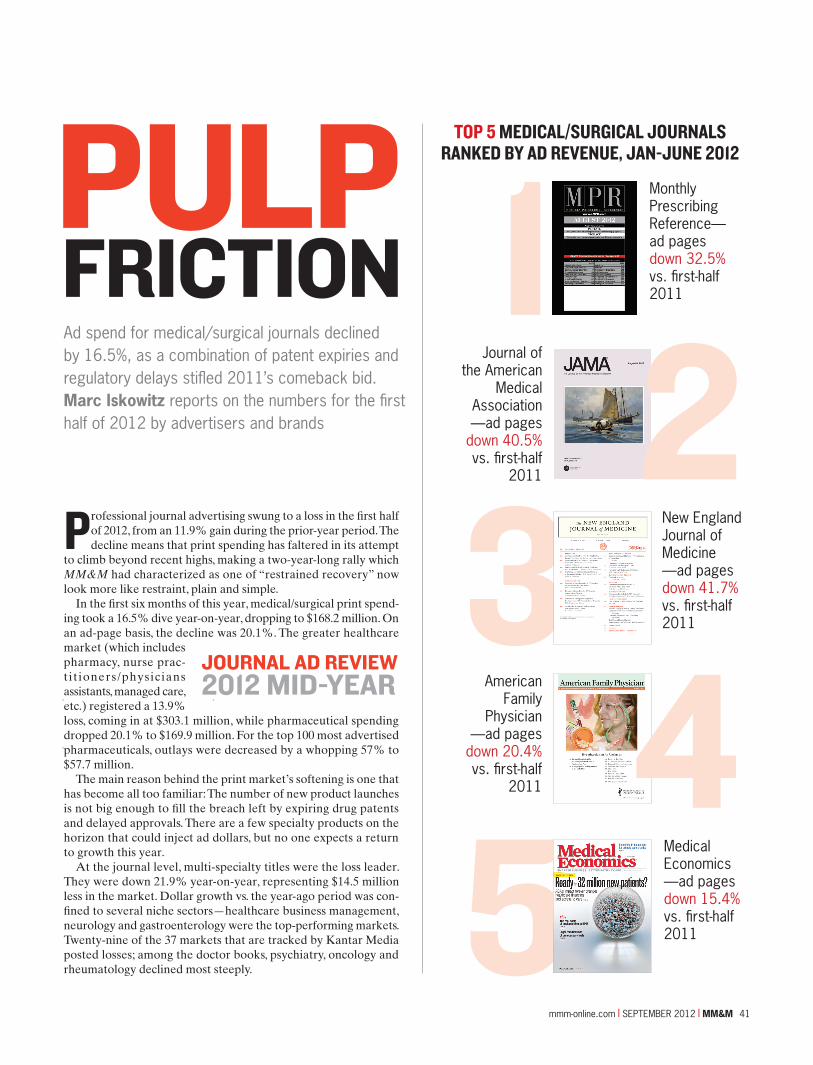
1Monthly Prescribing Reference—ad pages down 32.5% vs. first-half 2011
Journal of the American
Medical Association —ad pages
down 40.5% vs. first-half
2011
4American
Family Physician
—ad pages down 20.4% vs. first-half
2011
3New England Journal of Medicine —ad pages down 41.7% vs. first-half 2011
TOP 5 MEDICAL/SURGICAL JOURNALS RANKED BY AD REVENUE, JAN-JUNE 2012
JOURNAL AD REVIEW 2012 MID-YEAR
Ad spend for medical/surgical journals declined by 16.5%, as a combination of patent expiries and regulatory delays stifled 2011’s comeback bid. Marc Iskowitz reports on the numbers for the first half of 2012 by advertisers and brands
FRICTIONPULP
Medical Economics —ad pages down 15.4% vs. first-half 20115
mmm-online.com x SEPTEMBER 2012 x MM&M 41
2
PublishersEach of the top five medical/surgical journals (ranked by revenue) registered a decrease in ad pages for the first half of 2012. The number-one journal in the field, Monthly Prescribing Reference shed about 269 ad pages, while the number-two Journal of the American Medical Association was down by 377. The New England Journal of Medicine thinned out by 645 ad pages, while American Family Physician was down by 137 pages and Medical Economics plunged 90.
“Everyone was probably hoping for a little better beginning to the year,” acknowledged Mike Guire, director of commercial sales for Elsevier and president, Association of Medical Media (AMM). The decline “seems to be affecting all books in a similar manner, so I don’t think it’s any one thing.”
With many of the traditionally big classes down (multi-specialty, IM and cardiology, for instance), print revenues sank across pub-lishers’ portfolios. Some publishers seem to be weathering the storm better than others—Slack is down by only 5% in revenue, Springer by a relatively small 9%—perhaps helped by their spe-cialty publication focus.
Companies and ProductsThe extent to which print has suffered can be seen in the company rankings. Forest remained the top print advertiser with a $22.1 million outlay, despite an 8.6% decrease vs. first-half 2011; Johnson & Johnson
TOP 25 ADVERTISED CATEGORIES, JAN-JUNE 2012 Rank Rank $ ad spending in thousands % change 2012 2011 Product 2012 2011 2010 2012 vs 2011 2011 vs 2010
1 2 Antineoplastic Agents $18,540 $21,821 $21,652 -15.0% 0.8%
2 1 SSRI/SNRI $12,430 $22,505 $19,084 -44.8% 17.9%
3 14 Anticoagulants Oral $12,215 $3,034 $12 302.7% 24,502.6%
4 3 Diabetes Insulin $10,185 $14,198 $13,933 -28.3% 1.9%
5 35 Beta Agon, Oral Solids $7,608 $1,624 $0 368.4% N/A
6 30 Seizure Disorders $4,853 $1,718 $5,518 182.5% -68.9%
7 7 Non-Specific Promo Advert $3,323 $3,592 $3,915 -7.5% -8.3%
8 0 Sedatives $3,072 $0 $0 N/A N/A
9 13 Diabetes Oral $2,671 $3,066 $1,580 -12.9% 94.0%
10 19 Dermatological, Other $2,632 $2,642 $2,151 -0.4% 22.8%
11 11 Beta-Blocking Agents $2,576 $3,166 $3,522 -18.6% -10.1%
12 10 Chol Red Rx Statins $2,520 $3,171 $3,084 -20.5% 2.8%
13 42 Codeine & Comb Non-Inj. $2,429 $1,229 $1,303 97.7% -5.7%
14 18 Biological Response Modifiers $2,394 $2,695 $2,597 -11.1% 3.8%
15 4 Syn. Narcotic Analg. Non-Inj. $2,213 $7,950 $422 -72.2% 1,783.0%
16 9 Antipsychotics Other $2,179 $3,487 $5,752 -37.5% -39.4%
17 21 Interferon $2,014 $2,604 $1,627 -22.7% 60.1%
18 16 Diuretics Non-Inj. $1,988 $2,937 $2,213 -32.3% 32.7%
19 44 Neuro. Disord., Other $1,935 $1,130 $319 71.3% 254.4%
20 5 Renin Angiotensin System Ant. $1,914 $5,740 $602 -66.7% 854.3%
21 32 Antivirals, Other $1,909 $1,651 $1,166 15.6% 41.6%
22 17 Alzheimer’s Type Dementia $1,635 $2,889 $3,725 -43.4% -22.4%
23 24 Diabetes Therapy $1,621 $2,350 $1,686 -31.0% 39.4%
24 165 Influenza Vaccine $1,420 $87 $98 1,523.6% -11.0%
25 78 Diabetes Combinations $1,404 $570 $1,191 146.3% -52.2%
Copyright 2012 Kantar Media. All rights reserved. Report and report data may not be reproduced or distributed outside of License company without the written permission of Kantar Media. See Market Opportunity Reporter® Terms of Use for detailed information. Source: Kantar Media, Journal Ad Review™ Data, Report: I4
MOST ADVERTISED CATEGORY
Antineoplastic agents became the most-advertised drug class during the first six months of 2012, moving up from #2 dur-ing the year-ago period, despite a 15% decline in spending to $18.5 million. Bright spots included J&J prostate agent Zytiga, which upped ad outlays 950% to $1.8 million, and some new and ongoing launches: Roche’s Erivedge for basal cell carcinoma and Zelboraf for melanoma, Seattle Genetics’ Adcetris for lymphoma and Pfizer’s Xalkori for lung cancer.
Journal ad revenue, first half 2008-2012
Source: Kantar Media
All Health Care Medical/Surgical
0
100
200
300
400
500
2008 2009 2010 2011 2012
$403M
$227M
$298M
$157M
$324M
$180M
$352M
$201M
$303M
$168M
42 MM&M x SEPTEMBER 2012 x mmm-online.com
JOURNAL AD REVIEW
TOP 25 ADVERTISED BRANDS, JAN-JUNE 2012 Rank Rank $ ad spending in thousands % change 2012 2011 Product Company 2012 2011 2010 2012 vs 2011 2011 vs 2010 1 11 Viibryd Forest $7,905 $2,894 $0 173.1% N/A
2 — Xarelto tablets Johnson & Johnson $6,723 $0 $0 N/A N/A
3 23 Daliresp Forest $5,610 $1,624 $0 245.4% N/A
4 — Intermezzo sublingual Purdue $3,072 $0 $0 N/A N/A
5 4 Savella tablets Forest $2,680 $4,620 $8,329 -42.0% -44.5%
6 17 Victoza Novo Nordisk $2,450 $2,066 $1,489 18.6% 38.7
7 36 Oxycontin Purdue $2,423 $1,193 $1,303 103.1% -8.4%
8 8 Bystolic Forest $2,376 $3,166 $3,504 -25.0% -9.6%
9 54 Lyrica Pfizer $2,063 $863 $3,321 138.9% -74.0%
10 — Daliresp NB Forest $1,998 $0 $0 N/A N/A
11 — Edarbyclor tablets Takeda $1,986 $0 $0 N/A N/A
12 — Brilinta tablets AstraZeneca $1,936 $0 $0 N/A N/A
13 2 Teflaro injection Forest $1,906 $5,068 $0 -62.4% N/A
14 239 Zytiga Johnson & Johnson $1,801 $171 $0 950.9% N/A
15 — Bydureon Amylin $1,696 $0 $0 N/A N/A
16 6 Butrans Purdue $1,657 $3,582 $0 -53.8% N/A
17 56 Byetta Amylin/Lilly $1,642 $839 $2,035 95.7% -58.8%
18 18 Namenda Forest $1,603 $2,021 $2,483 -20.7% -18.6%
19 41 Humira Abbott $1,594 $1,127 $0 41.4% N/A
20 15 Samsca tablets Otsuka $1,582 $2,235 $2,213 -29.2% 1.0
21 10 Pradaxa Boehringer Ingelheim $1,497 $2,910 $0 -48.5% N/A
22 220 Tradjenta Boehringer/Lilly $1,450 $197 $0 635.9% N/A
23 16 Latuda Sunovion $1,301 $2,213 $0 -41.2% N/A
24 21 Forteo Eli Lilly $1,271 $1,825 $0 -30.3% N/A
25 — Janumet XR Merck $1,258 $0 $0 N/A N/A
moved up from fifth to second thanks to a $527,000 increase; and Pfizer hovered in third place, notwithstanding a 25.4% budget cut.
Only two companies broke into the top 10 this year—GlaxoSmith-Kline and Purdue. Their 96.8% and 48.4% increases, respectively, knocked out Sanofi and Merck. The other six of 2012’s first-half top 10 (Pfizer, Novo Nordisk, Novartis, Takeda, Lilly and Roche) severely curtailed print spend yet remained in the upper decile.
The top 25 products accounted for 20% of all spend in the market, with $61.5 million (down by more than half vs. the first six months of last year). Forest has the top-advertised drug, antidepressant Viibryd, and four of the 10 most-advertised brands. Viibryd, up from num-ber 11 last year thanks to a 173% push, and one other Forest drug enjoyed spending hikes, vs. a dial-back on fibromyalgia med Savella and BP product Bystolic. Among the top 25 brands were seven newly advertised products, adding $18.2 million into the market.
J&J hiked spend 6% to $8.9 million behind launches for prostate cancer drug Zytiga and blood thinner Xarelto. Those launches also helped propel the Antineoplastic Agents and Anticoagulants Oral classes to first and third place, respectively, on the list of most-adver-tised categories in the six months to June. Rounding out the top five classes by sales, the SSRI/SNRI and Diabetes Insulin classes—highly
ranked the last several years—were also joined by Beta Agonists Oral, up from 35th place during first-half 2011.
“There were 482 brands that did journal advertising in first half of 2011, versus 480 brands in the same period in 2012,” observes Kelly Sborlini, VP of syndicated market research operations at Encuity
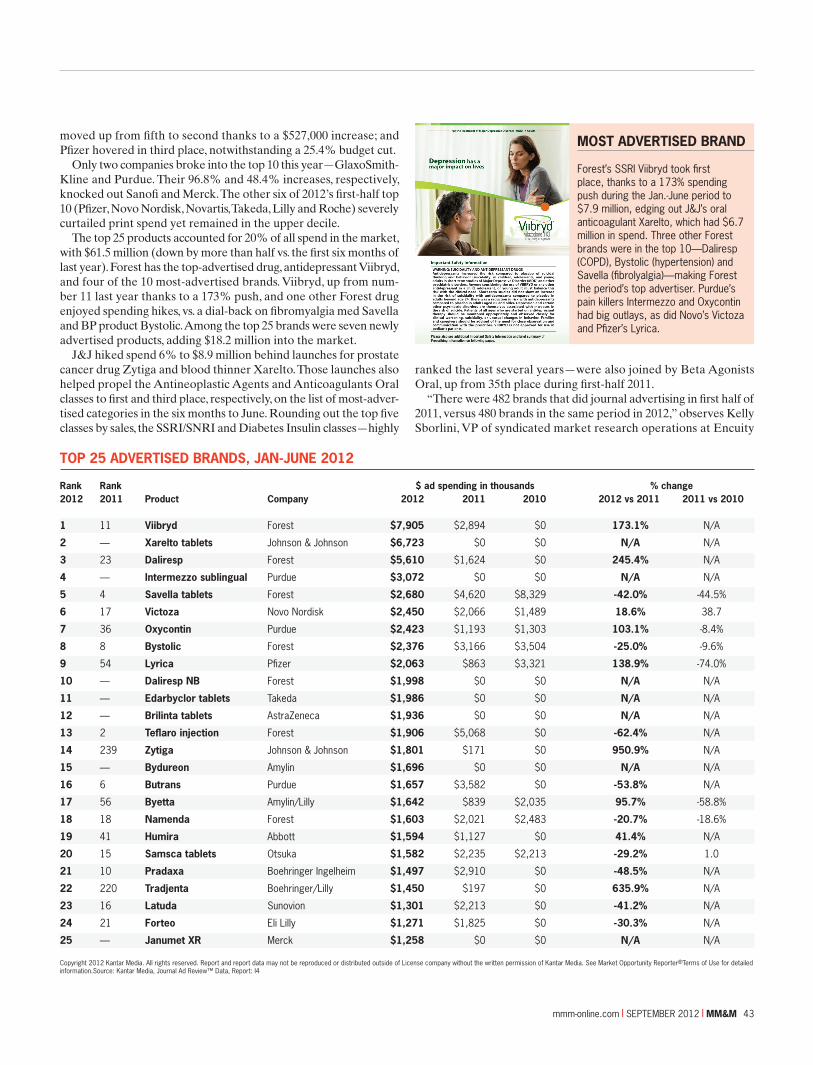
MOST ADVERTISED BRAND
Forest’s SSRI Viibryd took first place, thanks to a 173% spending push during the Jan.-June period to $7.9 million, edging out J&J’s oral anticoagulant Xarelto, which had $6.7 million in spend. Three other Forest brands were in the top 10— Daliresp (COPD), Bystolic (hypertension) and Savella (fibrolyalgia)—making Forest the period’s top advertiser. Purdue’s pain killers Intermezzo and Oxycontin had big outlays, as did Novo’s Victoza and Pfizer’s Lyrica.
Copyright 2012 Kantar Media. All rights reserved. Report and report data may not be reproduced or distributed outside of License company without the written permission of Kantar Media. See Market Opportunity Reporter®Terms of Use for detailed information.Source: Kantar Media, Journal Ad Review™ Data, Report: I4
JOURNAL AD REVIEW
mmm-online.com x SEPTEMBER 2012 x MM&M 43
JOURNAL AD REVIEW
Research. “However, the average spend per brand in the first half of the year decreased by about $40,000 from $324,000 in 2011 to $281,000 in 2012,” her firm’s data show.
OnlineThere does seem to be a silver lining for journal publishers, and it’s the growth of digital advertising. As digital spend is not captured in the conventional tracking services, MM&M asked whether online advertising is up and how else revenue sources are diversifying.
Consensus among a number of AMM members, according to Guire, is that they are experiencing revenue gains in newer media channels like on-site advertising, microsites and e-blasts, licensing, events and digital broadcasts. Another growth area has been ads on iPad apps. Wolters Kluwer says its Lippincott Williams and Wilkins (LWW) titles have mitigated print losses, and boosted digital revenues, after the publisher stopped offering advertisers the option of print-only ads. Print and digital apps are sold together at one price.
First-half print revenue for the LWW journals declined by 10.8% vs. the year-ago period. By contrast, Elsevier revenues fell 18%, Advanstar 17% and the American Medical Association 25%. “When we look at revenue at the macro level,” says Karen Abramson,
44 MM&M x SEPTEMBER 2012 x mmm-online.com
TOP 10 ONLINE BRANDS, JAN-JUNE 2012 Brands ranked by frequency of ad occurrences Rank 2012 Brand/Manufacturer % of all occurances
1 Recothrom (ZymoGenetics) 4.5%
2 Axiron (Eli Lilly) 4.3%
3 ProAir HFA (Teva) 3.5%
4 Oracea (Galderma) 3.4%
5 Provenge (Dendreon) 3.2%
6 Daliresp (Forest) 2.8%
7 Bydureon (Amylin) 2.6%
8 Xarelto (Johnson & Johnson) 2.6%
9 Victoza (Novo Nordisk) 2.5%
10 Erivedge (Roche) 2.4%
Copyright 2012 Kantar Media, Evaliant.
TOP 10 ONLINE BRANDS, JAN-JUNE 2012 Brands ranked by quantity of sites used Rank 2012 Brand/Manufacturer # of sites used
1 Xarelto (Johnson & Johnson) 32
2 Axiron (Eli Lilly) 29
3 Cymbalta (Eli Lilly) 25
4 Victoza (Novo Nordisk) 24
5 Creon (Abbott) 19
6 Complera (Gilead) 18
7 Prevnar (Pfizer) 17
8 Byetta (Amylin) 17
9 Nucynta (Johnson & Johnson) 16
10 Brilinta (AstraZeneca) 16
Copyright 2012 Kantar Media, Evaliant.
president and CEO of Wolters Kluwer Health Medical Research, “we’re outperforming the market and we attribute this lift in part to the bundled ad model we introduced in January.”
Meanwhile, Kantar’s Evaliant data show brand managers may be getting smarter about using multiple platforms to reach their audiences. Nine of the top 10 print advertisers (based on number of insertions) also show up in the top 30 companies online (based on occurrences), with most falling in the top 20. Forest, the biggest print advertiser, ranked 11th in online occurrences. That’s a big improve-ment over last year at this time, when the drugmaker had no presence on the major websites tracked by Evaliant (Forest could have been engaging in other types of online promotion, such as e-detailing, e-sampling or microsites). Four firms were in the top 10 both in print and online: Pfizer, J&J, Novartis and Roche, vs. two last year.
At the brand level, several top online brands (based on occurrences) aren’t in the top 100 print brands (based on insertions), and vice versa. Only Daliresp (number six online, two in print) and Xarelto (number eight online, three in print) hit the top 10 in both media. Many of the most widely advertised brands (those using the most sites) were, not surprisingly, also among the top in occurrences.
The futureIn this era when more clinicians use portable devices to consume professional journal content, and pharma advertisers are allocating promotional spend between many channels, it might be unrealistic to think journal ad spend will move any direction but sideways. On the other hand, IMS Health’s Global Use of Medicines Outlook report predicts that drug approvals—the main driver of promotion—will improve and that pharma will launch 30-something NMEs each year through 2016. Will that help print stage a sustained comeback?
Says Wolters Kluwer’s Abramson, any return to R&D productiv-ity must be viewed against the backdrop of shrinking pipelines for blockbuster products and pharma’s shift to deliver more niche drugs. “When you define print journal pages as advertising, then yes, we’ll continue to see a decline and fluctuations,” she predicts. “But today, we need to look at this industry in a positive transformation that’s defined by the audience reach across multiple channels.” n
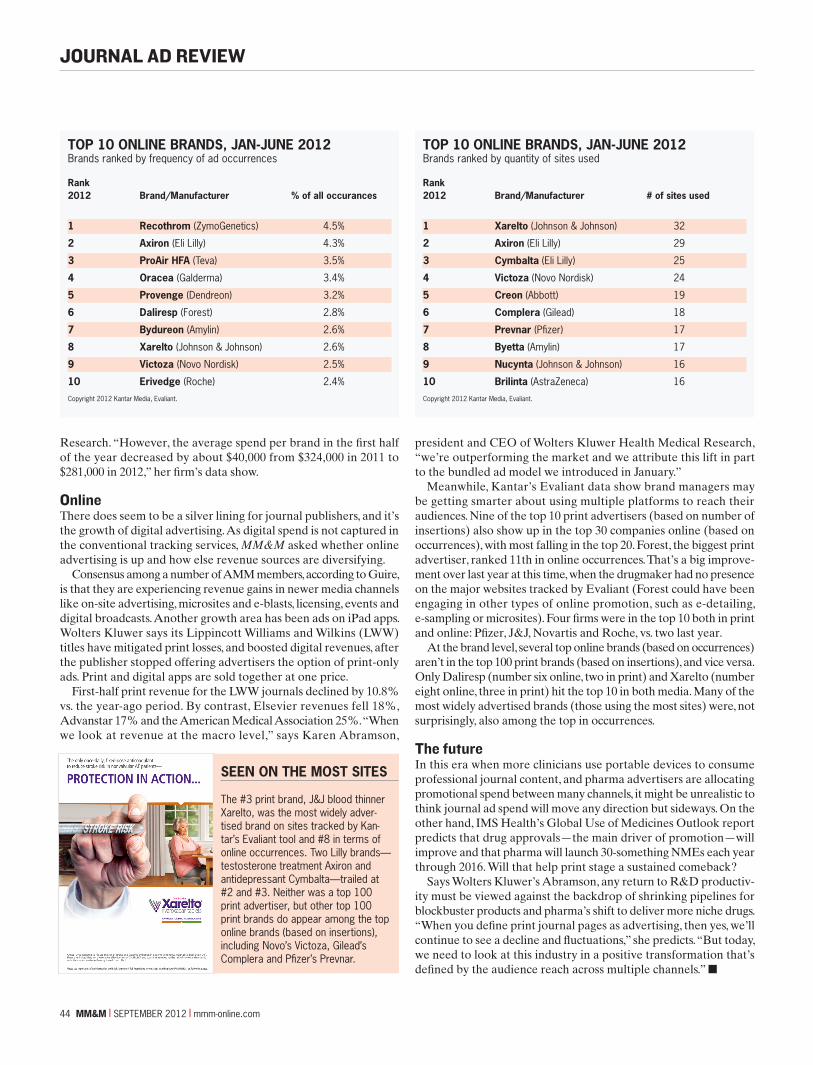
SEEN ON THE MOST SITES
The #3 print brand, J&J blood thinner Xarelto, was the most widely adver-tised brand on sites tracked by Kan-tar’s Evaliant tool and #8 in terms of online occurrences. Two Lilly brands—testosterone treatment Axiron and antidepressant Cymbalta—trailed at #2 and #3. Neither was a top 100 print advertiser, but other top 100 print brands do appear among the top online brands (based on insertions), including Novo’s Victoza, Gilead’s Complera and Pfizer’s Prevnar.