Embed Size (px)
Citation preview
1
Innovation and Productivity in Agricultural Firms: Evidence
from a Farm-Level Innovation Survey1
Diego Aboal,a Mario P. Mondelli,
a,b and Maren Vairo
a
aCINVE - Economic Research Center, Montevideo, Uruguay.
bEconomic and Policy Unit, Department of Agriculture of Uruguay (OPYPA-
MGAP)
Contact: [email protected], [email protected], [email protected]
March 2014
Abstract
The literature on the links between innovation and productivity at firm level in
agriculture is almost inexistent. In this paper, we analyze the factors behind the
innovation effort of farms and the impact that innovation effort has on farm’s
productivity, exploiting a unique farm-level agricultural innovation survey car-
ry out in Uruguay. The results indicate that farm size, cooperation with other
agents to perform R&D, the education of the owner of the farm, the participa-
tion of foreign capital and the existence of links with other organizations, in
particular scientific, horizontal and vertical ones, are positively correlated with
innovation effort. Public and private financial support are not clearly linked
with innovation effort. The innovation effort has a positive effect on farm’s
productivity. Some heterogeneities across industries are found.
JEL classification codes: O12, O13, O31, O33, O40.
Key words: innovation, productivity, agriculture, innovation surveys
1 The financial support of the Uruguayan Research and Innovation Agency (ANII), through the project
Uruguay +25 of Fundacion Astur and Mercosur Economic Research Network (Red Mercosur),is gratefully
acknowledged. The authors are responsible for opinions and limitations.

2
1. INTRODUCTION
Technological change has been a major factor shaping agriculture in the last hundred years
(Sunding & Zilberman, 2001) and has motivated a large volume of studies. Most studies on in-
novation in agriculture focus the analysis at the sector or industry level (rather than the firm lev-
el) in issues such as the rate of return to R&D investments and technological adoption and diffu-
sion of technologies. This also applies to Uruguay where a recent study shows that technological
change in the last three decades accounts for 46% of the agricultural output in 2010, calculated
as the difference between the agricultural output in 2010 and the output that would be generated
using the same inputs with the 1980 technology (Bervejillo, Alston, & Tumber, 2012).
The empirical literature is very limited when it comes to studies assessing the relationship
between innovation and productivity at the farm level. We are aware of only one study that as-
sesses the effect of innovation adoption in productivity of grain farmers in Australia (Nossal and
Lim, 2011). This gap is surprising given that there is extensive evidence showing that innovation
improves productivity at firm level in manufacturing (Hall, 2011) and pointing to the fact that
productivity is the result not only of the adoption of technology but also of the ability to generate
and integrate innovations in the farming system (EU SCAR, 2012). Probably what explains this
gap is the (also surprising) worldwide unavailability of agricultural innovation surveys.
In this context, it is important to generate evidence about how farms innovate and the way in
which innovations affect productivity at farm level. These are precisely the objectives of this
article. For this purpose we are using, as far as we know, the first agricultural innovation survey
in the world that is based on the well-known Oslo Manual and covering farm activities that ac-
count for more than 90% of the agricultural GDP of a country.2
2 The survey is based on the Bogota Manual that in turn is based on the Oslo Manual. The Bogota Manual is the
base of the manufacturing and services innovation surveys in Latin America.

3
This article contributes on several ways to the literature. First, it brings new evidence to un-
derstand the drivers of productivity in agriculture and, specifically, the effect of innovation on
productivity at the farm level. Second, it generates evidence to understand the main factors be-
hind innovation in agriculture at farm level. This analysis is novel because it allows comparing
the potential determinants of innovative efforts and the effects of innovative efforts on productiv-
ity in different industries in the agricultural sector—oilseed and grain (non-irrigated), dairy, beef
cattle and sheep, and irrigated rice farming. That is, it addresses the idiosyncratic attributes of
industry specificities. An additional contribution of this paper is the comparison of the effects of
innovation in productivity between agriculture, service, and manufacturing sectors. Although,
there is extensive evidence in manufacturing, the empirical literature is limited in service
(Mohnen & Hall, 2013) and, as mentioned, almost inexistent in agriculture. This is possible be-
cause the agricultural innovation survey used in this study shares the same approach and ques-
tionnaire design with the manufacturing and services innovation surveys.
In what follows, in Section 2 we present a literature review. In Section 3, we discuss the em-
pirical strategy. Section 4 describes the data used in the empirical exercise. The results of the
econometric analysis are presented in Section 5. Finally, in Section 6 we conclude.
2. LITERATURE REVIEW
2.1. Innovation and Productivity
Large and persistent differences in productivity across businesses are ubiquitous (Syverson,
2011). Scholars in industrial organization, strategy, and other fields have long attempted to ad-
dress the drivers of firm performance and several alternative views coexist. Chad
Syverson(2011)surveys the literature addressing the question of why businesses differ in their
measured productivity levels. The drivers of productivity are diverse and can be structured in
two levels—factors that influence productivity at the firm level and factors operating at industry
or market level that can induce productivity.
4
Among the factors found to influence productivity at the firm level are managerial practices,
organizational structure of the firm, higher quality labor and capital inputs and information tech-
nologies (e.g. Lopez and Maffioli, 2008; Khanal and Gillespie, 2013). Although many of these
factors can be related to innovative efforts and innovation, the literature on the relationship be-
tween innovation and productivity is scarce.
There is a long literature linking R&D and productivity (or rate of returns), mostly at indus-
try level, and recent studies have focused at the firm level (Alston et al. 2000; Alston et al. 2011).
However, R&D is one of many innovative efforts at the firm level. Many firms undertake inno-
vative efforts without formally reporting R&D spending (Syverson, 2011). This is of particular
importance in agricultural firms, where there are several innovative efforts associated with pro-
cess and organizational innovations that do not require R&D.
The empirical literature assessing the relation between innovation and productivity varies
among sectors. There is important evidence at firm level for the manufacturing sector as docu-
mented in a recent survey by Mohnen and Hall (2013). This review of the literature finds that the
evidence on the (positive) impact of product innovation on revenue productivity is strong but the
evidence about the impact of process innovation is somewhat ambiguous (in sign and signifi-
cance).
Few studies can be found in the service sector, mostly from OECD and Latin American
countries (e.g. Aboal and Garda, 2012). In general they find a positive effect of innovation on
productivity.
2.2. Innovation in Agricultural Firms
Innovations have been a major factor shaping agriculture and, consequently, an important
body of the literature addresses several aspects of innovation in the agricultural sector. However,
although the literature on innovation in agriculture is extensive, it focuses mainly at the sector or
industry level and not at the firm level.

5
Many empirical studies focus on the rate of returns to R&D investment (e.g.Alston,
Andersen, James, & Pardey, 2011, for USA; Bervejillo et al., 2012, for Uruguay). Another strand
of the literature focus on technological adoption and diffusion, ranging from issues such as fac-
tors that affect adoption of specific technologies by firms to the diffusion of innovations in the
market (Sunding & Zilberman, 2001). Some studies of innovation adoption analyze the patter of
diffusion of one specific technology such as hybrid corn (Griliches, 1957) or genetically modi-
fied crops (Hategekimana and Trant, 2002). Other studies have focus on the impacts of techno-
logical change on prices and the well-being of the farm population over time.
Specifically, there are very few studies assessing empirically the relationship between inno-
vation and productivity in agricultural firms. This gap in the literature is somehow surprising
because even if public and private R&D is an important source of innovations in the sector,
many other innovation activities and factors might influence the productivity improvements at
the farm level. That involves not only the capabilities and propensity of the farmer to carry out
innovation activities and generate innovations but also the ability to integrate innovations in the
farming system.
Nossal and Lim (2011) is one of the few studies that address empirically the relation be-
tween innovation and productivity in grain production in Australia. They study the factors that
make a farmer innovative and how innovation adoption by farmers influences productivity. They
use a two-stage regression analysis with farm-level data for 2006-2008 from Australian Depart-
ment of Agriculture (ABARES). The first stage is an ordered probit model to analyze the effect
of farm-level factors on the innovation efforts (measured by the extent of adoption of a range of
innovative activities). In the second stage they estimate the impact of innovation adoption on
farm-level productivity. They find that higher innovative effort leads to higher productivity.
Their results suggest that farmers with higher innovative capacity are, on average, better decision
makers with a greater ability to source and effectively use innovation to achieve productivity

6
gains. This has implications for policy and investment decisions to promote innovative capacity
in characteristics such as financial resources, skilled labor, and access to public and private ex-
tension services.
3. EMPIRICAL STRATEGY
Griliches (1979) proposes a conceptual framework for understanding the linkages between inno-
vation and productivity. According to this literature, the process can be summarized in two stag-
es: firstly, a knowledge production function captures the innovation process, where knowledge is
a result of past and current investment in knowledge; and secondly, an output production func-
tion models the impact of innovation on productivity, where knowledge is one of the inputs in
the production equation.
Crépon, Duguet and Mairesse (1998) develop a recursive model (CDM model) suggesting an
econometric method to assess the causal link between innovation and productivity at the firm
level. The original CDM model is composed by three stages: one that formalizes the determi-
nants of investment on innovation (both at the extensive and the intensive margins); a second
stage where the innovation effort materializes through innovation results; and a final stage which
uses a Cobb-Douglas production function to model the casual effect from innovation to produc-
tivity. Thus, the CDM model encompasses the entire process that starts at the firm´s decision to
invest in innovation (the acquisition of innovation inputs); the transformation of such inputs into
innovation outputs; and the role of those outputs on firm´s productivity. In the original version of
the model, innovation effort was captured through R&D expenditure and innovation outputs
through patents.
One of the main virtues of the CDM model is that it allows correction of some biases that
arise when estimating the causal effect of innovation on productivity. Namely, the model ad-
dresses the issue of endogeneity that results from the existing simultaneity between innovation
inputs, innovation outputs and productivity by proposing a multiple-stage estimation procedure,

7
where the fitted values obtained at one stage become an exogenous variable at the following
stage.
Given the recent development of innovation surveys in Latin America, Crespi and Zúñiga
(2010) suggest an alternative version of the CDM model that adapts it to the availability of data
in the region. The main changes to CDM introduced by Crespi and Zúñiga are twofold: the in-
clusion of expenditure in any innovation activities (not just R&D) as a proxy of innovation effort
and the use of information on innovation outputs provided by surveyed firms instead of patents.
The empirical exercise presented in the following sections follows Crespi and Zúñiga´s ver-
sion of the CDM model, with some modifications were introduced due to the particular charac-
teristics of the innovation survey used in this study. Also, given that the model was originally
conceived to assess the innovation behavior of manufacturing firms, we changed the specifica-
tion of the model to account for some special characteristics of the agricultural sector. As a re-
sult, we propose a model composed by two equations: the first one models innovative effort
which is represented as the number of innovation activities carried out by the firm; while the
second one uses the results of the first stage to establish the effect of innovative behavior on
farms´ productivity. Both equations are estimated using Ordinary Least Squares (OLS) and esti-
mates are reported for both the entire sample and for each farming activity separately (i.e., rice,
dairy, beef cattle and sheep, and oilseed and grain).
3.1. The innovation equation
In the traditional version of the CDM model, firms’ innovation effort is proxied by their expendi-
ture in innovation activities. However, the information on innovation expenditure provided by
the Agricultural Innovation Survey used in this study is very limited due to questionnaire´s de-
8
sign and low rate of response in this section of the survey.3 Thus, we use the amount of innova-
tion activities carried out at the farm as an indicator of innovation intensity. Given that every
farm in the sample declares to have performed at least one innovation activity (see Table 3), no
selection bias arise.
The equation can be expressed as follows:
Where IE is the ratio of innovation activities carried out by farms to the total number of ac-
tivities in the survey. Since the number of innovation activities is different across farm activities,
this statistic is normalized to 1.z is a vector of explanatory variables (size, foreign ownership,
public financial support, farmer´s educational level, cooperation dummies and main farming ac-
tivity dummies), β is a vector of parameters and is the error term.
We are estimating a linear LS model, with the known consequence that the range of the pre-
dicted values of IE will be outside the interval [0,1]. This is not a problem, since we are using
this predicted value only as a ranking of firms according to their innovative effort.4
It is worth noting that the version of the CDM model used here skips the second stage were
innovative effort explains the production of innovation outputs. We chose to synthesize the first
two stages in one equation, under the assumption that the intensity in the development of innova-
tion activities is a good proxy for innovation outputs. There is a more practical justification for
this decision, the question about innovation outputs is only asked to those firms that introduced
at least one innovation activity for the first time in the period 2007-2009. Therefore, those firms
that introduced in a previous period all the innovation activities performed by the firm in the pe-
riod 2007-2009, do not answer this question.
3The questions for expenditure on innovation activities are nested: the question only applies to those farms that de-
clare to have introduced the respective innovation activity in 2007-2009. Thus, we do not have information on
expenditure for farms that were carrying out the activity before 2007. 4 An alternative could have been to estimate a fractional logit model that will generate predictions in the range [0,1].

9
3.2. The productivity equation
The productivity equation is modeled through the log-transformation of a Cobb-Douglas produc-
tion function, where the set of inputs is composed by physical capital, labor (skilled and un-
skilled) and innovation. This results in:
Where y is the log of sales per hectare of productive land (land productivity); k is the log of
total hectares (our size variable); l and sl are the log of the number of unskilled and skilled work-
ers per hectare respectively; is the predicted ratio of innovative activities in the previous equa-
tion; , , and are parameters; x is a vector of additional control variables (industry
dummies, soil quality and region dummies), α is a vector of parameters and u is the disturbance.
4. DATA AND DESCRIPTIVE STATISTICS
We use the Agricultural Innovation Survey (AIS) performed in Uruguay in 2010 by the Uru-
guayan Research and Innovation Agency (ANII). This survey provides information regarding
farms´ innovative behavior in eleven farming activities during the period 2007-2009.5As shown
in Table 2, the farming activities covered by the AIS account for 94% of the agricultural GDP in
2009.
The design of this survey followed the criteria proposed by the Bogota Manual (Jaramillo,
Lugones, & Salazar, 2001) which provides the main guidelines for the gathering of information
regarding firms´ technological behavior. However, given that the Manual was originally con-
ceived with focus on manufacturing firms, it shows several shortcomings when it comes to the
analysis of the agricultural sector. This imposes the need of being cautious when drawing con-
clusions from the AIS.
5Detailed methodological aspects and analysis of the results of this survey are published in Spanish in Mondelli et al.
(2013).

10
One important difference that arises when comparing the AIS with other innovation surveys
(i.e. manufacturing and service innovation surveys) is that of the unit of analysis. While tradi-
tional innovation surveys are carried out at the firm level, the way agricultural statistics are usu-
ally collected derives in the restriction of having to carry out the analysis at the farm level. This
is a limitation, given that technological strategies are usually conceived considering the produc-
tive organization as a whole.
Another special characteristic of the AIS is that its questionnaire collects information on the
adoption of approximately 30 different innovation activities (the innovation activities and the
number of innovation activities differ across farming activities), as opposed to manufacturing
and service surveys that provide information grouped in homogeneous innovation activities. This
allows detailed information about farms’ technology adoption, but also imposes some methodo-
logical difficulties given the heterogeneity in the complexity of the different innovation activities
surveyed.
Table 1. Contribution of farming activities to total agricultural production in 2009
Farming activity /a % of total production
Rice * 7%
Non-irrigated agriculture* 35%
Wheat farming* 12%
Barley farming* 2%
Corn and sorghum farming* 4%
Soybean and sunflower farming* 11%
Grassland farming* 6%
Legumes and vegetables production 4%
Fruit farming 7%
Dairy production* 8%
Beef cattle and sheep farming* 26%
Wool and leather production* 1%
Cattle and other livestock breeding* 25%
Forestry and logging 7%
Other activities not included in the AIS 6%
Total 100%
Notes: * Included in empirical analysis of this paper, /a. ISIC classification
Source: Central Bank of Uruguay.

11
Given the heterogeneity in the innovative behavior of farms among agricultural activities, we
focus on four of the most relevant activities (in terms of production). As a result, our final sam-
ple is composed by farms that carry out one of the following activities: rice, oilseed and grain,
beef cattle and sheep or dairy farming. These farm activities account for 77% of the agricultural
GDP in 2009.
In sum, the AIS contains a comprehensive set of information about the innovative behavior
of the agricultural sector with regards to relevant issues such as innovative effort, the role of co-
operation with other agents from the innovation system, among others.
Table 2 provides a description of the sample. The final number of farms included in the em-
pirical exercise is 1258: 87 from rice farming, 654 from beef cattle and sheep farming, 170 from
dairy farming, and 347 from oilseed and grain farming. Given the above mentioned heterogenei-
ty among farming activities, we also carry out the empirical exercises separately for each subsec-
tor when possible considering sample size.
As for innovative effort of farms, Table 2 provides insights on the decision of carrying out
innovation activities. Every farm in the sample carried out at least one innovation activity in
2007-2009. Nonetheless, results vary largely among areas of innovation activities: while tech-
nologies related to productive management, inputs, capital goods, and management seem to be
the most widely used, experimental R&D appears to be notably less incorporated in farms inno-
vation strategies.
When analyzing separately the strategies by farming activity, the results show that rice pro-
ducers focus mostly on productive management and information & communication technologies
(ICTs) issues; beef cattle and sheep farming on productive management and capital goods; while
dairy and oilseed and grain producers focus mainly on productive management and inputs related
innovative activities. Finally, rice farmers stand out for being the most active when it comes to
12
R&D activities, being that almost half of the establishments carried out activities belonging to
this area.
Only a marginal share of farms received public financial support. However, other forms of
cooperation appear to be widely carried out by the agricultural sector. In particular, horizontal
linkages (with other producers) and vertical linkages (with suppliers or buyers) stand out for be-
ing the most frequent way of cooperating with other agents. Thus, the productive sector appears
to be a fundamental source of support for farmers´ innovation strategies. Scientific cooperation
(with universities or laboratories) is widespread too. At the farming activity level, once again rice
producers show the most active behavior regarding R&D efforts, being that 49% of rice farmers
cooperated with other agents with the purpose of carrying out R&D and 80% of them collaborat-
ed with scientific organizations.

13
Table 2. Descriptive statistics
Descriptive statistics/Industry Rice Beef, cattle and sheep Dairy Oilseed and grain Total
N 87 654 170 347 1258
Innovative effort /a
Productive management 0.99 0.98 0.99 0.97 0.98
Inputs 0.53 0.98 1.00 0.95 0.94
Technical assistance 0.93 0.83 0.96 0.93 0.88
Cap/ital goods 0.94 0.97 0.88 0.92 0.94
Management 0.68 0.94 0.98 0.91 0.92
ICTs 0.99 0.82 0.86 0.86 0.85
Training 0.89 0.65 0.77 0.74 0.71
Experimental R&D 0.47 0.26 0.25 0.34 0.29
Anyinnovationactivity 1.00 1.00 1.00 1.00 1.00
Policy related variables /b
Public financial support /c 0.01 0.04 0.05 0.01 0.03
R&D cooperation /d 0.49 0.20 0.39 0.27 0.27
Scientific cooperation /e 0.80 0.56 0.67 0.64 0.61
Vertical cooperation /f 0.78 0.60 0.59 0.67 0.63
Horizontal cooperation /g 0.90 0.74 0.88 0.77 0.77
Financial cooperation /h 0.57 0.23 0.34 0.39 0.32
Public cooperation /i 0.37 0.37 0.31 0.27 0.33
General characteristics
Productivity /j 1941.33 230.88 1429.42 871.24 655.59
Size /k 497.91 2562.63 704.73 1273.00 1812.85
Foreign property /l 0.03 0.04 0.04 0.07 0.05
Main activity /m 0.94 0.88 0.86 0.74 0.84
Professional or technical producer /n 0.82 0.79 0.72 0.72 0.76
Unskilled labor intensity /o 0.02 0.01 0.02 0.02 0.01
Skilled labor intensity /p 0.007 0.001 0.003 0.002 0.002
Non suitable land /q 0.58 0.62 0.46 0.48 0.55
Moderately suitable land /q 0.08 0.13 0.18 0.20 0.16
Highly suitable land/q 0.34 0.25 0.35 0.32 0.29
/a Share of farms that carried out at least one of the innovation activities from that area, in 2007-2009. /b Share of
farms that qualify into the corresponding category. /c. Established links with public organizations with the pur-
pose of receiving financing. /d. Established links in with other agents with the purpose of performing experiments.
/e. Established links with scientific organizations (INIA, Universities and/or laboratories). /f. Established
vertical links (with buyers or suppliers). /g. Established horizontal links (with individual or grouped produc-
ers). /h. Established links with financial organizations. /i. Established links with public organizations. /j Mean
of sales (dollars) per hectare. /k Mean of farm’s area in hectares. /l Share of farms with over 10% of for-
eign capital. /m Share of farms where the corresponding activity is the main source of income. /n Share of farms
where the producer achieved technical or professional educational level. /o Mean of unskilled workers (less
than technical educational level) per hectare. /p Mean of skilled workers (with technical or professional level)
per hectare. /q Share of non-suitable, moderately suitable or highly suitable for agricultural land (respectively) in
total hectares.
As for size and productivity, Table 2 shows that while beef cattle and sheep, and oilseed and
grain farming are carried out by larger farms (in hectares), rice and dairy producers attain larger
sales per hectare. The higher productivity of dairy and rice farms can be related to the quality of
the land, given that these farm activities have, on average, a higher share of highly suitable land
for agriculture. Moreover, dairy and rice farms present the higher share of skilled workers per
hectare too. Foreign property is very low in all four farm activities and most farms have a tech-

14
nical or a professional producer and declare that the corresponding farming activity is their main
source of income.
5. ECONOMETRIC ANALYSIS
5.1. Innovation equation
As discussed in the methodological section, we use the ratio of innovation activities performed
by the firm to the total number of innovation activities listed in the innovation surveys as a proxy
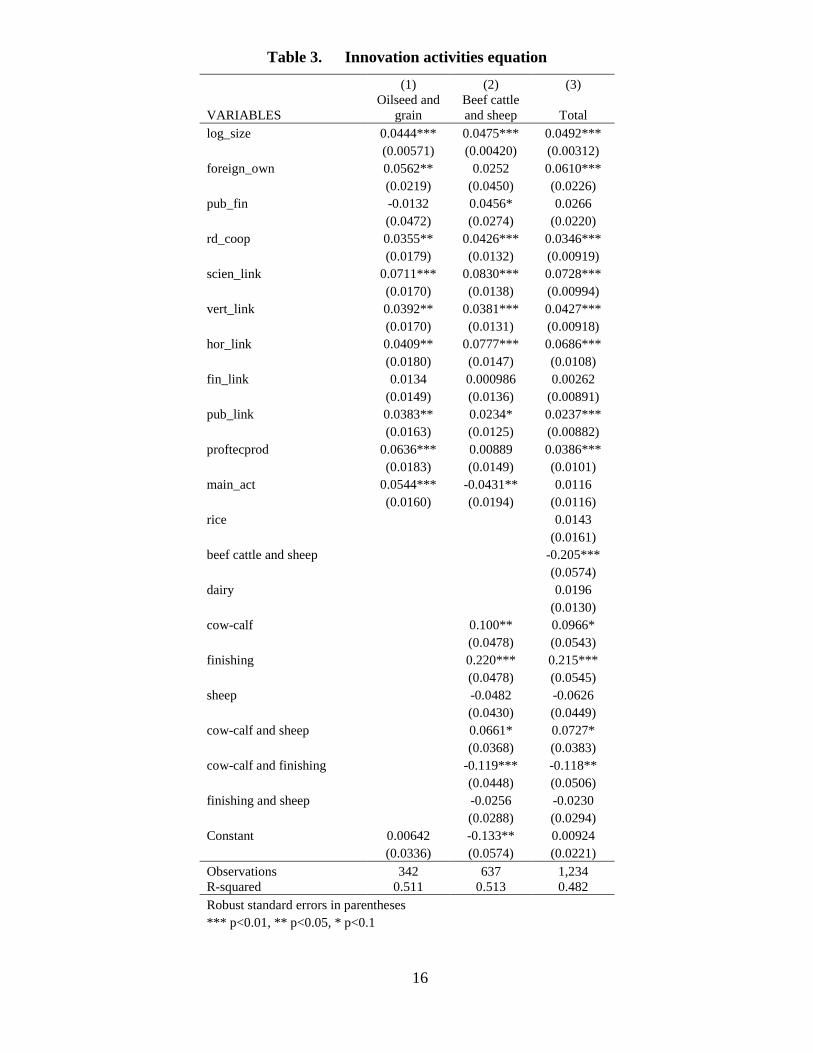
for firm innovation performance. This is our dependent variable in Table 3. We are reporting the
regression results for the whole sample (the 4 industries or farm activities) in column (3) and the
results for oilseed and grain and beef cattle and sheep in columns (1) and (2) respectively. We
have small sample size for rice and dairy and, hence, the estimators for those farm activities
might be unreliable. Therefore, we do not report the results for these two sectors.6
The first thing to notice is that size is highly significant in all regressions. This is according
to the hypothesis that important fixed costs exist in the innovation process and also with most of
the available evidence for other sectors, in particular manufacturing firms. As Cohen (2010)
points out this is one of the most robust findings of the empirical literature. This finding is usual-
ly interpreted as signaling the advantage that large firms have of spreading fixed cost of innova-
tion on a larger number of units of output.
The variable foreign ownership shows a positive coefficient in regressions (1)and (3)—
oilseed and grain, and whole sample. That is, firms where foreign owners participate in more
than 10% of the firm´s capital tend to innovate more. Inward foreign direct investment (FDI) has
long been understood as a channel for technological spillovers. Keller (2010) summarizing the
findings of this literature concludes that there is important evidence of technology spillovers of
inward FDI. But it is important to understand that the existence of a positive coefficient could be
6 For the innovation stage we have 87 observations for rice and 168 for dairy. For the productivity equation we have
only 45 observations for rice and 98 for dairy.

15
either because foreign investors buy more innovative firms or because they introduce more inno-
vations in firms (perhaps adopting foreign technologies) or even both. A recent study for Spanish
manufacturing firms (Guadalupe et al., 2012) finds that multinational firms acquire the most
productive domestic firms, which, on acquisition, conduct more innovation and adopt foreign
technologies. This evidence seems to suggest that it is more appropriate to interpreting the coef-
ficient of our foreign ownership variable as a correlation, rather than implying causality. In the
case of beef cattle and sheep, foreign ownership is marginally observed (4% of the sample) and
this variable is not statistically associated with more innovation.
16
Table 3. Innovation activities equation
(1) (2) (3)
VARIABLES
Oilseed and
grain
Beef cattle
and sheep Total
log_size 0.0444*** 0.0475*** 0.0492***
(0.00571) (0.00420) (0.00312)
foreign_own 0.0562** 0.0252 0.0610***
(0.0219) (0.0450) (0.0226)
pub_fin -0.0132 0.0456* 0.0266
(0.0472) (0.0274) (0.0220)
rd_coop 0.0355** 0.0426*** 0.0346***
(0.0179) (0.0132) (0.00919)
scien_link 0.0711*** 0.0830*** 0.0728***
(0.0170) (0.0138) (0.00994)
vert_link 0.0392** 0.0381*** 0.0427***
(0.0170) (0.0131) (0.00918)
hor_link 0.0409** 0.0777*** 0.0686***
(0.0180) (0.0147) (0.0108)
fin_link 0.0134 0.000986 0.00262
(0.0149) (0.0136) (0.00891)
pub_link 0.0383** 0.0234* 0.0237***
(0.0163) (0.0125) (0.00882)
proftecprod 0.0636*** 0.00889 0.0386***
(0.0183) (0.0149) (0.0101)
main_act 0.0544*** -0.0431** 0.0116
(0.0160) (0.0194) (0.0116)
rice
0.0143
(0.0161)
beef cattle and sheep
-0.205***
(0.0574)
dairy
0.0196
(0.0130)
cow-calf
0.100** 0.0966*
(0.0478) (0.0543)
finishing
0.220*** 0.215***
(0.0478) (0.0545)
sheep
-0.0482 -0.0626
(0.0430) (0.0449)
cow-calf and sheep
0.0661* 0.0727*
(0.0368) (0.0383)
cow-calf and finishing
-0.119*** -0.118**
(0.0448) (0.0506)
finishing and sheep
-0.0256 -0.0230
(0.0288) (0.0294)
Constant 0.00642 -0.133** 0.00924
(0.0336) (0.0574) (0.0221)
Observations 342 637 1,234
R-squared 0.511 0.513 0.482
Robust standard errors in parentheses
*** p<0.01, ** p<0.05, * p<0.1

17
In the case of Uruguay, qualitative evidence suggests that in the last decade foreign investors
in the oilseed and grain farming had brought not only funds but also new technologies that are
closer to the technological frontier than the available ones, and that they had also introduced im-
portant non-technological innovations, e.g. new organizational and business models (Errea,
Peyrou, Secco, & Souto, 2011). The available evidence for the manufacturing and service sectors
in Uruguay shows no systematic correlation between the variable foreign ownership and the
innovative effort of firms (Aboal & Garda, 2012), therefore this seems to be a particular channel
that is present only in the case of some agricultural industries in Uruguay.
The coefficient of public financing (pub_fin) is marginally significant (at 10%) only in the
case of beef cattle and sheep. This dummy variable indicates if the firm had a link with a public
organization with the purpose of obtaining funding for innovation activities. Therefore, this re-
sult suggests that public funding have played only a limited role on innovation in some agricul-
tural firms. This conclusion must be taken with caution, since we do not know for certain if firms
received public funding, we only know if they have been in contact with public organizations for
this purpose. In addition, the no-effect result could come, for example, from the small amount of
the public support that firms could have received in other sectors rather than implying the irrele-
vance of public financial support per se.
The variable cooperation in R&D has a positive coefficient and is significant in all the three
regressions. This variable indicates if a firm established a link with another organization in order
to carry out experimental work. Collaboration is important if there are economies of scale or
scope in the production of innovations, but also to cope with the risks and complexity that the
innovation process entails. The evidence shows that firms that have established this link perform
more innovation activities than those firms that do not. This result is in line with results found in
previous works in other sectors. For example, Becker and Dietz(2004) for the German manufac-
turing industry find that joint R&D enhances product innovation. Aboal and Garda (2012) show

18
that cooperation in R&D is positively correlated with the decision to invest in innovation activi-
ties and also with the amount invested in innovation activities of manufacturing and services
firms in Uruguay.
The innovation survey asks firms if they have established a link with any of a list of agents
and organizations. In order to explore the importance of the different types of linkages and col-
laborations for innovation, we introduced a set of dummies indicating if the firm has established
a link with a scientific organization (scien_link), a vertical link (with consumers or suppliers,
vert_link), a horizontal link (with other producers or groups or associations of producers;
hor_link), a link with a financial organization (fin_link), or a link with a public non-scientific
organization (pub_link).
Table 3 reports a positive and significant link between all these variables and our innovation
proxy variable, with the exception of the variable that shows the link with financial organiza-
tions, which is not significant in all the regressions. The magnitude of the coefficients shows that
the most important link associated with the introduction of innovation activities is with scientific
organizations, followed, respectively, by the horizontal links, vertical links and finally the links
with non-scientific public organizations. It is interesting to note that the importance of these links
varies among farm activities (for instance for oilseed and grain, and beef cattle and sheep). The
horizontal links are more important for beef cattle and sheep than for oilseed and grain. The links
with public organizations are more important for oilseed and grain than for beef cattle and sheep.
In order to explore the role of the education of the farmer7 in the introduction of innovation ac-
tivities we included a dummy that indicates if the farmer is a technician or a professional. This
variable is highly significant for oilseed and grain and the whole sample regressions and has a
positive sign as expected, but it is not significantly different from zero in the case of beef cattle
and sheep production. This different result for oilseed and for grain, and for beef cattle and sheep
7Or manager of the firm in case of partnerships or corporations where is not possible to identify the farmer.

19
probably has to do with the requirement of knowledge to introduce innovation activities in one
sector versus the other, in other words, with the different level of complexities of technologies in
both sectors.
In order to capture the role of the specialization of the firm we include in the regressions a
dummy variable that takes value 1 if the firm is generating the biggest share of its income with
the activity for what it was surveyed. This variable seems to be positively associated to the level
of innovation activities in the case of oilseed and grain, suggesting that specialization is im-
portant for innovation performance in the sector. In the case of beef cattle and sheep the sign is
negative, but note that the specialization of the firm for this industry is also captured by the
dummy variables that are commented in the next paragraph. Therefore the net effect could still
be positive for some subsectors in the beef cattle and sheep industry.
Finally, we included fixed effects to account for heterogeneities across industries when run-
ning the whole sample regression. Note that in addition to the beef cattle and sheep, rice and
dairy dummies (oilseed and grain is the excluded dummy, to avoid collinearity) we included 6
dummy variables distinguishing the beef cattle and sheep industry according to specialization:
cow-calf, finishing, sheep operations, and their interactions. These last 6 dummies where also
included in the beef cattle and sheep regression.
5.2. Productivity equation
Table 4 presents the results of the estimations of the productivity equation. Note that this
equation is basically a modified production function. The productivity is measured as firm sales
per hectare.
Our main variable of interest is the variable innact_ratio_pred, that is the predicted innova-
tion activities ratio from the previous stage. The coefficient of this variable is positive and signif-
icant in all the 4 regressions. The magnitude of the coefficient is similar in the first 3 regressions
20
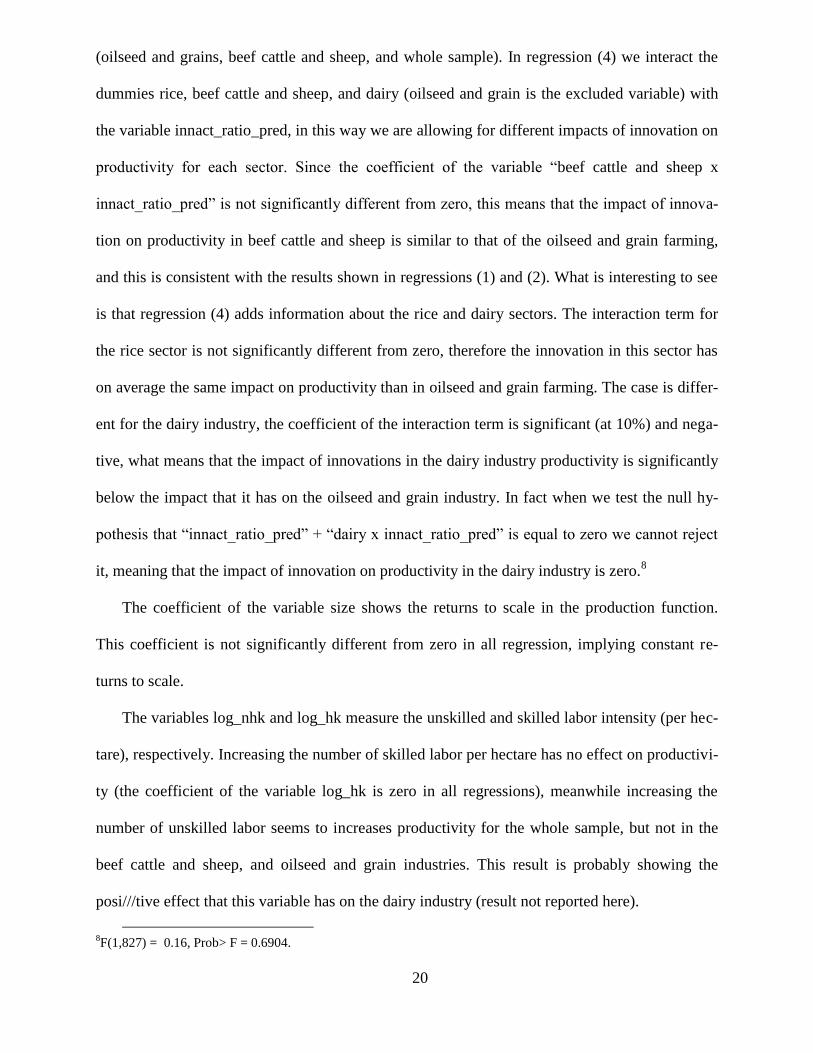
(oilseed and grains, beef cattle and sheep, and whole sample). In regression (4) we interact the
dummies rice, beef cattle and sheep, and dairy (oilseed and grain is the excluded variable) with
the variable innact_ratio_pred, in this way we are allowing for different impacts of innovation on
productivity for each sector. Since the coefficient of the variable “beef cattle and sheep x
innact_ratio_pred” is not significantly different from zero, this means that the impact of innova-
tion on productivity in beef cattle and sheep is similar to that of the oilseed and grain farming,
and this is consistent with the results shown in regressions (1) and (2). What is interesting to see
is that regression (4) adds information about the rice and dairy sectors. The interaction term for
the rice sector is not significantly different from zero, therefore the innovation in this sector has
on average the same impact on productivity than in oilseed and grain farming. The case is differ-
ent for the dairy industry, the coefficient of the interaction term is significant (at 10%) and nega-
tive, what means that the impact of innovations in the dairy industry productivity is significantly
below the impact that it has on the oilseed and grain industry. In fact when we test the null hy-
pothesis that “innact_ratio_pred” + “dairy x innact_ratio_pred” is equal to zero we cannot reject
it, meaning that the impact of innovation on productivity in the dairy industry is zero.8
The coefficient of the variable size shows the returns to scale in the production function.
This coefficient is not significantly different from zero in all regression, implying constant re-
turns to scale.
The variables log_nhk and log_hk measure the unskilled and skilled labor intensity (per hec-
tare), respectively. Increasing the number of skilled labor per hectare has no effect on productivi-
ty (the coefficient of the variable log_hk is zero in all regressions), meanwhile increasing the
number of unskilled labor seems to increases productivity for the whole sample, but not in the
beef cattle and sheep, and oilseed and grain industries. This result is probably showing the
posi///tive effect that this variable has on the dairy industry (result not reported here).
8F(1,827) = 0.16, Prob> F = 0.6904.

21
Table 4. Productivity equation
(1) (2) (3) (4)
VARIABLES Oilseed and grain Beef cattle and sheep Total Total
log_size -0.0451 -0.0279 -0.0577 -0.0586
(0.0682) (0.0555) (0.0437) (0.0443)
log_nhk 1.440 3.804 3.826*** 4.196***
(1.387) (3.306) (1.466) (1.523)
log_hk -16.90* 18.86 -5.233 -4.571
(9.052) (19.08) (9.228) (9.229)
innact_ratio_pred 1.268* 1.124** 1.247*** 2.067***
(0.715) (0.480) (0.387) (0.589)
rice x innact_ratio_pred
-0.0396
(1.285)
beef cattle and sheep x innact_ratio_pred
-0.873
(0.566)
dairy x innact_ratio_pred
-2.620*
(1.480)
mod_suit_land 0.705** 0.658** 0.799*** 0.868***
(0.356) (0.333) (0.229) (0.227)
high_suit_land 0.362 0.309 0.274 0.305*
(0.277) (0.219) (0.175) (0.176)
centre -0.0321 0.0995 0.116 0.136
(0.267) (0.280) (0.160) (0.158)
coastline 0.0944 0.206 0.155 0.157
(0.159) (0.271) (0.145) (0.144)
southeast -0.0499 0.128 -0.0216 -8.13e-05
(0.366) (0.268) (0.154) (0.154)
northwest -0.232 0.00673 -0.136 -0.116
(0.208) (0.274) (0.149) (0.147)
northeast 0.402 0.0735 -0.0744 -0.0576
(0.283) (0.279) (0.167) (0.166)
Industry dummies No No Yes Yes
Beef cattle and sheep activity dummies No Yes No No
Constant 5.483*** 5.416*** 5.432*** 5.004***
(0.376) (0.671) (0.254) (0.317)
Observations 261 441 845 845
R-squared 0.077 0.194 0.464 0.469
Robust standard errors in parentheses
*** p<0.01, ** p<0.05, * p<0.1
The variables mod_suit_land and high_suit_land controls for the quality of the land. The first
one is the proportion of land of medium quality of the farm and the second one the proportion of
land of high quality of the farm. As expected they matter in terms of our measure of productivity.
All regressions control by industry and region. We also ran alternative versions of regres-
sions (3) and (4) including dummy variables distinguishing the beef cattle and sheep farming
22
according to specialization: cow-calf, finishing, sheep operations, and their interactions. The
results are qualitatively similar.
5.3. Innovation and productivity in small farms
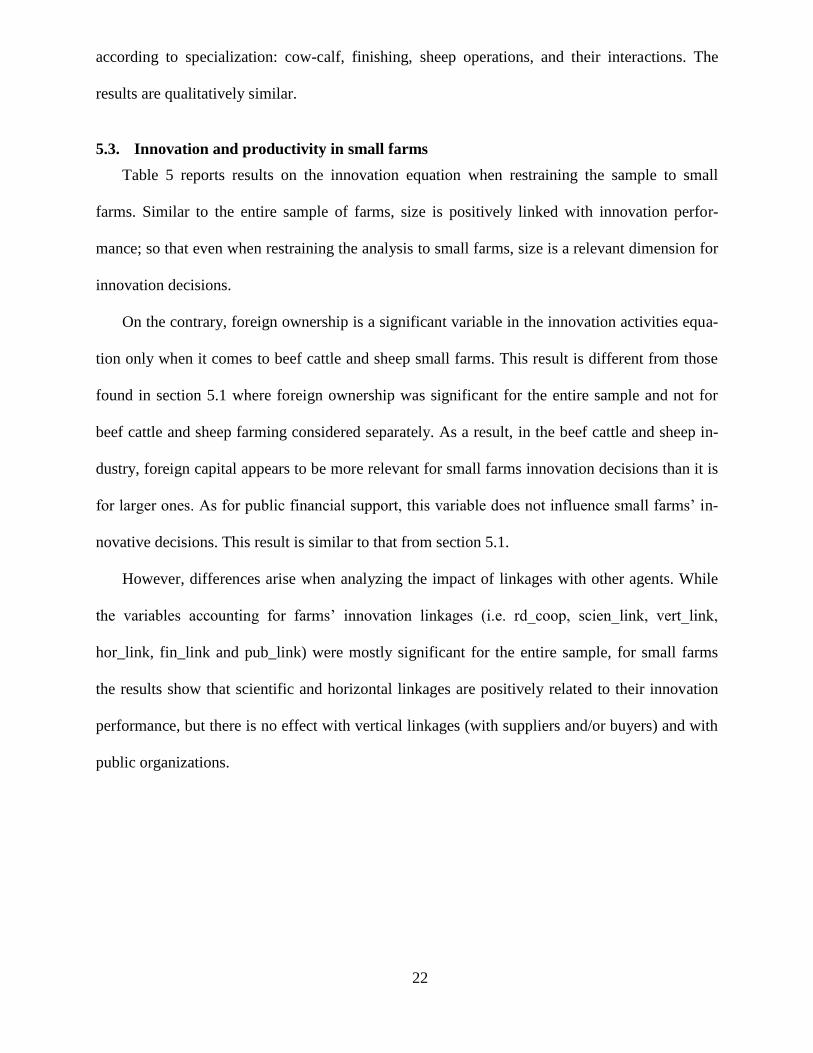
Table 5 reports results on the innovation equation when restraining the sample to small
farms. Similar to the entire sample of farms, size is positively linked with innovation perfor-
mance; so that even when restraining the analysis to small farms, size is a relevant dimension for
innovation decisions.
On the contrary, foreign ownership is a significant variable in the innovation activities equa-
tion only when it comes to beef cattle and sheep small farms. This result is different from those
found in section 5.1 where foreign ownership was significant for the entire sample and not for
beef cattle and sheep farming considered separately. As a result, in the beef cattle and sheep in-
dustry, foreign capital appears to be more relevant for small farms innovation decisions than it is
for larger ones. As for public financial support, this variable does not influence small farms’ in-
novative decisions. This result is similar to that from section 5.1.
However, differences arise when analyzing the impact of linkages with other agents. While
the variables accounting for farms’ innovation linkages (i.e. rd_coop, scien_link, vert_link,
hor_link, fin_link and pub_link) were mostly significant for the entire sample, for small farms
the results show that scientific and horizontal linkages are positively related to their innovation
performance, but there is no effect with vertical linkages (with suppliers and/or buyers) and with
public organizations.
23
Table 5. Innovation activities equation for small farms
(1) (2)
VARIABLES
Beef cattle
and sheep Total
log_size 0.0456*** 0.0582***
(0.0129) (0.00848)
foreign_own 0.0836* 0.0598
(0.0459) (0.0612)
pub_fin 0.0690 0.0470
(0.0470) (0.0447)
rd_coop 0.0653* 0.00979
(0.0356) (0.0247)
scien_link 0.101*** 0.0889***
(0.0262) (0.0194)
vert_link 0.0274 0.0246
(0.0275) (0.0193)
hor_link 0.0919*** 0.0868***
(0.0267) (0.0195)
fin_link -0.0194 -0.00727
(0.0330) (0.0215)
pub_link -0.0216 0.00639
(0.0282) (0.0198)
main_act -0.0578 0.0116
(0.0400) (0.0228)
proftecprod 0.00265 0.0398**
(0.0261) (0.0168)
cow-calf 0.0372 -0.0363
(0.0654) (0.0780)
finishing 0.183*** 0.0959
(0.0617) (0.0770)
sheep -0.0903 -0.168**
(0.0648) (0.0789)
cow-calf and sheep 0.0881 0.155*
(0.0687) (0.0801)
cow-calf and finishing -0.128** -0.0462
(0.0621) (0.0774)
finishing and sheep 0.0155 0.00731
(0.0473) (0.0468)
beef cattle and sheep
-0.0690
(0.0767)
dairy
-0.00460
(0.0308)
rice
-0.00339
(0.0356)
Constant -0.0288 -0.0175
(0.0667) (0.0403)
Observations 145 293
R-squared 0.556 0.477
Robust standard errors in parentheses.
*** p<0.01, ** p<0.05, * p<0.1

24
Although these results are in a way in line with those from the previous section, since the
analysis for the entire sample showed that scientific and horizontal linkages were the most rele-
vant for explaining innovation decisions. Finally, similarly to results shown earlier, the educa-
tional level of the farmer is irrelevant for beef cattle and sheep innovation decisions, while its
effect is positive when considering the four farming activities together.
When looking at the results for the productivity equation in Table 6, conclusions about the
impact of innovation performance on productivity are similar to those obtained in the previous
section, being that the ratio of innovation activities performed by the farm is significant and posi-
tively linked to productivity in any of the three specifications proposed. Additionally, the magni-
tude of the coefficients associated to innact_ratio_pred turns out to be larger in comparison with
the results for the entire sample regression. Therefore, the impact of innovation activities on
productivity seems to be larger for small firms. Also, the interaction term dairy x
innact_ratio_pred in column (3) is significant and negative. This result, which implies that inno-
vation has a smaller impact on productivity in dairy farms than for the entire sector, is similar to
that found for the entire sample.
When considering the effect of size, results are different from those obtained for the entire
sample. In fact, once we restrain the sample to small farms, size has a negative effect on produc-
tivity, so that evidence pointing out to the existence of negative returns to scale among small
farms is found. When it comes to labor intensity, as was found before, skilled labor per hectare
appears to have no effect on productivity; while unskilled labor, that had a positive effect on
productivity when considering the entire sample of farms, turns out to be not significant for ex-
plaining small farms’ productivity. Also differently from what was found in the previous section,
the evidence for small farms shows that land quality has no effect on productivity.

25
Table 6. Productivity equation for small farms
(1) (2) (3)
VARIABLES
Beef cattle
and sheep Total Total
log_size -0.590*** -0.376*** -0.355***
(0.161) (0.131) (0.130)
log_nhk -0.00726 1.557 1.864
(1.976) (1.411) (1.434)
log_hk 12.17 -4.452 -2.884
(20.85) (9.206) (9.456)
innact_ratio_pred 2.865** 2.049** 3.339***
(1.293) (0.805) (1.156)
centre 0.390 0.274 0.209
(0.505) (0.364) (0.354)
coastline 0.355 0.431* 0.355
(0.392) (0.240) (0.240)
southeast 0.491 -0.0493 -0.0602
(0.438) (0.262) (0.269)
northwest 0.427 -0.211 -0.213
(0.465) (0.274) (0.270)
northeast 0.588 -0.0279 -0.0128
(0.493) (0.326) (0.328)
mod_suit_land 0.630 0.555 0.650
(0.753) (0.485) (0.495)
high_suit_land 0.711 0.444 0.482
(0.483) (0.389) (0.388)
Industry dummies No No Yes
Beef cattle and sheep activity dummies No Yes No
Constant 7.362*** 6.305*** 5.731***
(0.632) (0.573) (0.616)
Observations 107 222 222
R-squared 0.401 0.450 0.467
Robust standard errors in parentheses
*** p<0.01, ** p<0.05, * p<0.1
6. CONCLUSIONS
The literature on the links between innovation and productivity at firm level in agriculture is
almost inexistent, probably as a consequence of the unavailability of firm-level innovation sur-
veys. In this paper, we analyzed the factors that are correlated with the innovation effort of farms
and the impact that this innovation effort has on productivity, exploiting a unique farm-level ag-
ricultural innovation survey carry out in Uruguay.

26
We found that the variables that are consistently correlated with the innovation effort are:
farm size, cooperation with other agents to perform R&D, links with scientific organizations and
the existence of horizontal and vertical links. The existence of links with public non-scientific
organizations is also correlated with the innovation effort, but only at 10% confidence in the case
of beef cattle and sheep. The importance of size for innovation effort is a very well-known em-
pirical fact in the case of manufacturing firms that seems to apply as well to agricultural firms
according to the evidence presented here. This implies that public policy must pay special atten-
tion to small firms, since probably these firms have restrictions associated with scale to innovate.
The links with other organizations, and almost with any (except financial ones) and in any form,
is relevant. Since coordination among agents is relevant, and probably there are coordination
failures, there is a role for public policy. The level of education of the owner of the farm is also
positively correlated (except in the case of beef cattle and sheep, where is not significant) with
the innovation effort. This evidence could have implications that go beyond innovation policy,
and in particular, for training and educational policy. The public and private financial support are
not clearly linked with greater innovation effort. Taken at a face value, this could imply that fi-
nancial constraints for innovation were not operating in the sector in the period 2007-2009. The
foreign ownership of the farm is a factor that also seems to be positively correlated with the level
of innovation effort for most subsectors. This evidence is probably pointing to the fact that for-
eign ownership in some subsectors is generating technological (and non-technological) transfers
that are reflected in a greater innovation effort.
When it comes to productivity, innovation effort seems to be clearly generating gains in al-
most all subsectors, with the exception of dairy industry where the impact is null in our estima-
tions.

27
REFERENCES
Aboal, D., & Garda, P. 2012. Technological and Nontechnological Innovation and Productivity
in Services vis a vis Manufacturing in Uruguay: Discussion Paper No. IDB-DP-264.
Inter-American Development Bank.
Alston, J. M., Andersen, M. A., James, J. S., & Pardey, P. G. 2011. The economic returns to US
public agricultural research. American Journal of Agricultural Economics, 93(5): 1257-
1277.
Alston, J. M., Chan-Kang, C., Marra, M. C., Pardey, P. G. and Wyatt, T. 2000. A Meta-Analysis
of Rates of Return to Agricultural R&D: Ex Pede Herculem? Research Report No. 113,
Washington DC: International Food Policy Research Institute.
Becker, W. and Dietz, J. 2004. R&D cooperation and innovation activities of firms: evidence for
the German manufacturing industry. Research Policy Volume 33, Issue 2, March, Pages
209–223.
Bervejillo, J. E., Alston, J. M., & Tumber, K. P. 2012. The benefits from public agricultural
research in Uruguay. Australian Journal of Agricultural and Resource Economics, 56(4):
475-497.
Cohen, W. 2010. Fifty Years of Empirical Studies of Innovative Activity and Performance. In B.
Hall and N. Rosenberg eds. Handbook of Economics of Innovation, ch. 4.
Crepon, B., Duguet, E., &Mairesse, J. 1998. Research, Innovation and Productivity: An Econo-
metric Analysis at the Firm Level. Economics of Innovation and New Technology 7(2):
115-58.
Crespi, G., & Zúñiga, P. 2010. Innovation and Productivity: Evidence from Six Latin American
Countries. IDB Working Paper Series No.IDB-WP-18.
Errea, E., Peyrou, J., Secco, J., & Souto, G. 2011. Transformaciones en el Agro Uruguayo,
Nuevas Instituciones y Modelos de Organización Empresarial. Montevideo: UCUDAL,
Programa de Agronegocios.
EU SCAR (2012). Agricultural knowledge and innovation systems in transition – a reflection
paper. European Union, Brussels.
Griliches, Z. (1957). Hybrid corn: An exploration in the economics of technological change.
Econometrica, Journal of the Econometric Society, 501-522.
Griliches, Z. 1979. Issues in Assessing the Contribution of R&D to Productivity Growth. The
Bell Journal of Economics 10 (Spring 1979), 92-116.
Guadalupe, M, Kuzmina, O. & Thomas, C. 2012. Innovation and Foreign Ownership. American
Economic Review 102(7): 3594-3627.
Hall, B. 2011. Innovation and Productivity, NBER Working Papers 17178.
Hategekimana B., &Trant, M. 2002. Adoption and diffusion of new technology in agriculture:
genetically modified corn and soybeans. Canadian Journal Of Agricultural Economics,
vol. 50, pp. 357-371.
Jaramillo, H., Lugones, G., & Salazar, M. 2001. Standardisation of Indicators of Technological:
Innovation in Latin American and Caribbean Countries, Bogota Manual. Iberoamerican
Network of Science and Technology Indicators. Organisation of American States.
Keller, W. 2010. International Trade, Foreign Direct Investment, and Technology Spillovers. In
B. Hall and N. Rosenberg eds. Handbook of Economics of Innovation, ch. 19.
Khanal, A.R. & Gillespie, J. (2013). Adoption and productivity of breeding technologies: Evi-
dence from US dairy farms. AgBioForum, 16(1), 53-65.
Lopez, F., & Maffioli, A. (2008). Technology Adoption, Productivity and Specialization of Uru-
guayan Breeders: Evidence from an Impact Evaluation. Office of Evaluation and Over-
sight Working Papers OVE/WP-07/08 (Inter-American Development Bank, Washington,
DC, 2008).

28
Mohnen, P., & Hall, B. H. 2013. Innovation and productivity: An update. Eurasian Business
Review, 3.
Mondelli, M. B. Lanzilotta, V. Picasso, G. Ferreira, M. Vairo y P. Cazulo. 2012. Uruguayan
Survey of Agricultural Innovation (2007-2009): Main Results. Study performed by
CINVE for the Uruguayan Research and Innovation Agency (ANII). Studies Serie No. 8.
ANII: Montevideo. [in Spanish]
Nossal, K., & Lim, K. 2011. Innovation and productivity in the Australian grains industry.
Canberra: Research report 11.06. ABARES.
Sunding, D., & Zilberman, D. 2001. The agricultural innovation process: research and
technology adoption in a changing agricultural sector. Handbook of agricultural
economics, 1: 207-261.
Syverson, C. 2011. What Determines Productivity? Journal of Economic Literature, 49(2): 326-
365.
29
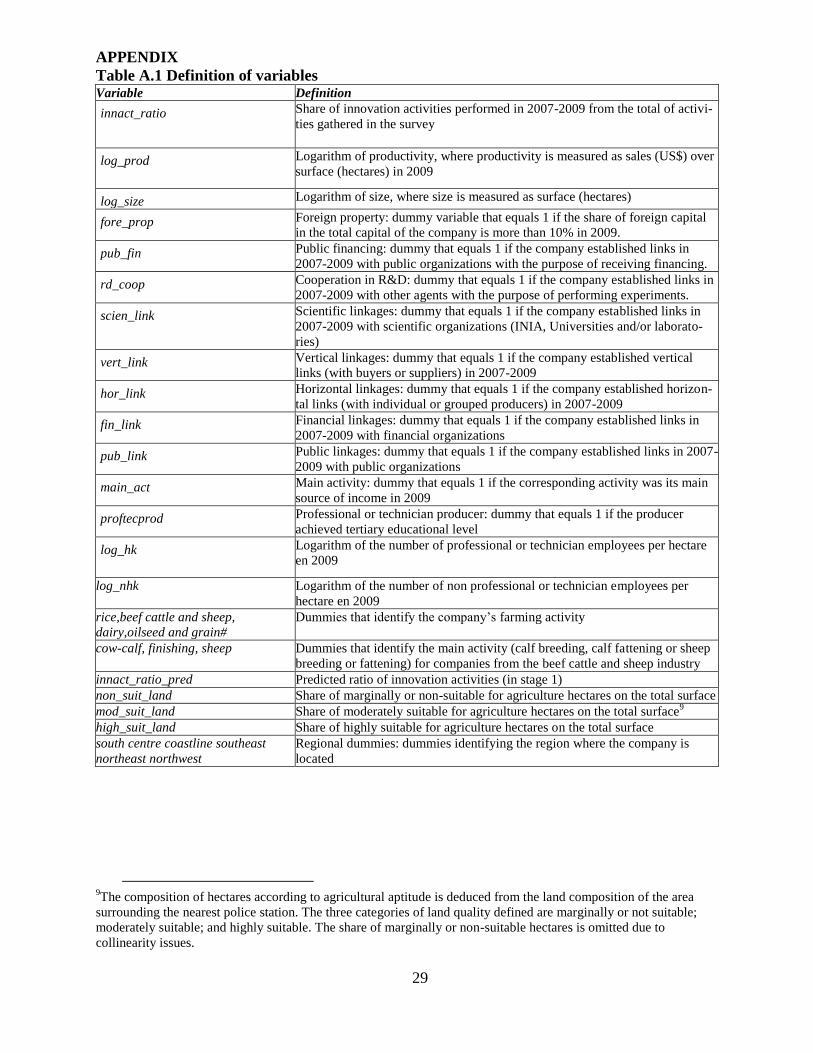
APPENDIX
Table A.1 Definition of variables Variable Definition
innact_ratio
Share of innovation activities performed in 2007-2009 from the total of activi-
ties gathered in the survey
log_prod
Logarithm of productivity, where productivity is measured as sales (US$) over
surface (hectares) in 2009
log_size
Logarithm of size, where size is measured as surface (hectares)
fore_prop
Foreign property: dummy variable that equals 1 if the share of foreign capital
in the total capital of the company is more than 10% in 2009.
pub_fin
Public financing: dummy that equals 1 if the company established links in
2007-2009 with public organizations with the purpose of receiving financing.
rd_coop
Cooperation in R&D: dummy that equals 1 if the company established links in
2007-2009 with other agents with the purpose of performing experiments.
scien_link
Scientific linkages: dummy that equals 1 if the company established links in
2007-2009 with scientific organizations (INIA, Universities and/or laborato-
ries)
vert_link
Vertical linkages: dummy that equals 1 if the company established vertical
links (with buyers or suppliers) in 2007-2009
hor_link
Horizontal linkages: dummy that equals 1 if the company established horizon-
tal links (with individual or grouped producers) in 2007-2009
fin_link
Financial linkages: dummy that equals 1 if the company established links in
2007-2009 with financial organizations
pub_link
Public linkages: dummy that equals 1 if the company established links in 2007-
2009 with public organizations
main_act
Main activity: dummy that equals 1 if the corresponding activity was its main
source of income in 2009
proftecprod
Professional or technician producer: dummy that equals 1 if the producer
achieved tertiary educational level
log_hk
Logarithm of the number of professional or technician employees per hectare
en 2009
log_nhk Logarithm of the number of non professional or technician employees per
hectare en 2009
rice,beef cattle and sheep,
dairy,oilseed and grain#
Dummies that identify the company’s farming activity
cow-calf, finishing, sheep Dummies that identify the main activity (calf breeding, calf fattening or sheep
breeding or fattening) for companies from the beef cattle and sheep industry
innact_ratio_pred Predicted ratio of innovation activities (in stage 1)
non_suit_land Share of marginally or non-suitable for agriculture hectares on the total surface
mod_suit_land Share of moderately suitable for agriculture hectares on the total surface9
high_suit_land Share of highly suitable for agriculture hectares on the total surface
south centre coastline southeast
northeast northwest
Regional dummies: dummies identifying the region where the company is
located
9The composition of hectares according to agricultural aptitude is deduced from the land composition of the area
surrounding the nearest police station. The three categories of land quality defined are marginally or not suitable;
moderately suitable; and highly suitable. The share of marginally or non-suitable hectares is omitted due to
collinearity issues.

30
Table A.2. Descriptive statistics for variables used in the estimation. Total sample
Variable Obs Mean Std. Dev. Min Max
innact_ratio 1258 0.503 0.190 0.000 1.000
log_prod 1103 5.485 1.262 1.522 11.312
log_size 1253 6.549 1.481 0.693 11.364
fore_prop 1246 0.045 0.207 0.000 1.000
pub_fin 1251 0.031 0.174 0.000 1.000
rd_coop 1258 0.267 0.443 0.000 1.000
scien_link 1258 0.613 0.487 0.000 1.000
vert_link 1258 0.632 0.482 0.000 1.000
hor_link 1258 0.774 0.418 0.000 1.000
fin_link 1258 0.316 0.465 0.000 1.000
pub_link 1258 0.332 0.471 0.000 1.000
main_act 1258 0.840 0.367 0.000 1.000
proftecprod 1258 0.763 0.425 0.000 1.000
rice 1258 0.069 0.254 0.000 1.000
beef cattle and sheep 1258 0.520 0.500 0.000 1.000
dairy 1258 0.135 0.342 0.000 1.000
oilseed and grain 1258 0.276 0.447 0.000 1.000
cow-calf 1258 0.444 0.497 0.000 1.000
finishing 1258 0.423 0.494 0.000 1.000
sheep 1258 0.328 0.470 0.000 1.000
log_nhk 1219 0.013 0.031 -0.004 0.519
log_hk 1253 0.002 0.006 0.000 0.065
south 1249 0.108 0.311 0.000 1.000
centre 1249 0.144 0.351 0.000 1.000
coastline 1249 0.274 0.446 0.000 1.000
southeast 1249 0.118 0.322 0.000 1.000
northeast 1249 0.114 0.319 0.000 1.000
northwest 1249 0.242 0.428 0.000 1.000
non_suit_land 997 0.553 0.205 0.188 1.000
mod_suit_land 997 0.156 0.141 0.000 0.809
high_suit_land 997 0.291 0.187 0.000 0.770

31
Table A.3. Descriptive statistics for variables used in the estimation. Rice farms
Variable Obs Mean Std. Dev. Min Max
innact_ratio 87 0.535 0.158 0.125 0.833
log_prod 77 7.374 0.673 5.282 9.027
log_size 87 5.805 0.919 3.807 8.243
fore_prop 87 0.034 0.184 0.000 1.000
pub_fin 87 0.011 0.107 0.000 1.000
rd_coop 87 0.494 0.503 0.000 1.000
scien_link 87 0.805 0.399 0.000 1.000
vert_link 87 0.782 0.416 0.000 1.000
hor_link 87 0.897 0.306 0.000 1.000
fin_link 87 0.575 0.497 0.000 1.000
pub_link 87 0.368 0.485 0.000 1.000
main_act 87 0.943 0.234 0.000 1.000
proftecprod 87 0.816 0.390 0.000 1.000
log_nhk 87 0.021 0.020 0.000 0.164
log_hk 87 0.008 0.008 0.000 0.036
south 87 0.000 0.000 0.000 0.000
centre 87 0.000 0.000 0.000 0.000
coastline 87 0.000 0.000 0.000 0.000
southeast 87 0.310 0.465 0.000 1.000
northeast 87 0.425 0.497 0.000 1.000
northwest 87 0.264 0.444 0.000 1.000
non_suit_land 51 0.576 0.195 0.225 1.000
mod_suit_land 51 0.082 0.110 0.000 0.490
high_suit_land 51 0.342 0.227 0.000 0.775
32
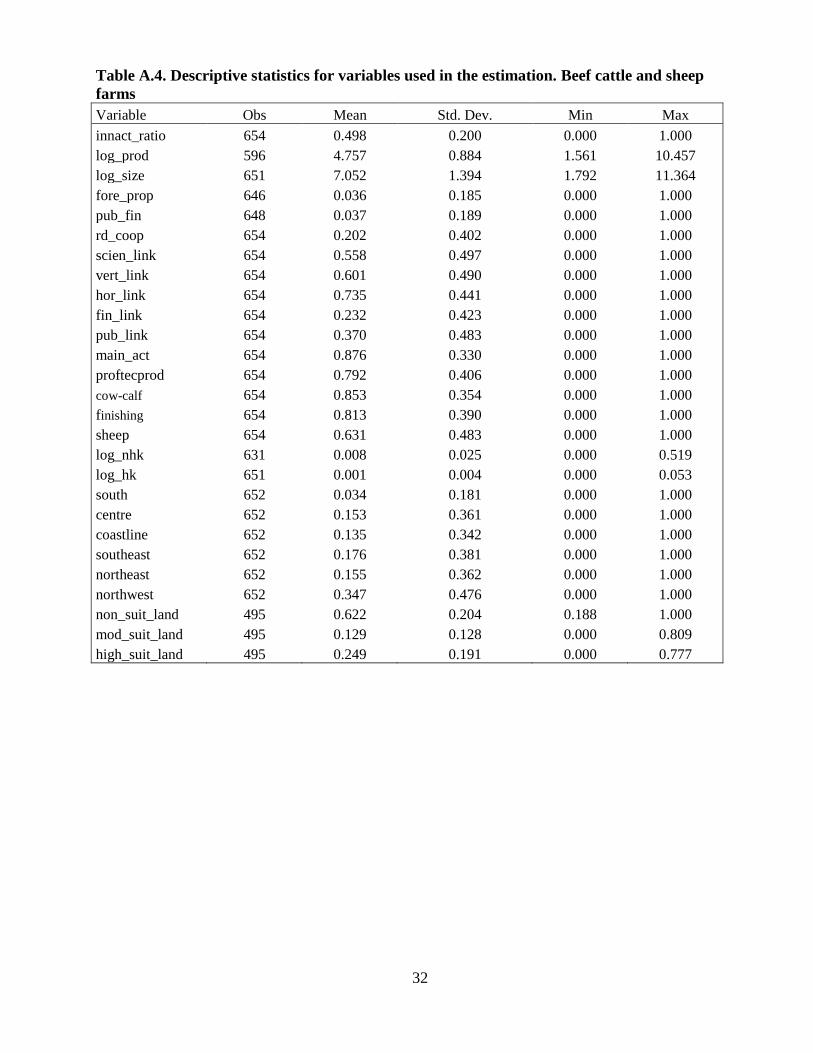
Table A.4. Descriptive statistics for variables used in the estimation. Beef cattle and sheep
farms
Variable Obs Mean Std. Dev. Min Max
innact_ratio 654 0.498 0.200 0.000 1.000
log_prod 596 4.757 0.884 1.561 10.457
log_size 651 7.052 1.394 1.792 11.364
fore_prop 646 0.036 0.185 0.000 1.000
pub_fin 648 0.037 0.189 0.000 1.000
rd_coop 654 0.202 0.402 0.000 1.000
scien_link 654 0.558 0.497 0.000 1.000
vert_link 654 0.601 0.490 0.000 1.000
hor_link 654 0.735 0.441 0.000 1.000
fin_link 654 0.232 0.423 0.000 1.000
pub_link 654 0.370 0.483 0.000 1.000
main_act 654 0.876 0.330 0.000 1.000
proftecprod 654 0.792 0.406 0.000 1.000
cow-calf 654 0.853 0.354 0.000 1.000
finishing 654 0.813 0.390 0.000 1.000
sheep 654 0.631 0.483 0.000 1.000
log_nhk 631 0.008 0.025 0.000 0.519
log_hk 651 0.001 0.004 0.000 0.053
south 652 0.034 0.181 0.000 1.000
centre 652 0.153 0.361 0.000 1.000
coastline 652 0.135 0.342 0.000 1.000
southeast 652 0.176 0.381 0.000 1.000
northeast 652 0.155 0.362 0.000 1.000
northwest 652 0.347 0.476 0.000 1.000
non_suit_land 495 0.622 0.204 0.188 1.000
mod_suit_land 495 0.129 0.128 0.000 0.809
high_suit_land 495 0.249 0.191 0.000 0.777
33
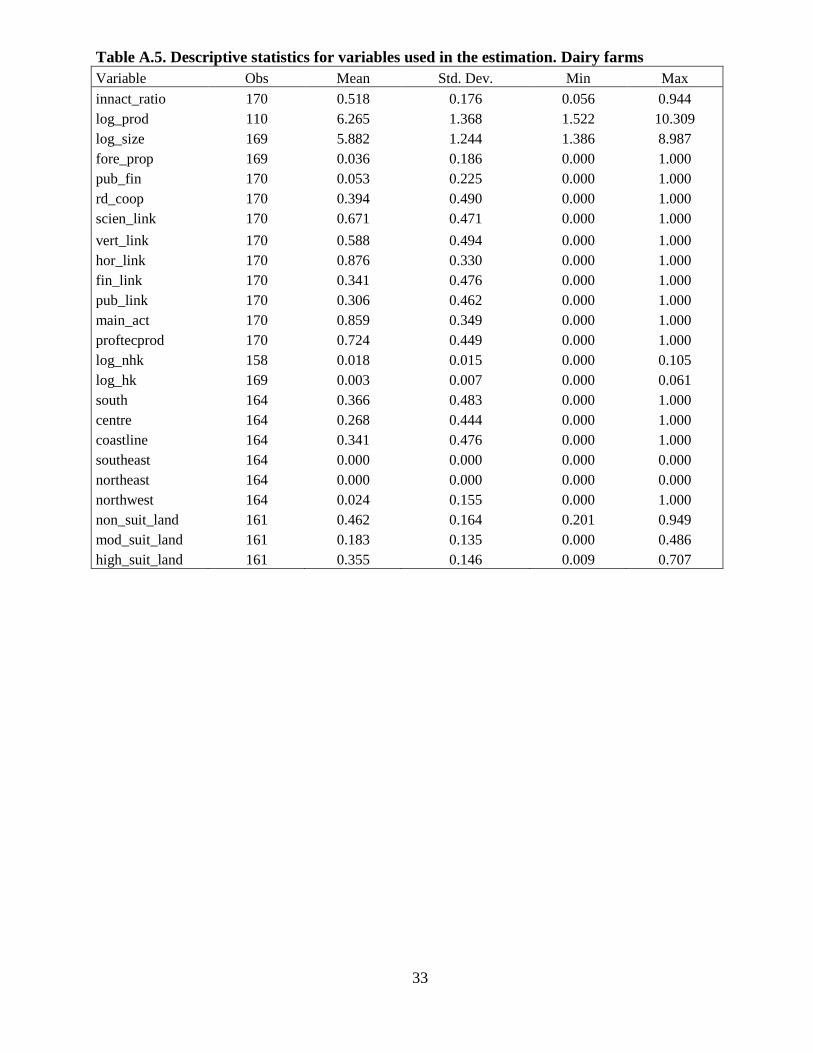
Table A.5. Descriptive statistics for variables used in the estimation. Dairy farms
Variable Obs Mean Std. Dev. Min Max
innact_ratio 170 0.518 0.176 0.056 0.944
log_prod 110 6.265 1.368 1.522 10.309
log_size 169 5.882 1.244 1.386 8.987
fore_prop 169 0.036 0.186 0.000 1.000
pub_fin 170 0.053 0.225 0.000 1.000
rd_coop 170 0.394 0.490 0.000 1.000
scien_link 170 0.671 0.471 0.000 1.000
vert_link 170 0.588 0.494 0.000 1.000
hor_link 170 0.876 0.330 0.000 1.000
fin_link 170 0.341 0.476 0.000 1.000
pub_link 170 0.306 0.462 0.000 1.000
main_act 170 0.859 0.349 0.000 1.000
proftecprod 170 0.724 0.449 0.000 1.000
log_nhk 158 0.018 0.015 0.000 0.105
log_hk 169 0.003 0.007 0.000 0.061
south 164 0.366 0.483 0.000 1.000
centre 164 0.268 0.444 0.000 1.000
coastline 164 0.341 0.476 0.000 1.000
southeast 164 0.000 0.000 0.000 0.000
northeast 164 0.000 0.000 0.000 0.000
northwest 164 0.024 0.155 0.000 1.000
non_suit_land 161 0.462 0.164 0.201 0.949
mod_suit_land 161 0.183 0.135 0.000 0.486
high_suit_land 161 0.355 0.146 0.009 0.707
34
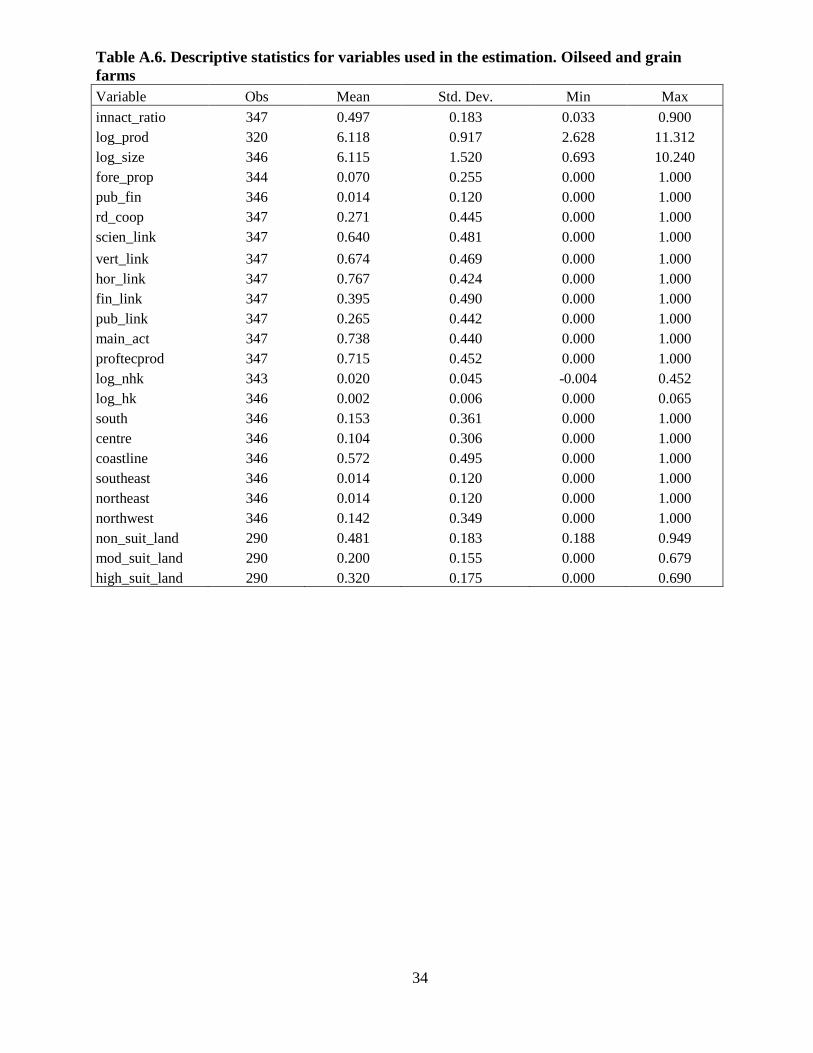
Table A.6. Descriptive statistics for variables used in the estimation. Oilseed and grain
farms
Variable Obs Mean Std. Dev. Min Max
innact_ratio 347 0.497 0.183 0.033 0.900
log_prod 320 6.118 0.917 2.628 11.312
log_size 346 6.115 1.520 0.693 10.240
fore_prop 344 0.070 0.255 0.000 1.000
pub_fin 346 0.014 0.120 0.000 1.000
rd_coop 347 0.271 0.445 0.000 1.000
scien_link 347 0.640 0.481 0.000 1.000
vert_link 347 0.674 0.469 0.000 1.000
hor_link 347 0.767 0.424 0.000 1.000
fin_link 347 0.395 0.490 0.000 1.000
pub_link 347 0.265 0.442 0.000 1.000
main_act 347 0.738 0.440 0.000 1.000
proftecprod 347 0.715 0.452 0.000 1.000
log_nhk 343 0.020 0.045 -0.004 0.452
log_hk 346 0.002 0.006 0.000 0.065
south 346 0.153 0.361 0.000 1.000
centre 346 0.104 0.306 0.000 1.000
coastline 346 0.572 0.495 0.000 1.000
southeast 346 0.014 0.120 0.000 1.000
northeast 346 0.014 0.120 0.000 1.000
northwest 346 0.142 0.349 0.000 1.000
non_suit_land 290 0.481 0.183 0.188 0.949
mod_suit_land 290 0.200 0.155 0.000 0.679
high_suit_land 290 0.320 0.175 0.000 0.690

![Lecture 1, introduction; history, role, classification, alignment & survey1 .pptx [read-only]](https://img.pdfslide.net/doc/110x75/55890d55d8b42aaf488b4690/lecture-1-introduction-history-role-classification-alignment-survey1-pptx-read-only.jpg)