1
Performed experiment - Following modifications are performed with the model during the experiment: Day 0: Patient in normal condition. Day 1: Renal mass is reduced to 0.3 of norm by setting REK= 0.3. Day 3: The salt intake is increased to five times normal by setting NID=0.5. Total time of the experiment was 8 days. Teaching example: Hypertension in a salt loaded, renal deficient patient Thirty six years ago, A.C. Guyton et al. published a large model concer- ned with physiological regulation of circulation. The description of the model was published in a form of a graphic schematic diagram. We decided to revi- ve the old model by means of a modern software simulation tool – Simulink. Simulink diagrams are very similar to the old Guyton‘s notation used in the original model. We tried to keep the resemblance to the original Guyton‘s pic- torial diagram – the layout, the disposition of wires and the variables are the same. However, contrary to the old system analysis diagram, the new one is also a functional simulation model by itself, giving the user a possibility to stu- dy behavior of all the variables in real time. Furthermore, obvious and less obvious errors and omissions in the original scheme were corrected in the new Simulink implementation (it can be downloaded from www.physiome.cz/ guyton). We use Simulink implementation of Guyton‘s model to teach under- graduate and postgraduate students physiology at Czech Technical Universi- ty. However, the structure of Simulink diagram is too abstract for medical stu- dents. For the medical students, it is better to have the simulation model out- puts in the form of schematic pictures, which they are accustomed to from textbooks of physiology. This led us to the development of an interactive mul- Variables Monitored VEC extracellular fluid volume (liters) VB blood volume (liters) AU sympathetic stimulation (ratio to normal) QLO cardiac output (liters/min) RTP total peripheral resistance (mm Hg/liters/min) General Observations The initial decrease in renal mass had only a slight effect on variables monitored with the exception of a slight decrease in cardiac output and simultaneous increase in total peripheral resistance. The arterial pressure was elevated by only a small amount. However, increasing the salt load afterwards had a more dramatic effect. The extracellular volume and blood volume rose, the cardiac output increased considerably and then stabilized, while the total peripheral resistance fell. Initially, the rise in cardiac output with unchanged peripheral resistance increased the arterial pressure. After 120 hours, the cardiac output stabilized, while the peripheral resistance continued to rise. The arterial pressure continued to increase, demonstrating that the increase in total peripheral resistance, not cardiac output, was responsible for the longer-term increases in arterial pressure. timedia web-based educational application - web-based Atlas of Physiology and Pathophysiology (www.physiome.cz/atlas). The intention of the authors is to use the full potential of computer aided teaching - not only by use of interactive ani- mations during e-learning lectures, but also by use of simulation games based on physiological models (www.physiome.cz/atlas/info/00EN/index.htm). These games can effectively accompany the both classical and web-based lectures. The Atlas is created as a joined work of a creative multidisciplinary team of pro- fessionals of various fields – physiologists, programmers, system engineers and artists. Our Atlas of Physiology and Pathophysiology is an open and free accessible application. All educational texts, interactive animation and simulation models are freely available online. The source code and some of the development tools that we have created for the ease of the process are also available, especially for a potential future co-operation. Guyton’s legendary article has started the whole concept of inte- grative physiology, graphical depiction of the structure of physiological regulation relationships and building of interconnected large-scale models of physiological subsystems. With new technological possibilities, his legacy is now more topical then ever. From Guyton‘s graphic diagram to multimedia simulators for teaching physiology Laboratory of Biocybernetics, Dept. of Pathophysiology, 1st Faculty of Medicine, Charles University in Prague & Creative Connections Ltd F ( Jiří Kofránek, Jan Rusz, Marek Mateják Annu. Rev. Physiol. 1972.34:13-44. Downloaded from arjournals.annualreviews.org by Dr. Jiri Kofranek on 07/15/06. For personal use only. NON-MUSCLE OXYGEN DELIVERY 269 268 261 270 262 263 264 272 265 266 267 257 256 255 POV OSV POT RDO MO 2 DOB QO 2 POT P1O P4O 02 M AOM 271 NON-MUSCLE LOCAL BLOOD FLOW CONTROL if (POD <0) then {POJ =PODx 3.3} 278 277 276 275 274 273 285 282 281 280 279 290 284 283 284 b 286 287 288 289 AR1 AK1 POB POK POD POV ARM AR1 AR3 PON POA A2K AR2 POJ POZ POC A3K AR3 POR VASCULAR STRESS RELAXATION 65 64 63 62 61 VV 7 VV 7 VV 1 VV 2 VVE SRK VV 6 195 196 197 198 199 200 201 202 203 205 206 207 208 209 210 211 212 213 214 215 216 217 218 219 220 221 222 KIDNEY DYNAMICS AND EXCRETION THIRST AND DRINKING 192 193 194 190 191 Z10 Z11 STH TVD POT ANTIDIURECTIC HORMONE CONTROL 181 180 179 178 177 175 176 182 183 184 185 158 A 186 187 188 189 AHM AH4 AH2 AH1 AHC AH CNZ CNB CNR CNA PRA AHZ AH7 AHY AH8 AU=AUP CIRCULATORY DYNAMICS VIM AUM AUM VIM AUM BFN 1 2 3 4 36 35 31 32 33 PGS RSM 38 34 37 RVS 43 42 41 A 41 40 39 VBD VVE 5 6 7 8 9 DAS QAO 30 QLO LVM HPL HMD 29 59 58 28 50 16 PA2 60 PLA 24 25 26 27 VVS QLO AUH HMD QRO QRO AUH VPE PPA PL 1 PPA RPV RPT RPT PP 1 54 53 55 56 57 52 51 23 22 21 20 19 18 48 49 46 45 47 44 10 11 12 13 14 15 LVM CAPILLARY MEMBRANE DYNAMICS 66 67 68 69 70 71 74 73 62 61 80 79 78 77 75 74 72 RVS BFN PVG PVS VB VP VRC PTC PPC PIF CFC VPD VUD DFP TVD VP CPK CPI CP 1 CPP CPP PRP VP CPR LPK DLP PPD DP 0 DPL DPC DPC ANGIOTENSIN CONTROL 154 155 156 157 158 159 160 161 162 163 153 b 153 a CNA CNE ANN AN1=ANP ANT ANC AN2 AN3 AN5 ANM REK RFN TISSUE FLUIDS , PRESSURES AND GEL 105 PTC 108 107 106 109 104 110 103 102 112 113 98 97 96 99 92 91 90 89 93 94 95 100 101 86 85 84 83 87 88 111 DPL VTL CPI PIF PLD PTT GP1 GPD GPR VG VIF PTS PIF GPD DPL VTC VTL VID VTS VTD PTT DPI VIF IFP GP2 VGD VG V2D PG2 PGC PTC PIF PIF PTS PRM CHY HYL VG PGR PGP PGH ALDOSTERONE CONTROL 165 166 167 164 168 169 171 172 173 174 AM AM 5 AM 3 AM 2 AMC AMT AM 1 AMP KN1 CKE CNA ANM AMR ELECTROLYTES AND CELL WATER 114 115 116 117 118 119 120 121 126 125 122 123 124 127 128 129 130 131 135 134 133 132 CKI CCD CNA VIC VID VIC KI KCD KIE KIR KE1 AM CKE KE KED KCD KID KOD REK NED NAE CNA VTW VIC STH NID VP VPF VTS HEART HYPERTROPHY OR DETERIORATION 340 341 342 343 344 349 348 347 346 345 350 351 352 PA PPA 4 HPL HPR PP 3 PPA HSL HSR POT DHM HMD RED CELLS AND VISCOSITY 329 330 331 332 333 334 335 337 338 339 POT PO 1 POY PO 2 RC1 RCD VRC RKC RC2 VRC VB HM VIE VIM PULMONARY DYNAMICS AND FLUIDS PLA 136 137 138 139 140 141 142 143 144 145 152 146 147 148 149 150 151 PPA PCP PPC POS PPI CPF PFI PLF DFP VPF PPI PLF PLF PPO POS CPN VPF PPR PPD PPN PPC CPP AUTONOMIC CONTROL 292 291 294 293 296 297 298 295 307 303 302 301 305 304 308 309 310 311 312 313 315 314 316 317 318 319 320 POQ POT PA EXE POQ P2O Z12 EXC AUC PA1 A1B AUB AUN AU8 AUK AU2 AU6 DAU Z8 AUJ AUL VV 9 VVR AUH AUM AVE AUY AUD AUV AU9 AU HEART RATE AND STROKE VOLUME 328 327 323 322 321 324 325 326 SVO QLO HR PRA AUR HMD MUSCLE BLOOD FLOW CONTROL AND PO2 227 226 225 224 223 228 229 230 231 232 233 234 235 238 236 237 239 240 241 242 243 244 245 246 247 248 249 250 251 252 253 254 OSA OVA BFM RMO BFM PK 1 PK 2 DVS PVO PMO PM 5 RMO QOM PMO PM 3 PK 3 PM 4 P2O P3O EXC AOM 02 A AU AMM POE POM PDO PVO POV POT ARM OVA P2O AOM AMM AMM VVE VV 7 VUD RBF RFN NOD AU VVR AUH AUM AVE SVO HM BFN VPF HM OVA REK CNE AUM AHM AM AHM PA NOD DPC AUZ ARM VIM AUM ANM AVE RBF PC VVR VV 7 AUH HMD HSR HPR STH TVD VTL AHM ANM CNE AM VID CKE CNA VTW PC VB VP DPC CPP VTC VTL DPL PTC CPI VTS PIF HPR HPL HMD VIM HM VRC VPF BFN BFM RVS PVS PRA QLO PLA PPA PA HSL PPC VTC PC GP3 APD AAR-afferent arteriolar resistance [torr/l/min] AHM-antidiuretic hormone multiplier , ratio of normal effect AM-aldosterone multiplier , ratio of normal effect AMC-aldosterone concentration AMM-muscle vascular constriction caused by local tissue control , ratio to resting state AMP-effect of arterial pressure on rate of aldosterone secretion AMR-effect of sodium to potassium ratio on aldosterone secretion rate AMT-time constant of aldosterone accumulation and destruction ANC-angiotensin concentration ANM-angiotensin multiplier effect on vascular resistance , ratio to normal ANN-effect of sodium concentration on rate of angiotensin formation ANP-effect of renal blood flow on angiotensin formation ANT-time constant of angiotensin accumulation and destruction ANU-nonrenal effect of angiotensin AOM-autonomic effect on tissue oxygen utilization APD-afferent arteriolar pressure drop [torr] ARF-intensity of sympathetic effects on renal function ARM-vasoconstrictor effect of all types of autoregulation AR1-vasoconstrictor effect of rapid autoregulation AR2-vasoconstrictor effects of intermediate autoregulation AR3-vasoconstrictor effect of long -term autoregulation AU-overall activity of autonomic system , ratio to normal AUB-effect of baroreceptors on autoregulation AUC-effect of chemoreceptors on autonomic stimulation AUH-autonomic stimulation of heart , ratio to normal DLP-rate of formation of plasma protein by liver [g/min] DOB-rate of oxygen delivery to non -muscle cells [ml O2/min] DPA-rate of increase in pulmonary volume [l/min] DPC-rate of loss of plasma proteins through systemic capillaries [g/min] DPI-rate of change of protein in free interstitial fluid [g/min] DPL-rate of systemic lymphatic return of protein [g/min] DPO -rate of loss of plasma protein [g/min] DRA-rate of increase in right atrial volume [l/min] DVS-rate of increase in venous vascular volume [l/min] EVR-postglomerular resistance [torr/l] EXC-exercise activity , ratio to activity at rest EXE-exercise effect on autonomic stimulation GFN-glomerular filtration rate of undamaged kidney [l/min] GFR-glomerular filtration rate [l/min] GLP-glomerular pressure [torr ] GPD-rate of increase of protein in gel [l/min] GPR-total protein in gel [g] HM-hematocrit [%] HMD-cardiac depressant effect of hypoxia HPL-hypertrophy effect on left ventricle HPR-hypertrophy effect on heart , ratio to normal HR-heart rate [beats/min] HSL-basic strengh of left ventricle , ratio to normal HSR-basic strength of right ventricle , ratio to normal HYL-quantity of hyaluronic acid in tissues [g] IFP-interstitial fluid protein [g] KCD-rate of change of potassium concentration [mmol/min] KE-total extracellular fluid potassium [mmol] KED-rate of change of extracellular fluid potassium concentration [mmol/min] KI-total intracellular potassium concentration [mmol/l] KID-rate of potassium intake [mmol/min] KOD-rate of renal loss of potassium [mmol/min] LVM-effect of aortic pressure on left ventricular output MMO-rate of oxygen utilization by muscle cells [ml/min] M02--rate of oxygen utilization by non -muscle cells [ml/min] NAE-total extracellular sodium [mmol] NED-rate of change of sodium in intracellular fluids [mmol/min] NID-rate of sodium intake [mmol/min] NOD-rate of renal excretion of sodium [mmol/min] OMM-muscle oxygen utilization at rest [ml/min] OSA-aortic oxygen saturation OSV-non-muscle venous oxygen saturation OVA-oxygen volume in aortic blood [ml O2/l blood] OVS-muscle venous oxygen saturation O2M-basic oxygen utilization in non -muscle body tissues [ml/min] PA-aortic pressure [torr] PAM-effect of arterial pressure in distending arteries , ratio to normal PC-capillary pressure [torr] PCD-net pressure gradient across capillary membrane [torr] POP-pulmonary capillary pressure [torr] PDO-difference between muscle venous oxygen PO 2 and normal venous oxygen PO 2 [torr] PFI-rate of transfer of fluid across pulmonary capillaries [l/min] PFL-renal filtration pressure [torr] PGC-colloid osmotic pressure of tissue gel [torr] PGH-absorbency effect of gel caused by recoil of gel reticulum [torr] PGL-pressure gradient in lungs [torr] PGP-colloid osmotic pressure of tissue gel caused by entrapped protein [torr] PGR-colloid osmotic pressure of interstitial gel caused by Donnan equilibrium [torr] PIF-interstitial fluid pressure [torr] PLA-left atrial pressure [torr] PLD-pressure gradient to cause lymphatic flow [torr] PLF-pulmonary lymphatic flow [torr] PMO-muscle cell PO 2 [torr] POD-non-muscle venous PO 2 minus normal value [torr] POK-sensitivity of rapid system of autoregulation PON-sensitivity of intermediate autoregulation POS-pulmonary interstitial fluid colloid osmotic pressure [torr] POT-non-muscle cell PO 2 [torr] POV-non-muscle venous PO 2 [torr] POY-sensitivity of red cell production POZ-sensitivity of long -term autoregulation PO2-oxygen deficit factor causing red cell production PPA-pulmonary arterial pressure [torr] PPC-plasma colloid osmotic pressure [torr] PPD-rate of change of protein in pulmonary fluids PPI-pulmonary interstitial fluid pressure [torr] PPN-rate of pulmonary capillary protein loss [g/min] PPO-pulmonary lymph protein flow [g/min] PPR-total protein in pulmonary fluids [g] PRA-right atrial pressure [torr] PRM-pressure caused by compression of interstitial fluid gel reticulum [torr] PRP-total plasma protein [g] PTC-interstitial fluid colloid osmotic pressure [torr] PTS-solid tissue pressure [torr] PTT -total tissue pressure [torr] PGV-pressure from veins to right atrium [torr] PVG-venous pressure gradient [torr] PVO-muscle venous PO 2 [torr] PVS-average venous pressure [torr] QAO-blood flow in the systemic arterial system [l/min] QLN-basic left ventricular output [l/min] QLO-output of left ventricle [l/min] QOM-total volume of oxygen in muscle cells [ml] QO2-non-muscle total cellular oxygen [ml] QPO-rate of blood flow into pulmonary veins and left atrium [l/min] QRF-feedback effect of left ventricular function on right ventricular function QRN-basic right ventricular output [l/min] QRO-actual right ventricular output [l/min] QVO -rate of blood flow from veins into right atrium [l/min] RAM-basic vascular resistance of muscles [torr/l/min] RAR-basic resistance of non -muscular and non -renal arteries [torr/l/min] RBF-renal blood flow [l/min] RC1-red cell production rate [l/min] RC2-red cell destruction rate [l/min] RCD-rate of change of red cell mass [l/min] REK-percent of normal renal function RFN-renal blood flow if kidney is not damaged [l/min] RKC-rate factor for red cell destruction RM0-rate of oxygen transport to muscle cells [ml/min] RPA-pulmonary arterial resistance [torr /l/min] RPT-pulmonary vascular resistance [torr/l/min] RPV-pulmonary venous resistance [torr/l/min] RR-renal resistance [torr/l/min] RSM-vascular resistance in muscles [torr/l] RSN-vascular resistance in non -muscle, n/minon-renal tissues [torr/l/min] RVG -resistance from veins to right atrium [torr/l/min] RVM-depressing effect on right ventricle of pulmonary arterial pressure RVS-venous resistance [torr/l/min] SR-intensity factor for stress relaxation SRK-time constant for stress relaxation STH-effect of tissue hypoxia on salt and water intake SVO-stroke volume output [l] TRR-tubular reabsorption rate [l/min] TVD -rate of drinking [l/min] VAS-volume in systemic arteries [l] VB-blood volume [l] VEC-extracellular fluid volume [l] VG -volume of interstitial fluid gel [l] VGD -rate of change of tissue gel volumes [l/min] VIB-blood viscosity, ratio to that of water VIC-cell volume [l] VID-rate of fluid transfer between interstitial fluid and cells [l/min] VIE-portion of blood viscosity caused by red blood cells VIF-volume of free interstitial fluid [l] VIM-blood viscosity (ratio to normal blood ) VLA-volume in left atrium [l] VP-plasma volume [l] VPA-volume in pulmonary arteries [l] VPD-rate of change of plasma volume [l] VPF-pulmonary free fluid volume [l] VRA-right atrial volume [l] VTC -rate of fluid transfer across systemic capillary membranes [l/min] VTD -rate of volume change in total interstitial fluid [l/min] VTL-rate of systemic lymph flow [l/min] VTW -total body water [l] VUD-rate of urinary output [l/min] VV 7-increased vascular volume caused by stress relaxation [l] VVR -diminished vascular volume caused by sympathetic stimulation [l] VVS -venous vascular volume [l] Z8-time constant of autonomic response AUK-time constant of baroreceptor adaptation AUL-sensitivity of sympathetic control of vascular capacitance AUM-sympathetic vasoconstrictor effect on arteries AUN-effect of CNS ischemic reflex on auto -regulation AUV-sensitivity control of autonomies on heart function AUY-sensitivity of sympathetic control of veins AUZ-overall sensitivity of autonomic control AVE-sympathetic vasoconstrictor effect on veins AlK-time constant of rapid autoregulation A2K-time constant of intermediate autoregulation A3K-time constant of long -term autoregulation A4K-time constant for muscle local vascular response to metabolic activity BFM-muscle blood flow [l/min] BFN-blood flow in non -muscle, non-renal tissues [l/min] CA-capacitance of systemic arteries [l/torr ] CCD-concentration gradient across cell membrane [mmol/l] CHY-concentration of hyaluronic acid in tissue fluids [g/l] CKE-extracellular potassium concentration [mmol/l] CKI-intracellular potassium concentration [mmol/l] CNA-extracellular sodium concentration [mmol/l] CNE-sodium concentration abnormality causing third factor effect [mmo/l] CPG-concentration of protein in tissue gel [g/l] CPI-concentration of protein in free interstitial fluid [g/l] CPN-concentration of protein in pulmonary fluids [g/l] CPP-plasma protein concentration [g/l] CV-venous capacitance [l/torr] DAS-rate of volume increase of systemic arteries [l/min] DFP-rate of increase in pulmonary free fluid [l/min] DHM-rate of cardiac deterioration caused by hypoxia DLA-rate of volume increase in pulmonary veins and left atrium [l/min] LIST OF VARIABLES 336 HM 2 336 b HMK HR PA A4K VVS VPA VPA VAS VAS VLA VLA VRA VRA ANY CN3 ANZ FIS DAU HKM VIB ALO HM OVS MMO OMM SR AU4 RTP PCD CHY PGX CPG AUJ RTP 260 259 258 Z7 AUH VAS VRA DFP RFN VEC VLA VPA upper limit 8 upper limit 8 lower limit 4 upper limit 8 upper limit 15 .0 lower limit 0.4 upper limit 1 lower _ limit _ 0 lower _ limit 0 .3 lower _ limit 0 lower limit 0 lower limit = 0 lower limit 50 lower limit 1 upper limit 8 lower limit 1 lower limit 0.8 lower limit 0.7 lower limit 0.5 lower limit 0.3 lower limit 0.2375 lower limit 0.2 lower limit 0.0002 lower limit 0 .0001 lower limit 0..... lower limit 0 ... lower limit 0.. lower limit 0. lower limit 0 lower limit 0 lower limit .005 lower limit .001 12 3 171 207 .7 2136 1 2 3.3 0.1 0.4 0.4 0.85 0.7 2400 1 0 90 0 1 1 0 .01 2467 1 0 .38 1 0 0 .93 1 11 .5 1 3549 1 75 25 1 12 0.7 RVM = f(PP 2) 0 0 1.4 50 RAR 30 .5 RAM 96 .3 QRN = f(PRA ) 0 -4 15 20 QRF 0.6 QLN = f(PLA ) 0 -4 15 20 PTT = ( VTS /12 )^2 (u/12 )^2 PTS = f(VIF) 0 0 20 10 PPI = 2 - ( 0 .15 /VPF ) 2-(0.15 /u) PP 3 ^ 0 . 625 u ^ 0 . 625 POT ^3 u^3 0.33 PM 1^2 u^2 PC ^3 u^3 PA 4 ^ 0 . 625 u ^ 0 . 625 P 40 ^ 3 u^3 P3O^3 u^3 10 u 10 u sqrt 10 u LVM = f(PA2) 0 0 1.4 260 1 s x o 1 s x o 1 s x o 1 s x o 1 s x o 1 s x o 1 s x o GF4 5 0.006182 0.3134 19 .95 0 0 .999 1 .209 4 .996 142 0 .9972 100 .6 0 .377 3 .263 0.3915 0.09797 0 .8522 100 .6 71 .18 2 .836 100 .6 1 14 .74 -0.8463 5 .063 -0.407 3 .723 2.75 1 .019 2 .836 14 .97 0 .01239 39 .86 4.26 e-010 2 .006 40 0 .999 1 1 .001 0 .9977 -6.187 12 .05 19 .35 8 4 .837 0 .04672 0 .002414 0.002415 28 .36 70 .91 0 .04644 2 .907 4 .913 17 .68 198 .8 39 .97 142 4 .996 8.739 e-008 0 .9819 9.98 0 .9975 0 .9981 0.001023 1 .043 0 .9685 0.07113 1 1 1.3 2 .949 1 0 .1043 1 .209 1 .209 0.001023 7 .989 0 .0005 4.0 3.3 0 .042 15 0.1 152 1 .79 0 .00047 85 512 .007 1.6283 e-007 0 .007 0.4 1.79 0.4 0 .00355 0 .495 5 2 .738 1 0.026 1 0 .0357 20 0 .0048 0 .30625 1 17 17 1 0 .005 0.1 0.01 100 1 0 .0007 0 .00333 0.2 1 139 0 .3333 0 .0785 6 0.14 6 8.25 4 57 .14 0 .009 0.01 5 1 1 0 .125 0.00781 18 51 .66 31 .67 8.0001 0 .025 0 .001 1000 0.8 1 33 0 1 0.4 -0.2 1 0.0574 0 .128 0 .261 0.5 0 .155 1 1 15 0 6 100 1 2.8 0 0 .301 0.3 2.9 3.7 28 5 17 0.002 0.04 70 3 0.3 1 1 2.95 1 1 1 0 0 0 .0125 40 0.1 2688 1 2 1 1 1 20 -6.3 0.04 0 .002 5 12 142 5 0 1 10 1 1 0 1 20 1.2 1.2 0.1 0 .001 0 1 0.04 20 0 0.002 1 0.001 0 5 -6.3 2 3.7 2.8 2.9 0 .001 1 0.06 1 5 1 1 1 1 0 2.95 17 1.2 40 1 1 1 1 1 1.6 40 1 1 8 8 100 5 0 1 70 28 0 15 1 5 8 8 8 200 15 100 0.04 0 0 .002 12 3 0 .0125 1 0.1 8 1 142 5 100 11520 1 1.2 142 40 1 8 142 0 1 1 1 168 1 1 10 1 1 28 100 0.3 1 1 1 1 40 0.0125 200 2.8 40 1 800 2500 122 1 57 .14 5 0.5 1 40 0.08 5 1 1 0.15 1 32 0.5 1 40 2 0.21 6 0 .0005 1 1 1.24 1 8 3 1 0 .25 1 0.85 0 .15 1 60 0.3 3.159 8 0.4 0.000225 0.0003 11 0.0003 0 .45 1 0.55 0.3986 0 .333 1.5 0.5333 8.25 100 0 .0000058 0.0000464 512 0 .0025 6 57600 15 57600 100 2850 0.01 140 0 .013 8 .0001 0.0028 0 .00014 0 .00042 0.1 0 .00352 20 .039 19 .8 -0.017 60 9 -1 0.25 24 .2 -5.9 57 0.4 0.02 0 .004 7.8 0.25 0 .013332 5 1 CV 0.0825 CNY 6 CNX 2.5 CN7 0.2 CN2 0.0212 CHY^2 u^2 AUN calculation PA 1 AUN AUN CALCULATION when PA 1<50 : AUN=6 when 20 >PA1<50 : AUN=0.2*(50 -PA1) when PA 1>=50: AUC=0 AUJ ^ AUZ u v AUC calculation PA 1 AUC AUC CALCULATION when PA 1<40 : AUC=1.2 when 40 >PA1<80 : AUC=0.03 *(80 -PA1) when PA 1>=80 : AUC=0 AUB^3 u^3 AUB calculation PA 1 AUB AUB CALCULATION when PA 1<40 : AUB=1.83 when 40 >PA1<170 : AUB = 0 .014286 *(170 -PA1) when PA 1>=170 : AUB =0 ARF 1.5 AMP = f(PA) 0 0 4 200 1 (1 . 2 / RFN )^ 3 (1.2/u)^3 1 s x o 1 s x o 1 s x o 1 s x o 1 s x o 1 s x o 1 s x o 1 s x o 1 s x o 1 s x o 1 s x o 1 s x o 1 s x o 1 s x o 1 s x o 1 s x o 1 s x o 1 s x o 1 s x o 1 s x o 1 s x o 1 s x o 1 s x o 1 s x o 1 s x o 1 s x o 1 s x o 1 s x o 1 s x o lower limit 0 VIM VIM AAR AAR AAR RR RFN GLP PPC PFL GFN GFR TRR VUD AHM AM AM AM NOD EVR RBF ANU ANU RAR VAE PA PA PAM PAM RAM PGS RSN RSN BFM QAO RV 1 RV 1 VV 8 PVS PVS PVS PVS QVO QVO QVO DVS QLO DLA VLE PLA PLA PLA VB RVM RVM QRN RVG DRA PRA PRA PR 1 PR 1 PP 2 PGL QPO QPO RPA CPA VEC RFN

From Guyton‘s graphic diagram to multimedia simulators for ...patf-biokyb.lf1.cuni.cz/wiki/_media/amerika_orez.pdf · graduate and postgraduate students physiology at Czech

Embed Size (px)

Citation preview

Performed experiment - Following modifi cations are performed with the model during the experiment: Day 0: Patient in normal condition.

Day 1: Renal mass is reduced to 0.3 of norm by setting REK= 0.3.

Day 3: The salt intake is increased to fi ve times normal by setting NID=0.5.

Total time of the experiment was 8 days.

Teaching example:Hypertension in a salt loaded, renal defi cient patient

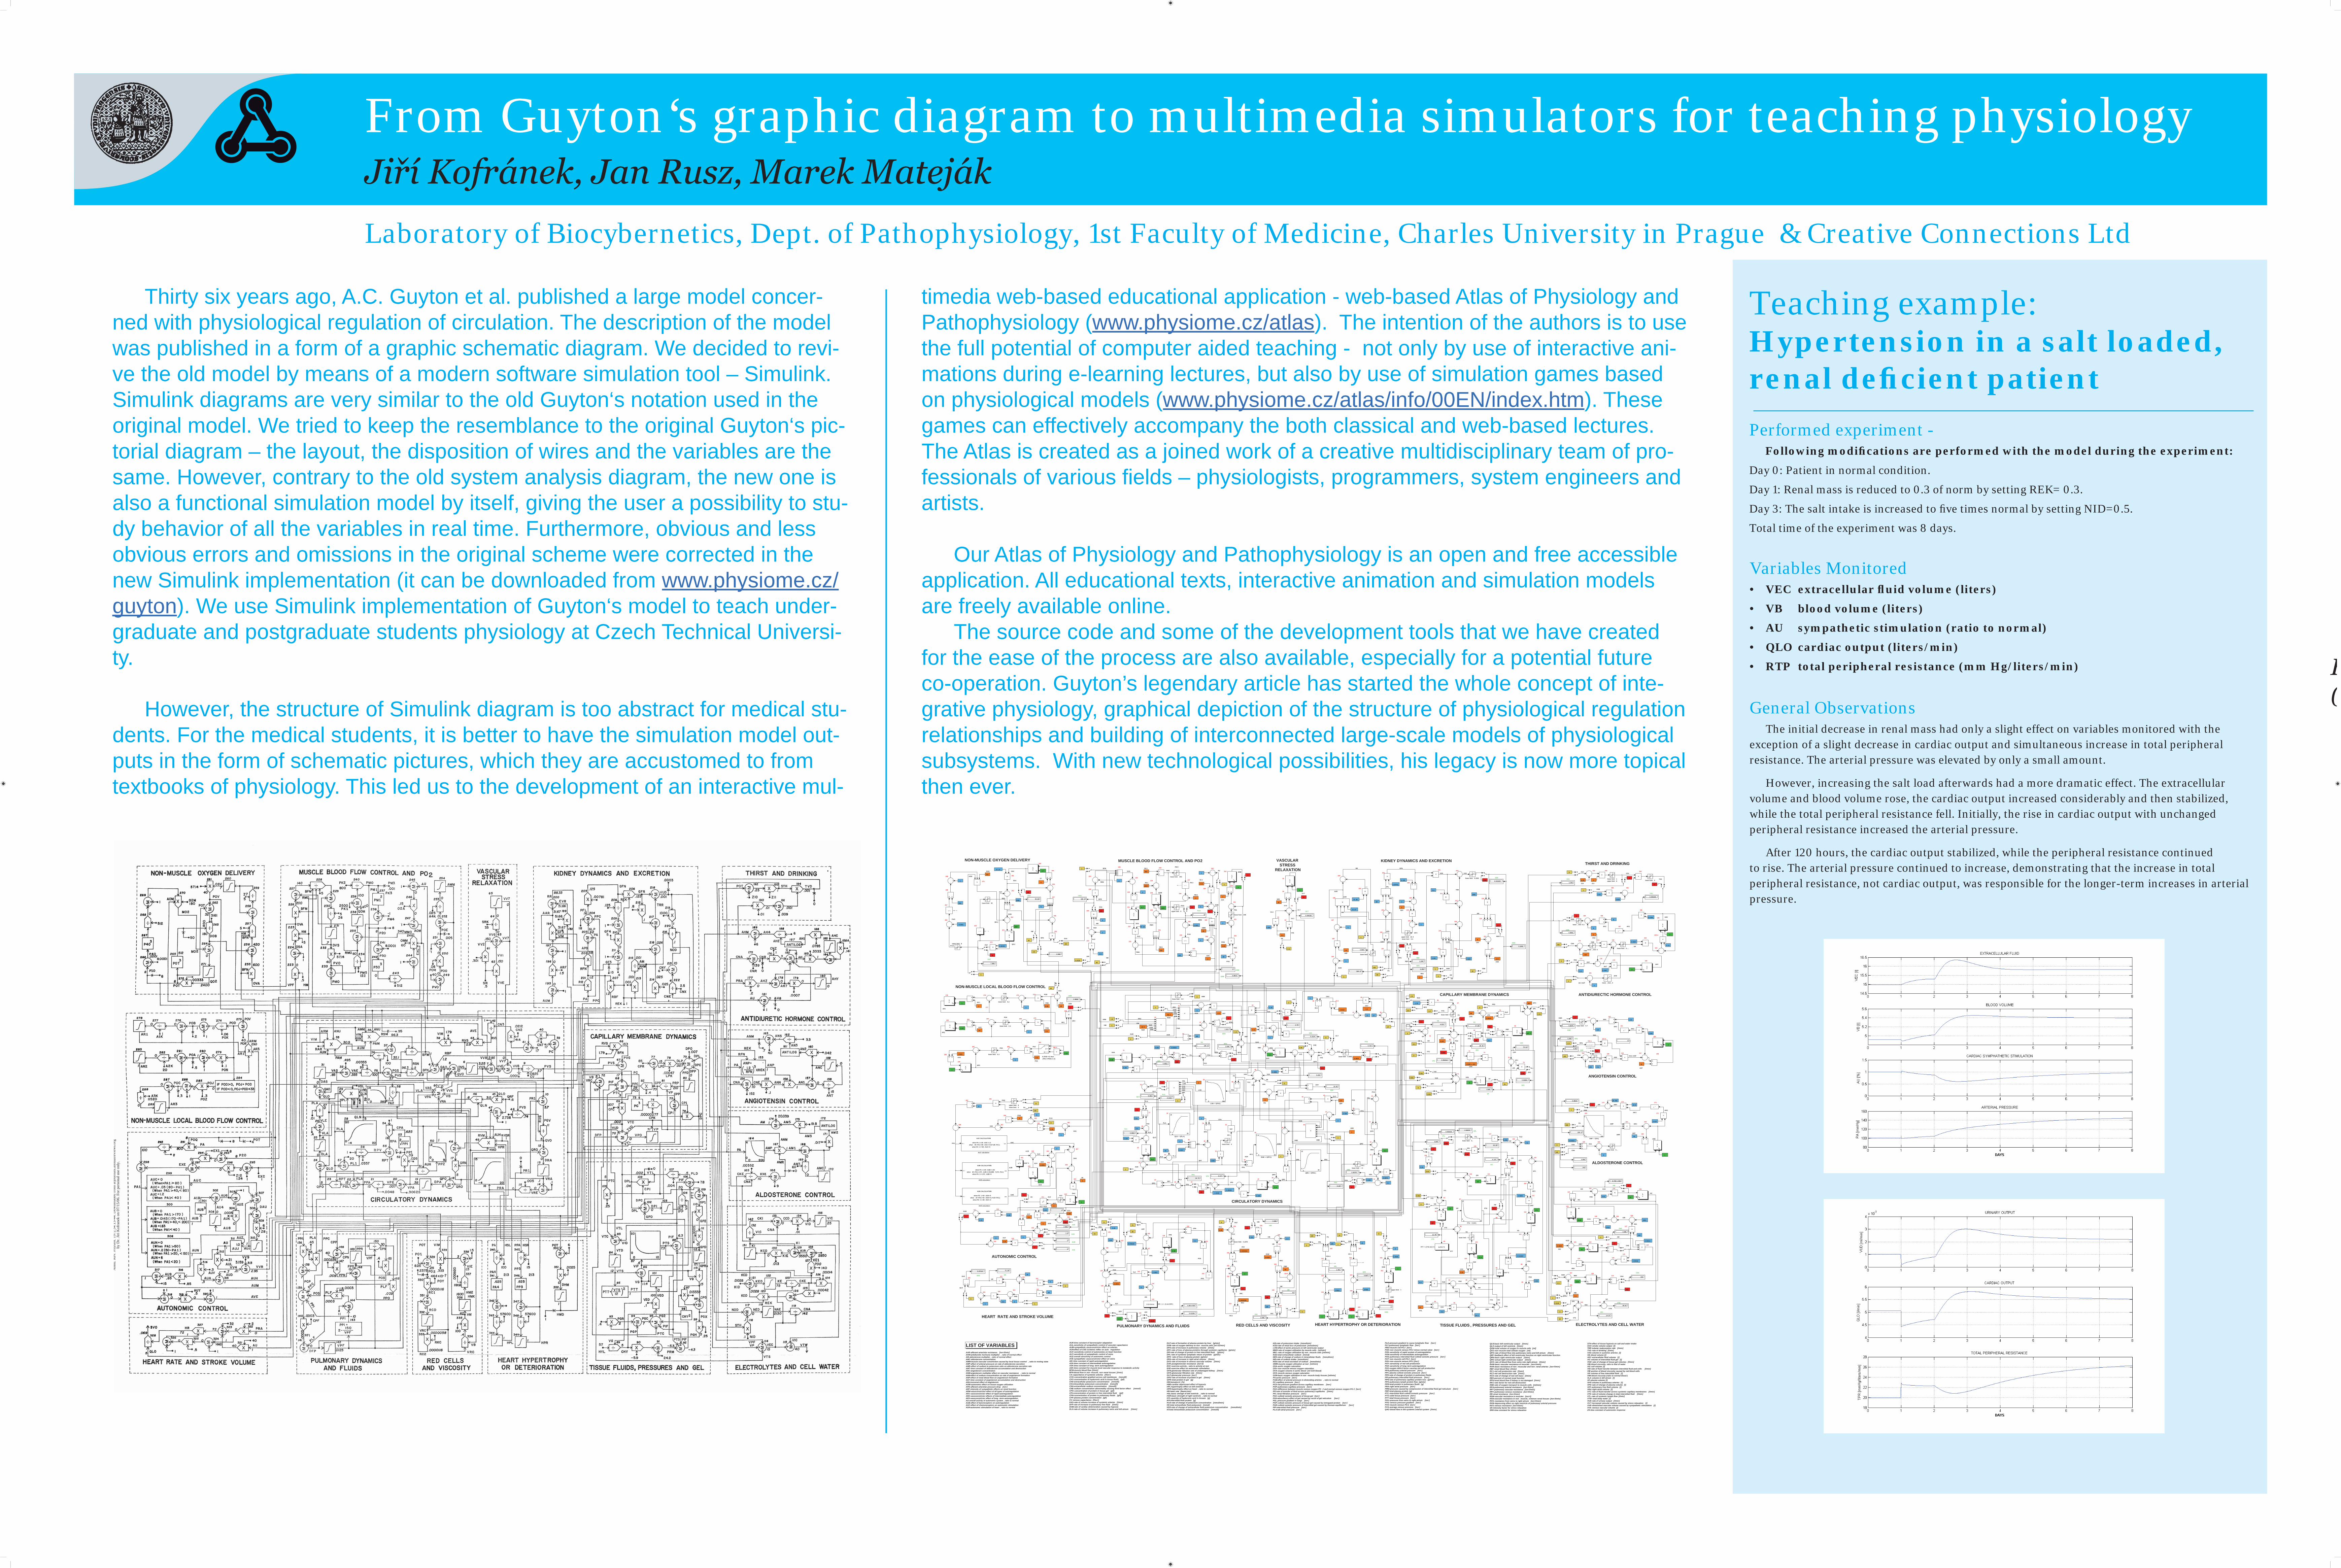
Thirty six years ago, A.C. Guyton et al. published a large model concer-ned with physiological regulation of circulation. The description of the model was published in a form of a graphic schematic diagram. We decided to revi-ve the old model by means of a modern software simulation tool – Simulink. Simulink diagrams are very similar to the old Guyton‘s notation used in the original model. We tried to keep the resemblance to the original Guyton‘s pic-torial diagram – the layout, the disposition of wires and the variables are the same. However, contrary to the old system analysis diagram, the new one is also a functional simulation model by itself, giving the user a possibility to stu-dy behavior of all the variables in real time. Furthermore, obvious and less obvious errors and omissions in the original scheme were corrected in the new Simulink implementation (it can be downloaded from www.physiome.cz/guyton). We use Simulink implementation of Guyton‘s model to teach under-graduate and postgraduate students physiology at Czech Technical Universi-ty.

However, the structure of Simulink diagram is too abstract for medical stu-dents. For the medical students, it is better to have the simulation model out-puts in the form of schematic pictures, which they are accustomed to from textbooks of physiology. This led us to the development of an interactive mul-

Variables Monitored• VEC extracellular fl uid volume (liters)

• VB blood volume (liters)

• AU sympathetic stimulation (ratio to normal)

• QLO cardiac output (liters/min)

• RTP total peripheral resistance (mm Hg/liters/min)

General Observations The initial decrease in renal mass had only a slight effect on variables monitored with the exception of a slight decrease in cardiac output and simultaneous increase in total peripheral resistance. The arterial pressure was elevated by only a small amount.

However, increasing the salt load afterwards had a more dramatic effect. The extracellular volume and blood volume rose, the cardiac output increased considerably and then stabilized, while the total peripheral resistance fell. Initially, the rise in cardiac output with unchanged peripheral resistance increased the arterial pressure.

After 120 hours, the cardiac output stabilized, while the peripheral resistance continued to rise. The arterial pressure continued to increase, demonstrating that the increase in total peripheral resistance, not cardiac output, was responsible for the longer-term increases in arterial pressure.

timedia web-based educational application - web-based Atlas of Physiology and Pathophysiology (www.physiome.cz/atlas). The intention of the authors is to use the full potential of computer aided teaching - not only by use of interactive ani-mations during e-learning lectures, but also by use of simulation games based on physiological models (www.physiome.cz/atlas/info/00EN/index.htm). These games can effectively accompany the both classical and web-based lectures. The Atlas is created as a joined work of a creative multidisciplinary team of pro-fessionals of various fi elds – physiologists, programmers, system engineers and artists.

Our Atlas of Physiology and Pathophysiology is an open and free accessible application. All educational texts, interactive animation and simulation models are freely available online. The source code and some of the development tools that we have created for the ease of the process are also available, especially for a potential future co-operation. Guyton’s legendary article has started the whole concept of inte-grative physiology, graphical depiction of the structure of physiological regulation relationships and building of interconnected large-scale models of physiological subsystems. With new technological possibilities, his legacy is now more topical then ever.

From Guyton‘s graphic diagram to multimedia simulators for teaching physiology

Laboratory of Biocybernetics, Dept. of Pathophysiology, 1st Faculty of Medicine, Charles University in Prague & Creative Connections Ltd

F(

Jiří Kofránek, Jan Rusz, Marek Mateják

Ann

u. R

ev. P

hysi

ol. 1

972.

34:1

3-44

. Dow

nloa

ded

from

arjo

urna

ls.a

nnua

lrevi

ews.o

rgby

Dr.

Jiri

Kof

rane

k on

07/

15/0

6. F

or p

erso

nal u

se o

nly.

NON-MUSCLE OXYGEN DELIVERY

269

268

261

270

262

263

264

271

272

265

266

267

257

256

255

POV

OSV

POT

RDO

MO 2

DOB

QO 2POTP1O

P4O

02 M

AOM

271

NON-MUSCLE LOCAL BLOOD FLOW CONTROL

if (POD <0) then {POJ =PODx 3.3}

278

277

276 275 274 273

285 282 281 280 279

290

284

283284 b286287

288

289

AR1

AK1

POB

POK

POD

POV

ARM

AR1AR3

PON

POA

A2K

AR2

POJ

POZ

POC

A3K

AR3

POR

VASCULAR STRESS

RELAXATION

65

64

63

62

61

VV 7

VV 7

VV 1

VV 2

VVE

SRK

VV 6

195

196

197

198

199

200

201

202

203

205

206

207

208

209

210

211

212

213 214

215

216

217

218

219

220

221

222

KIDNEY DYNAMICS AND EXCRETIONTHIRST AND DRINKING

192 193 194

190 191

Z10 Z11

STH

TVD

POT

ANTIDIURECTIC HORMONE CONTROL

181

180179178177

175 176 182183

184

185

158 A

186

187

188189

AHM AH4

AH2 AH1

AHC

AH

CNZ

CNB

CNR

CNA

PRAAHZ

AH7AHY

AH8

AU=AUP

CIRCULATORY DYNAMICS

VIM

AUM

AUM

VIM

AUM

BFN1

2

3

4

36

35

31

3233

PGS

RSM

38

34

37

RVS

43

42 41 A

41

40

39

VBD

VVE

5 6

7 8 9DAS

QAO30

QLO

LVM

HPLHMD

QLN

2959

58

28

50

16

PA2

60

PLA

24

25

26

27

VVS

QLO

AUH

HMD

QRO

QRO

AUH

VPEPPA

PL 1

PPA

RPV

RPT

RPT

PP 1

5453

5556

57

52

51

2322 21

20 1918

48

49

4645

47

44

10

11

12

13

1415

LVM

CAPILLARY MEMBRANE DYNAMICS66

67

68

69

70 71

7473

6261

80

79

7877

75

74

72

RVS

BFN

PVG

PVS

VB

VP

VRC

PTC

PPCPIF

CFC

VPDVUD

DFP

TVD

VP

CPKCPI

CP 1

CPP

CPP PRP

VP

CPRLPK

DLP

PPDDP 0

DPL

DPC

DPC

ANGIOTENSIN CONTROL

154 155 156 157 158

159

160161

162163

153 b153 a

CNA

CNEANN

AN1=ANP

ANT

ANC

AN2AN3

AN5ANM

REK

RFN

TISSUE FLUIDS , PRESSURES AND GEL

105PTC

108

107

106

109

104

110

103102

112

113

98

97

96

99

92919089

9394 95

100

101

86

85

84

8387

88

111

DPL

VTL

CPI

PIF

PLD

PTT

GP1

GPD

GPR

VG

VIF PTS

PIF

GPD

DPL

VTC

VTL

VID

VTS

VTD

PTT

DPIVIF

IFP

GP2

VGD

VG

V2D

PG2PGC

PTC

PIF

PIFPTS

PRMCHY

HYL

VG

PGR

PGP

PGH

ALDOSTERONE CONTROL

165 166

167

164

168

169

170

171

172173174AM AM 5

AM 3AM 2

AMC

AMT

AM 1AMP

KN1CKE

CNA

ANM

AMR

ELECTROLYTES AND CELL WATER

114 115

116

117 118119

120

121

126

125

122123 124

127

128129130

131

135134133

132

CKI CCD

CNA

VIC

VIDVIC

KI

KCD KIE KIR

KE1

AM

CKEKEKED

KCD

KID

KOD

REK

NEDNAE

CNA

VTW

VIC

STH

NID

VP

VPF

VTS

HEART HYPERTROPHY OR DETERIORATION

340

341

342

343

344 349

348

347

346

345

350

351

352

PA

PPA 4

HPLHPR

PP 3

PPAHSL HSR

POT

DHM

HMD

RED CELLS AND VISCOSITY

329

330

331

332

333334

335

337

338

339

POT

PO 1

POY

PO 2

RC1

RCD

VRC

RKC

RC2VRC

VB

HM

VIE

VIM

PULMONARY DYNAMICS AND FLUIDS

PLA

136

137

138

139

140

141

142

143

144

145152

146

147

148

149

150

151

PPA

PCP

PPC

POS

PPI

CPF

PFI

PLF

DFP VPF

PPI

PLF

PLF

PPO

POS

CPN

VPF

PPR

PPD

PPN

PPC

CPP

AUTONOMIC CONTROL

292291

294

293

296297298

295

307303302

301

305

304308

309

310

311

312

313

315

314

316317

318

319320

POQPOT

PA

EXE

POQ

P2O

Z12EXC

AUCPA1

A1B

AUB

AUN

AU8

AUK AU2

AU6

DAU

Z8

AUJ

AUL

VV 9

VVR

AUH

AUM

AVE

AUY

AUD

AUV

AU9

AU

HEART RATE AND STROKE VOLUME

328327 323

322

321324325326

SVO

QLO

HR

PRA

AURHMD

MUSCLE BLOOD FLOW CONTROL AND PO2

227

226

225

224

223

228

229

230

231

232

233

234

235

238 236

237239

240

241

242

243

244

245

246

247

248

249

250

251

252

253

254

OSA

OVA

BFM

RMO

BFM

PK 1

PK 2

DVS

PVO

PMO

PM 5

RMO

QOM

PMO

PM 3

PK 3

PM 4

P2O

P3O

EXC

AOM

02 A

AUAMM

POE

POM

PDO

PVO

POV

POT

ARM

OVA

P2O

AOM

AMM

AMM

VVE

VV 7

VUD

RBF

RFN

NOD

AU

VVR

AUH

AUM

AVE

SVO

HM

BFN

VPFHM

OVA

REK

CNEAUM AHM

AM

AHM

PA

NOD

DPC

AUZ

ARM

VIM

AUM

ANM

AVE

RBF

PC

VVR

VV 7

AUH

HMD

HSR

HPR

STH

TVD

VTL

AHM

ANM

CNE

AM

VID

CKE

CNA

VTW

PCVB

VP

DPC

CPP

VTC

VTL

DPL

PTC

CPI

VTS

PIF

HPR

HPL

HMD

VIM

HM

VRCVPF

BFN

BFM

RVS

PVS

PRA

QLOPLA

PPA

PA

HSL

PPCVTC

PC

GP3APD

AAR-afferent arteriolar resistance [torr /l/min]AHM-antidiuretic hormone multiplier , ratio of normal effectAM-aldosterone multiplier , ratio of normal effectAMC-aldosterone concentrationAMM-muscle vascular constriction caused by local tissue control , ratio to resting stateAMP-effect of arterial pressure on rate of aldosterone secretionAMR-effect of sodium to potassium ratio on aldosterone secretion rateAMT-time constant of aldosterone accumulation and destructionANC-angiotensin concentrationANM-angiotensin multiplier effect on vascular resistance , ratio to normalANN-effect of sodium concentration on rate of angiotensin formationANP-effect of renal blood flow on angiotensin formationANT-time constant of angiotensin accumulation and destructionANU-nonrenal effect of angiotensinAOM-autonomic effect on tissue oxygen utilizationAPD-afferent arteriolar pressure drop [torr]ARF-intensity of sympathetic effects on renal functionARM-vasoconstrictor effect of all types of autoregulationAR1-vasoconstrictor effect of rapid autoregulationAR2-vasoconstrictor effects of intermediate autoregulationAR3-vasoconstrictor effect of long -term autoregulationAU-overall activity of autonomic system , ratio to normalAUB-effect of baroreceptors on autoregulationAUC-effect of chemoreceptors on autonomic stimulationAUH-autonomic stimulation of heart , ratio to normal

DLP-rate of formation of plasma protein by liver [g/min]DOB-rate of oxygen delivery to non -muscle cells [ml O2/min]DPA-rate of increase in pulmonary volume [l/min]DPC-rate of loss of plasma proteins through systemic capillaries [g/min]DPI-rate of change of protein in free interstitial fluid [g/min]DPL-rate of systemic lymphatic return of protein [g/min]DPO -rate of loss of plasma protein [g/min]DRA-rate of increase in right atrial volume [l/min]DVS-rate of increase in venous vascular volume [l/min]EVR-postglomerular resistance [torr/l]EXC-exercise activity , ratio to activity at restEXE-exercise effect on autonomic stimulationGFN-glomerular filtration rate of undamaged kidney [l/min]GFR-glomerular filtration rate [l/min]GLP-glomerular pressure [torr]GPD-rate of increase of protein in gel [l/min]GPR-total protein in gel [g]HM-hematocrit [%]HMD-cardiac depressant effect of hypoxiaHPL-hypertrophy effect on left ventricleHPR-hypertrophy effect on heart , ratio to normalHR-heart rate [beats/min]HSL-basic strengh of left ventricle , ratio to normalHSR-basic strength of right ventricle , ratio to normalHYL-quantity of hyaluronic acid in tissues [g]IFP-interstitial fluid protein [g]KCD-rate of change of potassium concentration [mmol/min]KE-total extracellular fluid potassium [mmol]KED-rate of change of extracellular fluid potassium concentration [mmol/min]KI-total intracellular potassium concentration [mmol/l]

KID-rate of potassium intake [mmol/min]KOD-rate of renal loss of potassium [mmol/min]LVM-effect of aortic pressure on left ventricular outputMMO-rate of oxygen utilization by muscle cells [ml/min]M02--rate of oxygen utilization by non -muscle cells [ml/min]NAE-total extracellular sodium [mmol]NED-rate of change of sodium in intracellular fluids [mmol/min]NID-rate of sodium intake [mmol/min]NOD-rate of renal excretion of sodium [mmol/min]OMM-muscle oxygen utilization at rest [ml/min]OSA-aortic oxygen saturationOSV-non-muscle venous oxygen saturationOVA-oxygen volume in aortic blood [ml O2/l blood]OVS-muscle venous oxygen saturationO2M-basic oxygen utilization in non -muscle body tissues [ml/min]PA-aortic pressure [torr] PAM-effect of arterial pressure in distending arteries , ratio to normalPC-capillary pressure [torr]PCD-net pressure gradient across capillary membrane [torr]POP-pulmonary capillary pressure [torr]PDO-difference between muscle venous oxygen PO 2 and normal venous oxygen PO 2 [torr]PFI-rate of transfer of fluid across pulmonary capillaries [l/min]PFL-renal filtration pressure [torr]PGC-colloid osmotic pressure of tissue gel [torr]PGH-absorbency effect of gel caused by recoil of gel reticulum [torr]PGL-pressure gradient in lungs [torr]PGP-colloid osmotic pressure of tissue gel caused by entrapped protein [torr]PGR-colloid osmotic pressure of interstitial gel caused by Donnan equilibrium [torr]PIF-interstitial fluid pressure [torr]PLA-left atrial pressure [torr]

PLD-pressure gradient to cause lymphatic flow [torr]PLF-pulmonary lymphatic flow [torr]PMO-muscle cell PO 2 [torr]POD-non-muscle venous PO 2 minus normal value [torr]POK-sensitivity of rapid system of autoregulationPON-sensitivity of intermediate autoregulationPOS-pulmonary interstitial fluid colloid osmotic pressure [torr]POT-non-muscle cell PO 2 [torr]POV-non-muscle venous PO 2 [torr]POY-sensitivity of red cell productionPOZ-sensitivity of long-term autoregulationPO2-oxygen deficit factor causing red cell productionPPA-pulmonary arterial pressure [torr]PPC-plasma colloid osmotic pressure [torr]PPD-rate of change of protein in pulmonary fluidsPPI-pulmonary interstitial fluid pressure [torr]PPN-rate of pulmonary capillary protein loss [g/min]PPO-pulmonary lymph protein flow [g/min]PPR-total protein in pulmonary fluids [g]PRA-right atrial pressure [torr]PRM-pressure caused by compression of interstitial fluid gel reticulum [torr]PRP-total plasma protein [g]PTC-interstitial fluid colloid osmotic pressure [torr]PTS-solid tissue pressure [torr]PTT-total tissue pressure [torr]PGV-pressure from veins to right atrium [torr]PVG-venous pressure gradient [torr]PVO-muscle venous PO 2 [torr]PVS-average venous pressure [torr]QAO-blood flow in the systemic arterial system [l/min]

QLN-basic left ventricular output [l/min]QLO-output of left ventricle [l/min]QOM-total volume of oxygen in muscle cells [ml]QO2-non-muscle total cellular oxygen [ml]QPO-rate of blood flow into pulmonary veins and left atrium [l/min]QRF-feedback effect of left ventricular function on right ventricular functionQRN-basic right ventricular output [l/min]QRO-actual right ventricular output [l/min]QVO-rate of blood flow from veins into right atrium [l/min]RAM-basic vascular resistance of muscles [torr/l/min]RAR-basic resistance of non -muscular and non -renal arteries [torr/l/min]RBF-renal blood flow [l/min]RC1-red cell production rate [l/min]RC2-red cell destruction rate [l/min]RCD-rate of change of red cell mass [l/min]REK-percent of normal renal functionRFN-renal blood flow if kidney is not damaged [l/min]RKC-rate factor for red cell destructionRM0-rate of oxygen transport to muscle cells [ml/min]RPA-pulmonary arterial resistance [torr /l/min]RPT-pulmonary vascular resistance [torr/l/min]RPV-pulmonary venous resistance [torr/l/min]RR-renal resistance [torr/l/min]RSM-vascular resistance in muscles [torr/l]RSN-vascular resistance in non -muscle, n/minon-renal tissues [torr /l/min]RVG-resistance from veins to right atrium [torr/l/min]RVM-depressing effect on right ventricle of pulmonary arterial pressureRVS-venous resistance [torr /l/min]SR-intensity factor for stress relaxationSRK-time constant for stress relaxation

STH-effect of tissue hypoxia on salt and water intakeSVO-stroke volume output [l]TRR-tubular reabsorption rate [l/min]TVD-rate of drinking [l/min]VAS-volume in systemic arteries [l]VB-blood volume [l]VEC-extracellular fluid volume [l]VG-volume of interstitial fluid gel [l]VGD-rate of change of tissue gel volumes [l/min]VIB-blood viscosity, ratio to that of waterVIC-cell volume [l]VID-rate of fluid transfer between interstitial fluid and cells [l/min]VIE-portion of blood viscosity caused by red blood cellsVIF-volume of free interstitial fluid [l]VIM-blood viscosity (ratio to normal blood )VLA-volume in left atrium [l]VP-plasma volume [l]VPA-volume in pulmonary arteries [l]VPD-rate of change of plasma volume [l]VPF-pulmonary free fluid volume [l]VRA-right atrial volume [l]VTC-rate of fluid transfer across systemic capillary membranes [l/min]VTD-rate of volume change in total interstitial fluid [l/min]VTL-rate of systemic lymph flow [l/min]VTW -total body water [l]VUD-rate of urinary output [l/min]VV7-increased vascular volume caused by stress relaxation [l]VVR -diminished vascular volume caused by sympathetic stimulation [l]VVS-venous vascular volume [l]Z8-time constant of autonomic response

AUK-time constant of baroreceptor adaptationAUL-sensitivity of sympathetic control of vascular capacitanceAUM-sympathetic vasoconstrictor effect on arteriesAUN-effect of CNS ischemic reflex on auto -regulationAUV-sensitivity control of autonomies on heart functionAUY-sensitivity of sympathetic control of veinsAUZ-overall sensitivity of autonomic controlAVE-sympathetic vasoconstrictor effect on veinsAlK-time constant of rapid autoregulationA2K-time constant of intermediate autoregulationA3K-time constant of long -term autoregulationA4K-time constant for muscle local vascular response to metabolic activityBFM-muscle blood flow [l/min]BFN-blood flow in non -muscle, non-renal tissues [l/min]CA-capacitance of systemic arteries [l/torr]CCD-concentration gradient across cell membrane [mmol/l]CHY-concentration of hyaluronic acid in tissue fluids [g/l]CKE-extracellular potassium concentration [mmol/l]CKI-intracellular potassium concentration [mmol/l]CNA-extracellular sodium concentration [mmol/l]CNE-sodium concentration abnormality causing third factor effect [mmo/l]CPG-concentration of protein in tissue gel [g/l]CPI-concentration of protein in free interstitial fluid [g/l]CPN-concentration of protein in pulmonary fluids [g/l]CPP-plasma protein concentration [g/l]CV-venous capacitance [l/torr]DAS-rate of volume increase of systemic arteries [l/min]DFP-rate of increase in pulmonary free fluid [l/min]DHM-rate of cardiac deterioration caused by hypoxiaDLA-rate of volume increase in pulmonary veins and left atrium [l/min]

LIST OF VARIABLES

336

HM 2

336 b

HMK

HR

PA

A4K

VVS

VPA

VPA

VAS

VAS

VLA

VLA

VRA

VRA

ANY

CN3

ANZ

FIS

DAU

HKM

VIB

ALO

HM

OVS

MMO

OMM

SR

AU4

RTP

PCD

CHY PGX

CPG

AUJ

RTP

260

259

258

Z7

AUH

VAS

VRA

DFP

RFN

VEC

VLA

VPA

upper limit 8

upper limit 8lower limit 4

upper limit 8

upper limit 15 .0lower limit 0.4

upper limit 1

lower _ limit _0

lower _ limit 0 .3

lower _ limit 0

lower limit 0

lower limit = 0

lower limit 50

lower limit 1upper limit 8

lower limit 1

lower limit 0 .8

lower limit 0 .7lower limit 0 .5

lower limit 0.3

lower limit 0 .2375

lower limit 0 .2

lower limit 0 .0002

lower limit 0 .0001

lower limit 0 .....

lower limit 0 ...

lower limit 0..

lower limit 0.

lower limit 0

lower limit 0

lower limit .005

lower limit .001

12

3

171

207 .7

2136

1

2

3.3

0 .1

0 .4

0 .4

0.85

0 .7 2400

1

0

90

0

1

10.01

2467

1

0.38

1

0

0.93

1

11 .5

1

3549

1

75

25

1

12

0.7

RVM = f(PP 2)

00

1 .4

50

RAR

30 .5

RAM

96 .3

QRN = f(PRA )

0-4

15

20

QRF

0.6

QLN = f(PLA )

0-4

15

20

PTT = ( VTS /12 )^2 (u/12 )^2

PTS = f(VIF)

00

20

10

PPI = 2 - (0 .15 /VPF )2-(0.15 /u)

PP 3 ^ 0 . 625u ^ 0 . 625

POT ^ 3u ^ 3

0.33

PM 1 ^ 2 u ^ 2

PC ^ 3

u ^ 3

PA 4 ^ 0 . 625u ^ 0 . 625

P 40 ^ 3u ^ 3

P 3 O ^ 3 u ^ 3

10u

10u

sqrt

10u

LVM = f(PA2)

00

1 .4

260

1sxo

1s

xo

1s

xo

1sxo

1s

xo

1s xo

1sxo

GF4

5

0.006182

0.3134

19 .95

0

0.999

1.209

4.996

142

0.9972

100 .6

0 .377

3 .263

0.3915

0.09797

0.8522

100 .6

71 .18

2 .836

100 .6

1

14 .74

-0 .84635.063

-0 .407

3 .723

2.75

1 .019

2.836

14 .970 .01239

39 .86

4 .26 e-010

2.006

40

0.999

1

1.001

0.9977

-6 .187

12 .05

19 .35

8

4.837

0.046720.002414

0.002415

28 .3670 .91

0 .04644

2.907

4.91317 .68

198 .8

39 .97

142

4.996

8.739 e-008

0.9819

9.98

0 .9975

0.9981

0.001023

1.043

0.9685

0.07113

1

1

1.3

2 .949

1

0.1043

1.209

1.209

0.001023

7.989

0.0005

4.0

3 .3

0 .042

15

0.1152

1.79

0 .00047

85

512

.007

1.6283 e-007

0.007 0.4

1.79

0.4

0 .003550.495

5

2.738

1

0.026

1

0.035720

0.0048

0.30625

1

1717

1

0.005

0.1

0.01

100

1

0.0007

0.00333

0.2

1

139

0.3333

0.0785

6

0.14

6

8.25 4

57 .14

0 .009

0.01

5

1

1

0.125

0.00781

1851 .66

31 .67

8 .0001

0.0250.001

1000

0.8

1

33

0

1

0.4

-0 .2

1

0 .0574

0.128

0.261

0.5

0 .155

11

15

0

6

100

1

2.8

0

0 .301

0.3

2 .9

3.7

28

5

17

0.002

0.04

70

3

0.3

1

1

2.95

1

1

1

0

0

0.0125

40

0.1

2688

1

2

1

1

1

20

-6 .3

0.04

0 .002

5

12

142

5

0

1

10

1

1

0

1

20

1.2

1 .2

0.1

0 .001

0

1

0.04

20

0

0.002

1

0.001

0

5

-6 .3

2

3 .72 .8

2.9

0 .001

1

0.06

1

51

1

1

1

0

2.95

17

1.2

40

1

1

1

1

1

1.6

40

1

1

8

8

100

5

0

1

70

28

0

15

1

5

8

8

8

200

15100

0.04

0

0.002

12

3

0.0125

1

0.1

8

1

142

5

100

11520

1

1.2

142

401

8

142

0

1

1

1

168

1

1

10

1

1

28

100

0.3

1

1

1

1

400.0125

200

2.8

40

1

800

2500

122

1

57 .14

5

0.5

1

40

0.08

5

1

1

0.15

1

32

0.5 1

40

2

0.21

6

0.0005

1

1

1.24

1

8

3

1

0.25

1

0.85

0 .15

1

60

0.3

3.159

8

0.4

0.000225

0.0003

11

0.0003

0.45

1

0.55

0 .3986

0.3331.5

0 .5333

8.25

100

0.0000058

0.0000464

512

0.0025

6

57600

15

57600

100

2850

0.01

140

0.013

8.0001

0.0028

0.00014

0.00042

0.1

0 .00352

20 .039

19 .8

-0 .017

60

9

-1

0.25

24 .2

-5 .9

57

0.4

0.02

0 .004

7.8

0.25

0 .013332

51

CV

0.0825

CNY

6

CNX

2.5

CN7

0.2

CN2

0.0212

CHY^2u^2

AUN calculation

PA 1 AUN

AUN CALCULATION

when PA 1<50 : AUN=6 when 20 >PA1<50 : AUN=0.2*( 50 -PA1)

when PA 1>=50 : AUC =0

AUJ ^AUZ

uv

AUC calculation

PA 1 AUC

AUC CALCULATION

when PA 1<40 : AUC =1.2 when 40 >PA1<80 : AUC =0.03 *( 80 -PA1)

when PA 1>=80 : AUC=0

AUB^3u^3

AUB calculation

PA 1 AUB

AUB CALCULATION

when PA 1<40 : AUB=1.83 when 40 >PA1<170 : AUB =0.014286 *(170 -PA1)

when PA 1>=170 : AUB =0

ARF

1.5

AMP = f(PA)

0 0

4

200

1

(1 . 2 / RFN )^ 3

(1 . 2 / u )^ 3

1s

xo

1s

xo

1s xo

1s xo

1sxo

1sxo

1s

xo

1s

xo

1s

xo

1sxo

1s

xo

1s xo

1sxo

1s

xo

1s

xo

1s

xo 1s

xo

1sxo

1sxo

1s

xo

1s xo

1sxo

1sxo

1s

xo

1s

xo

1sxo

1s

xo

1s xo

1s xo

lower limit 0

VIM

VIM

AAR

AAR

AAR

RR

RFN

GLP

PPC

PFL

GFN

GFR

TRR

VUD

AHMAM

AM

AM

NOD

EVR

RBF

ANU

ANU

RAR

VAE

PA

PA

PAMPAM

RAM

PGS

RSN

RSN

BFM

QAO

RV 1

RV 1

VV 8

PVS

PVS

PVS

PVS

QVO

QVO

QVO

DVS

QLO

DLA

VLE

PLA

PLA

PLA

VB

RVM

RVM

QRN

RVG

DRA

PRA

PRA

PR 1

PR 1

PP 2

PGL

QPO

QPO

RPA

CPA

VEC

RFN