Embed Size (px)
Citation preview
QUESTempo 48N User Manual
3M Persomal Safety Division3M™ QUESTemp°™ Heat Stress Monitors
From the
Robust Construction
©3M
201
3 Al
l Rig
hts
Rese
rved
Market LeaderFrom the
i Contents
Contents
Introduction .......................................................................................................................................................... 1
QUESTempº 48N Model....................................................................................................................................... 1
Getting Started ..................................................................................................................................................... 2
Up and Running overview ................................................................................................................................... 2
Placing the QUESTempº 48N on the job site ..................................................................................................... 2
Keypad Operation ............................................................................................................................................... 3
Turning on, logging/capture an event, and turning off ........................................................................................ 4
Sensors................................................................................................................................................................. 6
Globe Thermometer ............................................................................................................................................ 6
Waterless Wetbulb & Relative Humidity Sensor ................................................................................................. 6
Dry Bulb Thermometer........................................................................................................................................ 6
Measurements ..................................................................................................................................................... 7
WetBulb Globe Temperature (WBGT) ................................................................................................................ 7
Stay Times/Rest Times (Indicies) ....................................................................................................................... 7
Remote measurements ....................................................................................................................................... 7
Operating QUESTempº 48N ................................................................................................................................ 8
View .................................................................................................................................................................... 8
Setup ................................................................................................................................................................... 8
Print ................................................................................................................................................................... 10
Reset ................................................................................................................................................................. 10
Run ................................................................................................................................................................... 10
Displayed Items ................................................................................................................................................. 11
Stay Time/Index ................................................................................................................................................ 12
Data Logging ...................................................................................................................................................... 13
Electronic sensor check ................................................................................................................................... 14
Performing an electronic sensor check ............................................................................................................. 14
Sensor Alignment .............................................................................................................................................. 15
RH Sensor Alignment ....................................................................................................................................... 15
Printing ............................................................................................................................................................... 17
Contents
Contents
ii
Data/Communications....................................................................................................................................... 17
Parallel .............................................................................................................................................................. 18
Power .................................................................................................................................................................. 19
9-Volt Alkaline Battery Replacement ................................................................................................................ 19
Approved 9-Volt Batteries ................................................................................................................................. 19
Appendix A: Specifications ............................................................................................................................. 20
QUESTemp° 48N Block Model ........................................................................................................................ 22
Appendix B: Heat Exposure Tables ................................................................................................................. 23
ACGIH ............................................................................................................................................................... 23
ACGIH Clothing Corrections ............................................................................................................................. 24
United States Navy ........................................................................................................................................... 24
Flag Conditions for U.S. Navy/Marine Corp. Ashore ........................................................................................ 26
Appendix C: Accessories ................................................................................................................................. 27
Appendix D: Software ...................................................................................................................................... 28
DMS quick overview ......................................................................................................................................... 28
Communicating and Downloading in DMS ....................................................................................................... 28
Data Finder and quick reports .......................................................................................................................... 29
Customer service .............................................................................................................................................. 31
Contacting 3M Instrumentation ......................................................................................................................... 31
International customers..................................................................................................................................... 31
Calibration .......................................................................................................................................................... 31
Warranty ............................................................................................................................................................. 31
List of Figures
Figure 1-1: QUESTempº 48N in a thermal environment……………………………………………………………………. 1 Figure 1-2: Keypad keys identified…………………………………………………………………………………………….. 3 Figure 1-3: Start-up screens……………………………………………………………………………………………………4 Figure 1-4: Index start-up screen……………………………………………………………………………………………... 4 Figure 1-5: Log rate start-up screen………………………………………………………………………………………….. 4 Figure 1-6: Main menu of the QT48N………………………………………………………………………………………… 5 Figure 1-7: Measurement screen …………..………………………………………………………………………………… 5 Figure 1-8: Sensors identified………………………………………………………………………………………………… 6 Figure 1-9: Main menu example………………………………………………………………………………………………. 8 Figure 1-10: Viewing measured data…………………………………………………………………………………………. 8 Figure 1-11: Selecting temperature setting and setup………………………………………………………………………….. 9
Contents
iii
Figure 1-12: Selecting temperature setting………………………………………………………………………………………. 9 Figure 1-13: Selecting log rate with event log……………………………………………………………………………….. 9 Figure 1-14: Run mode indicator……………………………………………………………………………………………. 10 Figure 1-15: Wet and Dry screen…………………………………………………………………………………………….. 11 Figure 1-16: Globe and RH screen………………………………………………………………………………………….. 11 Figure 1-17: WBGT screen…………………………………………………………………………………………………… 11 Figure 1-18: Time and Date screen…………………………………………………………………………………………. 11 Figure 1-19: Battery & memory screen……………………………………………………………………………………... 12 Figure 1-20: Navy PHEL stay times…………………………………………………………………………………………..12 Figure 1-21: Index for ACGIH………………………………………………………………………………………………... 12 Figure 1-22: Navy PHELs screen…………………………………………………………………………………………….13 Figure 1-23: Flag Conditions Navy/Marine Corp. Ashore………………………………………………………………… 13 Figure 1-24: Main menu with view selected ……………………………………………………………………………….. 15 Figure 1-25: Alignment screen………………………………………………………………………………………………. 15 Figure 1-26: Sunshield & placement of finger cot prior to RH alignment……………………………………………… 15 Figure 1-27: RH alignment with Low % example………………………………………………………………………… 16 Figure 1-28: RH alignment with High% screen…………………………………………………………………………… 16 Figure 1-29: Sample DMS event data report……………………………………………………………………………… 17 Figure 1-30: Sample printouts……………………………………………………………………………………………….. 18 Figure 1-31: 9-volt battery……………………………………………………………………………………………………. 19 Figure 1-33: Communicating with the QT⁰ 48N and DMS……………………………………………………………….. 28
Figure 1-34: Communicating with the QT⁰ 48N and DMS……………………………………………………………….. 29
Figure 1-35: Data Finder Page……………………………………………………………………………………………… 29 Figure 1-36: Quick Report…………………………………………………………………………………………………… 30 Figure 1-37: Analyze button opens to the panel layout page…………………………………………………………… 30
LIST OF TABLES
Table 1-1: Keypad explained ................................................................................................................................... 3 Table 1-2: Settings indentified ................................................................................................................................. 8 Table 1-3: Example of a Memory table .................................................................................................................. 13
1 Introduction Up and Running overview
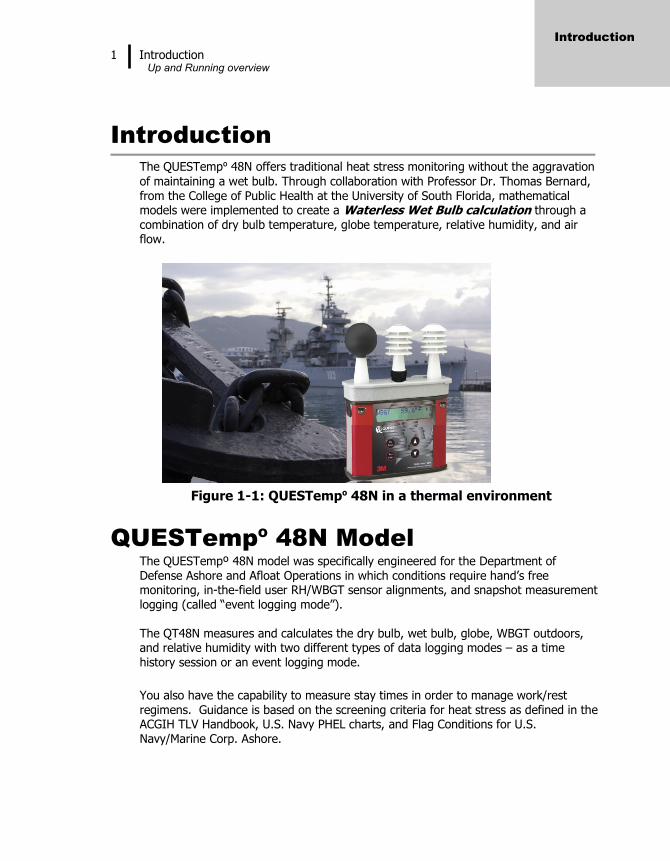
Introduction
The QUESTempº 48N offers traditional heat stress monitoring without the aggravation
of maintaining a wet bulb. Through collaboration with Professor Dr. Thomas Bernard, from the College of Public Health at the University of South Florida, mathematical models were implemented to create a Waterless Wet Bulb calculation through a combination of dry bulb temperature, globe temperature, relative humidity, and air flow.
Figure 1-1: QUESTempº 48N in a thermal environment
QUESTempº 48N Model
The QUESTempº 48N model was specifically engineered for the Department of Defense Ashore and Afloat Operations in which conditions require hand’s free monitoring, in-the-field user RH/WBGT sensor alignments, and snapshot measurement logging (called “event logging mode”). The QT48N measures and calculates the dry bulb, wet bulb, globe, WBGT outdoors, and relative humidity with two different types of data logging modes – as a time history session or an event logging mode.
You also have the capability to measure stay times in order to manage work/rest
regimens. Guidance is based on the screening criteria for heat stress as defined in the ACGIH TLV Handbook, U.S. Navy PHEL charts, and Flag Conditions for U.S. Navy/Marine Corp. Ashore.
Introduction
2 Getting Started Up and Running overview
Getting Started
Up and Running overview
Placing the QUESTempº 48N on the job site
The QUESTempº 48N should be placed at a height of 3.5 feet (1.1m) for standing
individuals or 2 feet (.6m) for seated individuals. Tripod mounting is recommended to get the unit away from anything that might block radiant heat or airflow. A 1/4"x 20 threaded bushing on the bottom of the instrument allows mounting to a standard photographic tripod. Do not stand close to the unit during sampling.
Before data logging, allow ten minutes for the sensors readings to stabilize.
1. Place the QUESTempº 48N in the work area in a safe location approximately
3.5 feet off the ground.
2. Turn the unit On. If the battery voltage displayed during the power-on sequence is less than or equal to 6.4 volts, replace or recharge the batteries.
3. Be aware that the sensors require 10 minutes to stabilize to a new
environment.
4. In the main menu, View will be selected (an indicator arrow denotes the selected menu). Press the I/O Enter key and the measurement screen will appear.
5. Press the Run/Stop key to begin datalogging. Use the Arrow keys to set the display to the desired items.
Getting started
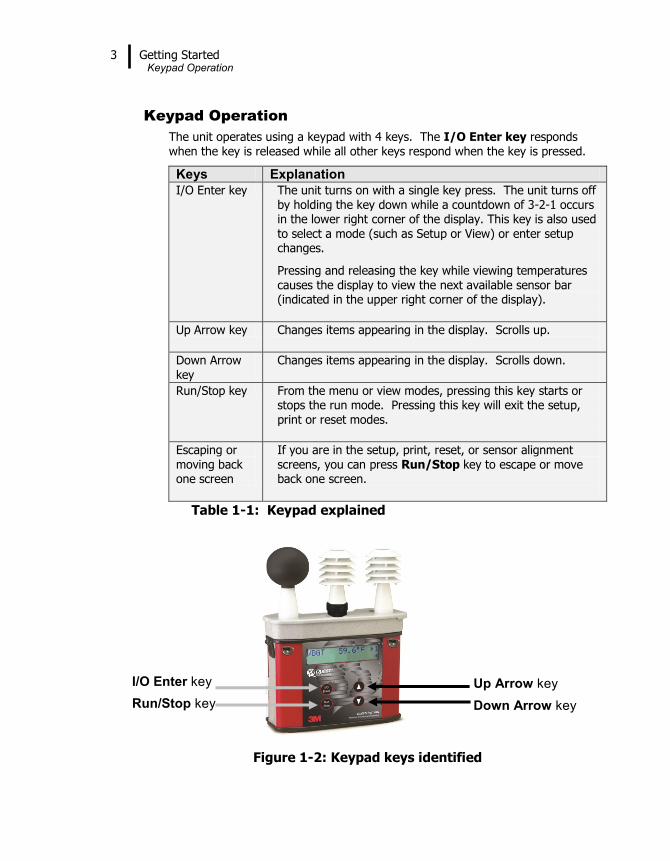
3 Getting Started Keypad Operation
Keypad Operation
The unit operates using a keypad with 4 keys. The I/O Enter key responds when the key is released while all other keys respond when the key is pressed.
Keys Explanation
I/O Enter key The unit turns on with a single key press. The unit turns off by holding the key down while a countdown of 3-2-1 occurs in the lower right corner of the display. This key is also used
to select a mode (such as Setup or View) or enter setup changes.
Pressing and releasing the key while viewing temperatures causes the display to view the next available sensor bar (indicated in the upper right corner of the display).
Up Arrow key Changes items appearing in the display. Scrolls up.
Down Arrow key
Changes items appearing in the display. Scrolls down.
Run/Stop key From the menu or view modes, pressing this key starts or stops the run mode. Pressing this key will exit the setup, print or reset modes.
Escaping or moving back one screen
If you are in the setup, print, reset, or sensor alignment screens, you can press Run/Stop key to escape or move back one screen.
Table 1-1: Keypad explained
Figure 1-2: Keypad keys identified
I/O Enter key
Run/Stop key
Up Arrow key
Down Arrow key
Getting Started Turning on, logging/capture an event, and turning off
4
Turning on, logging/capture an event, and turning off
To quickly get you started with the QUESTempº 48N, the following section explains
turning on the instrument, data logging/event logging, and stopping.
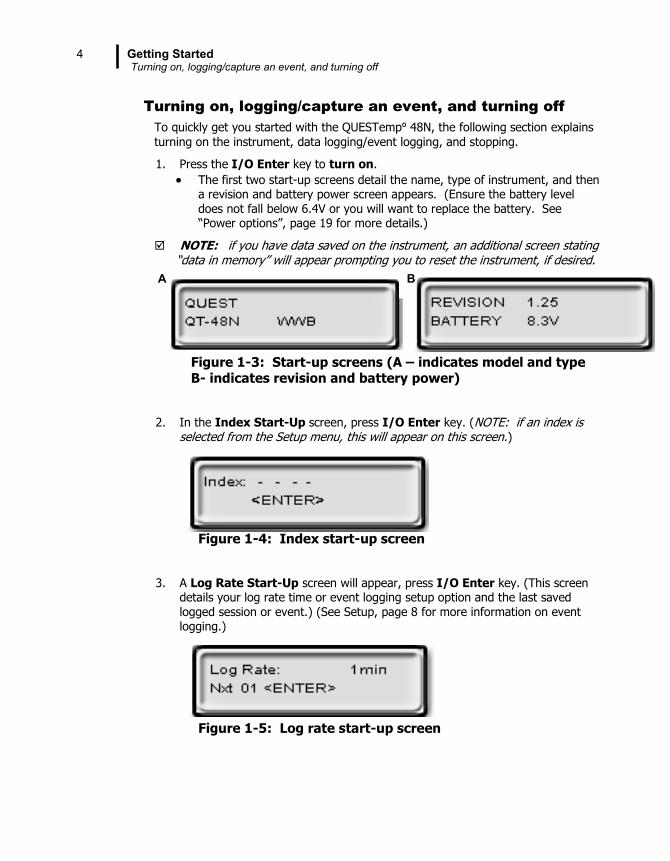
1. Press the I/O Enter key to turn on.
The first two start-up screens detail the name, type of instrument, and then a revision and battery power screen appears. (Ensure the battery level does not fall below 6.4V or you will want to replace the battery. See “Power options”, page 19 for more details.)
NOTE: if you have data saved on the instrument, an additional screen stating “data in memory” will appear prompting you to reset the instrument, if desired.
Figure 1-3: Start-up screens (A – indicates model and type B- indicates revision and battery power)
2. In the Index Start-Up screen, press I/O Enter key. (NOTE: if an index is selected from the Setup menu, this will appear on this screen.)
Figure 1-4: Index start-up screen
3. A Log Rate Start-Up screen will appear, press I/O Enter key. (This screen details your log rate time or event logging setup option and the last saved logged session or event.) (See Setup, page 8 for more information on event logging.)
Figure 1-5: Log rate start-up screen
A B
Getting Started Turning on, logging/capture an event, and turning off
5
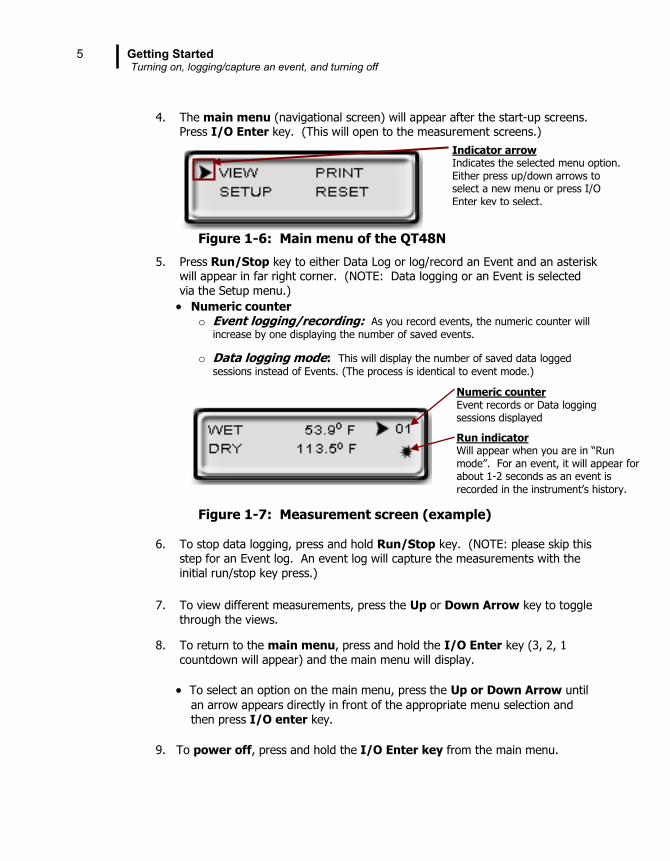
4. The main menu (navigational screen) will appear after the start-up screens.
Press I/O Enter key. (This will open to the measurement screens.)
Figure 1-6: Main menu of the QT48N
5. Press Run/Stop key to either Data Log or log/record an Event and an asterisk will appear in far right corner. (NOTE: Data logging or an Event is selected via the Setup menu.)
Numeric counter o Event logging/recording: As you record events, the numeric counter will
increase by one displaying the number of saved events.
o Data logging mode: This will display the number of saved data logged
sessions instead of Events. (The process is identical to event mode.)
Figure 1-7: Measurement screen (example) 6. To stop data logging, press and hold Run/Stop key. (NOTE: please skip this
step for an Event log. An event log will capture the measurements with the initial run/stop key press.)
7. To view different measurements, press the Up or Down Arrow key to toggle through the views.
8. To return to the main menu, press and hold the I/O Enter key (3, 2, 1 countdown will appear) and the main menu will display.
To select an option on the main menu, press the Up or Down Arrow until
an arrow appears directly in front of the appropriate menu selection and
then press I/O enter key.
9. To power off, press and hold the I/O Enter key from the main menu.
Indicator arrow Indicates the selected menu option. Either press up/down arrows to select a new menu or press I/O Enter key to select.
Run indicator Will appear when you are in “Run mode”. For an event, it will appear for about 1-2 seconds as an event is
recorded in the instrument’s history.
Numeric counter Event records or Data logging sessions displayed
Sensors Globe Thermometer
6
Sensors
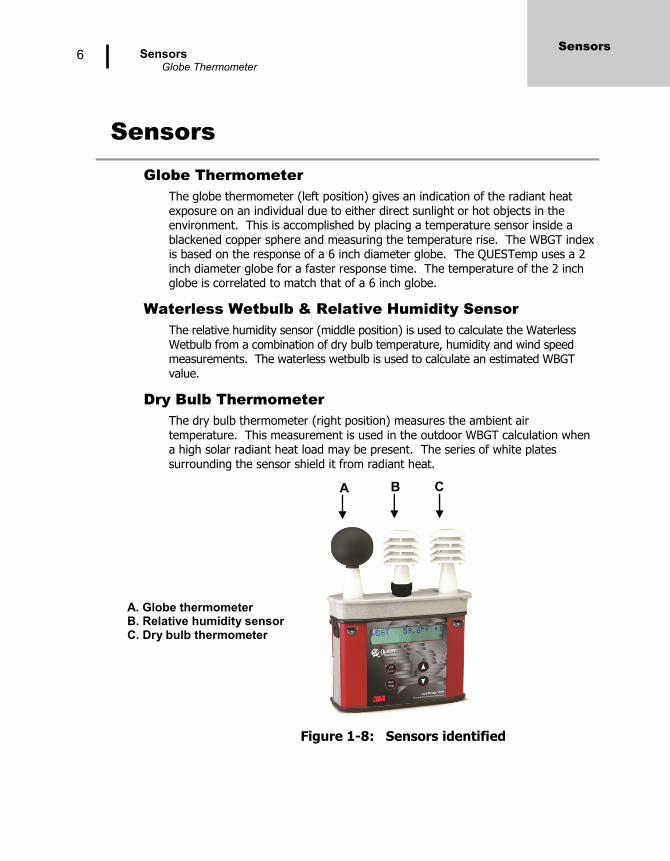
Globe Thermometer
The globe thermometer (left position) gives an indication of the radiant heat exposure on an individual due to either direct sunlight or hot objects in the environment. This is accomplished by placing a temperature sensor inside a
blackened copper sphere and measuring the temperature rise. The WBGT index is based on the response of a 6 inch diameter globe. The QUESTemp uses a 2 inch diameter globe for a faster response time. The temperature of the 2 inch globe is correlated to match that of a 6 inch globe.
Waterless Wetbulb & Relative Humidity Sensor
The relative humidity sensor (middle position) is used to calculate the Waterless Wetbulb from a combination of dry bulb temperature, humidity and wind speed measurements. The waterless wetbulb is used to calculate an estimated WBGT value.
Dry Bulb Thermometer
The dry bulb thermometer (right position) measures the ambient air temperature. This measurement is used in the outdoor WBGT calculation when a high solar radiant heat load may be present. The series of white plates surrounding the sensor shield it from radiant heat.
Figure 1-8: Sensors identified
A. Globe thermometer B. Relative humidity sensor C. Dry bulb thermometer
Sensors
A B C
Measurements WetBulb Globe Temperature (WBGT)
7
Measurements
The QUESTemp 48N data logging, with an event logging mode, heat stress monitor directly senses three parameters: dry bulb temperature (DB), globe temperature (G), and relative humidity (RH). It computes the Wet Bulb (WB), the Wet Bulb Globe Temperature (WBGT), and the
Stay Times Indices for ACGIH, U.S. Navy PHEL charts, and Flag Conditions for U.S. Navy/Marine Corp. Ashore.
WetBulb Globe Temperature (WBGT)
The WBGT is a type of temperature index which combines the effects of temperature, humidity, radiant heat, and air flow and provides a relatively simplistic tool to analyze thermal comfort. The resulting WBGT values can then be compared to indices of work-rest regimens (stay times) based upon workloads.
The WBGT calculation is a weighted average of the three temperature sensors using the following formulas:
Stay Times/Rest Times (Indicies)
Stay Times Indices represent how long a worker should be able to safely work under heat stress conditions. Select one of four indices for displaying and printing from the unit: ACGIH Stay Times, NAVY PHEL’s, or Flag Conditions for U.S. Navy/Marine Corp. Ashore. Refer to Appendix B for more information on the indices. NOTE: it will appear as “Index” on the measurement screen.
Remote measurements
The top sensor bar may be removed from the instrument and used through a remote cable. (Please refer to Appendix C for remote cable options.) Shelter the instrument and remote the sensor bar if the measured environment is
expecting heavy rain or if temperatures are above 60C.
**NOTE: Navy and Marine calculations are all based on the outdoor computation.
WBGT (outdoor) = 0.7WB + 0.2G + 0.1DB (denoted as “WBGT” on the display)
Measurements
Operating QUESTempº 48N View
8
Operating QUESTempº 48N
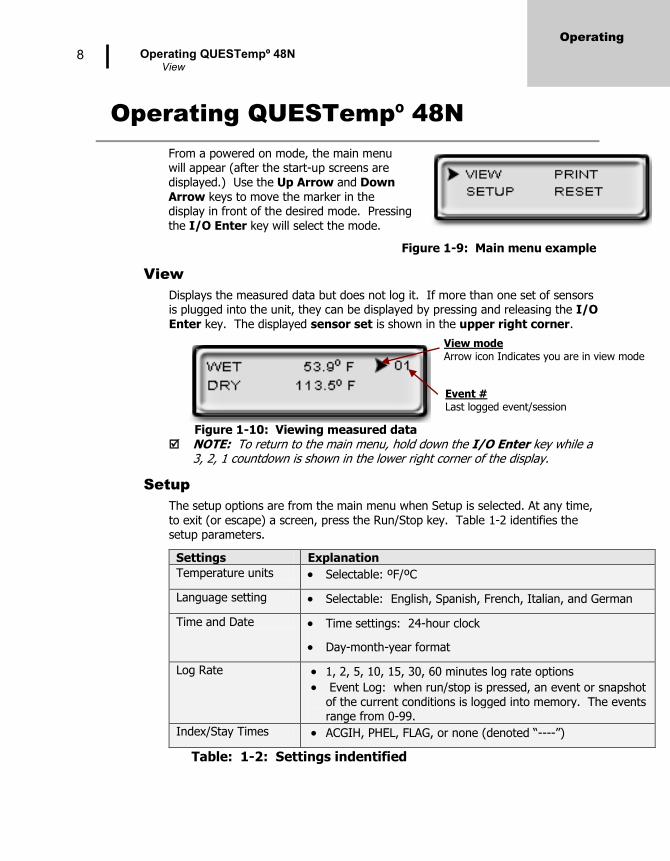
From a powered on mode, the main menu will appear (after the start-up screens are displayed.) Use the Up Arrow and Down Arrow keys to move the marker in the display in front of the desired mode. Pressing the I/O Enter key will select the mode.
Figure 1-9: Main menu example
View
Displays the measured data but does not log it. If more than one set of sensors is plugged into the unit, they can be displayed by pressing and releasing the I/O Enter key. The displayed sensor set is shown in the upper right corner.
Figure 1-10: Viewing measured data NOTE: To return to the main menu, hold down the I/O Enter key while a
3, 2, 1 countdown is shown in the lower right corner of the display.
Setup
The setup options are from the main menu when Setup is selected. At any time, to exit (or escape) a screen, press the Run/Stop key. Table 1-2 identifies the setup parameters.
Settings Explanation Temperature units Selectable: ºF/ºC
Language setting Selectable: English, Spanish, French, Italian, and German
Time and Date Time settings: 24-hour clock
Day-month-year format
Log Rate 1, 2, 5, 10, 15, 30, 60 minutes log rate options
Event Log: when run/stop is pressed, an event or snapshot of the current conditions is logged into memory. The events range from 0-99.
Index/Stay Times ACGIH, PHEL, FLAG, or none (denoted “----”)
Table: 1-2: Settings indentified
View mode
Arrow icon Indicates you are in view mode
Operating
Event #
Last logged event/session
Operating QUESTempº 48N Setup
9
Selecting Setup parameters
1. From the main menu, select Setup by pressing the I/O Enter key. Using the Up/Down Arrow keys, select the settings in steps 2-6.
Figure 1-11: Selecting temperature setting and setup
2. For the Time and Date settings, once selected, press I/O Enter key to move to the update field. (An underline will appear under the first field.) Press Up/Down Arrows to change the number/month. Press I/O
Enter key to toggle through each field. Repeat as necessary until all values are selected.
3. For the Temperature setting, either Fahrenheit or Celsius will appear. Press the Up/Down Arrow to select and I/O Enter key to change.
Figure 1-12: Selecting temperature setting 4. For the Language setting, once selected, press I/O Enter key. To select a
language, press Up/Down Arrow keys. Once selected, press Run/Stop key to return to setup parameters.
5. For the Log Rate, once selected, press I/O Enter key.
Repeatedly press I/O Enter keys to select either the Log Rate Event or a Log Rate interval (for data logging; e.g. “5”).
Optional: changing Next Event field. Events are numbered starting at 1 and incrementing. The number may be increased to simulate skipping events. This may be useful if the events represent locations
and the starting location is somewhere other than 1.
Figure 1-13: Selecting log rate with event log
6. For the Index setting, once selected press I/O Enter key. Press
Up/Down Arrow keys to select: “---” (which is equivalent for no index), ACGIH, PHEL, or Flag.
7. Exit Setup by pressing the Run/Stop key.
Next event number *To increase, press up arrow key (used to simulate skipping an event.)
Event Example of setting Log Rate
to Event Log
Operating:
Setup
Temperature setting – press I/O Enter key to switch between values.
Press I/O Enter key to select Setup.
Operating QUESTempº 48N Print
10
Allows printing to a parallel or serial printer or to a computer. The QUESTempº
48N will recognize the cable plugged in and configure itself for serial or parallel. If no cable is plugged in, it will default to serial. Press I/O Enter key to begin printing. Press Run/Stop key to return to the menu.
NOTE: if you wish to stop the printing, press I/O Enter key until you return to the main menu. When the printer has stopped printing, remove the cable from the printer to the instrument.
Reset
Resetting enables you to clear the logged data from memory. Press the I/O Enter key to enter the Reset mode. Clear the memory by holding down the I/O Enter key while the display counts down from three.
Run
For Data Logging setup, the run mode begins a session in memory and logs the data. For Event Logging, each run/stop is stored as an event and a numeric
counter displays the number of saved events.
1. Begin a session by pressing the Run/Stop key from the view mode (or measurement view). An asterisk in the lower right corner indicates the run mode.
To toggle through the views, press the Up or Down Arrow.
Figure 1-14: Run mode indicator
2. End the session by pressing the Run/Stop key again. (The session will stop recording when the asterisk is no longer displayed.)
NOTE: If the logging memory is full or if there are no sensors plugged into the unit, attempting to enter the Run mode will result in an error message. If the memory capacity is exceeded, the asterisk in the lower right corner of the display will turn into an “F” and the memory remaining screen will show “0.0”.
Run indicator
Operating:
Print, reset, run
Displayed Items Run
11
Displayed Items
For the QUESTemp 48N, the number in the upper right corner indicates the
saved session or the saved event log. “1”indicates the sensor bar placed on (or attached to) the top of the
instrument. Sensors 2 and 3 are labeled on the side of the unit as
“Sensor 2”, and “Sensor 3”.
An “*” asterisk in the lower right corner indicates that the unit is in the run mode and is logging data or saves an event.
The following measurements can be accessed on the display:
Screen 1: WET (Wet bulb) DRY (Dry bulb)
Figure 1-15: Wet and Dry screen Screen 2: GLOBE and RH
Figure 1-16: Globe and RH screen Screen 3: WBGT
Figure 1-17: WBGT screen Screen 4: Time (24 hour format) Date (day, month, year)
Figure 1-18: Time and Date screen
Displayed items
Displayed Items Stay Time/Index
12
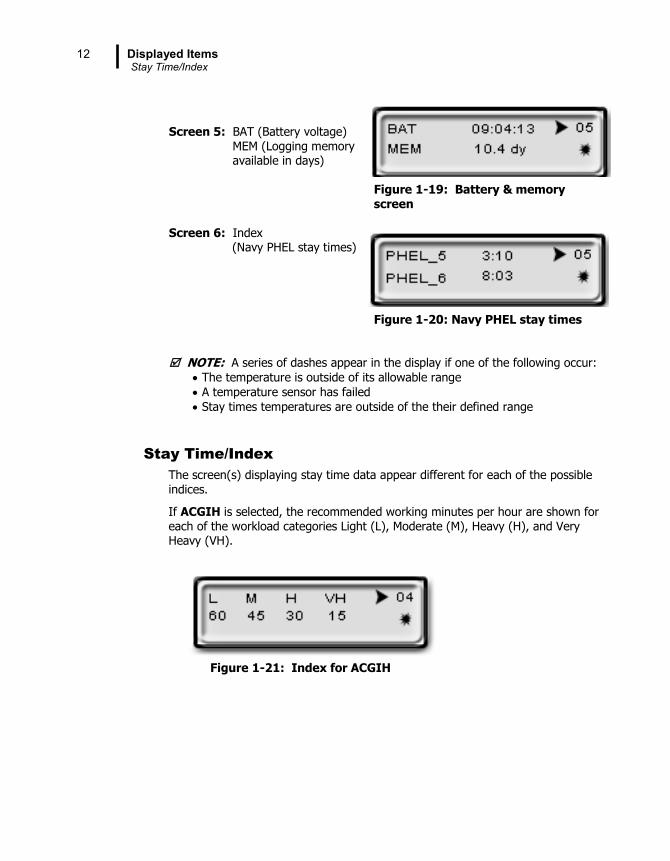
Screen 5: BAT (Battery voltage) MEM (Logging memory available in days) Figure 1-19: Battery & memory
screen
Screen 6: Index (Navy PHEL stay times)
Figure 1-20: Navy PHEL stay times
NOTE: A series of dashes appear in the display if one of the following occur:
The temperature is outside of its allowable range
A temperature sensor has failed
Stay times temperatures are outside of the their defined range
Stay Time/Index
The screen(s) displaying stay time data appear different for each of the possible indices.
If ACGIH is selected, the recommended working minutes per hour are shown for each of the workload categories Light (L), Moderate (M), Heavy (H), and Very Heavy (VH).
Figure 1-21: Index for ACGIH
Data Logging Stay Time/Index
13
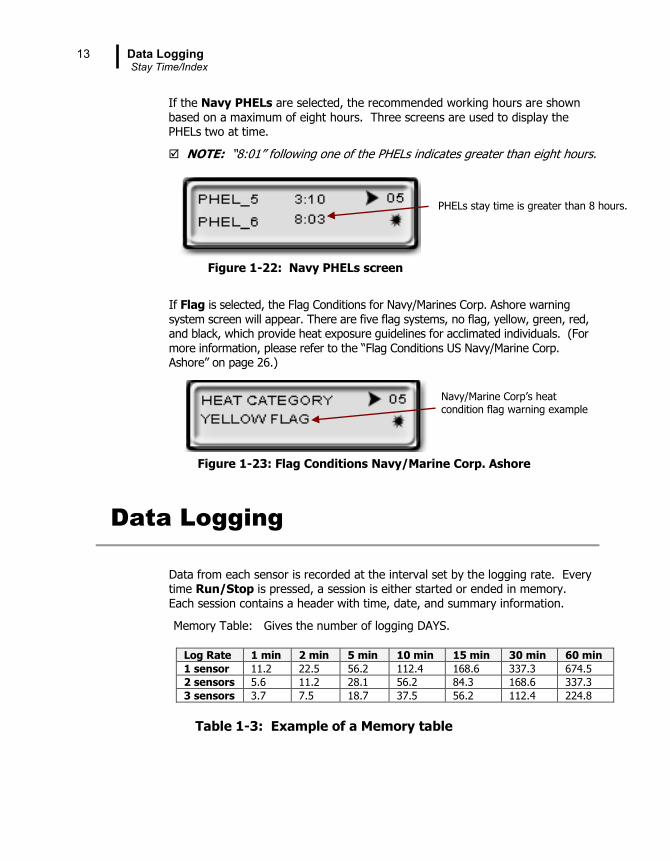
If the Navy PHELs are selected, the recommended working hours are shown based on a maximum of eight hours. Three screens are used to display the PHELs two at time.
NOTE: “8:01” following one of the PHELs indicates greater than eight hours.
Figure 1-22: Navy PHELs screen
If Flag is selected, the Flag Conditions for Navy/Marines Corp. Ashore warning system screen will appear. There are five flag systems, no flag, yellow, green, red, and black, which provide heat exposure guidelines for acclimated individuals. (For more information, please refer to the “Flag Conditions US Navy/Marine Corp. Ashore” on page 26.)
Figure 1-23: Flag Conditions Navy/Marine Corp. Ashore
Data Logging
Data from each sensor is recorded at the interval set by the logging rate. Every time Run/Stop is pressed, a session is either started or ended in memory. Each session contains a header with time, date, and summary information.
Memory Table: Gives the number of logging DAYS.
Log Rate 1 min 2 min 5 min 10 min 15 min 30 min 60 min
1 sensor 11.2 22.5 56.2 112.4 168.6 337.3 674.5
2 sensors 5.6 11.2 28.1 56.2 84.3 168.6 337.3
3 sensors 3.7 7.5 18.7 37.5 56.2 112.4 224.8
Table 1-3: Example of a Memory table
Navy/Marine Corp’s heat condition flag warning example
PHELs stay time is greater than 8 hours.
Electronic sensor check Performing an electronic sensor check
14
Electronic sensor check
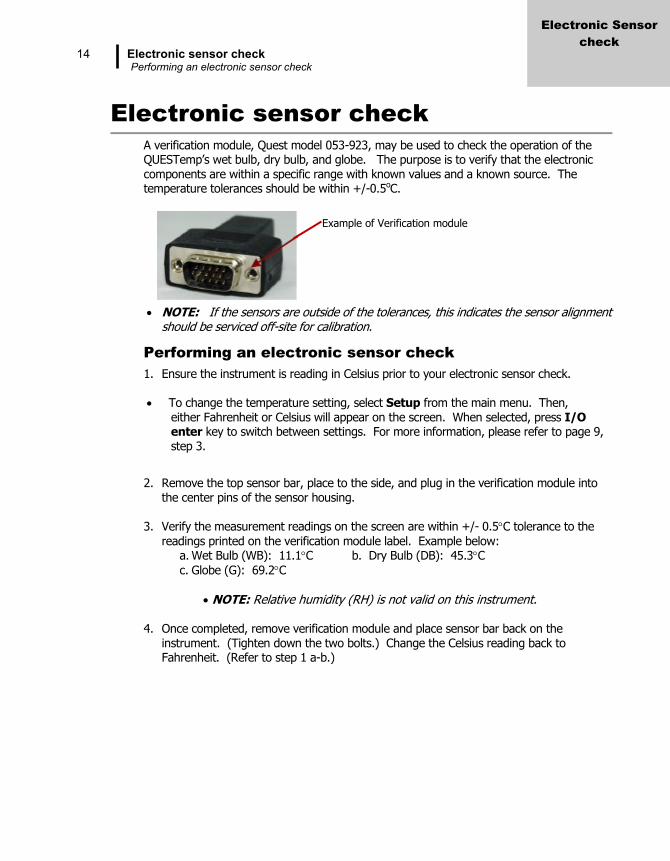
A verification module, Quest model 053-923, may be used to check the operation of the QUESTemp’s wet bulb, dry bulb, and globe. The purpose is to verify that the electronic components are within a specific range with known values and a known source. The temperature tolerances should be within +/-0.5oC.
NOTE: If the sensors are outside of the tolerances, this indicates the sensor alignment should be serviced off-site for calibration.
Performing an electronic sensor check
1. Ensure the instrument is reading in Celsius prior to your electronic sensor check.
To change the temperature setting, select Setup from the main menu. Then, either Fahrenheit or Celsius will appear on the screen. When selected, press I/O enter key to switch between settings. For more information, please refer to page 9, step 3.
2. Remove the top sensor bar, place to the side, and plug in the verification module into the center pins of the sensor housing.
3. Verify the measurement readings on the screen are within +/- 0.5C tolerance to the
readings printed on the verification module label. Example below: a. Wet Bulb (WB): 11.1C b. Dry Bulb (DB): 45.3C
c. Globe (G): 69.2C
NOTE: Relative humidity (RH) is not valid on this instrument.
4. Once completed, remove verification module and place sensor bar back on the instrument. (Tighten down the two bolts.) Change the Celsius reading back to Fahrenheit. (Refer to step 1 a-b.)
Electronic Sensor
check
Example of Verification module
Sensor Alignment RH Sensor Alignment
15
Sensor Alignment
For highly accurate measurement readings, you should align your QUESTempº 48N prior to
data logging or event logging/recording. For the RH sensor, it is recommended to align with a High concentration level using the 75% sensor salt, NaCl (sodium chloride), or a Low concentration level using the, the 33% sensor salt, MgCl (magnesium chloride). (To order sensor alignment salts, refer to an online vendor such as, colepalmer.com.)
RH Sensor Alignment
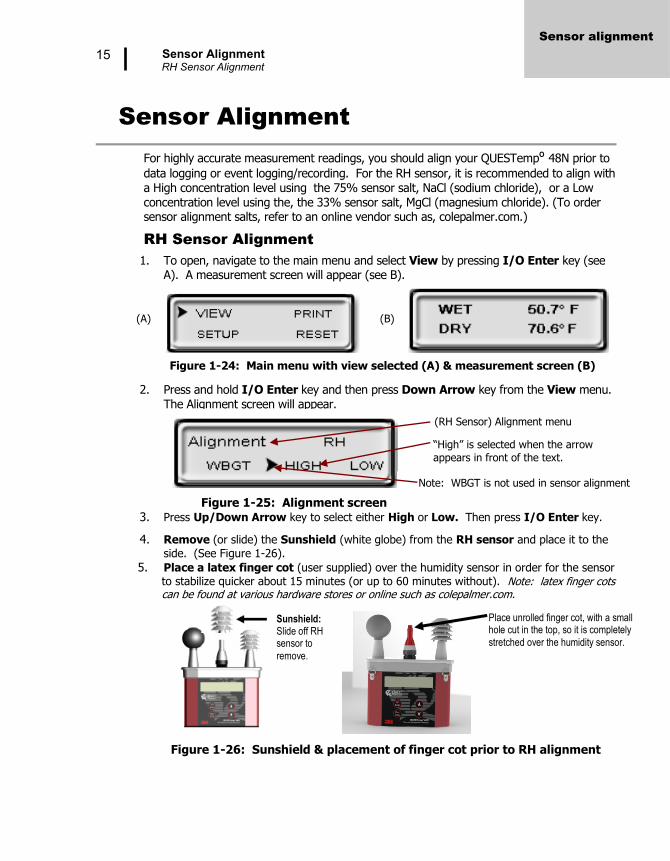
1. To open, navigate to the main menu and select View by pressing I/O Enter key (see A). A measurement screen will appear (see B).
Figure 1-24: Main menu with view selected (A) & measurement screen (B)
2. Press and hold I/O Enter key and then press Down Arrow key from the View menu. The Alignment screen will appear.
Figure 1-25: Alignment screen
3. Press Up/Down Arrow key to select either High or Low. Then press I/O Enter key.
4. Remove (or slide) the Sunshield (white globe) from the RH sensor and place it to the side. (See Figure 1-26).
5. Place a latex finger cot (user supplied) over the humidity sensor in order for the sensor to stabilize quicker about 15 minutes (or up to 60 minutes without). Note: latex finger cots can be found at various hardware stores or online such as colepalmer.com.
Figure 1-26: Sunshield & placement of finger cot prior to RH alignment
“High” is selected when the arrow
appears in front of the text.
(RH Sensor) Alignment menu
Place unrolled finger cot, with a small hole cut in the top, so it is completely
stretched over the humidity sensor.
Sensor alignment
(A) (B)
Note: WBGT is not used in sensor alignment
Sunshield: Slide off RH sensor to
remove.
Sensor Alignment RH Sensor Alignment
16
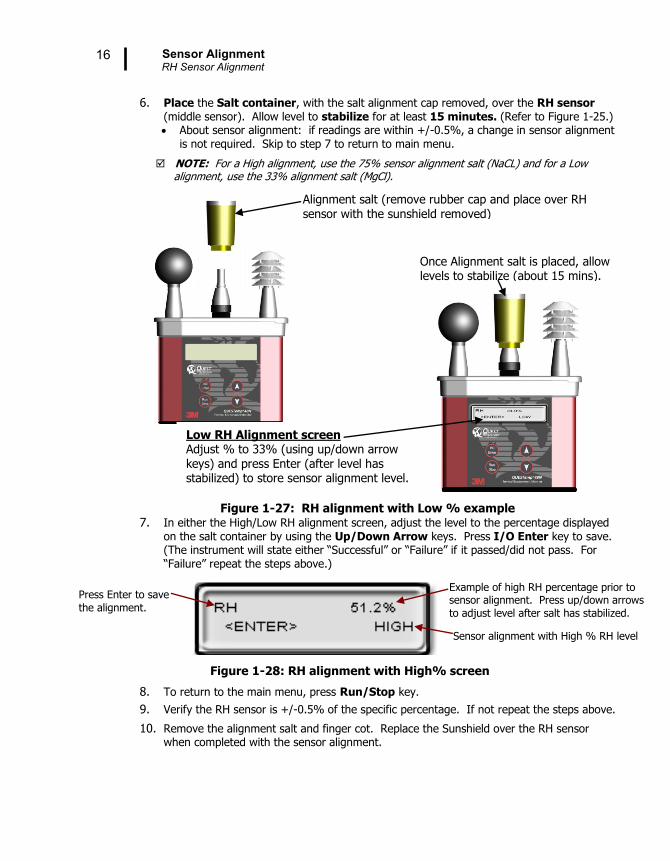
6. Place the Salt container, with the salt alignment cap removed, over the RH sensor (middle sensor). Allow level to stabilize for at least 15 minutes. (Refer to Figure 1-25.) About sensor alignment: if readings are within +/-0.5%, a change in sensor alignment
is not required. Skip to step 7 to return to main menu.
NOTE: For a High alignment, use the 75% sensor alignment salt (NaCL) and for a Low alignment, use the 33% alignment salt (MgCl).
Figure 1-27: RH alignment with Low % example
7. In either the High/Low RH alignment screen, adjust the level to the percentage displayed on the salt container by using the Up/Down Arrow keys. Press I/O Enter key to save. (The instrument will state either “Successful” or “Failure” if it passed/did not pass. For “Failure” repeat the steps above.)
Figure 1-28: RH alignment with High% screen
8. To return to the main menu, press Run/Stop key.
9. Verify the RH sensor is +/-0.5% of the specific percentage. If not repeat the steps above.
10. Remove the alignment salt and finger cot. Replace the Sunshield over the RH sensor when completed with the sensor alignment.
Example of high RH percentage prior to sensor alignment. Press up/down arrows
to adjust level after salt has stabilized.
Sensor alignment with High % RH level
Press Enter to save
the alignment.
Alignment salt (remove rubber cap and place over RH sensor with the sunshield removed)
Once Alignment salt is placed, allow levels to stabilize (about 15 mins).
Low RH Alignment screen Adjust % to 33% (using up/down arrow keys) and press Enter (after level has stabilized) to store sensor alignment level.
Printing Data/Communications
17
Printing
Printing options include to a RS-232 port or to a parallel printer. Serial transmission requires Quest cable #54-715. Parallel transmission requires Quest cable #56-875. With the applicable cable plugged in, select PRINT from the menu and press the I/O Enter key to enter the PRINT mode. Begin printing by pressing the I/O Enter key. Press the key again to abort the printing.
Data/Communications
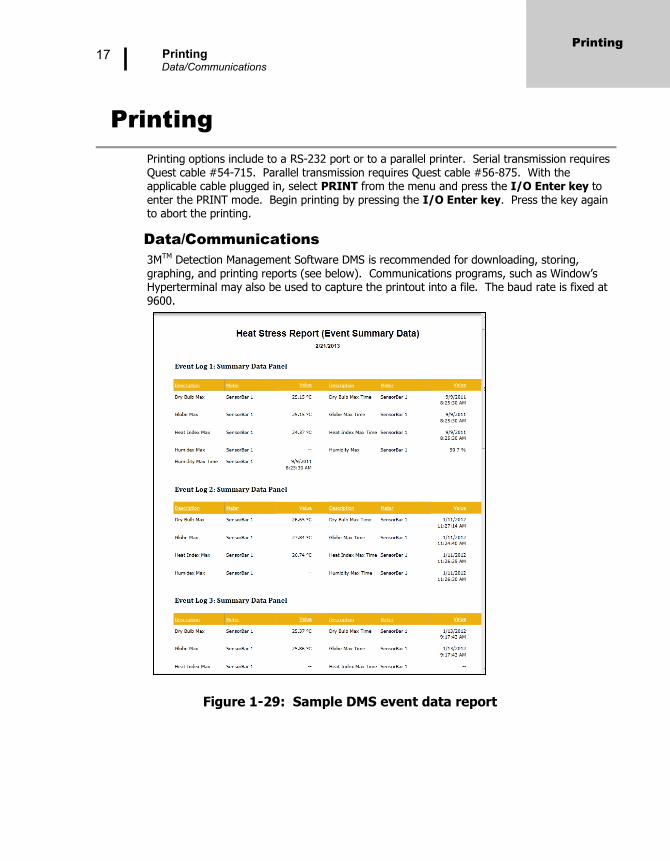
3MTM Detection Management Software DMS is recommended for downloading, storing, graphing, and printing reports (see below). Communications programs, such as Window’s Hyperterminal may also be used to capture the printout into a file. The baud rate is fixed at 9600.
Figure 1-29: Sample DMS event data report
Printing
Printing Parallel
18
Parallel
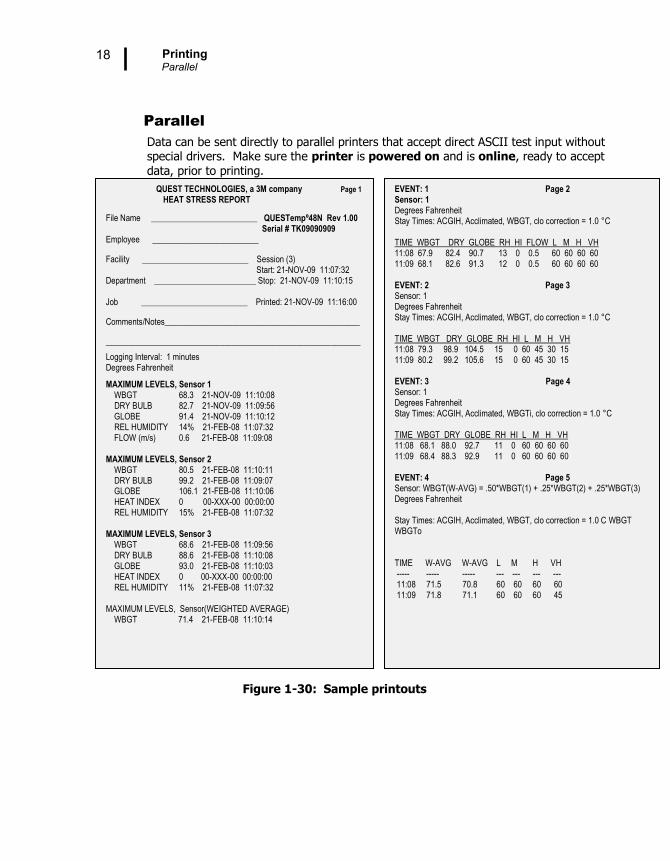
Data can be sent directly to parallel printers that accept direct ASCII test input without special drivers. Make sure the printer is powered on and is online, ready to accept data, prior to printing.
Figure 1-30: Sample printouts
EVENT: 1 Page 2 Sensor: 1 Degrees Fahrenheit Stay Times: ACGIH, Acclimated, WBGT, clo correction = 1.0 °C TIME WBGT DRY GLOBE RH HI FLOW L M H VH 11:08 67.9 82.4 90.7 13 0 0.5 60 60 60 60 11:09 68.1 82.6 91.3 12 0 0.5 60 60 60 60
EVENT: 2 Page 3 Sensor: 1 Degrees Fahrenheit Stay Times: ACGIH, Acclimated, WBGT, clo correction = 1.0 °C TIME WBGT DRY GLOBE RH HI L M H VH 11:08 79.3 98.9 104.5 15 0 60 45 30 15 11:09 80.2 99.2 105.6 15 0 60 45 30 15
EVENT: 3 Page 4 Sensor: 1 Degrees Fahrenheit Stay Times: ACGIH, Acclimated, WBGTi, clo correction = 1.0 °C TIME WBGT DRY GLOBE RH HI L M H VH 11:08 68.1 88.0 92.7 11 0 60 60 60 60 11:09 68.4 88.3 92.9 11 0 60 60 60 60
EVENT: 4 Page 5 Sensor: WBGT(W-AVG) = .50*WBGT(1) + .25*WBGT(2) + .25*WBGT(3) Degrees Fahrenheit Stay Times: ACGIH, Acclimated, WBGT, clo correction = 1.0 C WBGT WBGTo TIME W-AVG W-AVG L M H VH ----- ----- ----- --- --- --- --- 11:08 71.5 70.8 60 60 60 60 11:09 71.8 71.1 60 60 60 45
QUEST TECHNOLOGIES, a 3M company Page 1 HEAT STRESS REPORT
File Name _________________________ QUESTempº48N Rev 1.00 Serial # TK09090909 Employee _________________________ Facility _________________________ Session (3) Start: 21-NOV-09 11:07:32 Department ________________________ Stop: 21-NOV-09 11:10:15 Job _________________________ Printed: 21-NOV-09 11:16:00
Comments/Notes______________________________________________
____________________________________________________________
Logging Interval: 1 minutes Degrees Fahrenheit
MAXIMUM LEVELS, Sensor 1 WBGT 68.3 21-NOV-09 11:10:08 DRY BULB 82.7 21-NOV-09 11:09:56 GLOBE 91.4 21-NOV-09 11:10:12 REL HUMIDITY 14% 21-FEB-08 11:07:32 FLOW (m/s) 0.6 21-FEB-08 11:09:08 MAXIMUM LEVELS, Sensor 2 WBGT 80.5 21-FEB-08 11:10:11 DRY BULB 99.2 21-FEB-08 11:09:07 GLOBE 106.1 21-FEB-08 11:10:06 HEAT INDEX 0 00-XXX-00 00:00:00 REL HUMIDITY 15% 21-FEB-08 11:07:32 MAXIMUM LEVELS, Sensor 3 WBGT 68.6 21-FEB-08 11:09:56 DRY BULB 88.6 21-FEB-08 11:10:08 GLOBE 93.0 21-FEB-08 11:10:03 HEAT INDEX 0 00-XXX-00 00:00:00 REL HUMIDITY 11% 21-FEB-08 11:07:32 MAXIMUM LEVELS, Sensor(WEIGHTED AVERAGE) WBGT 71.4 21-FEB-08 11:10:14
Powering 9-Volt Alkaline Battery Replacement
19
Powering
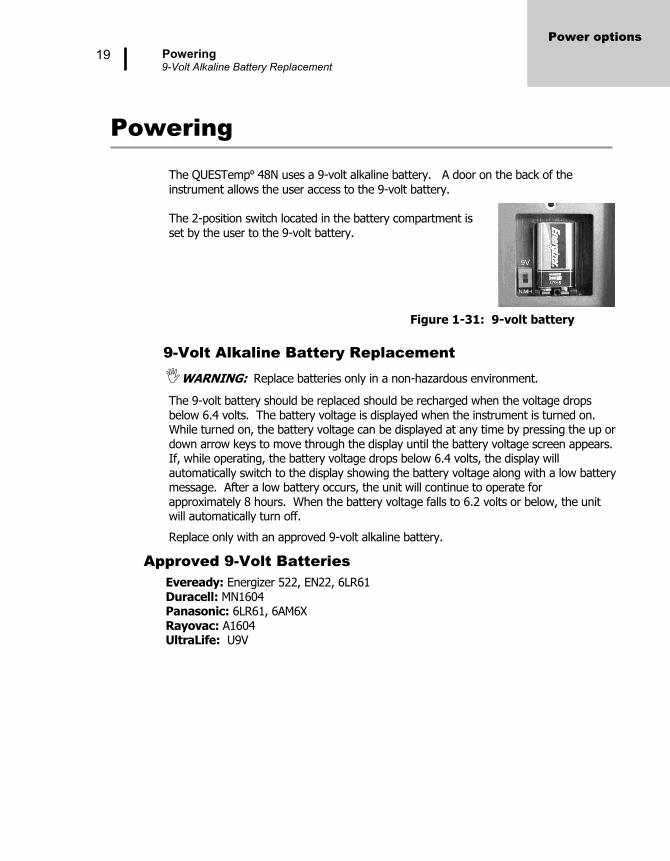
The QUESTempº 48N uses a 9-volt alkaline battery. A door on the back of the
instrument allows the user access to the 9-volt battery. The 2-position switch located in the battery compartment is
set by the user to the 9-volt battery.
Figure 1-31: 9-volt battery
9-Volt Alkaline Battery Replacement
WARNING: Replace batteries only in a non-hazardous environment.
The 9-volt battery should be replaced should be recharged when the voltage drops below 6.4 volts. The battery voltage is displayed when the instrument is turned on. While turned on, the battery voltage can be displayed at any time by pressing the up or down arrow keys to move through the display until the battery voltage screen appears. If, while operating, the battery voltage drops below 6.4 volts, the display will automatically switch to the display showing the battery voltage along with a low battery message. After a low battery occurs, the unit will continue to operate for approximately 8 hours. When the battery voltage falls to 6.2 volts or below, the unit will automatically turn off.
Replace only with an approved 9-volt alkaline battery.
Approved 9-Volt Batteries
Eveready: Energizer 522, EN22, 6LR61 Duracell: MN1604 Panasonic: 6LR61, 6AM6X Rayovac: A1604 UltraLife: U9V
Power options
Appendix A: Specifications Approved 9-Volt Batteries
20
Appendix A: Specifications
Measurements
Globe Temperature, Dry Bulb Temperature, Wet Bulb Temperature, % Relative Humidity, and WBGT Index
Temperatures given in Celsius or Fahrenheit
Index (displayed stay time with selected index): ACGIH TLV, U.S. Navy PHEL Charts, Flag Conditions for U.S. Navy/Marine Corp. Ashore
Data Logging mode and Event logging mode Data logging mode records and prints all measurements at user selected interval of 1, 2, 5, 10, 15, 30, or 60 minutes. Event logging mode (1 second record) 128K bytes of data memory.
Languages English, French, Spanish, Italian, German
Sensors Dry Bulb Sensor- 1000 Ohm Platinum RTD
Accuracy and Ranges: +/-0.5 from 0°C to 120°C (+/-0.9°F from 32°F to 248°F)
Waterless Wet Bulb (Humidity) Sensor
Accuracy and Ranges: Expanded measurement uncertainty of 1.1°C (k=2) between 0°C and 80°C (32°F and 176°F)
Globe Sensor- 1000 Ohm Platinum RTD
Accuracy and Ranges: +/-0.5 from 0°C to 120°C (+/-0.9°F from 32°F to 248°F)
Relative Humidity Sensor - Integrated circuit with capacitive polymer sensor
Accuracy and Ranges: +/-5% from 20 to 95% (non-condensing)
Operating Temperature Range Sensor Assembly: -5C to +100C
Electronics: -5C to 60C
Housing Designed water resistant to a light rain or mist. If rain is frequent, best practice would be to remote the sensor bar and keep the instrument sheltered.
Appendix A
Appendix A: Specifications Approved 9-Volt Batteries
21
Size Height 9.2in (23.5cm); Width 7.2in (18.3mm); Depth 3.0in (7.5mm) Dimensions include mounted sensor assembly
Weight
2.6 lbs. (1.2 kg) with mounted sensor assembly
Remote Sensor Bar
Using a cable, the top sensor bar can be setup for remote measurements, up to 200 feet (61m).
Power 9V alkaline
Battery Life
9V alkaline: 80 hours
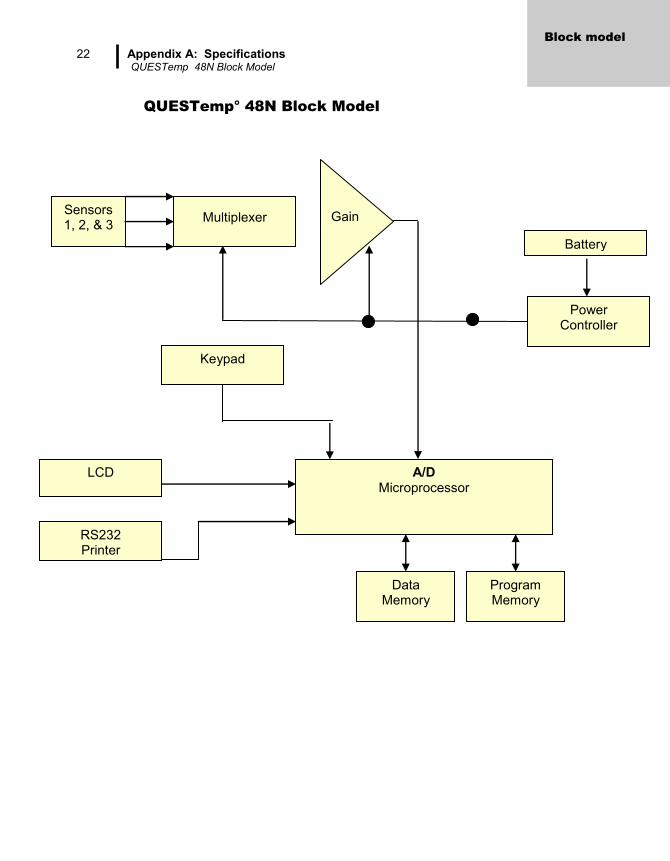
Appendix A: Specifications QUESTemp 48N Block Model
22
QUESTemp° 48N Block Model
Sensors 1, 2, & 3
Multiplexer Gain
Keypad
A/D Microprocessor
LCD
RS232 Printer
Power Controller
Battery
Data Memory
Program Memory
Block model
Appendix B ACGIH
23
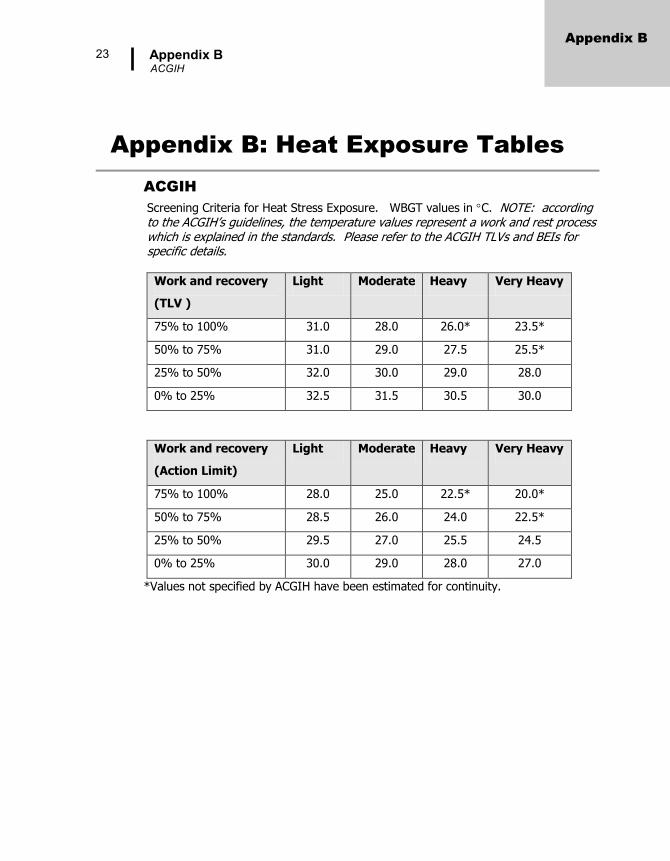
Appendix B: Heat Exposure Tables
ACGIH
Screening Criteria for Heat Stress Exposure. WBGT values in C. NOTE: according to the ACGIH’s guidelines, the temperature values represent a work and rest process which is explained in the standards. Please refer to the ACGIH TLVs and BEIs for specific details.
Work and recovery
(TLV )
Light Moderate Heavy Very Heavy
75% to 100% 31.0 28.0 26.0* 23.5*
50% to 75% 31.0 29.0 27.5 25.5*
25% to 50% 32.0 30.0 29.0 28.0
0% to 25% 32.5 31.5 30.5 30.0
Work and recovery
(Action Limit)
Light Moderate Heavy Very Heavy
75% to 100% 28.0 25.0 22.5* 20.0*
50% to 75% 28.5 26.0 24.0 22.5*
25% to 50% 29.5 27.0 25.5 24.5
0% to 25% 30.0 29.0 28.0 27.0
*Values not specified by ACGIH have been estimated for continuity.
Appendix B
Power Controller
Battery
Program Memory
Appendix B ACGIH Clothing Corrections
24
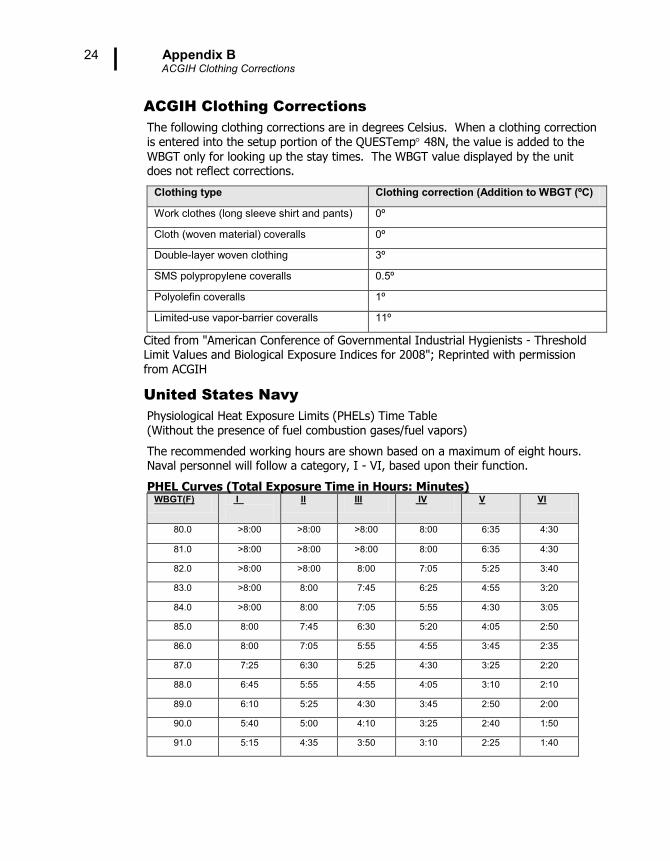
ACGIH Clothing Corrections
The following clothing corrections are in degrees Celsius. When a clothing correction is entered into the setup portion of the QUESTemp 48N, the value is added to the
WBGT only for looking up the stay times. The WBGT value displayed by the unit does not reflect corrections.
Clothing type Clothing correction (Addition to WBGT (ºC)
Work clothes (long sleeve shirt and pants) 0º
Cloth (woven material) coveralls 0º
Double-layer woven clothing 3º
SMS polypropylene coveralls 0.5º
Polyolefin coveralls 1º
Limited-use vapor-barrier coveralls 11º
Cited from "American Conference of Governmental Industrial Hygienists - Threshold Limit Values and Biological Exposure Indices for 2008"; Reprinted with permission from ACGIH
United States Navy
Physiological Heat Exposure Limits (PHELs) Time Table (Without the presence of fuel combustion gases/fuel vapors)
The recommended working hours are shown based on a maximum of eight hours. Naval personnel will follow a category, I - VI, based upon their function.
PHEL Curves (Total Exposure Time in Hours: Minutes) WBGT(F) I
II III IV V VI
80.0 >8:00 >8:00 >8:00 8:00 6:35 4:30
81.0 >8:00 >8:00 >8:00 8:00 6:35 4:30
82.0 >8:00 >8:00 8:00 7:05 5:25 3:40
83.0 >8:00 8:00 7:45 6:25 4:55 3:20
84.0 >8:00 8:00 7:05 5:55 4:30 3:05
85.0 8:00 7:45 6:30 5:20 4:05 2:50
86.0 8:00 7:05 5:55 4:55 3:45 2:35
87.0 7:25 6:30 5:25 4:30 3:25 2:20
88.0 6:45 5:55 4:55 4:05 3:10 2:10
89.0 6:10 5:25 4:30 3:45 2:50 2:00
90.0 5:40 5:00 4:10 3:25 2:40 1:50
91.0 5:15 4:35 3:50 3:10 2:25 1:40
Appendix B United States Navy
25
WBGT(F) I
II III IV V VI
92.0 4:50 4:10 3:30 2:55 2:15 1:30
93.0 4:25 3:50 3:15 2:40 2:00 1:25
94.0 4:05 3:35 3:00 2:25 1:50 1:15
95.0 3:45 3:15 2:45 2:15 1:45 1:10
96.0 3:25 3:00 2:30 2:05 1:35 1:05
97.0 3:10 2:45 2:20 1:55 1:25 1:00
98.0 2:55 2:35 2:10 1:45 1:20 0:55
99.0 2:40 2:20 2:00 1:40 1:15 0:50
100.0 2:30 2:10 1:50 1:30 1:10 0:45
101.0 2:20 2:00 1:40 1:25 1:05 0:45
102.0 2:10 1:50 1:35 1:15 1:00 0:40
103.0 2:00 1:45 1:25 1:10 0:55 0:35
104.0 1:50 1:35 1:20 1:05 0:50 0:35
105.0 1:40 1:30 1:15 1:00 0:45 0:30
106.0 1:35 1:25 1:10 0:55 0:45 0:30
107.0 1:30 1:15 1:05 0:50 0:40 0:25
108.0 1:20 1:10 1:00 0:50 0:35 0:25
109.0 1:15 1:05 0:55 0:45 0:35 0:25
110.0 1:10 1:00 0:50 0:40 0:30 0:20
111.0 1:05 1:00 0:50 0:40 0:30 0:20
112.0 1:00 0:55 0:45 0:35 0:25 0:20
113.0 0:55 0:50 0:40 0:35 0:25 0:15
114.0 0:55 0:45 0:40 0:30 0:25 0:15
115.0 0:50 0:45 0:35 0:30 0:20 0:15
116.0 0:45 0:40 0:35 0:25 0:20 0:15
117.0 0:45 0:40 0:30 0:25 0:20 0:10
118.0 0:40 0:35 0:30 0:25 0:15 0:10
119.0 0:35 0:35 0:25 0:20 0:15 0:10
120.0 0:35 0:30 0:25 0:20 0:15 0:10
121.0 0:35 0:30 0:25 0:20 0:15 0:10
122.0 0:30 0:25 0:20 0:15 0:15 0:10
123.0 0:30 0:25 0:20 0:15 0:10 0:10
124.0 0:25 0:25 0:20 0:15 0:10 0:05
Appendix B Flag Conditions for U.S. Navy/Marine Corp. Ashore
26
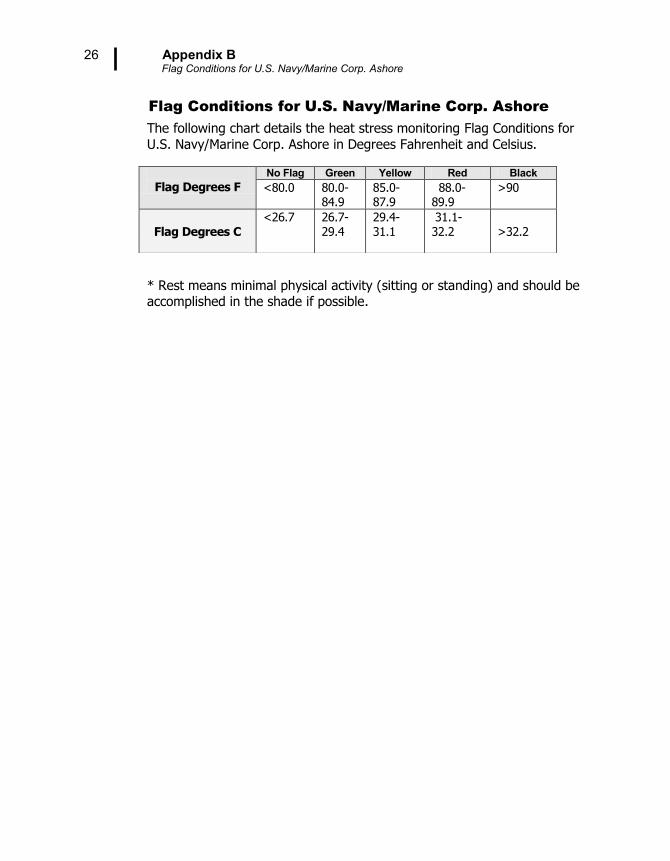
Flag Conditions for U.S. Navy/Marine Corp. Ashore
The following chart details the heat stress monitoring Flag Conditions for
U.S. Navy/Marine Corp. Ashore in Degrees Fahrenheit and Celsius.
* Rest means minimal physical activity (sitting or standing) and should be accomplished in the shade if possible.
Flag Degrees F
No Flag Green Yellow Red Black
<80.0 80.0-84.9
85.0-87.9
88.0-89.9
>90
Flag Degrees C
<26.7 26.7-29.4
29.4-31.1
31.1-32.2
>32.2
Appendix C: Accessories (sold separately)
27
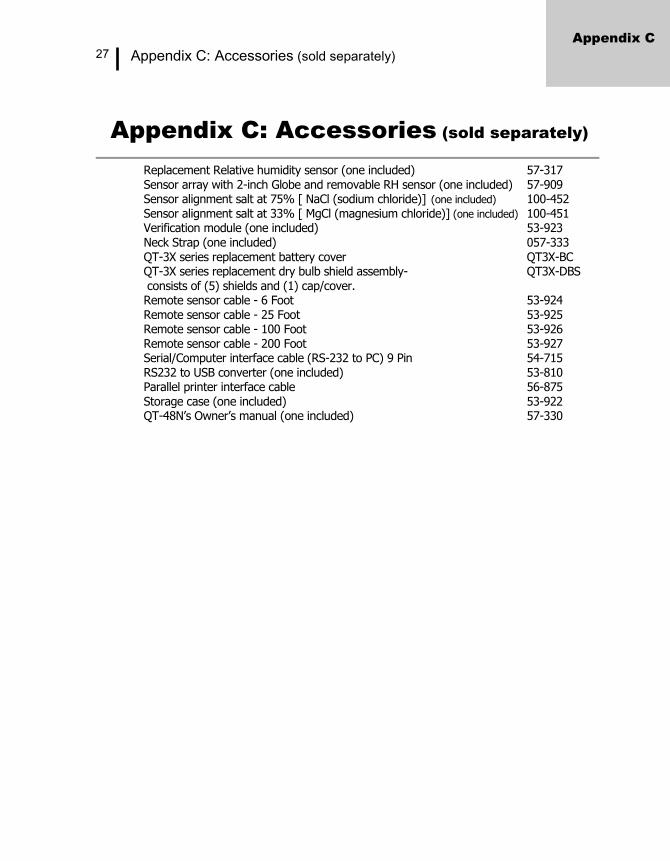
Appendix C: Accessories (sold separately)
Replacement Relative humidity sensor (one included) 57-317 Sensor array with 2-inch Globe and removable RH sensor (one included) 57-909 Sensor alignment salt at 75% [ NaCl (sodium chloride)] (one included) 100-452 Sensor alignment salt at 33% [ MgCl (magnesium chloride)] (one included) 100-451 Verification module (one included) 53-923
Neck Strap (one included) 057-333 QT-3X series replacement battery cover QT3X-BC QT-3X series replacement dry bulb shield assembly- QT3X-DBS consists of (5) shields and (1) cap/cover. Remote sensor cable - 6 Foot 53-924 Remote sensor cable - 25 Foot 53-925 Remote sensor cable - 100 Foot 53-926 Remote sensor cable - 200 Foot 53-927 Serial/Computer interface cable (RS-232 to PC) 9 Pin 54-715 RS232 to USB converter (one included) 53-810 Parallel printer interface cable 56-875
Storage case (one included) 53-922 QT-48N’s Owner’s manual (one included) 57-330
Appendix C
Appendix D: Software
28
Appendix D: Software
The QUESTemp 48N has the flexibility to be set up and controlled through
computer software. The programmable start and stop time feature is only accessible through the computer. The instrument also has the capability of sending live data while measuring. These features are best utilized using 3MTM Detection Management Software DMS.
DMS quick overview
The focus of this section is to briefly introduce the following QSP-II topics: Downloading your data, setting up parameters, and viewing your data in charts, graphs, and reports. (For further details on DMS, please refer to the online Help and select Contents.)
Communicating and Downloading in DMS
In order to download, review the data, and setup parameters in DMS software, this will require connecting the QT⁰48N to a computer. The steps below explain
connecting and communicating to DMS.
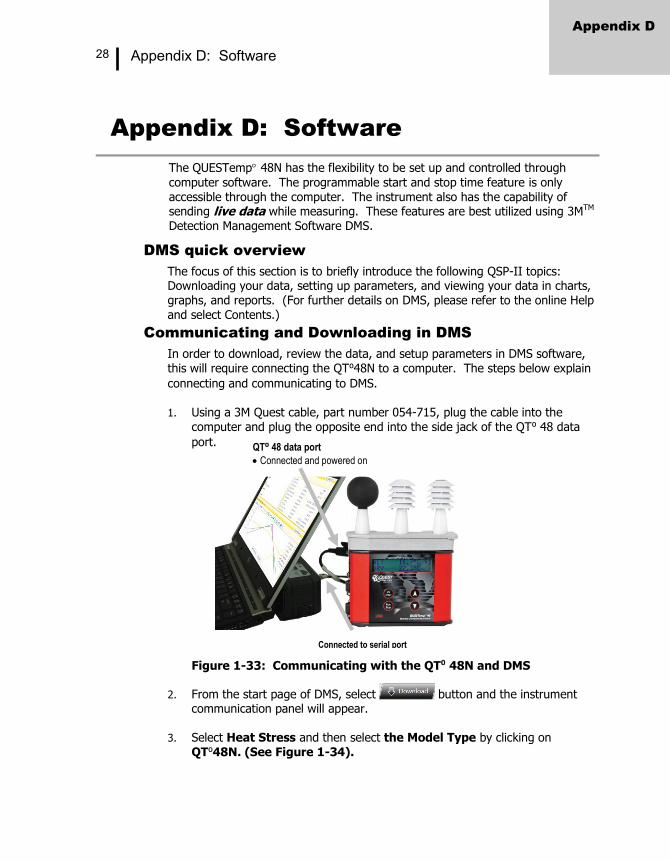
1. Using a 3M Quest cable, part number 054-715, plug the cable into the
computer and plug the opposite end into the side jack of the QT⁰ 48 data
port.
Figure 1-33: Communicating with the QT⁰ 48N and DMS
2. From the start page of DMS, select button and the instrument communication panel will appear.
3. Select Heat Stress and then select the Model Type by clicking on QT⁰48N. (See Figure 1-34).
Appendix D
QT⁰ 48 data port
Connected and powered on
Connected to serial port
Appendix D: Software Data Finder and quick reports
29
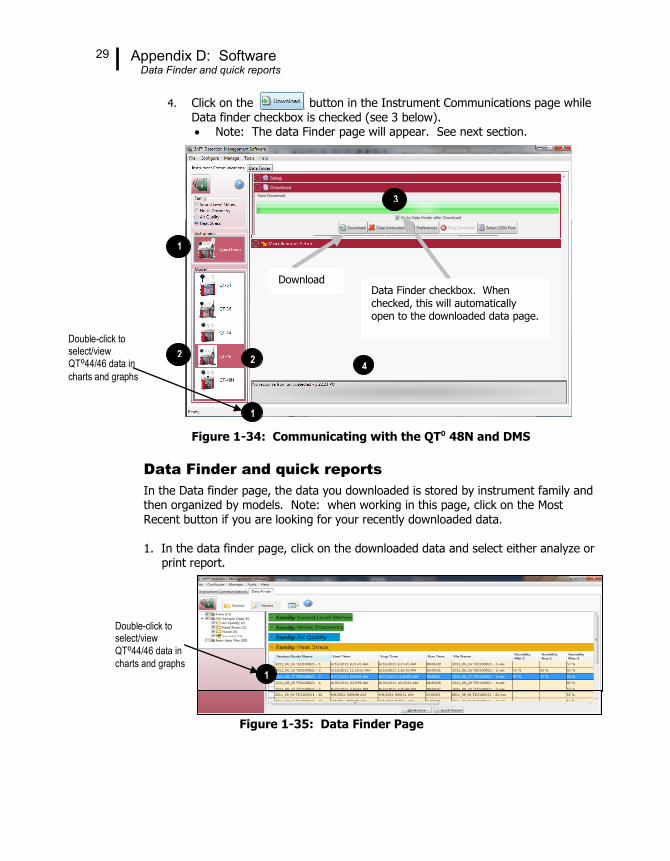
4. Click on the button in the Instrument Communications page while Data finder checkbox is checked (see 3 below). Note: The data Finder page will appear. See next section.
Figure 1-34: Communicating with the QT⁰ 48N and DMS
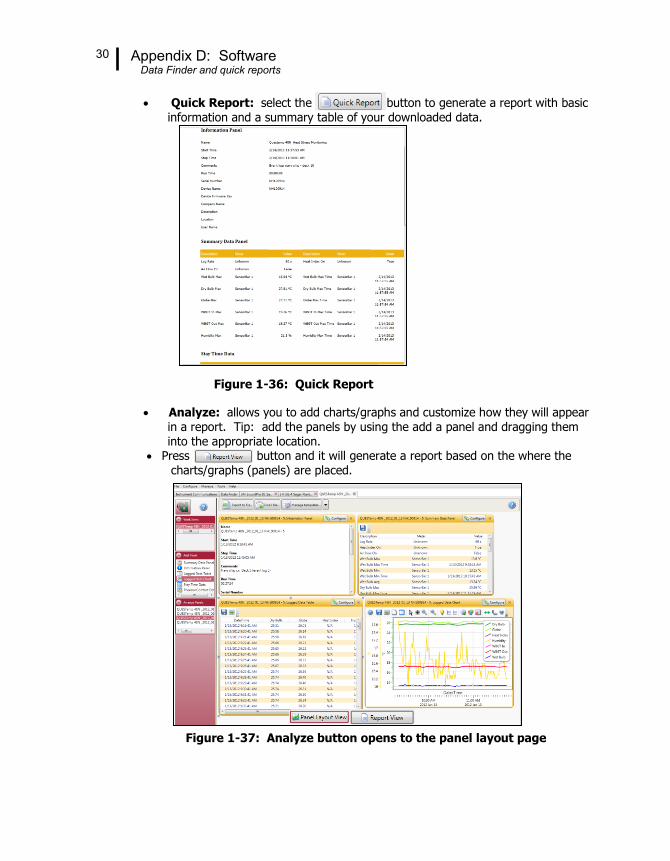
Data Finder and quick reports
In the Data finder page, the data you downloaded is stored by instrument family and then organized by models. Note: when working in this page, click on the Most Recent button if you are looking for your recently downloaded data.
1. In the data finder page, click on the downloaded data and select either analyze or print report.
Figure 1-35: Data Finder Page
1
2
3
Data Finder checkbox. When checked, this will automatically open to the downloaded data page.
Download
Double-click to select/view QT⁰44/46 data in
charts and graphs 3
1
2 4
Double-click to select/view
QT⁰44/46 data in
charts and graphs 1
Appendix D: Software Data Finder and quick reports
30
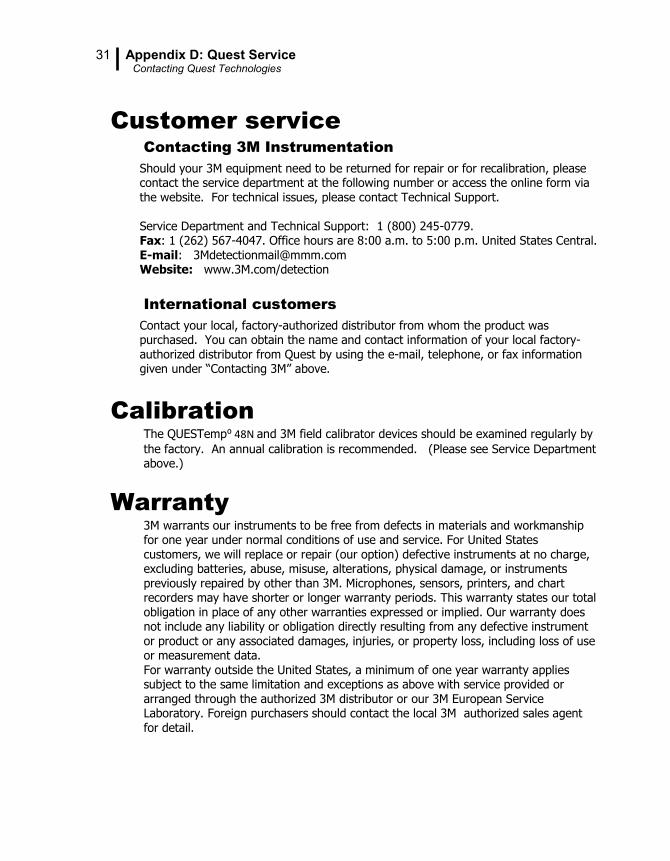
Quick Report: select the button to generate a report with basic information and a summary table of your downloaded data.
Figure 1-36: Quick Report
Analyze: allows you to add charts/graphs and customize how they will appear in a report. Tip: add the panels by using the add a panel and dragging them into the appropriate location.
Press button and it will generate a report based on the where the charts/graphs (panels) are placed.
Figure 1-37: Analyze button opens to the panel layout page
31 Appendix D: Quest Service Contacting Quest Technologies
Customer service
Contacting 3M Instrumentation
Should your 3M equipment need to be returned for repair or for recalibration, please contact the service department at the following number or access the online form via the website. For technical issues, please contact Technical Support. Service Department and Technical Support: 1 (800) 245-0779. Fax: 1 (262) 567-4047. Office hours are 8:00 a.m. to 5:00 p.m. United States Central. E-mail: [email protected] Website: www.3M.com/detection
International customers
Contact your local, factory-authorized distributor from whom the product was purchased. You can obtain the name and contact information of your local factory-authorized distributor from Quest by using the e-mail, telephone, or fax information given under “Contacting 3M” above.
Calibration
The QUESTemp⁰ 48N and 3M field calibrator devices should be examined regularly by
the factory. An annual calibration is recommended. (Please see Service Department above.)
Warranty
3M warrants our instruments to be free from defects in materials and workmanship for one year under normal conditions of use and service. For United States
customers, we will replace or repair (our option) defective instruments at no charge, excluding batteries, abuse, misuse, alterations, physical damage, or instruments previously repaired by other than 3M. Microphones, sensors, printers, and chart recorders may have shorter or longer warranty periods. This warranty states our total obligation in place of any other warranties expressed or implied. Our warranty does not include any liability or obligation directly resulting from any defective instrument or product or any associated damages, injuries, or property loss, including loss of use or measurement data. For warranty outside the United States, a minimum of one year warranty applies subject to the same limitation and exceptions as above with service provided or arranged through the authorized 3M distributor or our 3M European Service Laboratory. Foreign purchasers should contact the local 3M authorized sales agent for detail.
Personal Safety Division3M Detection Solutions1060 Corporate Center DriveOconomowoc, WI 53066ISO 9001 Registered CompanyISO 17025 Accredited Calibration LabCustomer Service: 262-567-9157Toll Free: 800-245-0779
www.3m.com/detection
3M is a trademark of 3M Companyused under license in Canada.Please recycle. Printed in USA.© 2013 3M All rights reserved.057-330 Rev.E. 2/13
About Us
3M Detection Solutions is a world class manufacturer of rugged, reliable instrumentation and software systems that help monitor and evaluate occupational and environmental health and safety hazards, including noise dosimetry, sound level monitoring, heat stress, indoor air quality and select toxic/combustible gases. The 3M Detection brand of instrumentation is used by safety and industrial hygiene professionals to help comply with applicable occupational standards and regulations.
About 3M Personal Safety3M offers a comprehensive, diverse portfolio of Personal Safety solutions providing respiratory protection, hearing protection, fall protection, reflective materials for high visibility, protective clothing, protective eyewear, head and face protection, welding helmets, and other adjacent products and solutions such as tactical safety equipment, detection, monitoring equipment, active communications equipment and compliance management. In 2012, 3M celebrated 40 years of safety leadership – recognizing the company’s respiratory and hearing protection solutions introduced in 1972. Visit www.3M.com/PPESafety or http://m.3m.com/PPESafety for details.