Embed Size (px)
Citation preview

From the op*cal characteris*cs of HIFI to in-‐orbit flux calibra*on using
Mars Willem Jellema, Migo Mueller,
Michael Olberg and Raphael Moreno

Outline of presenta*on
• Review of HIFI spa*al calibra*on method • Issues and ques*ons related to current values • What do op*cal models and ground measurements tell us?
• Possible routes for calibra*on improvement • Discussion of preliminary results • Final steps to be taken

HIFI spa*al calibra*on method (1)
• Need good knowledge of ηmb and ηa across HIFI spectral range (ref. presenta*on Michael Olberg)
• Currently one of the limi*ng factors in final calibra*on accuracy
• Efficiencies are obtained by rela*vely sparsely sampled measurements on Mars: – Reasonable SNR in acceptable observing *me – Detailed / high-‐SNR HIFI beam paVerns excluded

HIFI spa*al calibra*on method (2)
• Use rela*vely simple 1st order approach: – Measure beam profile on Mars – Fit 2D Gaussian to profile – Deconvolve for Mars (disk): – Using TRJ from Mars model Raphael Moreno – and coupling factor to Mars: – ηmb is ra*o observed and predicted TA
• Finally ηa via: See TN v1.1 2010-‐11-‐17 by Michael Olberg
…ra*o of TA
Plots taken from Michael Olberg

…and finally ηmb + ηa • Frequency dependence through Ruze’s eq.:

…current recommenda*on HIFI
• Use global trends and Ruze’s equa*on:
• Band 5 excluded from global trend and treated separately in view of large devia*on

Issues and ques*ons
• Results obtained in run 1 (OD-‐330 and -‐311) and run 2 (OD-‐390-‐391 and -‐406-‐407) are not consistent (θb run 2 < θb run 1)
• Ra*o ηmb / ηA not as-‐designed (too large), ηmb and ηA higher than expected (cf op*cal model)
• Are local devia*ons (5-‐10%) for individual mixer bands real/systema*c or (random) measurement errors (e.g. band 5)?
• Are our Gaussian approxima*ons related to this?

Op*cal model and ground results
• Based on validated EM simula*ons • Gaussian illumina*on of Herschel telescope
cf 0.68 cf 0.76 detectable?

Simula*ng small and coarse raster • Sky beams HIFI are not Gaussian • Mars maps contain frac*on of 1st bright ring • Sample points cross 1st dark ring

Systema*c errors due to sampling
• Systema*c errors due to: – Limited extent – Sampling interval – Convolu*on Mars
• Could explain the inconsistency seen in run 1 and 2

Using ground measurement data
• HIFI has measured all its individual mixer beams in great detail (single-‐moded)
• Phase and amplitude of wavefront in the FP have been measured in cryogenic FM condi*ons
• Combined with telescope model industry forward model is feasible and poten*ally very accurate

…star*ng with the raw data
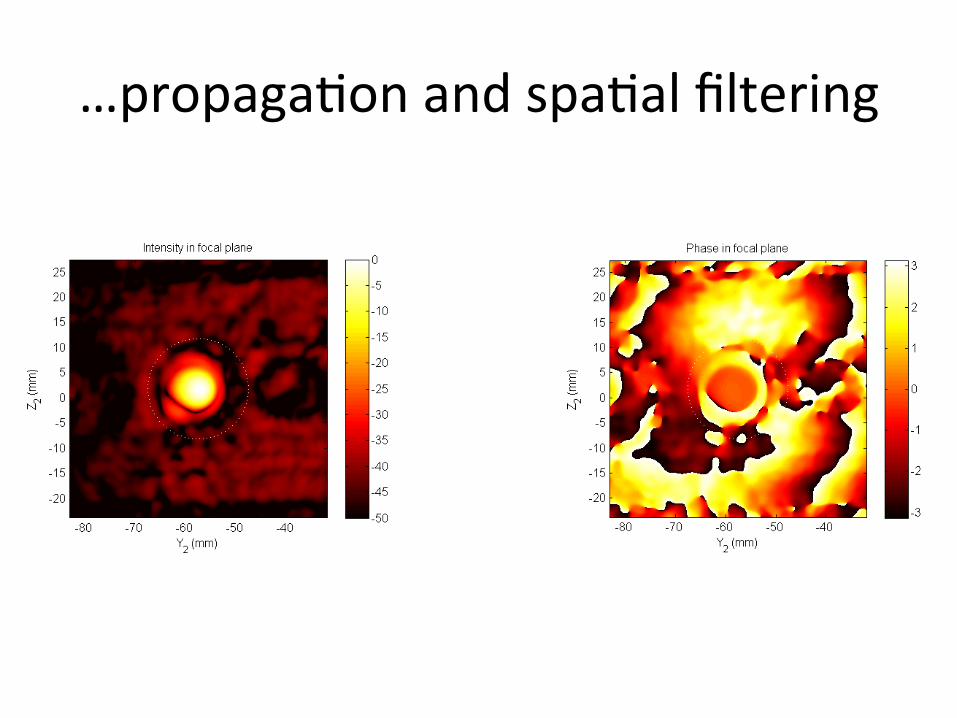
…propaga*on and spa*al filtering

…running through telescope model
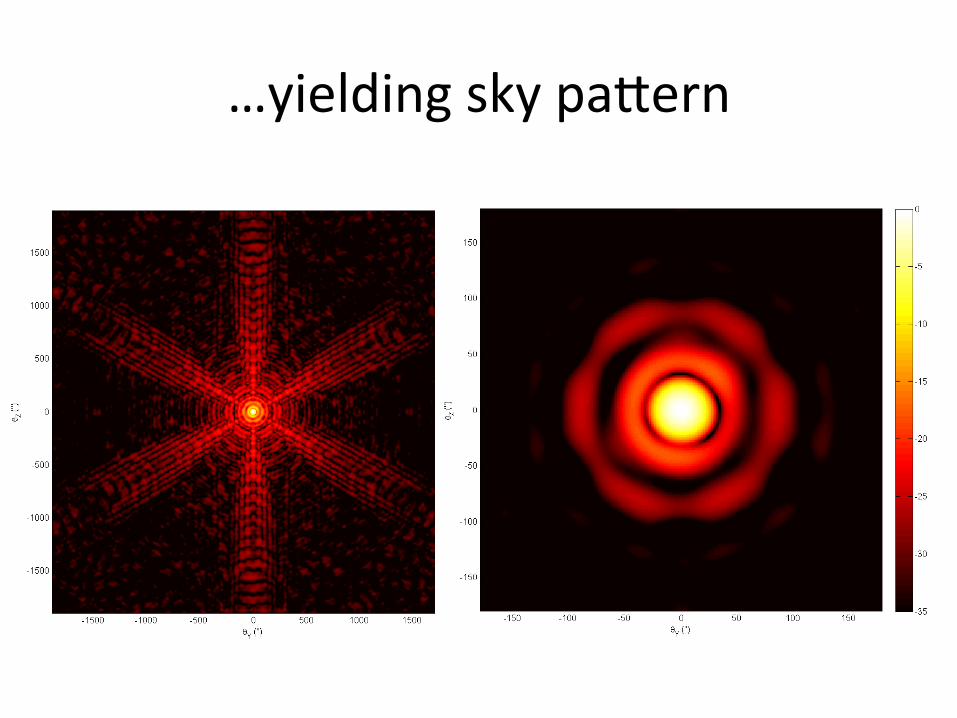
…yielding sky paVern

…example for band 2H
θY (")
θ Z (")
HIFI band 2H beam pattern @ 374 µm
WJ-20111026
-16.5 dB -18.9 dB
-20.9 dB
-24.5 dB
-27.6 dB
-100 -50 0 50 100
-100
-50
0
50
100
-35
-30
-25
-20
-15
-10
-5
0
-100 -50 0 50 100-45
-40
-35
-30
-25
-20
-15
-10
-5
0
θY, θZ (")
Rel
ative
Inte
nsity
(dB)
HIFI band 2H beam pattern @ 374 µm
WJ-20111026
65.2"
27.3"

Possible calibra*on improvements
• Addi*onal, complementary and op*mized maps (repe**on of Mars observa*ons popula*ng a composite/accumula*ve map)
• Improved models for data fimng: – Truncated and centrally obscured Gaussian – Forward model assuming incident Gaussian – Including full tripod occulta*on map and trefoil WFE
• Using wavefront propagated ground-‐based data (requires in-‐orbit verifica*on and modelling)

Complementary maps
• In view of Herschel cross-‐calibra*on a Mars run 3 was scheduled on OD-‐895-‐897 and -‐903
• A final run 4 was done for a very limited set of bands spanning the full HIFI range (band 1 and 7) and covering the outlier band 5
• Using simulated sky paVerns op*mized 3x20 striped maps (orthogonal) were used
• In run 3 a single high-‐SNR 20x20 raster was requested (and granted) to demonstrate the poten*al of using ground-‐based data

…striped paVern AOR check run 3

Discussion of preliminary results
• In run 3 striped paVerns were first tested • Homework correct: expected structure seen
Sidelobes detected In expected range

Analysis sonware adjusted
• Analysis sonware now includes improved models for fimng
SNR ~ 25-‐30 dB
Main beam distor*on

…truncated Gaussian results
OBSID Polarization Frequency Tpeak (K) T0 (K) dT (rms) HSPOT Te (dB) dtheta_y (") dtheta_z (")x1437-‐1438 H 948 6.57 0.012 0.078 0.038 12.0 0.19 0.00x1437-‐1438 V 948 6.93 0.006 0.102 0.038 10.4 -‐0.86 -‐0.80x1461-‐1462 H 1893 19.61 0.091 0.387 0.418 10.7 -‐0.41 -‐1.05x1461-‐1462 V 1893 21.86 0.137 0.770 0.418 9.9 -‐0.09 -‐1.18x1497-‐1498 H 1112 8.92 0.020 0.147 0.075 11.5 -‐0.06 -‐0.26x1497-‐1498 V 1112 9.08 0.019 0.142 0.075 11.0 -‐0.29 -‐0.09x1515-‐1516 H 1127 7.62 0.023 0.256 0.098 14.0 0.78 -‐1.06x1515-‐1516 V 1127 7.67 0.026 0.179 0.098 14.0 -‐0.10 -‐0.44x1522-‐1523 H 488 1.92 0.002 0.027 0.022 11.3 -‐0.29 -‐1.11x1522-‐1523 V 488 1.84 0.003 0.022 0.022 12.1 -‐0.18 -‐1.60x1769-‐1770 H 1625 16.79 0.051 0.255 0.143 9.7 -‐0.76 -‐0.97x1769-‐1770 V 1625 16.65 0.057 0.286 0.143 10.3 -‐0.75 -‐0.92x1533 H 770 4.58 0.006 0.034 0.033 11.7 -‐0.36 -‐0.73x1533 V 770 4.75 0.004 0.037 0.033 11.5 -‐0.39 -‐1.19

Spot check 2H forward model
• Blind forward model calcula*on vs spot check 2H 20x20 raster on Mars
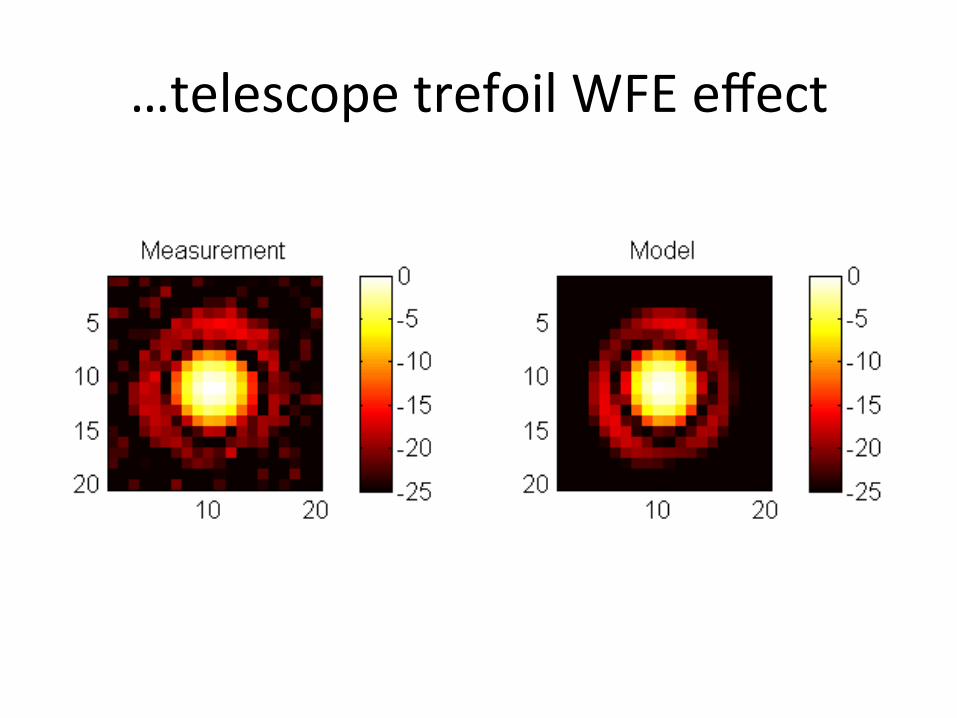
…telescope trefoil WFE effect

…forward model vs Gaussian

Final steps to be taken • All ingredients present to *dy-‐up final calibra*on • Coherent re-‐reduc*on of Mars beam data: – All data from run 1 – 4 – Using single version of:
• HIPE (9.0 UR) • SPG (8.2.1) • Analysis script:
– Bug fixes: error calcula*on, map geometry – Upgrade: retrieve Mars ephemeris on the fly
– Matching Mars temperature models created – HIFI Interested in improving a-‐posteriori poin*ng calibra*on

…final steps
• Simultaneous fit of mul*ple runs / data sets taken for different Mars apparent diameters
Example band 5 collec*on

…final steps
• Finally extract best beam profiles possible (model fit or ground-‐based)
• Beam profiles to be incorporated in numerical evalua*on of calibra*on quan***es (beam solid angle, source coupling, etc…)
• Release of paVerns to community • LaVer ac*vi*es foreseen for post-‐opera*ons and -‐calibra*on