Embed Size (px)
Citation preview
DOE/EM-0273
Frozen Soil Barrier Technology
lATlVE TECHNOLOGY SUMMARY REPORT I
SEG Facilities Oak Ridge, TN in cooperation with U.S. Department of Energy Oak Ridge Operations
U.S. Department of Energy Office of Environmental Management Office of Technology Development
April 1995
US. Department of Energy
DISCLAIMER
This report was prepared as an account of work sponsored by an agency of the United States Government. Neither the United States Governmentnor any agency thereof, nor any of their employees, makes any warranty, express or implied, or assumes any legal liability or responsibility for the accuracy, completeness, or usefulness of any information, apparatus, product, or process disclosed, or represents that its use would not infringe privately owned rights. Reference herein to any specific commerical product, process, or service by trade name, trademark, manufacturer, or otherwise does not necessarily constitute or imply its endorsement, recommendations, or favoring by the United States Government or any agency thereof. Theviewsandopinions of authorsexpressed hereindonotnecessarilystateorreflect those of the United States Government or any agency thereof.
This report has been reproduced directly ftom the best available copy.
Available to DOE and DOE contractors from the Office of Scientific and Technical Information, P.O. Box 62, Oak Ridge, TN 37831; prices available from (615) 576-8401.
Available to the public from the U.S. Department of Commerce, Technology Administra- tion, National Technical Information Service, Springfield, VA 22161. (703) 4874650.
Portions of this document mny be ikgiiiile in electronic image products. h a g s are produced from the best available original dOCUlIlent
,
hnology
SEG Facilities Oak Ridge, TN in cooperation with U.S. Department of Energy Oak Ridge Operations
US. Department of Energy Office of Environmental Management Office of Technology Development
April 1995
. TABLE OF CONTENTS
ICI SUMMARY
R TECHNOLOGY DESCRIPTION
PERFORMANCE
TECHNOLOGY APPLICABILITY & ALTERNATIVES
COST
REGULATORY/POLICY ISSUES
LESSONS LEARNED
APPENDICES
Demonstration Site Characteristics
page 10
page 11
References
U.S. Department of Energy
SECTION 1
Technology Description L I
The technology of using refrigeration to freeze soils has been employed in largescale engineering projeds for a number of years. This technology bonds soils to give load-bearing strength during construction; to seal tunnels, mine shafts, and other subsurface structures against flooding from groundwater; and to stabilize soils during excavation. Examples of modern applications include several large subway, highway, and water supply tunnels.
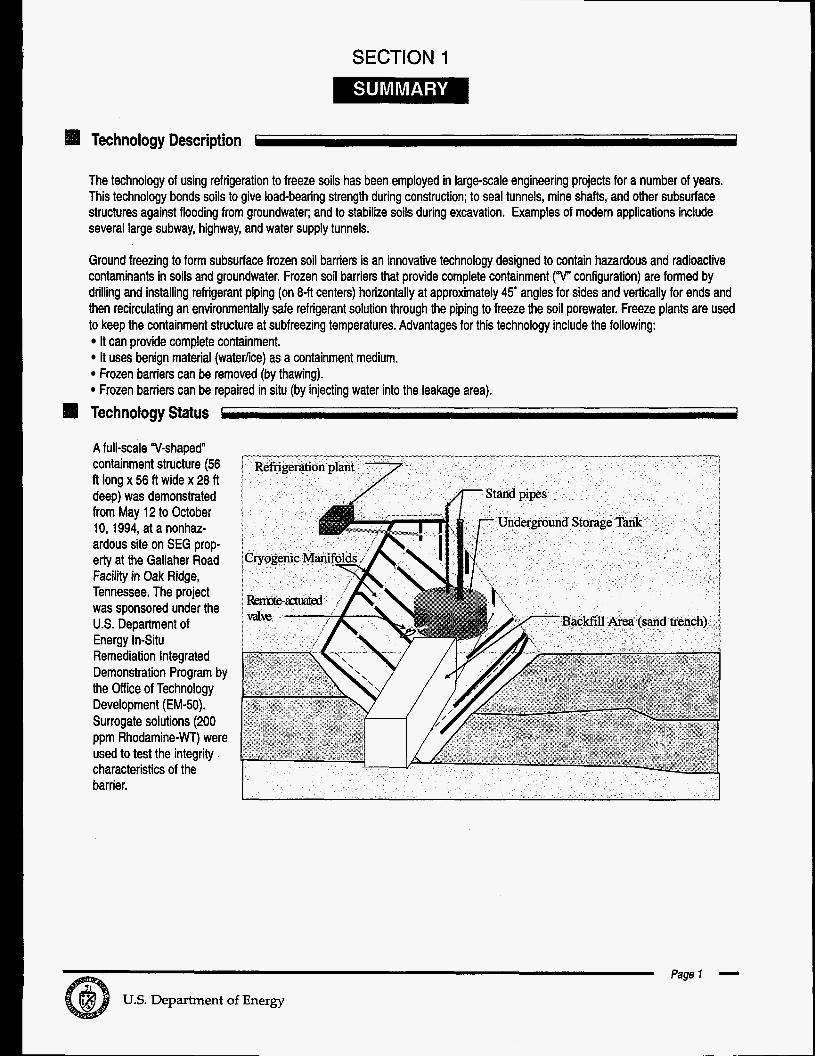
Ground freezing to form subsurface frozen soil barriers is an innovative technology designed to contain hazardous and radioactive contaminants in soils and groundwater. Frozen soil barriers that provide complete containment (V configuration) are formed by drilling and installing refrigerant piping (on 8 4 centers) horizontally at approximately 45' angles for sides and vertically for ends and then recirculating an environmentally safe refrigerant solution through the piping to freeze the soil porewater. Freeze plants are used to keep the containment structure at subfreezing temperatures. Advantages for this technology include the following:
It can provide complete containment. It uses benign material (waterhce) as a containment medium. Frozen barriers can be removed (by thawing). Frozen barriers can be repaired in situ (by injecting water into the leakage area).
Technology Status t I
A full-scale '7-shaped" containment structure (56 ft long x 56 ft wide x 28 ft deep) was demonstrated from May 12 to October 10,1994, at a nonhaz- ardous site on SEG prop- erty at the Gallaher Road Facility in Oak Ridge, Tennessee. The project was sponsored under the U.S. Department of Energy InBitu Remediation Integrated Demonstration Program by the Office of Technology Development (EM-50). Surrogate solutions (200 ppm Rhodamine-WT) were used to test the integrity characteristics of the barrier.
Page I - US. Department of Energy
continued
Key Results Timeconstrained laboratory studies showed that effective frozen soil barriers (hydraulic permeabilities < 4x1 OE-10 cm/sec) can be formed in saturated soils for chromate (4000 mglkg) and trichloroethylene (TCE) (6000 mgkg). Tests with cesium-137 showed no detectable diffusion through the barrier although sorption on the soil grains may have been responsible for the immobility. Soil movement can be predicted accurately for fine-grained soils based on past civil engineering practices. Computer modeling of heat transfer characteristics and soil temperature for fine-grained soils was validated. Costs associated with engineering, construction, operation, and maintenance of frozen soil barriers in fine-grained soils using full- scale equipment were established (for a nonhazardous site). Electropotential studies utilizing frozen soil’s low electrical conductivity properties showed low ionic transport across the frozen soil barrier, indicating that the barrier is an effective deterrent to ionic transport. Excavation of the nonfrozen soil within the contained area and ground penetrating radar studies showed (1) the inner area to be in the predicted formation (“V” shape) and (2) the frozen wall thicknesses to be approximately 15 ft in the sand trench area and 5 to 9 ft in the clay-dominated areas.
integrity. Diffusion studies (with Rhodamine-WT as the tracer) conducted by Los Alamos National Laboratory (LANL) confirmed barrier
An in-place temperature-monitoring system provided soil temperature information confirming barrier formation. The Frozen Soil Barrier process is based upon US. Patent No. 4,860,544, issued to RKK Ltd. for CRYOCELL ground freezing technology.
Contacts
Technical Rick Swatzell, Principal Investigator, Martin Marietta Energy Systems, Inc. (MMES), 61 5-435-31 26 Ray Peters, Scientific Ecology Group (SEG), 615-376-81 94
Management Jef Walker, DOE EM-50, DOE Plumes Focus Area Program Manager, 303-903-7966
Page 2 - U.S. Department of Energy
SECTION 2
1.0 Purpose I i
The purpose of this project was to provide the US. Department of Energy with an innovative technique for controlling waste migra- tion in soils by demonstrating the use of frozen soil barriers. This project had the following goals and objectives:
Demonstrate in situ isolation of a simulated waste from the environment. Provide complete containment of the simulated waste. Construct a subsurface barrier without adding injectants or any barrier materials. Demonstrate long-term control of in situ waste. Conduct barrier monitoring and integrity testing.
2.0 Description of the Demonstration Facility I I
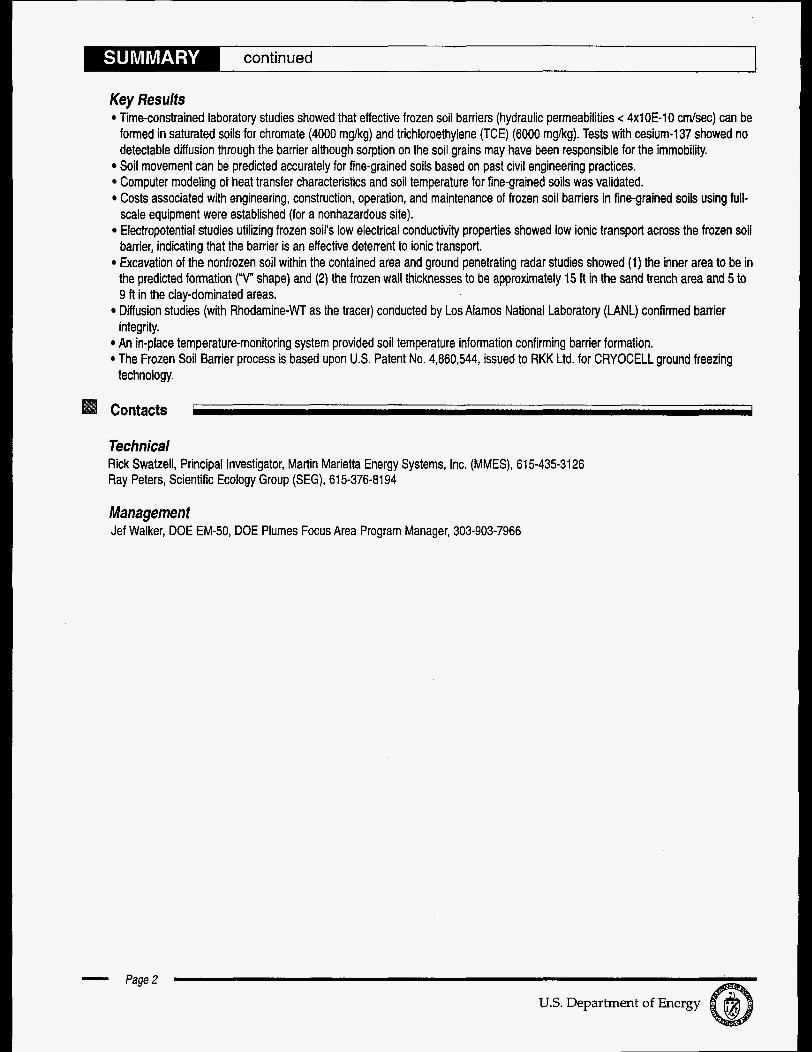
The dimensions of the frozen soil barrier region were 56 ft by 56 ft (outside) and 33 ft by 33 ft (inside) once the ice barrier was fully formed.
Freeze pipes were installed in dou- ble-rowed configuration for overlap. Pipes were installed at a 45' angle to establish a bottom to the contain- ment structure. Pipes were set on 8 4 centers with the two rows set at 4 4 centerlines, and the ice wall was allowed to grow together forming the barrier. An array of heating pipes was installed inside the freeze grid to allow some oil heave control. The piping material was 4-in. schedule 10 carbon steel for both freeze and heat grids.
through additional pipes inserted around the site. Resistance tem- perature detectors (RTDs) were placed inside these pipes at 5 4 intervals.
Monitoring was accomplished
Inner freezing Grid 7 Z T
a - 56'
1- Outer Freezing Grid
Page3 - U.S. Department of Energy
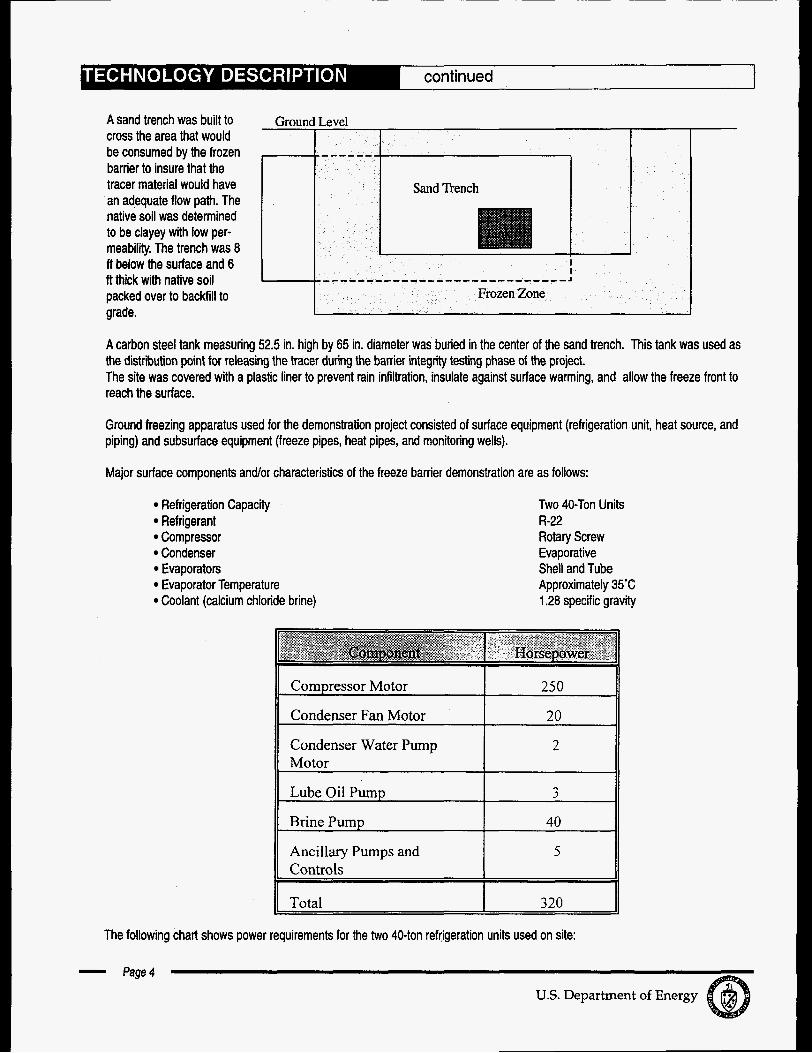
A sand trench was built to cross the area that would be consumed by the frozen barrier to insure that the tracer material would have an adequate flow path. The native soil was determined to be clayey with low per- meability. The trench was 8 ft below the surface and 6 fi thick with native soil packed over to backfill to grade.
Groun Level
Frozen Zone
A carbon steel tank measuring 52.5 in. high by 65 in. diameter was buried in the center of the sand trench. This tank was used as the distribution point for releasing the tracer during the barrier integrity testing phase of the project. The site was covered with a plastic liner to prevent rain infiltration, insulate against surface warming, and allow the freeze front to reach the surface.
Ground freezing apparatus used for the demonstration project consisted of surface equipment (refrigeration unit, heat source, and piping) and subsurface equipment (freeze pipes, heat pipes, and monitoring wells).
Major surface components and/or characteristics of the freeze barrier demonstration are as follows:
Refrigeration Capacity Refrigerant Compressor Condenser Evaporators Evaporator Temperature Coolant (calcium chloride brine)
Two 40-Ton Units
Rotary Screw Evaporative Shell and Tube Approximately 3% 1.28 specific gravity
R-22
Compressor Motor 250
Condenser Fan Motor 20
Condenser Water Pump 2
Lube Oil Pump 3
Motor
Brine Pump 40
Ancillary Pumps and 5 Controls
11 Total 320
The following chart shows power requirements for the two 40-ton refrigeration units used on site:
- Page 4
U.S. Department of Energy
SECTION 3
......................................................
...................................................
....................................................
.............
A ..............
Testing the frozen barrier consisted of looking at the physical aspects of soil freezing, the containment characteristics of the barrier, and the physical characteristics of the barrier once it was formed.
This evaluation was accomplished with four kinds of testing:
computer model validation; * soil movement testing, including heat grid tests;
barrier diffusion and leaking tank tests; and barrier integrity testing.
Results obtained are discussed in the next section.
Computer Model Validation L II
Purpose To compare predicted energy consumption and frozen barrier temperatures during formation and operation of the frozen barrier, to confirm the accuracy of ground freezing calculations, and to improve the parameters used in such calculations.
Test Equipment Computer model, monitoring system (for both soil and brine temperature), flowmeters, and electrical meter.
Test Results
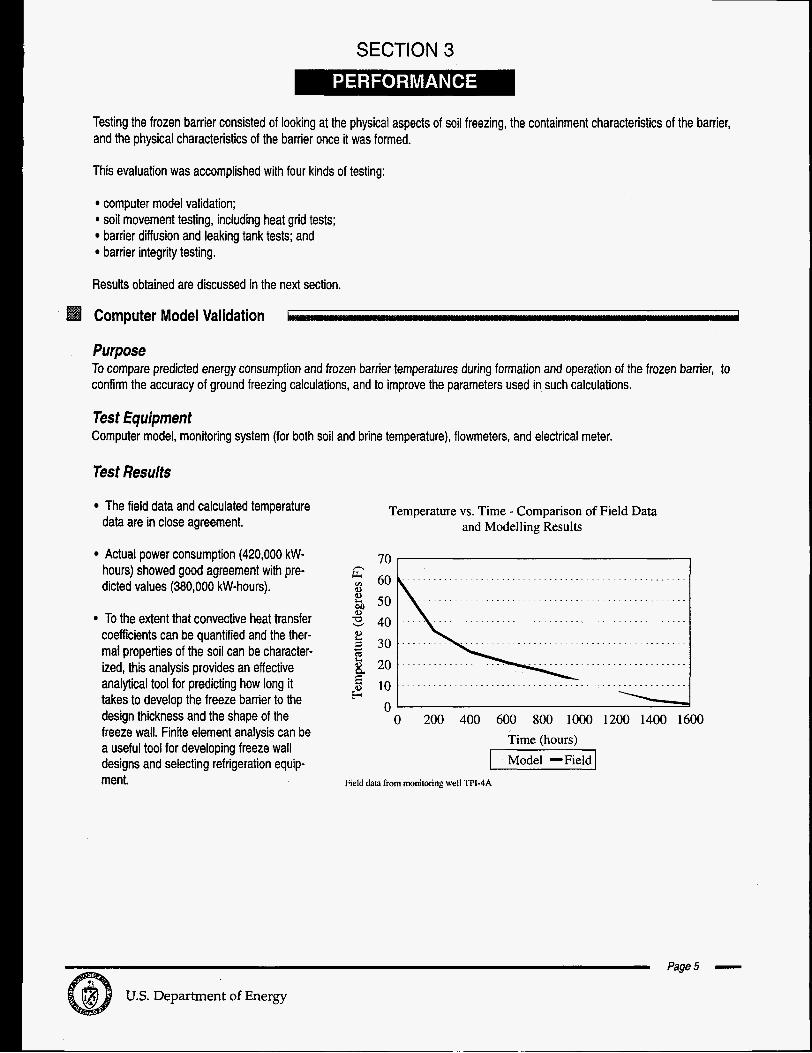
The field data and calculated temperature data are in close agreement.
Actual power consumption (420,000 kW- hours) showed good agreement with pre- dicted values (380,000 kW-hours).
To the extent that convective heat transfer coefficients can be quantified and the ther- mal properties of the soil can be character- ized, this analysis provides an effective analytical tool for predicting how long it takes to develop the freeze barrier to the design thickness and the shape of the freeze wall. Finite element analysis can be a useful tool for developing freeze wall designs and selecting refrigeration equip- ment.
Temperature vs. Time - Comparison of Field Data and Modelling Results
70 I I 60 50 40 30 20 10 0
0 200 400 600 800 1000 1200 1400 1600
I ....................................................
\
Time (hours) I Model -Field I
Field dam from monitoring well TPI-4A
Page5 - U.S. Department of Energy
e m a m A continued
Soil Movement Test t 1
Purpose This test measured soil movement and stresses on a tank buried in the center of the barrier test facility. Soil movement was expected because of the wet and fine-grained nature of the soil at the site, which is classified as ”frost-susceptible” by the US. Army Corps of Engineers’ Cold Regions Research and Engineering Laboratory (CRREL) according to their grain size criterion for silty and clayey soils. This test also determined the effect on soil movement when the heating grid was used.
Test Equipment Ten benchmarks, transit, strain gages, flowmeters, and temperature sensors were installed within the demonstration site. Benchmarks were constructed by drilling 3-ft-deep holes by hand with a post hole digger. Holes were backfilled with concrete, and 36-in. sections of iron rebar were inserted into the concrete. Approximately 10 to 12 in. of rebar was exposed at the marker sur- face. In addition, two benchmarks for the tank (the 2-in. and 4-in. risers) were measured.
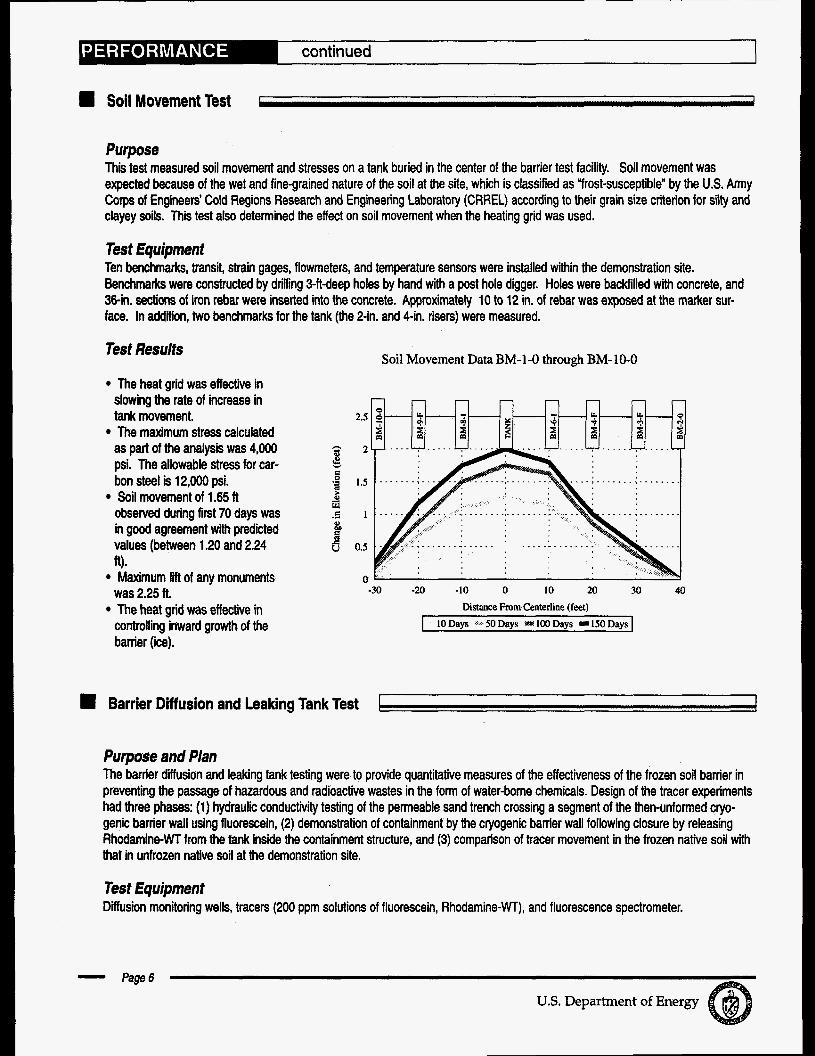
Test Results Soil Movement Data BM-1-0 through BM-10-0
The heat grid was effective in slowing the rate of increase in tank movement. The maximum stress calculated as part of the analysis was 4,000 psi. The allowable stress for car- bon steel is 12,000 psi. Soil movement of 1.65 ft observed during first 70 days was in good agreement with predicted values (between 1.20 and 2.24
Maximum lift of any monuments was 2.25 fI.
. . . . . . . . . . . .
fi).
-30 -20 -10 0 10 20 30 40 Distance From Centerline (feet) The heat grid was effective in
controlling inward growth of the 10 Days 50 Days LOO Days m 150 Days
barrier (ice).
Barrier Diffusion and Leaking Tank Test I 4
Purpose and Plan The barrier diffusion and leaking tank testing were to provide quantitative measures of the effectiveness of the frozen soil barrier in preventing the passage of hazardous and radioactive wastes in the form of water-borne chemicals. Design of the tracer experiments had three phases: (1) hydraulic conductivity testing of the permeable sand trench crossing a segment of the then-unformed cryo- genic barrier wall using fluorescein, (2) demonstration of containment by the cryogenic barrier wall following closure by releasing Rhodamine-WT from the tank inside the containment structure, and (3) comparison of tracer movement in the frozen native soil with that in unfrozen native soil at the demonstration site.
Test Equipment Dffusion monitoring wells, tracers (200 ppm solutions of fluorescein, Rhodamine-WT), and fluorescence spectrometer.
Page 6 - U.S. Department of Energy
0 . 7 ' continued D . )
Test Results Substantial hydraulic conductivity was shown through the sand trench by the appearance of fluorescein in recovery well WO-A
Rhodamine was found only inside the barrier region, showing barrier integrity (see Figure 6). Phase 3 tests showed that Rhodamine migrated approximately 2 feet in unfrozen soils, while essentially no Rhodamine tracer
was found below open-ended welt casings within the freeze barrier. Barrier integrity Testing C I
(outside the planned barrier) in less than 4 hours (Figure 5).
Purpose and Plan Barrier integrii testing consisted of (1) measuring the electropotential of the soil to indicate reduced ionic transport properties (reduced electrical conductivity of frozen soil) through the frozen soil region and (2) performing ground penetrating radar studies of the barrier wall after the barrier-contained interior (unfrozen section) was excavated.
Test Equipment Passive and active electrodes (for electropotential measurements), computer data collection and analysis system, and ground pene- trating radar instrumentation.
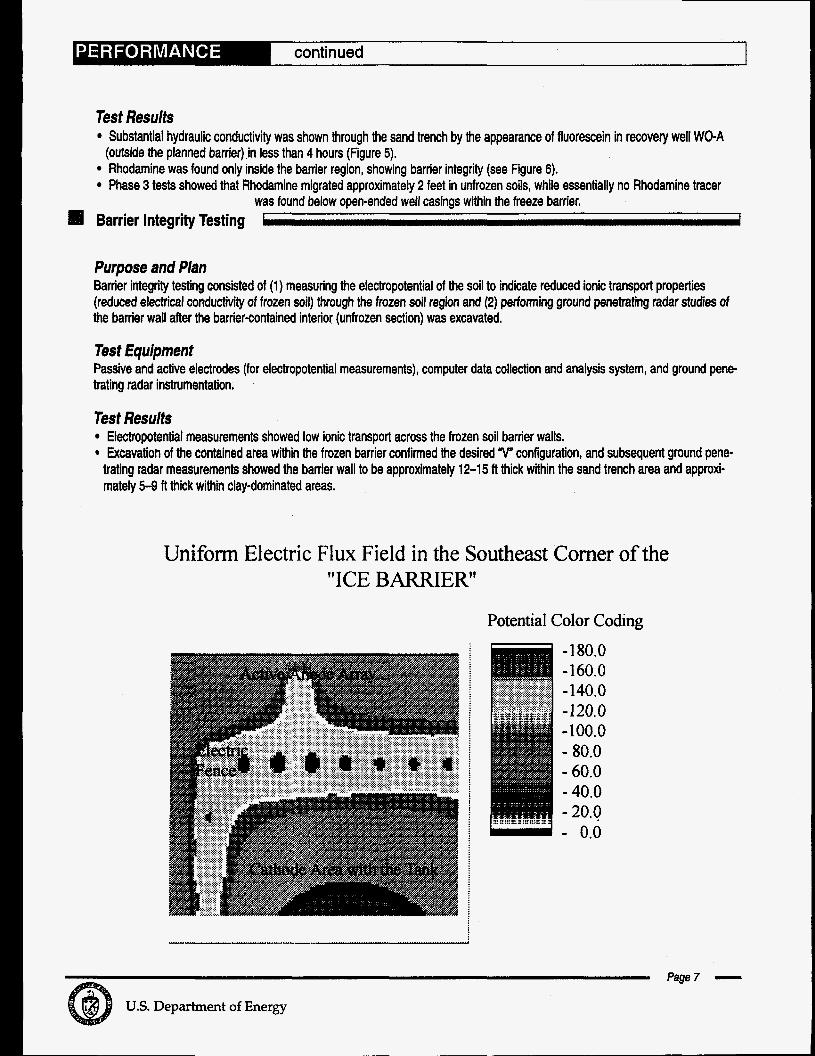
Test Results Electropotential measurements showed low ionic transport across the frozen soil barrier walls.
0 Excavation of the contained area within the frozen barrier confirmed the desired II" configuration, and subsequent ground pene- trating radar measurements showed the barrier wall to be approximately 12-15 ft thick within the sand trench area and approxi- mately 5 9 ft thick within clay-dominated areas.
Uniform Electric Flux Field in the Southeast Corner of the "ICE BARRIER"
Potential Color Coding
- - 0.0
Page7 - U.S. Department of Energy
SECTION 4
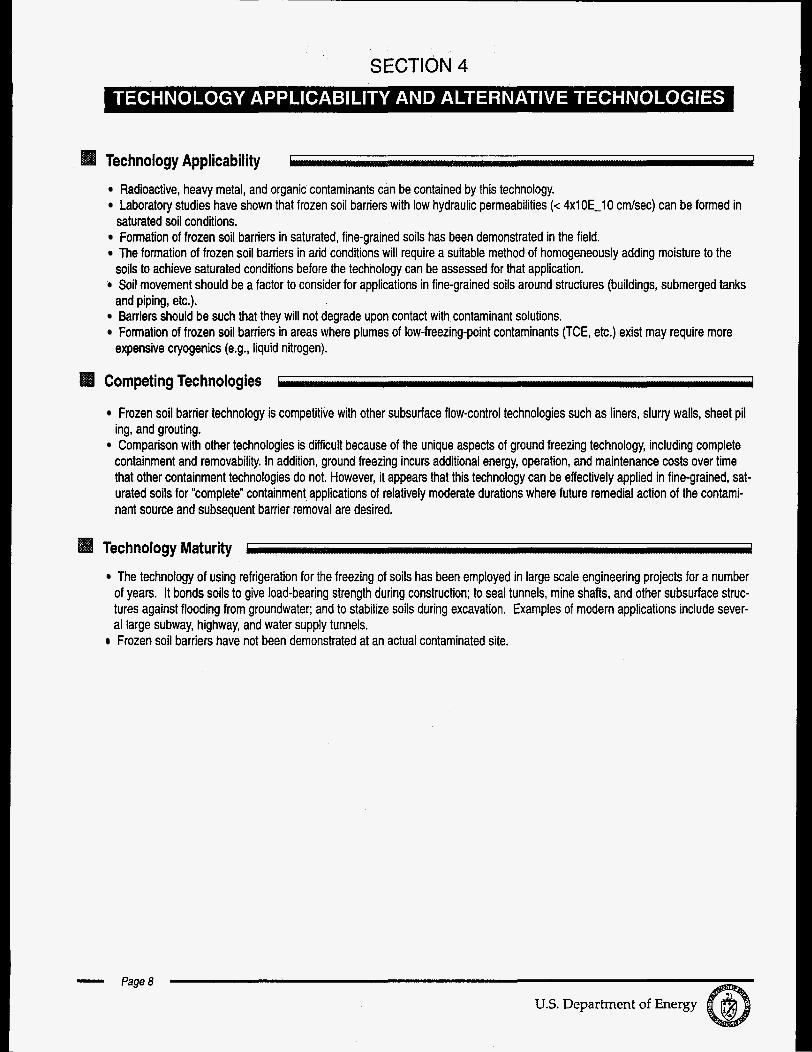
Technology Applicability Radioactive, heavy metal, and organic contaminants can be contained by this technology. Laboratory studies have shown that frozen soil barriers with low hydraulic permeabilities (< 4xlOE-10 cmlsec) can be formed in
Formation of frozen soil barriers in saturated, fine-grained soils has been demonstrated in the field. The formation of frozen soil barriers in arid conditions will require a suitable method of homogeneously adding moisture to the soils to achieve saturated conditions before the technology can be assessed for that application. Soil movement should be a factor to consider for applications in fine-grained soils around structures (buildings, submerged tanks and piping, etc.). Barriers should be such that they will not degrade upon contact with contaminant solutions. Formation of frozen soil barriers in areas where plumes of low-freezing-point contaminants (TCE, etc.) exist may require more
saturated soil conditions.
expensive cryogenics (e.g., liquid nitrogen).
Competing Technologies 1
Frozen soil barrier technology is competitive with other subsurface flow-control technologies such as liners, slurry walls, sheet pi1 ing, and grouting. Comparison with other technologies is difficult because of the unique aspects of ground freezing technology, including complete
containment and removability. In addition, ground freezing incurs additional energy, operation, and maintenance costs over time that other containment technologies do not. However, it appears that this technology can be effectively applied in fine-grained, sat- urated soils for “complete” containment applications of relatively moderate durations where future remedial action of the contami- nant source and subsequent barrier removal are desired.
Technology Maturity 1 1
The technology of using refrigeration for the freezing of soils has been employed in large scale engineering projects for a number of years. It bonds soils to give load-bearing strength during construction; to seal tunnels, mine shafts, and other subsurface struc- tures against flooding from groundwater; and to stabilize soils during excavation. Examples of modern applications include sever- al large subway, highway, and water supply tunnels. Frozen soil barriers have not been demonstrated at an actual contaminated site.
- Page8
SECTION 5
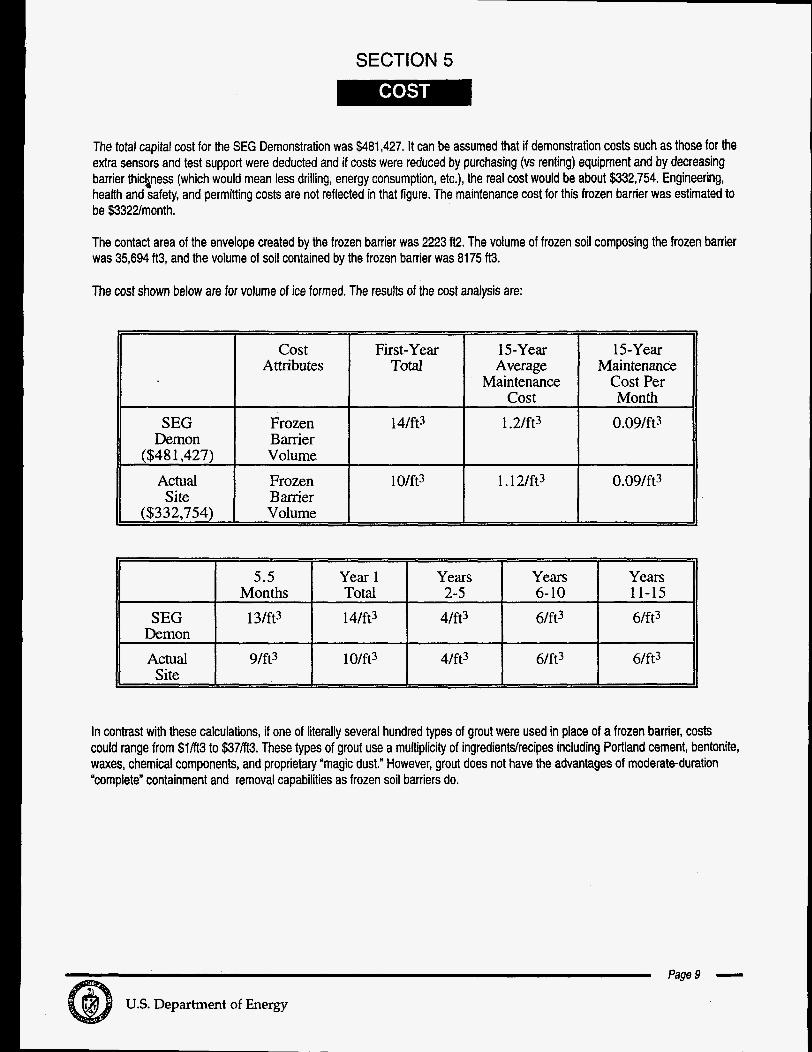
The total capital cost for the SEG Demonstration was $481,427. It can be assumed that if demonstration costs such as those for the extra sensors and test support were deducted and if costs were reduced by purchasing (vs renting) equipment and by decreasing barrier thickness (which would mean less drilling, energy consumption, etc.), the real cost would be about $332,754. Engineering, health and safety, and permitting costs are not reflected in that figure. The maintenance cost for this frozen barrier was estimated to be $3322/month.
The contact area of the envelope created by the frozen barrier was 2223 ft2. The volume of frozen soil composing the frozen barrier was 35,694 ft3, and the volume of soil contained by the frozen barrier was 8175 ft3.
The cost shown below are for volume of ice formed. The results of the cost analysis are:
cost First-Year 15-Year Attributes Total Average
Maintenance cost
Frozen Barrier
SEG Demon
($48 1,427) Volume Actual Frozen Site Barrier
($332,754) Volume
1 o m 3 I . 1 2 m 3
I 15-Year 1 Maintenme
Cost Per Month O.O9/ft3
0.091ft3
5.5 Year 1 Years Years Years
SEG 131ft3 14lft3 41ft3 61ft3 6Ift3 Months Total 2-5 6-10 11-15
Demon Actual 9lft3 1 om3 41ft3 6Ift3 61ft3 Site
In contrast with these calculations, if one of literally several hundred types of grout were used in place of a frozen barrier, costs could range from $l/ft3 to $37M3. These types of grout use a multiplicity of ingredientshecipes including Portland cement, bentonite, waxes, chemical components, and proprietary "magic dust." However, grout does not have the advantages of moderate-duration "complete" containment and removal capabilities as frozen soil barriers do.
Page9 - U.S. Department of Energy
SECTION 6
Regulatory Considerations r 1
No permit was required for this demonstration because the demonstration was performed on a nonhazardous site and a benign barrier material (water) was used. Regulatory participation was encouraged. If moisture additions were required (e.g., for arid site applications) in soils of high hydraulic conductivity (sandy soils), concerns about contaminant migration downward would have to be addressed. In addition, refrigerants of low toxicity (in cases of refrigerant pipe leakage) must be used and complete in situ bar- rier integrity must be confirmed by subsurface barrier verification techniques before regulatory acceptance can be gained.
Safety, Risks, Benefits, and Community Reaction I 1
Worker Safety Health and safety issues for installation (drilling, etc.) and operation are essentially equivalent to those for conventional environ-
mental monitoring applications (monitoring well drilling, etc.).
Community Safety Frozen soil barrier systems do not produce contaminant releases because benign materials (water, nontoxic refrigerants, etc.) are
No unusual or significant safety concerns are raised by the transport of equipment, samples, waste, or other materials associated used.
with frozen soil barrier systems.
Environmental Impacts Drilling for refrigerant piping installation is required. Surface piping manifolds are required to supply refrigerant to the system. Compressor (refrigerant plant) noise is minimal.
- Page 70
U.S. Department of Energy
SECTION 7
Design tssues
In situ temperature sensors installed within the refrigerant piping provided valuable information on barrier formation and refrigera- tion equipment operation. Typical refrigeration equipment (piping, refrigeration plants, etc.) can be used to form in situ frozen soil barriers. Single-row piping may be adequate to form barriers of sufficient thicknesses to contain contaminants. In addition, a single refrigeration plant (40 ton) can be employed to maintain barrier integrity (soil freezing conditions) after initial heat removal is acquired. Computer modeling for soil heat transfer characteristics can be used to predict barrier formation. Methods need to be designed for “injecting” moisture and lower-freezing-point refrigerants into barrier areas where leaks are
Soil movement can be predicted using experiences of past civil engineering practices and should be a consideration when
Careful installation of the refrigerant piping is necessary to ensure “complete” barrier formation. For applications in humid and high ambient temperature regions, proper ground insulation and near-surface refrigerant piping
In situ sensors (electrical conductivity, etc.) should be preinstalled in the soil to monitor barrier formation. Geophysical measurements of the barrier area should be performed before freezing to establish soil characteristics and hetero-
detected (or where refrigerants have leaked because of pipe breakage).
designing a system for applications involving structures.
may be required to ensure that surface to 1-24 depths are adequately frozen (if desired).
geneities.
Technology LimitationdNeeds for Future Development I. I
Remote sites will require electrical power and utility installation. Technology applications for aridsandy environments are undetermined until suitable methods are developed for homogeneously
Technology applications in fine-grained soils around structures (submerged tanks, etc.) may be limited because of soil movement. Longer-duration applications at actual contaminated sites need to be studied to assess diffusion characteristics, costs, etc. In situ subsurface barrier verification technologies (enhanced ground penetrating radar, seismic, acoustics, electropotential, trac-
ers, etc.) need to be developed that are capable of detecting barrier traverses as well as barrier infrastructure properties (voids, etc.). Additional laboratory diffusion studies may be required for various contaminants of differing concentrations. Contaminant solu- tions’ effects on barrier degradation should be studied.
adding and retaining moisture in the soils.
APPENDIX A
Site History/Background I. I
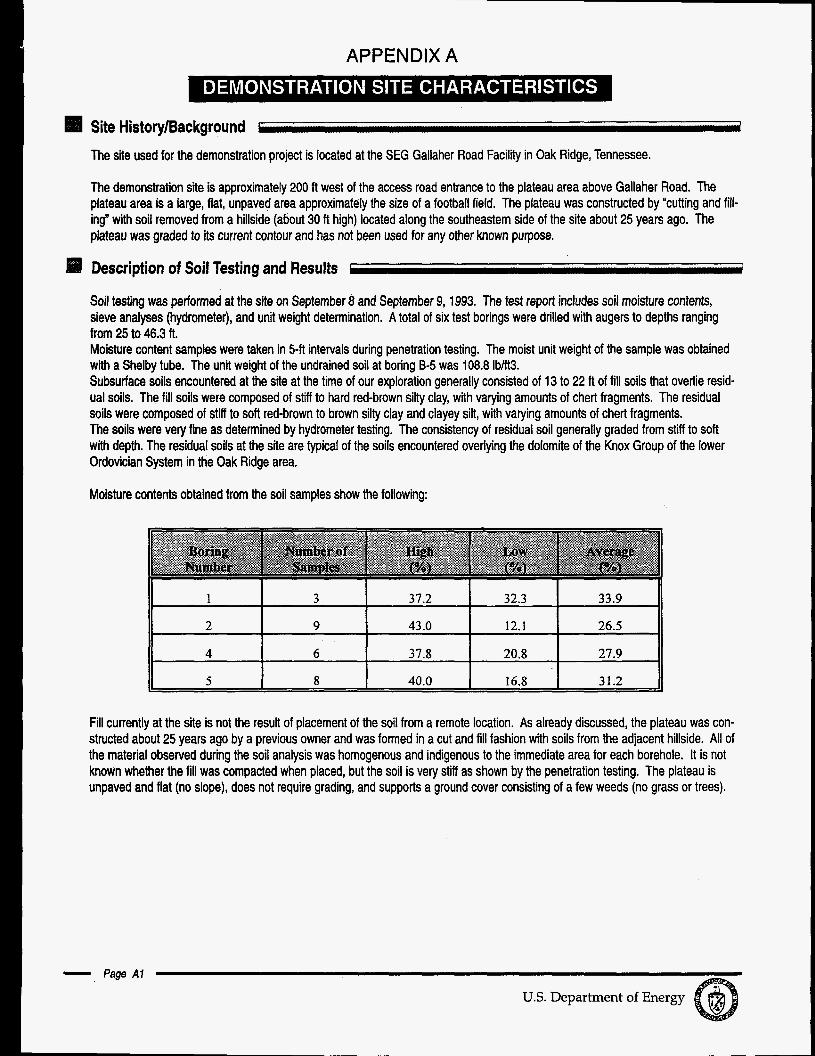
The site used for the demonstration project is located at the SEG Gallaher Road Facility in Oak Ridge, Tennessee.
The demonstration site is approximately 200 ft west of the access road entrance to the plateau area above Gallaher Road. The plateau area is a large, flat, unpaved area approximately the size of a football field. The plateau was constructed by "cutting and fill- ing" with soil removed from a hillside (about 30 ft high) located along the southeastern side of the site about 25 years ago. The plateau was graded to its current contour and has not been used for any other known purpose.
Description of Soil Testing and Results I d
Soil testing was performed at the site on September 8 and September 9, 1993. The test report includes soil moisture contents, sieve analyses (hydrometer), and unit weight determination. A total of six test borings were drilled with augers to depths ranging from 25 to 46.3 ft. Moisture content samples were taken in 5 4 intervals during penetration testing. The moist unit weight of the sample was obtained with a Shelby tube. The unit weight of the undrained soil at boring B-5 was 108.8 lbAt3. Subsurface soils encountered at the site at the time of our exploration generally consisted of 13 to 22 ft of fill soils that overlie resid- ual soils. The fill soils were composed of stiff to hard red-brown silty clay, with varying amounts of chert fragments. The residual soils were composed of stiff to soft red-brown to brown silty clay and clayey silt, with varying amounts of chert fragments. The soils were very fine as determined by hydrometer testing. The consistency of residual soil generally graded from stiff to soft with depth. The residual soils at the site are typical of the soils encountered overlying the dolomite of the Knox Group of the lower Ordovician System in the Oak Ridge area.
Moisture contents obtained from the soil samples show the following:
II I I I I II
1 3 37.2 32.3 33.9
2 9 43.0 12.1 26.5
4 6 37.8 20.8 27.9
I1 I 1 I I 5 8 40.0 16.8 31.2 11 Fill currently at the site is not the result of placement of the soil from a remote location. As already discussed, the plateau was con- structed about 25 years ago by a previous owner and was formed in a cut and fill fashion with soils from the adjacent hillside. All of the material observed during the soil analysis was homogenous and indigenous to the immediate area for each borehole. It is not known whether the fill was compacted when placed, but the soil is very stiff as shown by the penetration testing. The plateau is unpaved and flat (no slope), does not require grading, and supports a ground cover consisting of a few weeds (no grass or trees).
- Page AI
U.S. Department of Energy
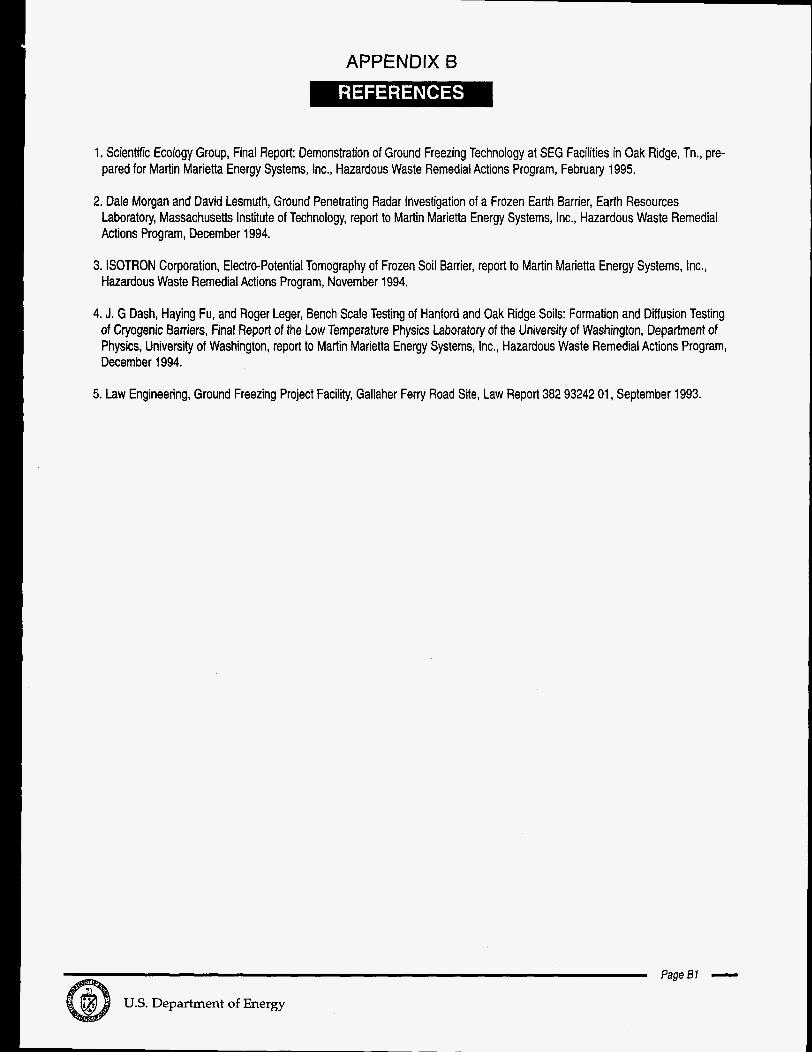
APPENDIX B
1. Scientific Ecology Group, Final Report: Demonstration of Ground Freezing Technology at SEG Facilities in Oak Ridge, Tn., pre- pared for Martin Marietta Energy Systems, Inc., Hazardous Waste Remedial Actions Program, February 1995.
2. Dale Morgan and David Lesmuth, Ground Penetrating Radar Investigation of a Frozen Earth Barrier, Earth Resources Laboratory, Massachusetts Institute of Technology, report to Martin Marietta Energy Systems, Inc., Hazardous Waste Remedial Actions Program, December 1994.
3. ISOTRON Corporation, Electro-Potential Tomography of Frozen Soil Barrier, report to Martin Marietta Energy Systems, Inc., Hazardous Waste Remedial Actions Program, November 1994.
4. J. G Dash, Haying Fu, and Roger Leger, Bench Scale Testing of Hanford and Oak Ridge Soils: Formation and Diffusion Testing of Cryogenic Barriers, Final Report of the Low Temperature Physics Laboratory of the University of Washington, Department of Physics, University of Washington, report to Martin Marietta Energy Systems, Inc., Hazardous Waste Remedial Actions Program, December 1994.
5. Law Engineering, Ground Freezing Project Facility, Gallaher Ferry Road Site, Law Report 382 93242 01, September 1993.
Page51 - U.S. Department of Energy
This report was prepared by:
HAZWRAP HAZARDOUS WASTE REMEDIAL
ACTIONS PROGRAM P.O. Box 2003
Oak Ridge, Tennessee 3783 1-7606 Contact: Randall Snipes/Scott Colburn
(6 15)435-3 128/(6 13435-3470
Report Production by: CoIorado Center
for Environmental Management
999 18th Street, Suite 2750 Denver, Colorado 80202 Contact: .Dawn Kaback (303)297-0180 Ext. 11 1