Embed Size (px)
Citation preview
Journal of Tropical Ecologyhttp://journals.cambridge.org/TRO
Additional services for Journal of Tropical Ecology:
Email alerts: Click hereSubscriptions: Click hereCommercial reprints: Click hereTerms of use : Click here
Fruit and flower phenology at two sites in Kibale National Park, Uganda
C. A. Chapman, R. W. Wrangham, L. J. Chapman, D. K. Kennard and A. E. Zanne
Journal of Tropical Ecology / Volume 15 / Issue 02 / March 1999, pp 189 211DOI: null, Published online: 08 September 2000
Link to this article: http://journals.cambridge.org/abstract_S0266467499000759
How to cite this article:C. A. Chapman, R. W. Wrangham, L. J. Chapman, D. K. Kennard and A. E. Zanne (1999). Fruit and flower phenology at two sites in Kibale National Park, Uganda. Journal of Tropical Ecology, 15, pp 189211
Request Permissions : Click here
Downloaded from http://journals.cambridge.org/TRO, IP address: 128.164.247.189 on 09 Apr 2013
Journal of Tropical Ecology (1999) 15:189–211. With 5 figuresCopyright 1999 Cambridge University Press
Fruit and flower phenology at two sites in KibaleNational Park, Uganda
C. A. CHAPMAN1, R. W. WRANGHAM2, L. J. CHAPMAN1,D. K. KENNARD3 and A. E. ZANNE1
1Department of Zoology, University of Florida, Gainesville, Florida 32611, USA2Peabody Museum, Harvard University, Cambridge, MA 02138, USA3Department of Botany, University of Florida, Gainesville, Florida 32611, USA
(Accepted 29th September 1998)
ABSTRACT. Examination of phenological patterns of tropical trees at differenttemporal and spatial scales can elucidate biotic and abiotic factors that correlatewith fruiting, flowering and/or leaf set patterns. In this study, 3793 trees from 104species in Kibale National Park, Uganda were monitored. The trees were selectedfrom two sites (Kanyawara and Ngogo) separated by 10 km. Trees were monitoredmonthly to document community-wide and population-level fruiting and floweringpatterns for a maximum of 76 mo. Analysis of two sites over a number of yearspermitted examination of generalities of patterns found on smaller spatial andtemporal scales. Spectral analysis indicated that community-level flowering andfruiting at Kanyawara exhibited regular annual peaks, although the floweringpeaks were of shorter duration. At Ngogo, community-level flowering also dis-played regular annual peaks, but fruiting had an irregular pattern with no distinctpeaks. The abundance of fruiting trees at Kanyawara was negatively related to theminimum temperature in the previous season (3–7 mo prior). Since fruitingtended to peak when the first wet season of the year was ending and the dry seasonwas beginning, this suggests that the minimum temperature in the previous dryseason is important in determining how many individuals fruit. Flowering at Kan-yawara peaked immediately after the maximum annual period of high irradiance.Within-species synchronization was evident in the flowering for all species exam-ined at Ngogo and for 64% of those at Kanyawara. Fruiting was synchronous withinspecies for 64% of the species at both sites. Despite this general community-levelsynchronization, the months of peak fruiting and flowering for some species variedmarkedly among years. Furthermore, for a number of species the timing of fruitingor flowering events differed between Kanyawara and Ngogo. For some species,trends that were suggested from one year of data were not supported when addi-tional years were considered. Although these two sites are close together, sharemany of the same species, and experience similar climatic regimes, many phenolo-gical patterns were site-dependent.
KEY WORDS: Africa, flowering, fruiting, Kibale National Park, phenology, season-ality, seed dispersal, spectral analysis, tropical trees
189
C . A . C H A P M A N E T A L .190
INTRODUCTION
Studies of tropical rain forests suggest that phenological patterns of trees aredriven by a variety of factors including: abiotic characters such as rainfall,irradiance, and temperature (Ashton et al. 1988, Newbery et al. 1998, Opler et
al. 1976, van Schaik 1986, van Schaik et al. 1993, Sun et al. 1996, Tutin &Fernandez 1993); mode of seed dispersal (Charles-Dominique et al. 1981,Smythe 1970, Snow 1965, Wheelwright 1985); activity of pollinators or seeddispersers (Frankie et al. 1974, Rathke & Lacey 1985, Snow 1965); variationin germination conditions (Frankie et al. 1974, Janzen 1967); canopy position(Newstrom et al. 1994a); and relative abundance of the trees themselves (vanSchaik et al. 1993). For example, it is thought that fruit ripening may occur ata time when conditions for dispersal are optimal. Some evidence suggests thatwind-dispersed seeds may ripen during the dry season when tradewinds arestronger and leaves are often absent, allowing for greater wind dispersal (e.g.,Newstrom et al. 1994a). In contrast, some animal-dispersed fleshy-fruited spe-cies have their peak fruiting period during the rainy season, perhaps due toincreased moisture levels necessary for fruit production (Lieberman 1982,Rathke & Lacey 1985). Phenological studies of temperate forests and tropicaldry forests often detect clearly defined seasonal patterns associated withmarked changes in rainfall and temperature (Hilty 1980, Lieberman 1982).However, some studies have suggested that phenological patterns of tropicallowland rain forests are not as well defined (Putz 1979). The more continuoushigh temperatures and moisture that typify lowland rain forests foster growthall year long (Richards 1996). The phenological patterns that result are diverseand the environmental cues influencing the patterns remain generally obscure(van Schaik 1986).
An understanding of the phenological patterns in different geographicalregions and of factors underlying these patterns is important for a number ofreasons. First, frugivores are the dominant group of vertebrates in most trop-ical forests (Emmons et al. 1983, Fleming et al. 1987, Gautier-Hion et al. 1985,Terborgh 1986), and regional differences in their abundance may be causedby differences in food availability (Terborgh & van Schaik 1987). Second, anunderstanding of phenological patterns and factors underlying these patternswill assist conservation scientists in predicting consequences of perturbationssuch as atypical climatic events (Foster 1982b) or global warming (Tutin &Fernandez 1993, Tutin & White in press). Third, phenological patterns arelinked to many processes governing forest function and structure including:population biology of pollinators, dispersers, seed predators, and herbivores,interspecific competition among trees, and processes of primary production(Newstrom et al. 1994a, Smythe 1970, van Schaik et al. 1993). Thus, an under-standing of what governs phenological process is valuable in understandingforest function and structure and in providing the basis for developing manage-ment options. For example, during timber harvesting, maintenance of trees
Fruit and flower phenology in Ugandan forests 191
producing fruit in periods of habitat-wide fruit scarcity could increase the car-rying capacity of the post-harvest area for frugivores (White 1994), or loggingcould be initiated after the period of peak seed set to facilitate regeneration.
In this study, we examine flowering and fruiting patterns for up to 76 mofor 3793 trees from 104 species at two sites in Kibale National Park, Uganda.We use spectral analysis (Fourier analysis) to detect cycles in fruiting andflowering at the two sites. We quantify community- and population-level pheno-logy and compare phenological cycles of emergent and mid-storey species, andcommon and rare species. We have attempted to overcome some shortcomingsthat have limited some previous studies in three ways. First, each month wemonitored a large number of trees at each location. Second, the study wasconducted over a 6-y period, thus it is possible to assess the generality of pat-terns observed in any one year by comparing years. Finally, by contrasting twosites within one region we can provide an initial examination of the generalityof the patterns obtained from one site.
METHODS
Study sitesKibale National Park (766 km2) is located in western Uganda, just east of
the Ruwenzori Mountains (0° 13′–0° 41′N and 30° 19′–30° 32′E). The moistevergreen forest is transitional between lowland rain forest and montane forest(Chapman & Chapman 1997; Skorupa 1988; Struhsaker 1975, 1997). Kibale iscomprised of mature forest, swamp, grassland, plantation and secondary forest(Butynski 1990).
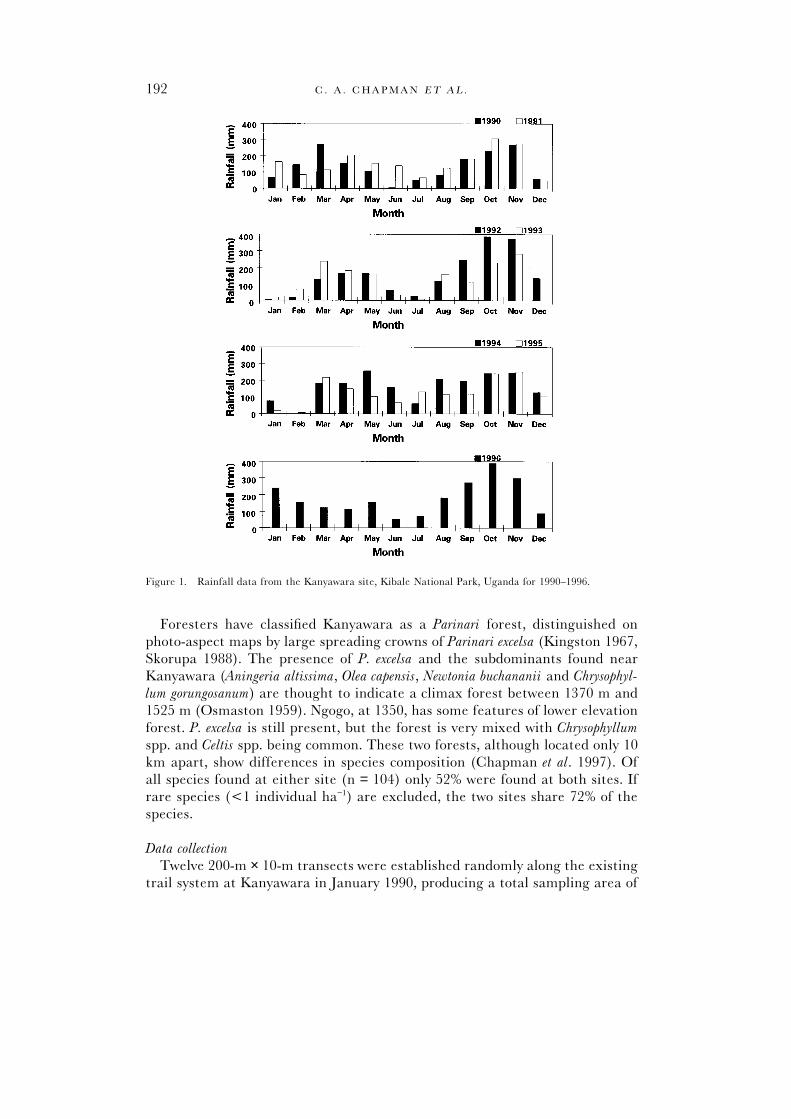
We analysed phenological patterns from two relatively undisturbed siteswithin the park (Kanyawara (K-30) and Ngogo). Kanyawara is located at anelevation of 1500 m and receives a mean annual rainfall of 1700 mm (1984–1996). Mean daily minimum temperature is 15.5 °C, and mean daily maximumtemperature is 23.7 °C (1990–1996; Chapman & Chapman 1997). Ngogo islocated at an elevation of 1350 m and receives a mean annual rainfall of 1500mm (1977–1984). Mean daily minimum temperature is 16.7 °C, and meandaily maximum temperature is 24.2 °C (1977–1984; Butynski 1990). Both studyareas consist of a series of moderately undulating valleys with an average slopeof 8.7° at Kanyawara and 6.0° at Ngogo. Within each site there are elevationalchanges from hill tops to valley bottoms that are often as large as 150–200 m(measured with a Paulin Micro Surveying Altimeter). It rains on an average of166 d per year (Kingston 1967), but the pattern of rainfall is bimodal in distri-bution. May–August and December–February tend to be drier than othermonths, with the May–August dry period of longer duration than the seconddry season. On average, the first rains of the year (March–April) are less severethan the September–November rains. Despite these bimodal trends, there isgreat year-to-year variation in the magnitude, onset, and duration of wet anddry seasons (Figure 1).
C . A . C H A P M A N E T A L .192
Figure 1. Rainfall data from the Kanyawara site, Kibale National Park, Uganda for 1990–1996.
Foresters have classified Kanyawara as a Parinari forest, distinguished onphoto-aspect maps by large spreading crowns of Parinari excelsa (Kingston 1967,Skorupa 1988). The presence of P. excelsa and the subdominants found nearKanyawara (Aningeria altissima, Olea capensis, Newtonia buchananii and Chrysophyl-lum gorungosanum) are thought to indicate a climax forest between 1370 m and1525 m (Osmaston 1959). Ngogo, at 1350, has some features of lower elevationforest. P. excelsa is still present, but the forest is very mixed with Chrysophyllumspp. and Celtis spp. being common. These two forests, although located only 10km apart, show differences in species composition (Chapman et al. 1997). Ofall species found at either site (n = 104) only 52% were found at both sites. Ifrare species (<1 individual ha−1) are excluded, the two sites share 72% of thespecies.
Data collectionTwelve 200-m × 10-m transects were established randomly along the existing
trail system at Kanyawara in January 1990, producing a total sampling area of
Fruit and flower phenology in Ugandan forests 193
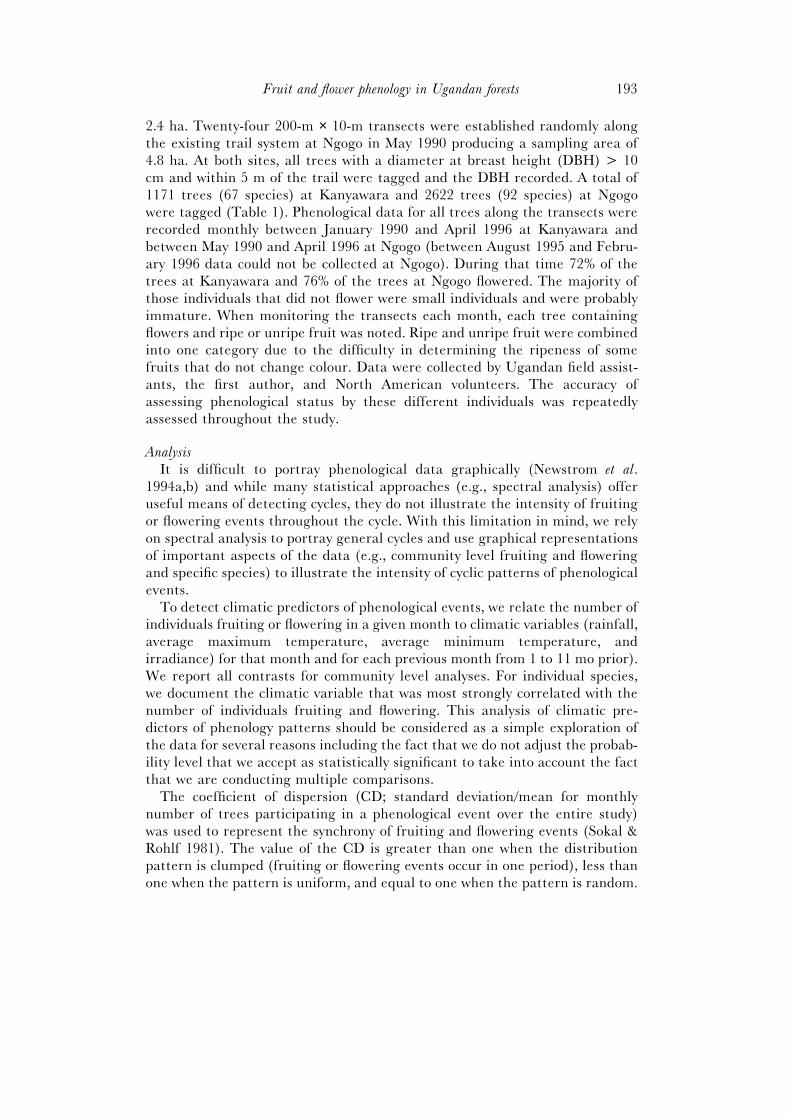
2.4 ha. Twenty-four 200-m × 10-m transects were established randomly alongthe existing trail system at Ngogo in May 1990 producing a sampling area of4.8 ha. At both sites, all trees with a diameter at breast height (DBH) > 10cm and within 5 m of the trail were tagged and the DBH recorded. A total of1171 trees (67 species) at Kanyawara and 2622 trees (92 species) at Ngogowere tagged (Table 1). Phenological data for all trees along the transects wererecorded monthly between January 1990 and April 1996 at Kanyawara andbetween May 1990 and April 1996 at Ngogo (between August 1995 and Febru-ary 1996 data could not be collected at Ngogo). During that time 72% of thetrees at Kanyawara and 76% of the trees at Ngogo flowered. The majority ofthose individuals that did not flower were small individuals and were probablyimmature. When monitoring the transects each month, each tree containingflowers and ripe or unripe fruit was noted. Ripe and unripe fruit were combinedinto one category due to the difficulty in determining the ripeness of somefruits that do not change colour. Data were collected by Ugandan field assist-ants, the first author, and North American volunteers. The accuracy ofassessing phenological status by these different individuals was repeatedlyassessed throughout the study.
AnalysisIt is difficult to portray phenological data graphically (Newstrom et al.
1994a,b) and while many statistical approaches (e.g., spectral analysis) offeruseful means of detecting cycles, they do not illustrate the intensity of fruitingor flowering events throughout the cycle. With this limitation in mind, we relyon spectral analysis to portray general cycles and use graphical representationsof important aspects of the data (e.g., community level fruiting and floweringand specific species) to illustrate the intensity of cyclic patterns of phenologicalevents.
To detect climatic predictors of phenological events, we relate the number ofindividuals fruiting or flowering in a given month to climatic variables (rainfall,average maximum temperature, average minimum temperature, andirradiance) for that month and for each previous month from 1 to 11 mo prior).We report all contrasts for community level analyses. For individual species,we document the climatic variable that was most strongly correlated with thenumber of individuals fruiting and flowering. This analysis of climatic pre-dictors of phenology patterns should be considered as a simple exploration ofthe data for several reasons including the fact that we do not adjust the probab-ility level that we accept as statistically significant to take into account the factthat we are conducting multiple comparisons.
The coefficient of dispersion (CD; standard deviation/mean for monthlynumber of trees participating in a phenological event over the entire study)was used to represent the synchrony of fruiting and flowering events (Sokal &Rohlf 1981). The value of the CD is greater than one when the distributionpattern is clumped (fruiting or flowering events occur in one period), less thanone when the pattern is uniform, and equal to one when the pattern is random.
C . A . C H A P M A N E T A L .194
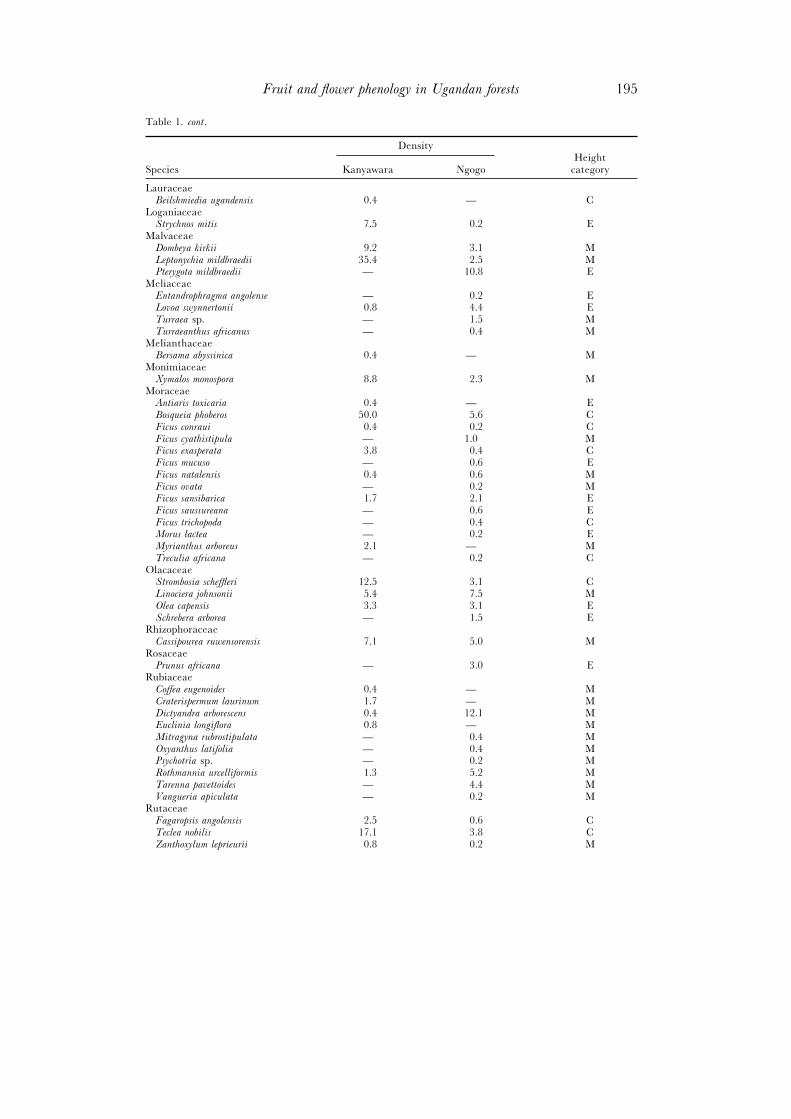
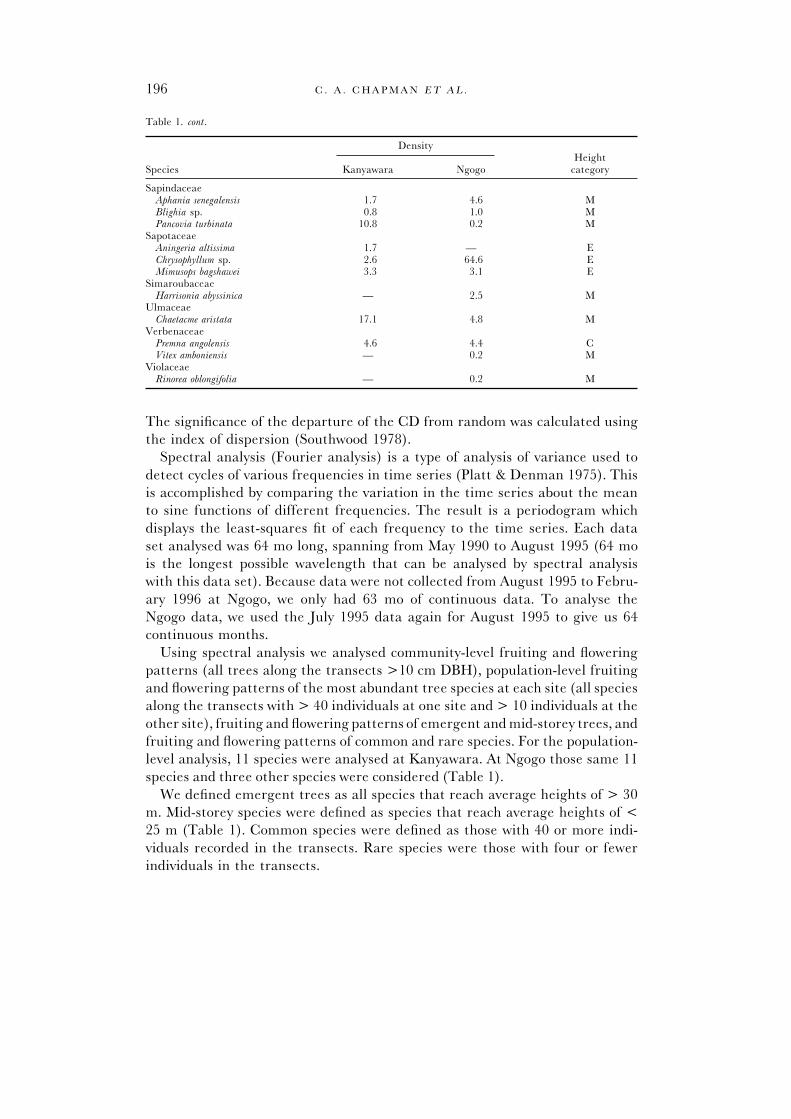
Table 1. Tree density (individuals ha−1) and tree height category of the trees for which phenology wasmonitored in Kibale National Park, Uganda: C, canopy; E, emergent; M, midstorey.
DensityHeight
Species Kanyawara Ngogo category
AnacardiaceaePseudospondias microcarpa 1.7 1.3 C
AnnonaceaeMonodora myristica 0.4 0.4 CUvariopsis congensis 60.4 100.6 M
ApocynaceaeFuntumia latifolia 33.8 36.3 CPleiocarpa pycnantha 1.3 1.3 MRauvolfia oxyphylla — 2.1 MTabernaemontana sp. 4.6 34.4 M
AraliaceaePolyscias fulva 0.8 0.2 C
BalanitaceaeBalanites wilsoniana 1.7 1.7 E
BignoniaceaeKigelia moosa 3.3 0.8 MMarkhamia lutea 50.0 24.8 CSpathodea campanulata 0.8 2.3 M
BoraginaceaeCordia millenii 0.4 0.2 E
CanellaceaeWarbugia ugandensis — 1.3 E
CapparidaceaeEuadenia eminens — 0.2 MMaerua duchesnei 1.3 0.4 M
CelastraceaeCassine buchananii 0.4 2.7 E
CeltidaceaeCeltis africana 4.2 1.0 CCeltis durandii 47.1 57.5 CCeltis mildbraedii — 0.2 E
ChrysobalanaceaeParinari excelsa 2.9 0.2 E
EbenaceaeDiospyros abyssinica 40.0 69.0 C
EuphorbiaceaeCroton sp. 0.8 0.4 CMacaranga scheiwinfurthii — 0.4 MMargaritaria discoide — 2.1 CNeoboutonia sp. 1.3 7.9 MSapium ellipticum — 0.6 CThecacoris lucida 1.3 — M
FabaceaeAlbizia grandibracteata 1.3 — CMillettia dura 3.3 7.7 MNewtonia buchananii — 0.2 EPiptadeniastrum africanum — 1.9 E
FlacourtiaceaeCasearia sp. 1.3 0.2 EDasylepis sp. 1.3 7.9 MLindackeria sp. — 1.3 MOncoba sp. — 0.4 M
GuttiferaeSymphonia globulifera 0.4 — E
IcacinaceaeApodytes dimidiata 0.8 — C
Fruit and flower phenology in Ugandan forests 195
Table 1. cont.
DensityHeight
Species Kanyawara Ngogo category
LauraceaeBeilshmiedia ugandensis 0.4 — C
LoganiaceaeStrychnos mitis 7.5 0.2 E
MalvaceaeDombeya kirkii 9.2 3.1 MLeptonychia mildbraedii 35.4 2.5 MPterygota mildbraedii — 10.8 E
MeliaceaeEntandrophragma angolense — 0.2 ELovoa swynnertonii 0.8 4.4 ETurraea sp. — 1.5 MTurraeanthus africanus — 0.4 M
MelianthaceaeBersama abyssinica 0.4 — M
MonimiaceaeXymalos monospora 8.8 2.3 M
MoraceaeAntiaris toxicaria 0.4 — EBosqueia phoberos 50.0 5.6 CFicus conraui 0.4 0.2 CFicus cyathistipula — 1.0 MFicus exasperata 3.8 0.4 CFicus mucuso — 0.6 EFicus natalensis 0.4 0.6 MFicus ovata — 0.2 MFicus sansibarica 1.7 2.1 EFicus saussureana — 0.6 EFicus trichopoda — 0.4 CMorus lactea — 0.2 EMyrianthus arboreus 2.1 — MTreculia africana — 0.2 C
OlacaceaeStrombosia scheffleri 12.5 3.1 CLinociera johnsonii 5.4 7.5 MOlea capensis 3.3 3.1 ESchrebera arborea — 1.5 E
RhizophoraceaeCassipourea ruwensorensis 7.1 5.0 M
RosaceaePrunus africana — 3.0 E
RubiaceaeCoffea eugenoides 0.4 — MCraterispermum laurinum 1.7 — MDictyandra arborescens 0.4 12.1 MEuclinia longiflora 0.8 — MMitragyna rubrostipulata — 0.4 MOxyanthus latifolia — 0.4 MPsychotria sp. — 0.2 MRothmannia urcelliformis 1.3 5.2 MTarenna pavettoides — 4.4 MVangueria apiculata — 0.2 M
RutaceaeFagaropsis angolensis 2.5 0.6 CTeclea nobilis 17.1 3.8 CZanthoxylum leprieurii 0.8 0.2 M
C . A . C H A P M A N E T A L .196
Table 1. cont.
DensityHeight
Species Kanyawara Ngogo category
SapindaceaeAphania senegalensis 1.7 4.6 MBlighia sp. 0.8 1.0 MPancovia turbinata 10.8 0.2 M
SapotaceaeAningeria altissima 1.7 — EChrysophyllum sp. 2.6 64.6 EMimusops bagshawei 3.3 3.1 E
SimaroubaceaeHarrisonia abyssinica — 2.5 M
UlmaceaeChaetacme aristata 17.1 4.8 M
VerbenaceaePremna angolensis 4.6 4.4 CVitex amboniensis — 0.2 M
ViolaceaeRinorea oblongifolia — 0.2 M
The significance of the departure of the CD from random was calculated usingthe index of dispersion (Southwood 1978).
Spectral analysis (Fourier analysis) is a type of analysis of variance used todetect cycles of various frequencies in time series (Platt & Denman 1975). Thisis accomplished by comparing the variation in the time series about the meanto sine functions of different frequencies. The result is a periodogram whichdisplays the least-squares fit of each frequency to the time series. Each dataset analysed was 64 mo long, spanning from May 1990 to August 1995 (64 mois the longest possible wavelength that can be analysed by spectral analysiswith this data set). Because data were not collected from August 1995 to Febru-ary 1996 at Ngogo, we only had 63 mo of continuous data. To analyse theNgogo data, we used the July 1995 data again for August 1995 to give us 64continuous months.
Using spectral analysis we analysed community-level fruiting and floweringpatterns (all trees along the transects >10 cm DBH), population-level fruitingand flowering patterns of the most abundant tree species at each site (all speciesalong the transects with > 40 individuals at one site and > 10 individuals at theother site), fruiting and flowering patterns of emergent and mid-storey trees, andfruiting and flowering patterns of common and rare species. For the population-level analysis, 11 species were analysed at Kanyawara. At Ngogo those same 11species and three other species were considered (Table 1).
We defined emergent trees as all species that reach average heights of > 30m. Mid-storey species were defined as species that reach average heights of <25 m (Table 1). Common species were defined as those with 40 or more indi-viduals recorded in the transects. Rare species were those with four or fewerindividuals in the transects.
Fruit and flower phenology in Ugandan forests 197
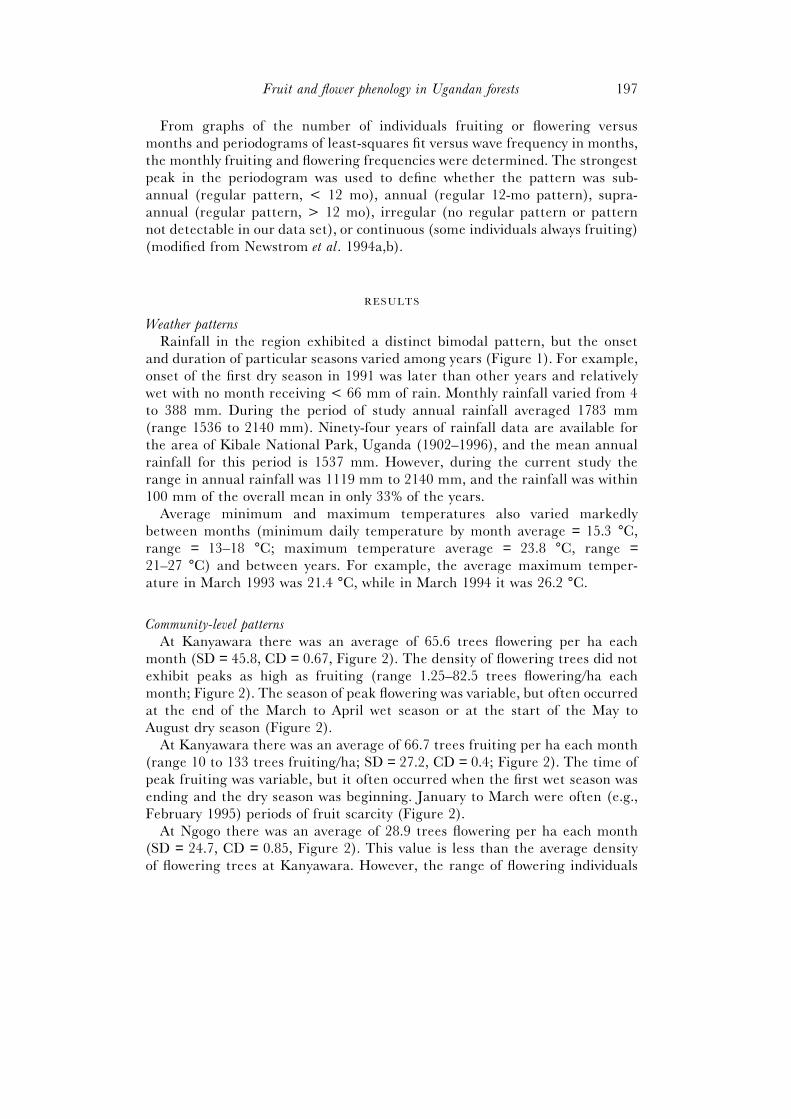
From graphs of the number of individuals fruiting or flowering versusmonths and periodograms of least-squares fit versus wave frequency in months,the monthly fruiting and flowering frequencies were determined. The strongestpeak in the periodogram was used to define whether the pattern was sub-annual (regular pattern, < 12 mo), annual (regular 12-mo pattern), supra-annual (regular pattern, > 12 mo), irregular (no regular pattern or patternnot detectable in our data set), or continuous (some individuals always fruiting)(modified from Newstrom et al. 1994a,b).
RESULTS
Weather patternsRainfall in the region exhibited a distinct bimodal pattern, but the onset
and duration of particular seasons varied among years (Figure 1). For example,onset of the first dry season in 1991 was later than other years and relativelywet with no month receiving < 66 mm of rain. Monthly rainfall varied from 4to 388 mm. During the period of study annual rainfall averaged 1783 mm(range 1536 to 2140 mm). Ninety-four years of rainfall data are available forthe area of Kibale National Park, Uganda (1902–1996), and the mean annualrainfall for this period is 1537 mm. However, during the current study therange in annual rainfall was 1119 mm to 2140 mm, and the rainfall was within100 mm of the overall mean in only 33% of the years.
Average minimum and maximum temperatures also varied markedlybetween months (minimum daily temperature by month average = 15.3 °C,range = 13–18 °C; maximum temperature average = 23.8 °C, range =21–27 °C) and between years. For example, the average maximum temper-ature in March 1993 was 21.4 °C, while in March 1994 it was 26.2 °C.
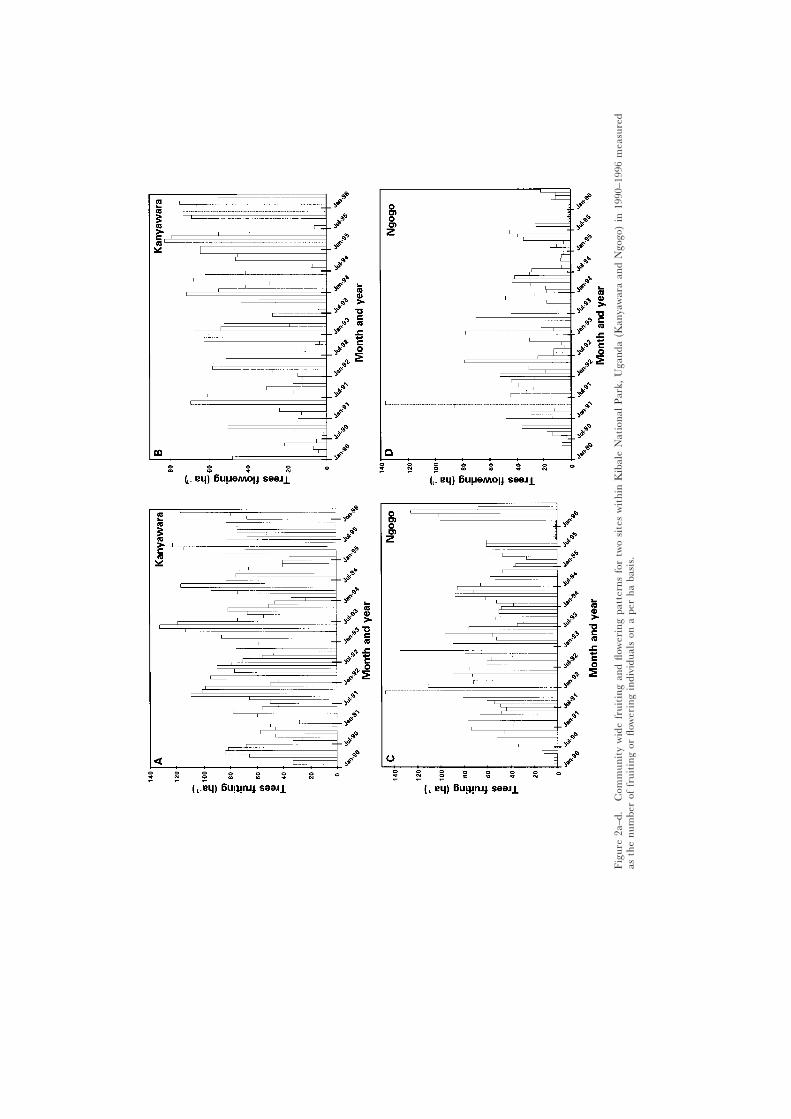
Community-level patternsAt Kanyawara there was an average of 65.6 trees flowering per ha each
month (SD = 45.8, CD = 0.67, Figure 2). The density of flowering trees did notexhibit peaks as high as fruiting (range 1.25–82.5 trees flowering/ha eachmonth; Figure 2). The season of peak flowering was variable, but often occurredat the end of the March to April wet season or at the start of the May toAugust dry season (Figure 2).
At Kanyawara there was an average of 66.7 trees fruiting per ha each month(range 10 to 133 trees fruiting/ha; SD = 27.2, CD = 0.4; Figure 2). The time ofpeak fruiting was variable, but it often occurred when the first wet season wasending and the dry season was beginning. January to March were often (e.g.,February 1995) periods of fruit scarcity (Figure 2).
At Ngogo there was an average of 28.9 trees flowering per ha each month(SD = 24.7, CD = 0.85, Figure 2). This value is less than the average densityof flowering trees at Kanyawara. However, the range of flowering individuals
Fruit and flower phenology in Ugandan forests 199
ha−1 per month at Ngogo (range between months = 3.3–136.7 flowering indi-viduals ha−1) was much greater than at Kanyawara. At Ngogo, a number ofcommon species flowered synchronously in May 1992 producing a very highdensity of flowering trees, which did not occur in any of the other years.
The average monthly density of fruiting trees at Ngogo was 60.2 fruitingtrees ha−1 (SD = 26.5, range = 146.9–11.3 fruiting trees ha−1, CD = 0.44, Figure2), which was similar to Kanyawara. However, there was less regularity in thetiming of seasonal peaks than at Kanyawara (Figure 2; see also spectral ana-lysis below).
At both sites the number of trees flowering in any given month was lowerthan the number of trees fruiting (Figure 2). This is unexpected since fruitingis contingent on flowering. However, the duration of flowering is typically short,while trees can bear fruit for a number of months. Furthermore, because ofthe difficulty in determining the ripeness of fruits of some species that do notchange colour, a tree was considered to be fruiting if it was bearing either ripeand/or unripe fruit. For example, Monodora myristica trees will often bear fruitfor up to 6 mo (S. Balcomb, pers. comm.).
Spectral analysisSpectral analysis indicated that community-level flowering at Kanyawara had
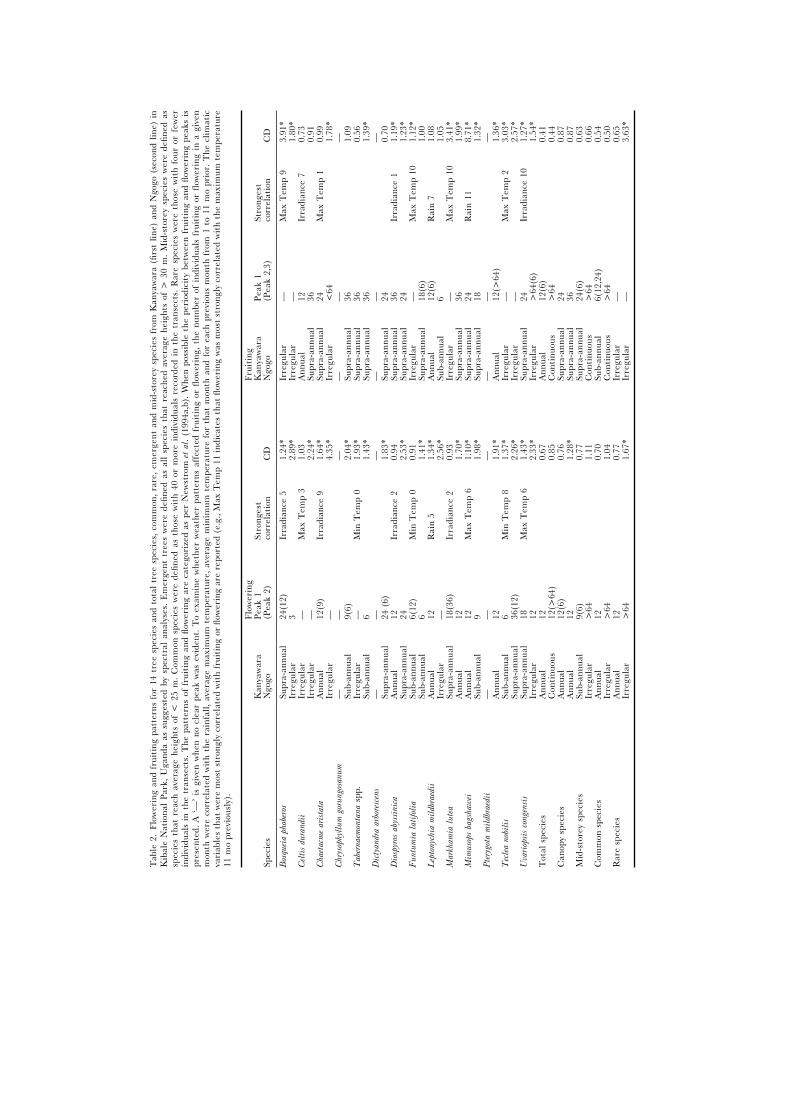
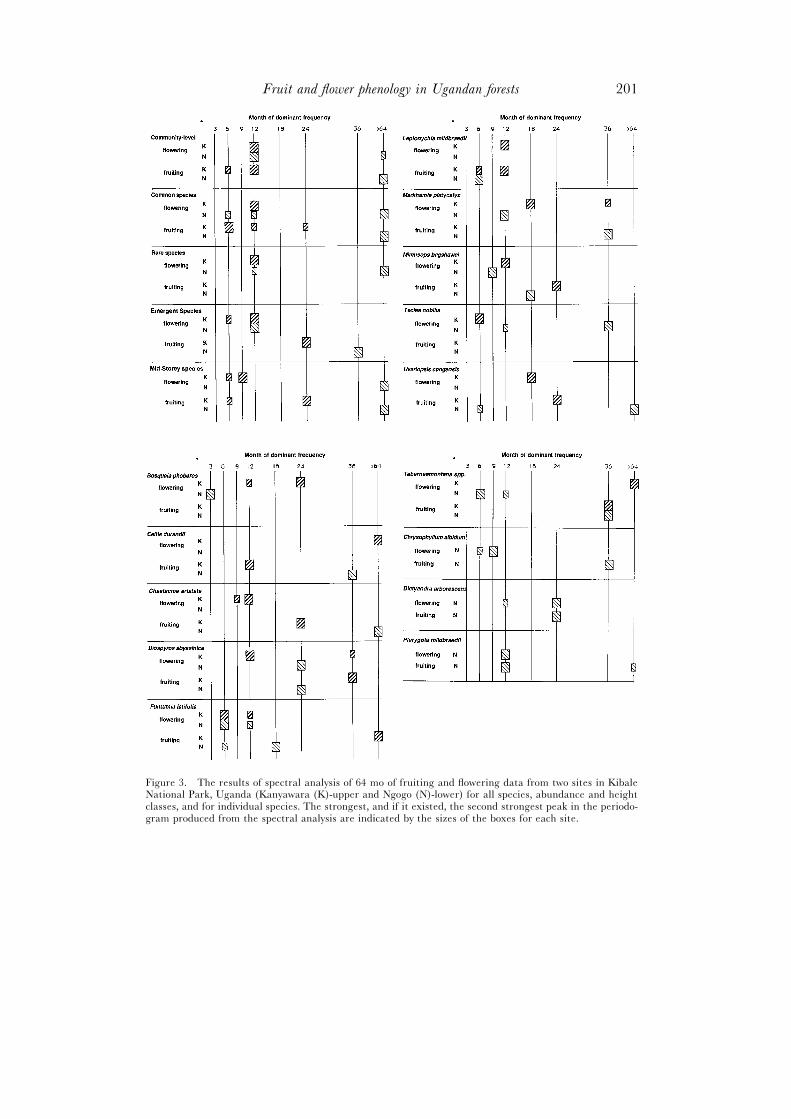
a 12-mo periodicity. In contrast, community-level fruiting at Kanyawara wascontinuous with some individuals fruiting at all times of the year, although12-mo peaks were evident (Table 2 and Figure 3). Species categorized ascommon and rare showed synchronized 12-mo flowering peaks at Kanyawara.Common species had a strong 6-mo fruiting peak with weak 12- and 24-mopeaks, while rare species had an irregular fruiting pattern. Mid-storey andemergent species at Kanyawara both had strong 9-mo and weak 6-mo floweringpatterns and 24-mo fruiting patterns. Mid-storey species also had a weak 6-mofruiting pattern. Mid-storey and emergent species were synchronized in theirflowering patterns, but their fruiting patterns were offset.
Population-level patterns for fruiting and flowering at Kanyawara varied.Flowering patterns included irregular (two species), sub-annual (two species),annual (four species), and supra-annual (three species). Fruiting patternsincluded irregular (four species), annual (two species), and supra-annual (fivespecies). Leptonychia mildbraedii was the only species that showed the same peri-odicity for its fruiting and flowering (12-mo). The 10 other species all showeddiffering patterns. For example, Celtis durandii had an irregular flowering pat-tern, but had 12-mo fruiting peaks.
At Ngogo, community-level flowering and fruiting both tended to be continu-ous, with individuals of some species flowering or fruiting at all months of theyear (Table 2, Figure 3). However, community-level flowering showed a moredistinct pattern than fruiting with a 12-mo peak frequency, whereas fruitingappeared to have no consistent pattern. For both fruiting and flowering,common species had a more continuous pattern than rare species, which were
Tab
le2.
Flow
erin
gan
dfr
uiti
ngpa
tter
nsfo
r14
tree
spec
ies
and
tota
ltr
eesp
ecie
s,co
mm
on,r
are,
emer
gent
and
mid
-sto
rey
spec
ies
from
Kan
yaw
ara
(firs
tlin
e)an
dN
gogo
(sec
ond
line)
inK
ibal
eN
atio
nal
Park
,U
gand
aas
sugg
este
dby
spec
tral
anal
yses
.E
mer
gent
tree
sw
ere
defin
edas
all
spec
ies
that
reac
hed
aver
age
heig
hts
of>
30m
.M
id-s
tore
ysp
ecie
sw
ere
defin
edas
spec
ies
that
reac
hav
erag
ehe
ight
sof
<25
m.
Com
mon
spec
ies
wer
ede
fined
asth
ose
wit
h40
orm
ore
indi
vidu
als
reco
rded
inth
etr
anse
cts.
Rar
esp
ecie
sw
ere
thos
ew
ith
four
orfe
wer
indi
vidu
als
inth
etr
anse
cts.
The
patt
erns
offr
uiti
ngan
dflo
wer
ing
are
cate
gori
zed
aspe
rN
ewst
rom
etal
.(19
94a,
b).
Whe
npo
ssib
leth
epe
riod
icit
ybe
twee
nfr
uiti
ngan
dflo
wer
ing
peak
sis
pres
ente
d.A
‘—’
isgi
ven
whe
nno
clea
rpe
akw
asev
iden
t.T
oex
amin
ew
heth
erw
eath
erpa
tter
nsaf
fect
edfr
uiti
ngor
flow
erin
g,th
enu
mbe
rof
indi
vidu
als
frui
ting
orflo
wer
ing
ina
give
nm
onth
wer
eco
rrel
ated
wit
hth
era
infa
ll,av
erag
em
axim
umte
mpe
ratu
re,a
vera
gem
inim
umte
mpe
ratu
refo
rth
atm
onth
and
for
each
prev
ious
mon
thfr
om1
to11
mo
prio
r.T
hecl
imat
icva
riab
les
that
wer
em
ost
stro
ngly
corr
elat
edw
ith
frui
ting
orflo
wer
ing
are
repo
rted
(e.g
.,M
axT
emp
11in
dica
tes
that
flow
erin
gw
asm
ost
stro
ngly
corr
elat
edw
ith
the
max
imum
tem
pera
ture
11m
opr
evio
usly
).
Flow
erin
gFr
uiti
ngK
anya
war
aPe
ak1
Stro
nges
tK
anya
war
aPe
ak1
Stro
nges
tSp
ecie
sN
gogo
(Pea
k2)
corr
elat
ion
CD
Ngo
go(P
eak
2,3)
corr
elat
ion
CD
Bos
quei
aph
ober
osSu
pra-
annu
al24
(12)
Irra
dian
ce5
1.24
*Ir
regu
lar
—M
axT
emp
93.
91*
Irre
gula
r3
2.89
*Ir
regu
lar
—1.
80*
Cel
tis
dura
ndi
iIr
regu
lar
—M
axT
emp
31.
03A
nnua
l12
Irra
dian
ce7
0.73
Irre
gula
r—
2.24
*Su
pra-
annu
al36
0.91
Cha
etac
me
aris
tata
Ann
ual
12(9
)Ir
radi
ance
91.
64*
Supr
a-an
nual
24M
axT
emp
10.
99Ir
regu
lar
—4.
35*
Irre
gula
r<
641.
78*
Chr
ysop
hyll
um
goru
ngo
san
um
——
——
——
Sub-
annu
al9(
6)2.
04*
Supr
a-an
nual
361.
09T
aber
nae
mon
tan
asp
p.Ir
regu
lar
—M
inT
emp
01.
93*
Supr
a-an
nual
360.
56Su
b-an
nual
61.
43*
Supr
a-an
nual
361.
39*
Dic
tyan
dra
arbo
resc
ens
——
——
——
Supr
a-an
nual
24(6
)1.
83*
Supr
a-an
nual
240.
70D
iosp
yros
abys
sin
ica
Ann
ual
12Ir
radi
ance
20.
94Su
pra-
annu
al36
Irra
dian
ce1
1.19
*Su
pra-
annu
al24
2.53
*Su
pra-
annu
al24
1.23
*F
un
tum
iala
tifo
lia
Sub-
annu
al6(
12)
Min
Tem
p0
0.91
Irre
gula
r—
Max
Tem
p10
1.12
*Su
b-an
nual
61.
41*
Supr
a-an
nual
18(6
)1.
00L
epto
nyc
hia
mil
dbra
edii
Ann
ual
12R
ain
51.
34*
Ann
ual
12(6
)R
ain
71.
08Ir
regu
lar
—2.
56*
Sub-
annu
al6
1.05
Mar
kham
ialu
tea
Supr
a-an
nual
18(3
6)Ir
radi
ance
20.
93Ir
regu
lar
—M
axT
emp
103.
41*
Ann
ual
121.
70*
Supr
a-an
nual
361.
99*
Mim
uso
psba
gsha
wei
Ann
ual
12M
axT
emp
61.
10*
Supr
a-an
nual
24R
ain
118.
71*
Sub-
annu
al9
1.98
*Su
pra-
annu
al18
1.32
*P
tery
gota
mil
dbra
edii
——
——
——
Ann
ual
121.
91*
Ann
ual
12(>
64)
1.36
*T
ecle
an
obil
isSu
b-an
nual
6M
inT
emp
81.
37*
Irre
gula
r—
Max
Tem
p2
3.03
*Su
pra-
annu
al36
(12)
2.26
*Ir
regu
lar
—2.
57*
Uva
riop
sis
con
gen
sis
Supr
a-an
nual
18M
axT
emp
61.
43*
Supr
a-an
nual
24Ir
radi
ance
101.
27*
Irre
gula
r12
2.33
*Ir
regu
lar
>64
(6)
1.54
*T
otal
spec
ies
Ann
ual
120.
67A
nnua
l12
(6)
0.41
Con
tinu
ous
12(>
64)
0.85
Con
tinu
ous
>64
0.44
Can
opy
spec
ies
Ann
ual
12(6
)0.
76Su
pra-
annu
al24
0.87
Ann
ual
121.
28*
Supr
a-an
nual
360.
87M
id-s
tore
ysp
ecie
sSu
b-an
nual
9(6)
0.77
Supr
a-an
nual
24(6
)0.
63Ir
regu
lar
>64
1.11
Con
tinu
ous
>64
0.66
Com
mon
spec
ies
Ann
ual
120.
70Su
b-an
nual
6(12
,24)
0.54
Irre
gula
r>
641.
04C
onti
nuou
s>
640.
50R
are
spec
ies
Ann
ual
120.
77Ir
regu
lar
—0.
65Ir
regu
lar
>64
1.67
*Ir
regu
lar
—3.
63*
Fruit and flower phenology in Ugandan forests 201
Figure 3. The results of spectral analysis of 64 mo of fruiting and flowering data from two sites in KibaleNational Park, Uganda (Kanyawara (K)-upper and Ngogo (N)-lower) for all species, abundance and heightclasses, and for individual species. The strongest, and if it existed, the second strongest peak in the periodo-gram produced from the spectral analysis are indicated by the sizes of the boxes for each site.
C . A . C H A P M A N E T A L .202
typified by distinct peaks at irregular intervals. Flowering and fruiting peaksof mid-storey species were somewhat offset from peaks of emergent species,but this was not repeated every year. A variety of population-level floweringpatterns were documented at Ngogo including: irregular (five species), sub-annual (four species), supra-annual (three species), and annual (two species).The most common population-level fruiting pattern was supra-annual (eightspecies), followed by irregular (four species), annual, and sub-annual (one spe-cies each). The type of flowering pattern did not always coincide with the typeof fruiting pattern for a given species. For example, Markhamia lutea had anannual flowering pattern with a 12-mo frequency, as well as a supra-annualfruiting pattern with a 36-mo frequency. However, some species did haveflowering and fruiting patterns that shared similar frequencies. For example,Dictyandra arborescens and Diospyros abyssinica had 24-mo frequencies for bothfruiting and flowering patterns.
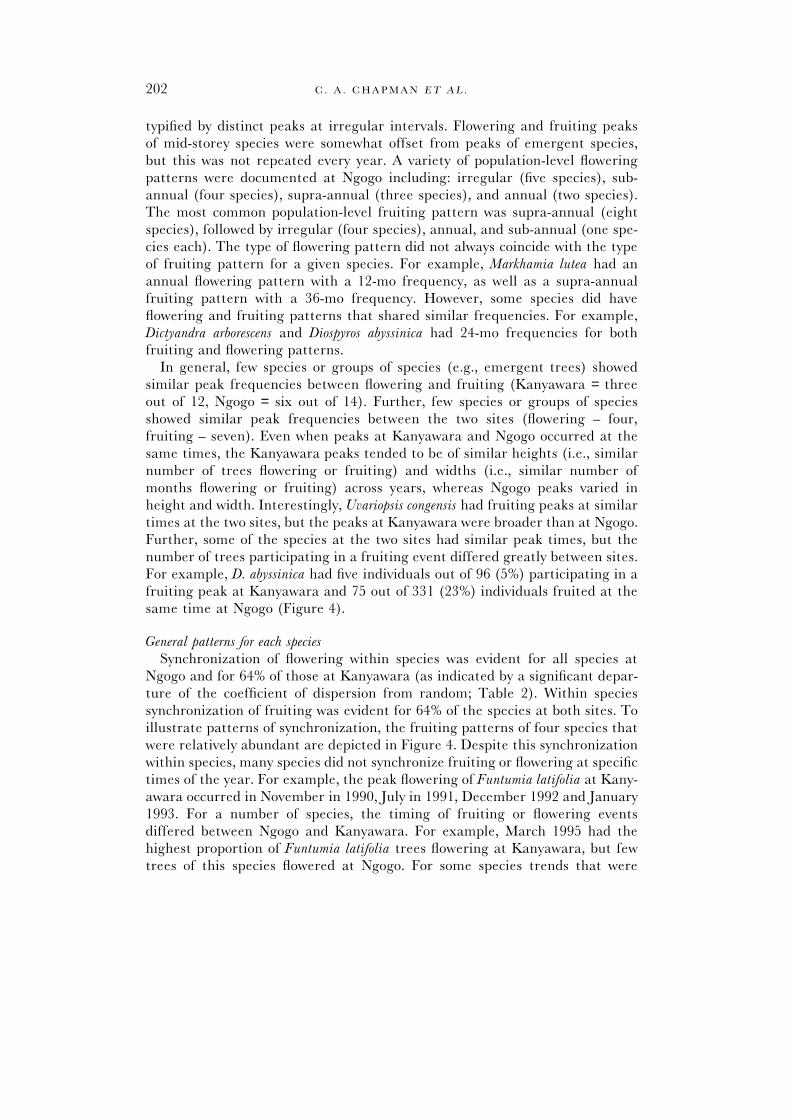
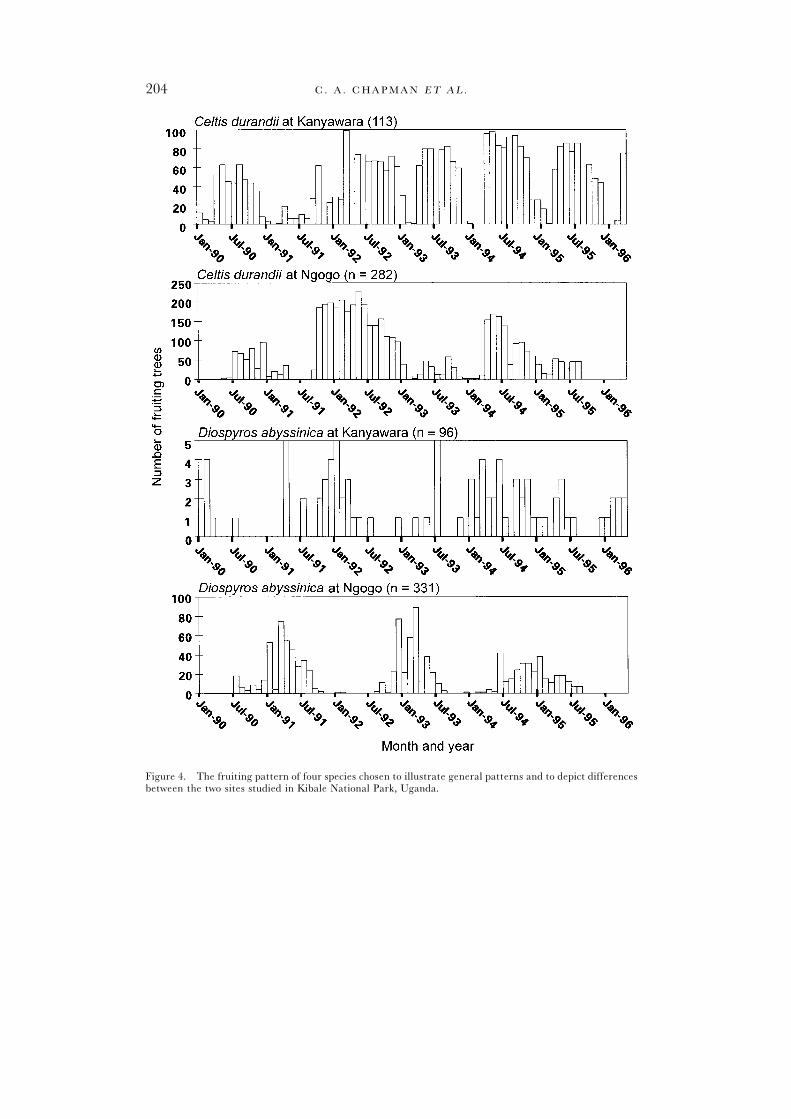
In general, few species or groups of species (e.g., emergent trees) showedsimilar peak frequencies between flowering and fruiting (Kanyawara = threeout of 12, Ngogo = six out of 14). Further, few species or groups of speciesshowed similar peak frequencies between the two sites (flowering – four,fruiting – seven). Even when peaks at Kanyawara and Ngogo occurred at thesame times, the Kanyawara peaks tended to be of similar heights (i.e., similarnumber of trees flowering or fruiting) and widths (i.e., similar number ofmonths flowering or fruiting) across years, whereas Ngogo peaks varied inheight and width. Interestingly, Uvariopsis congensis had fruiting peaks at similartimes at the two sites, but the peaks at Kanyawara were broader than at Ngogo.Further, some of the species at the two sites had similar peak times, but thenumber of trees participating in a fruiting event differed greatly between sites.For example, D. abyssinica had five individuals out of 96 (5%) participating in afruiting peak at Kanyawara and 75 out of 331 (23%) individuals fruited at thesame time at Ngogo (Figure 4).
General patterns for each speciesSynchronization of flowering within species was evident for all species at
Ngogo and for 64% of those at Kanyawara (as indicated by a significant depar-ture of the coefficient of dispersion from random; Table 2). Within speciessynchronization of fruiting was evident for 64% of the species at both sites. Toillustrate patterns of synchronization, the fruiting patterns of four species thatwere relatively abundant are depicted in Figure 4. Despite this synchronizationwithin species, many species did not synchronize fruiting or flowering at specifictimes of the year. For example, the peak flowering of Funtumia latifolia at Kany-awara occurred in November in 1990, July in 1991, December 1992 and January1993. For a number of species, the timing of fruiting or flowering eventsdiffered between Ngogo and Kanyawara. For example, March 1995 had thehighest proportion of Funtumia latifolia trees flowering at Kanyawara, but fewtrees of this species flowered at Ngogo. For some species trends that were
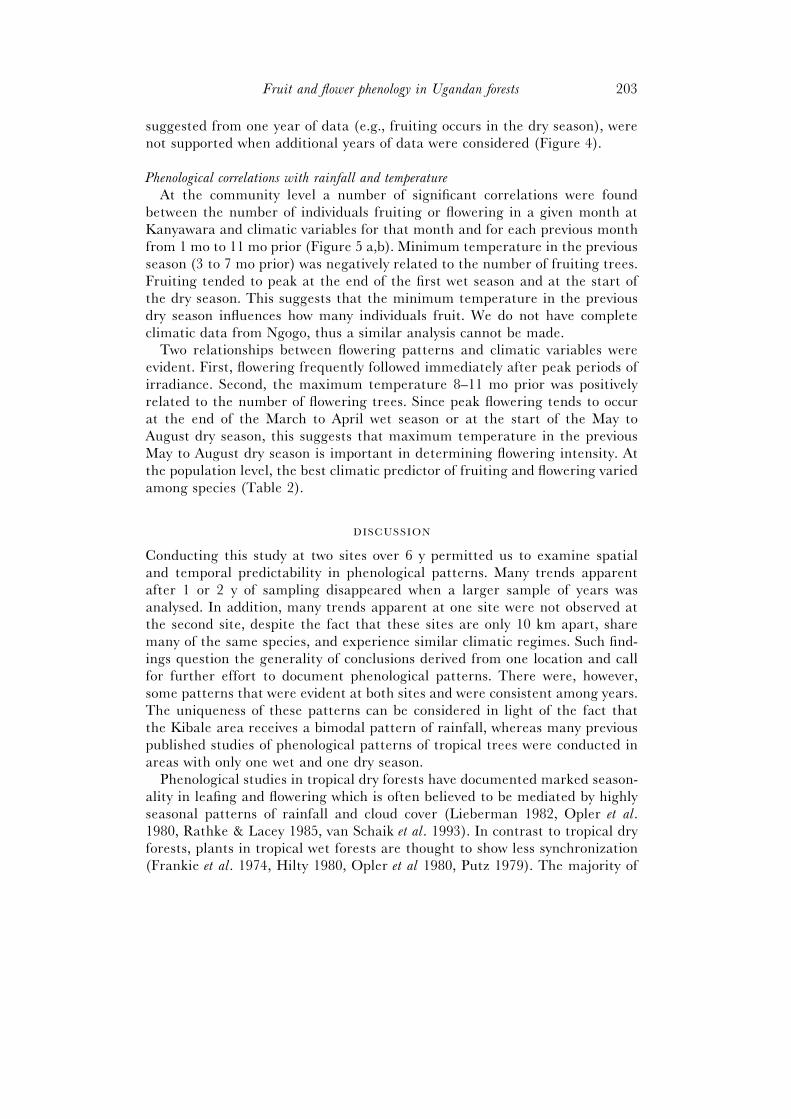
Fruit and flower phenology in Ugandan forests 203
suggested from one year of data (e.g., fruiting occurs in the dry season), werenot supported when additional years of data were considered (Figure 4).
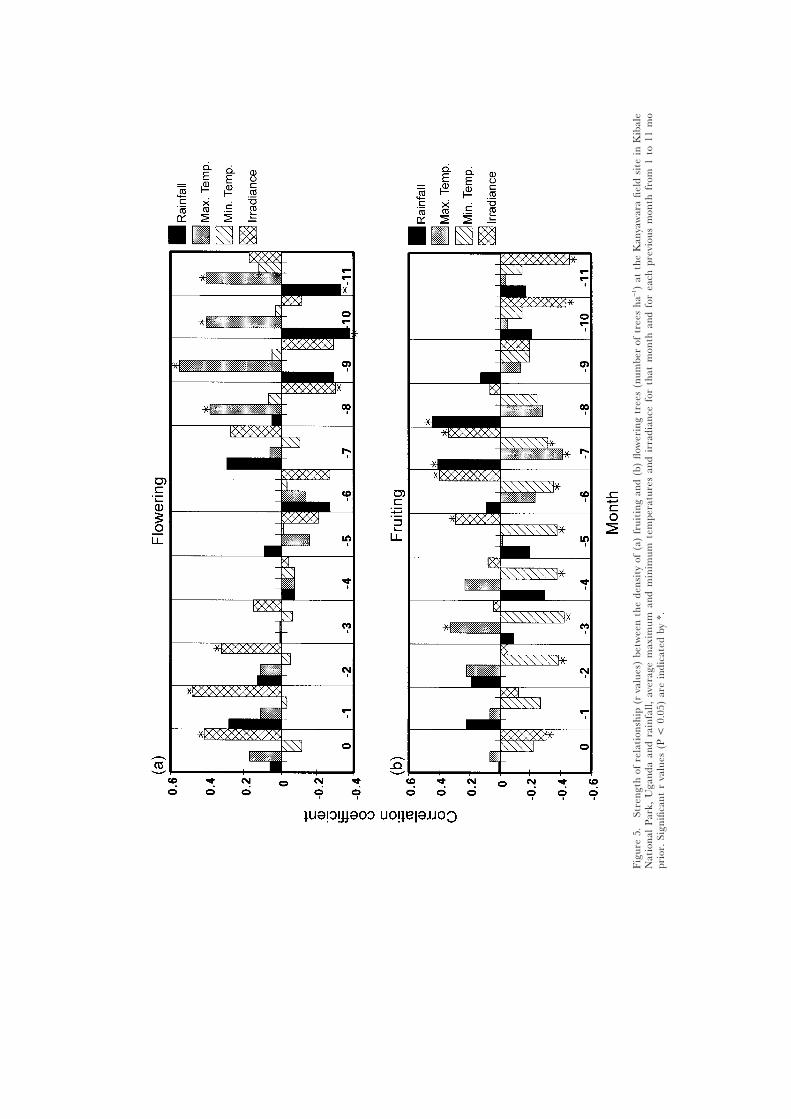
Phenological correlations with rainfall and temperatureAt the community level a number of significant correlations were found
between the number of individuals fruiting or flowering in a given month atKanyawara and climatic variables for that month and for each previous monthfrom 1 mo to 11 mo prior (Figure 5 a,b). Minimum temperature in the previousseason (3 to 7 mo prior) was negatively related to the number of fruiting trees.Fruiting tended to peak at the end of the first wet season and at the start ofthe dry season. This suggests that the minimum temperature in the previousdry season influences how many individuals fruit. We do not have completeclimatic data from Ngogo, thus a similar analysis cannot be made.
Two relationships between flowering patterns and climatic variables wereevident. First, flowering frequently followed immediately after peak periods ofirradiance. Second, the maximum temperature 8–11 mo prior was positivelyrelated to the number of flowering trees. Since peak flowering tends to occurat the end of the March to April wet season or at the start of the May toAugust dry season, this suggests that maximum temperature in the previousMay to August dry season is important in determining flowering intensity. Atthe population level, the best climatic predictor of fruiting and flowering variedamong species (Table 2).
DISCUSSION
Conducting this study at two sites over 6 y permitted us to examine spatialand temporal predictability in phenological patterns. Many trends apparentafter 1 or 2 y of sampling disappeared when a larger sample of years wasanalysed. In addition, many trends apparent at one site were not observed atthe second site, despite the fact that these sites are only 10 km apart, sharemany of the same species, and experience similar climatic regimes. Such find-ings question the generality of conclusions derived from one location and callfor further effort to document phenological patterns. There were, however,some patterns that were evident at both sites and were consistent among years.The uniqueness of these patterns can be considered in light of the fact thatthe Kibale area receives a bimodal pattern of rainfall, whereas many previouspublished studies of phenological patterns of tropical trees were conducted inareas with only one wet and one dry season.
Phenological studies in tropical dry forests have documented marked season-ality in leafing and flowering which is often believed to be mediated by highlyseasonal patterns of rainfall and cloud cover (Lieberman 1982, Opler et al.1980, Rathke & Lacey 1985, van Schaik et al. 1993). In contrast to tropical dryforests, plants in tropical wet forests are thought to show less synchronization(Frankie et al. 1974, Hilty 1980, Opler et al 1980, Putz 1979). The majority of
C . A . C H A P M A N E T A L .204
Figure 4. The fruiting pattern of four species chosen to illustrate general patterns and to depict differencesbetween the two sites studied in Kibale National Park, Uganda.
Fruit and flower phenology in Ugandan forests 205
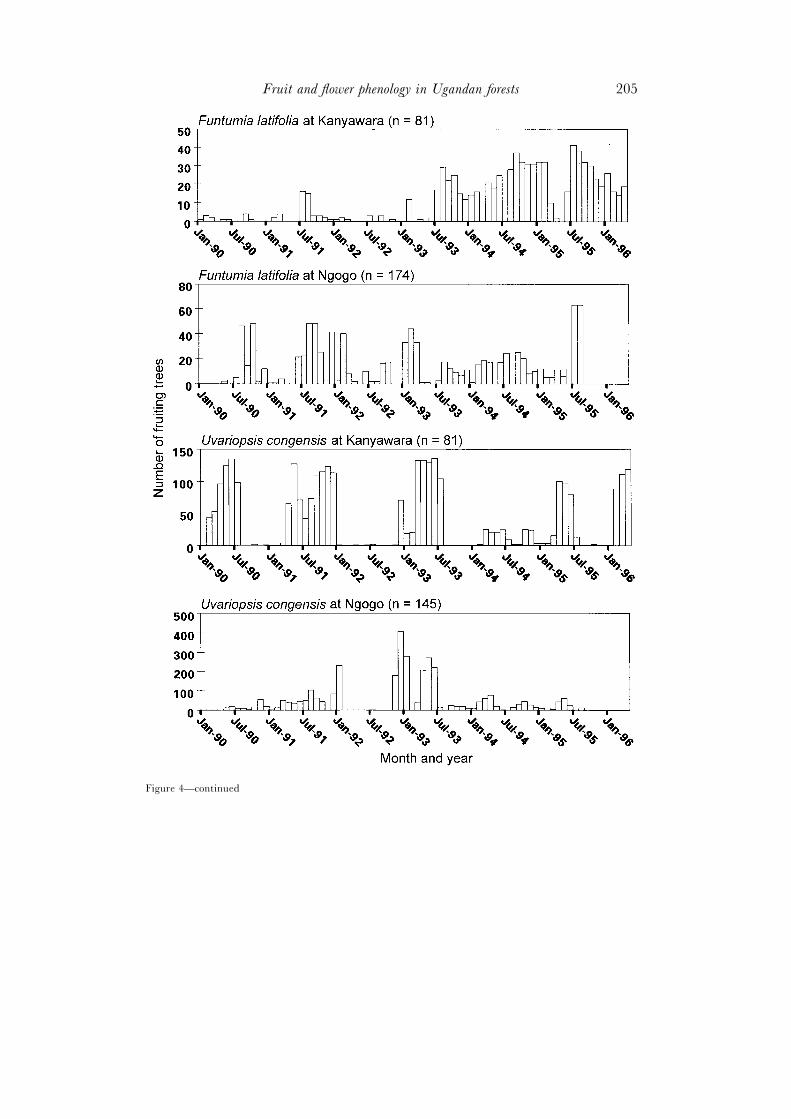
Figure 4—continued
Fruit and flower phenology in Ugandan forests 207
studies in either of these forest types have been conducted in areas with onewet season. In areas with two wet seasons per year, the fitness cost of delayingflowering or fruiting to the next appropriate season may be relatively less thanit would be in areas with only one wet season.
Researchers are often interested in community-level patterns of fruiting andflowering, since this represents the food supply for frugivores and nectivores,the competitive environment for recruitment of trees, and the basis for viewingthe fruiting or flowering of particular species. Community-level fruiting atKanyawara was variable, but it tended to peak when the first rainy season wasending and dry season was beginning. In contrast, at Ngogo there was littleevidence of predictable seasonal cycles in fruiting. Researchers have previouslysuggested that some animal-dispersed fleshy-fruited species have their peakfruiting period during the rainy season, perhaps due to an increased moisturelevel necessary for fruit production (Foster 1982a,b; Janzen 1967, Karr 1976,Lieberman 1982, Rathke & Lacey 1985). The fruiting of trees at the end of thefirst wet season and the start of the dry season at Kanyawara and the absenceof a predictable fruiting pattern at Ngogo, may indicate that biannual rainfallreduces water stress to a level much lower than more seasonal habitats wherethe majority of these previous studies have been conducted (e.g., Costa Rica,Panama, Ghana).
Community-level flowering at both Kanyawara and Ngogo showed 12-mopeaks. The time of the greatest density of flowering trees was variable, buttended to occur when the first rainy season was ending and dry season wasbeginning. The density of flowering trees at Kanyawara was over twice that ofNgogo. Previous research, concentrated in Central America, has documentedlarge geographical variations in flowering patterns (Borchert 1980, 1996; News-trom et al. 1994b). In some species, lack of moisture in the dry season mayinhibit flowering (Borchet 1980, 1986; Reich & Borchert 1984). The fact thatmany species and individuals are flowering at the start of the dry season inKanyawara and Ngogo suggests that, as with fruiting, biannual rains mayreduce water stress.
At Kanyawara the minimum temperature in the previous dry season is cor-related with the number of trees that fruit. Tutin & Fernandez (1993) docu-mented a similar pattern (mean minimum temperature in the dry season andthe size of fruit crop in the subsequent season) for eight tree species in LopeReserve, Gabon and suggested that this pattern was mediated by flower produc-tion. At Kibale, the time between flower set and fruit production within aspecies is often highly variable which suggests that this pattern is not entirelymediated by flower production, but rather by some factor that directly influ-ences fruit production. Newbery et al. (1998) found that the minimum dryseason temperature was related to the fruiting of 16 species monitored inKorup National Park, Cameroon. Korup has only one wet season. Temperaturehas also been demonstrated to correlate with flowering of dipterocarp forests of
C . A . C H A P M A N E T A L .208
Southeast Asia which have various rainfall patterns (Richards 1996, Wycherley1973). Thus, correlations between minimum temperature and phenologicalpatterns is not limited to locations with biannual rainy seasons. It may be thatminimum temperature is simply acting as a cue to synchronize a segmentof the community (Janzen 1974). Alternatively, periods with low night-timetemperatures tend to be those with little insulating cloud cover and high levelsof irradiance. Thus, it may be that the beginning of the dry season is a timewhen energy becomes readily available to the tree, permitting the build-up theassimilates needed for fruiting.
Flowering at Kanyawara seemed to follow immediately after peak periods ofirradiance. This pattern seems common in both weakly seasonal and stronglyseasonal forests (Wright & van Schaik 1994). Van Schaik et al. (1993) suggestthat the young leaves that are abundant when irradiance is at peak levels aremost efficient at photosynthesis and at controlling transpirational water loss.At this time, it is energetically most efficient to transfer assimilates directlyinto growing organs, in this case flowers, rather than storing them for laterallocation (van Schaik et al. 1993).
Intraspecific synchronization was evident in flowering for all species at Ngogoand for 64% of those at Kanyawara. Fruiting was synchronous for 64% of thespecies at both sites. Despite this synchronization, many species did not fruitor flower at specific times of the year. And, for a number of species the timingof fruiting or flowering events differed between Ngogo and Kanyawara. Forsome species, trends suggested from one year of data (e.g., fruiting occurs inthe dry season), were not supported when additional years of data were consid-ered. The high level of synchronization, coupled with peak flowering andfruiting occurring during one period of the year, would suggest that either anannual pattern would be commonly seen, or a supra-annual pattern. Trees witha supra-annual pattern of reproduction would tend to skip a fruiting or flower-ing season. These observations are consistent with the idea that in areas thathave two wet seasons, the fitness cost of delaying flowering or fruiting to thenext appropriate season is relatively less than it would be in areas with annualrains. Supra-annual patterns of fruiting and flowering were commonly observedfor trees in both areas (Ngogo fruiting 57%, flowering 21%; Kanyawara fruiting42%, flowering 25%). In contrast to the data from Kibale, supra-annual pat-terns were only observed in 9% of the trees at La Selva, Costa Rica (Newstromet al. 1994a).
At both sites within Kibale the pattern of fruiting and flowering usuallydiffered. In fact at Kanyawara, Leptonychia mildbraedii was the only species thatshowed the same periodicity for fruiting and flowering (12-mo). The 10 otherspecies analysed all showed differing patterns. For example, Celtis durandii hadan irregular flowering pattern, but had 12-mo fruiting peaks. These two repro-ductive events, pollination versus seed dispersal, are under different selectivepressures. Further, fruiting does not necessarily follow flowering events if pol-lination fails, or if young fruits are aborted or destroyed. For example, M. lutea
Fruit and flower phenology in Ugandan forests 209
had very different flowering and fruiting cycles. This may be attributed to thefact that most flowers are eaten by primates leading to few flowers maturingto fruits (Struhsaker 1978). Finally, fruit maturation can be delayed after pol-lination and different species can take different times to ripen their fruitaccording to light and moisture availability. This can lead to different fruitingand flowering periodicities.
ACKNOWLEDGEMENTS
Funding for this research was provided by the Wildlife Conservation Society,USAID internal support grants, a PSTC USAID grant, NSF grants, NationalGeographic grants, and the Lindbergh Foundation. Permission was given toconduct this research from the Office of the President, Uganda, the NationalResearch Council, the Uganda Wildlife Authority, and the Ugandan ForestDepartment. We would like to thank J. Kasenene, J. Paul, A. Randle, J.Micklem and A. Katende for help with difficult taxonomic identifications. S.Mulkey, J. Paul and J. Putz provided helpful comments on the manuscript.
LITERATURE CITED
ASHTON, P. S., GIVINISH, T. J. & APPANAH, S. 1988. Staggered flowering in the Dipterocarpaceae:new insights into floral induction and the evolution of mast fruiting in the aseasonal tropics. AmericanNaturalist 132:44–66.
BORCHERT, R. 1980. Phenology and ecophysiology of tropical trees: Erythrina poeppigiana O. F. Cook.Ecology 61:1065–1074.
BORCHERT, R. 1996. Phenology and flowering periodicity of neotropical dry forest species: evidencefrom herbarium collections. Journal of Tropical Ecology 12:65–80.
BUTYNSKI, T. M. 1990. Comparative ecology of blue monkeys (Cercopithecus mitis) in high- andlow-density subpopulations. Ecological Monographs 60:1–26.
CHAPMAN, C. A. & CHAPMAN, L. J. 1997. Forest regeneration in logged and unlogged forests ofKibale National Park, Uganda. Biotropica 29:396–412.
CHAPMAN, C. A., CHAPMAN, L. J. WRANGHAM, R. ISABIRYE-BASUTA, G. & BEN-DAVID, K. 1997.Spatial and temporal variability in the structure of a tropical forest. African Journal of Ecology 35:287–302.
CHARLES-DOMINIQUE, P., ATRAMENTOWICZ, M., CHARLES-DOMINIQUE, M., GERARD, H.,HLADIK, A., HLADIK, C. M. & PREVOST, M. F. 1981. Les mammiferes frugivores arboridolesnocturne d’une forest guyanaise: interrelations plantes-animaux. Revue d’Ecologie (Terre et Vie) 35:341–436.
EMMONS, L. H., GAUTIER-HION, A. & DUBOST, G. 1983. Community structure of thefrugivore-folivore forest mammals of Gabon. Journal of Zoology 199:209–222.
FLEMING, T. H., BREITWISCH, R. & WHITESIDES, G. H. 1987. Patterns of tropical vertebratefrugivore diversity. Annual Review of Ecology and Systematics 19:91–109.
FOSTER, R. B. 1982a. The seasonal rhythm of fruit fall on Barro Colorado Island. Pp. 151–172 inLeigh, E. G., Rand, A. S. & Windsor, D. M. (eds.). The ecology of a tropical forest: seasonal rhythms andlong-term changes. Smithsonian Institution Press, Washington, D.C.
FOSTER, R. B. 1982b. Famine on Barro Colorado Island. Pp. 201–212 in Leigh, E. G., Rand, A. S. &Windsor, D. M. (eds.). The ecology of a tropical forest: seasonal rhythms and long-term changes. SmithsonianInstitution Press, Washington, DC.
FRANKIE, G. W., BAKER, H. G. & OPLER, P. A. 1974. Comparative phenological studies of trees intropical wet and dry forests in the lowlands of Costa Rica. Journal of Ecology 62:881–919.
GAUTIER-HION, A., DUPLANTIER, J.-M., QURIS, F., FEER, F., SOURD, C., DECOUX, J.-P.,DUBOST, G., EMMONS, L., ERARD, C., HECKETSWEILER, P., MOUNGAZI, A., ROUSSILHON,C. & THIOLLAY, J.-M. 1985. Fruit characteristics as a basis for fruit choice and seed dispersal ina tropical forest vertebrate community. Oecologia 65:324–337.
C . A . C H A P M A N E T A L .210
HILTY, S. L. 1980. Flowering and fruiting periodicity in a premontane rain forest in Pacific Colombia.Biotropica 12:292–306.
JANZEN, D. H. 1967. Synchronization of sexual reproduction of trees within the dry season in CentralAmerica. Evolution 21:620–637.
JANZEN, D. H. 1974. Tropical blackwater rivers, animals and mast fruiting by the Dipterocarpaceae.Biotropica 6:69–103.
KARR, J. R. 1976. Seasonality, resource availability and community diversity in tropical bird communities.American Naturalist 110:973–994.
KINGSTON, B. 1967. Working plan for the Kibale and Itwara Central Forest Reserves. Ugandan ForestDepartment, Government of Uganda Printer, Entebbe, Uganda. 143 pp.
LIEBERMAN, D. 1982. Seasonality and phenology in a dry tropical forest in Ghana. Journal of Ecology70:791–806.
NEWBERY, D. M., SONGWE, N. C. & CHUYONG, G. B. 1998. Phenology and dynamics of an Africanrainforest at Korup, Cameroon. Pp. 267–308 in Newbery, D. M., Prins, H. H. T. & Brown, N. D.(eds). Dynamics of tropical communities. Blackwell Science, Oxford.
NEWSTROM, L. E., FRANKIE, G. W., BAKER, H. G. & COLWELL, R. 1994a. Diversity of long-termflowering patterns. Pp. 142–160 in McDade, L. A., Bawa, K. S., Hespenheide, H. A. & Hartshorn, G.S. (eds). La Selva: ecology and natural history of a neotropical rain forest. University of Chicago Press,Chicago.
NEWSTROM, L. E., FRANKIE, G. W. & BAKER, H. G. 1994b. A new classification for plant phenologybased on flowering patterns in lowland tropical rainforest trees at La Selva, Costa Rica. Biotropica26:141–159.
OPLER, P. A., FRANKIE, G. W. & BAKER, H. G. 1976. Rainfall as a factor in the release, timing,and synchronization of anthesis by tropical trees and shrubs. Journal of Biogeography 3:231–236.
OPLER, P. A., FRANKIE, G. W. & BAKER, H. G. 1980. Comparative phenological studies of treeletand shrub species in tropical wet and dry forests in the lowlands of Costa Rica. Journal of Ecology68:167–188.
OSMASTON, H. A. 1959. Working plan for the Kibale and Itwara Forests. Uganda Forest Department,Government of Uganda Printer. Entebbe, Uganda. 162 pp.
PLATT, T. & DENMAN, K. L. 1975. Spectral analysis in ecology. Annual Review of Ecology and Systematics6:189–210.
PUTZ, F.E. 1979. Aseasonality in Malaysian tree phenology. Malaysian Forester 42:1–24.RATHKE, B. & LACEY, E. P. 1985. Phenological patterns of terrestrial plants. Annual Review of Ecology
and Systematics 16:179–214.REICH, J. P. & BORCHERT, R. 1984. Water stress and tree phenology in a tropical dry forest in the
lowlands of Costa Rica. Journal of Ecology 72:61–74.RICHARDS, P. W. 1996. The tropical rain forest. (Second edition.) Cambridge University Press, Cambridge.
575 pp.SKORUPA, J. 1988. The effect of selective timber harvesting on rain-forest primates in Kibale Forest, Uganda. Ph.D.
Dissertation, University of California, Davis.SMYTHE, N. 1970. Relationships between fruiting seasons and seed dispersal methods in a neotropical
forest. American Naturalist 104:25–35.SNOW, D. W. 1965. A possible selective factor in the evolution of fruiting seasons in tropical forest.
Oikos 15:274–281.SOKAL, R. R. & ROHLF, F. J. 1981. Biometry: the principles and practice of statistics in biological research.
W.H. Freeman & Company, San Francisco. 859 pp.SOUTHWOOD, T. R. E. 1978. Ecological methods: with particular reference to the study of insect populations.
Chapman & Hall, London. 524 pp.STRUHSAKER, T. T. 1975. The red colobus monkey. University of Chicago Press, Chicago. 311 pp.STRUHSAKER , T. T. 1978. Interrelations of red colobus monkeys and rain-forest trees in the Kibale
Forest, Uganda. Pp. 397–422 in Montgomery, G. G. (ed.). The ecology of arboreal folivores. SmithsonianInstitution Press, Washington, D.C.
STRUHSAKER, T. T. 1997. Ecology of an African rain forest: logging in Kibale and the conflict between conservationand exploitation. University Presses of Florida, Gainesville, Florida. 434 pp.
SUN, C., KAPLIN, B. A., KRISTENSEN, K. A., MUNYALIGOGA, V., MVUKIYUMWAMI, J., KAJONDO,K.K. & MOERMOND, T. C. 1996. Tree phenology in a tropical montane forest in Rwanda. Biotropica28:668–681.
TERBORGH, J. 1986. Community aspects of frugivory in tropical forests. Pp. 371–384 in Estrada, A. &Fleming, T. H. (eds.). Frugivores and seed dispersal. W. Junk Publishers, Dordrecht, The Netherlands.
TERBORGH, J. & VAN SCHAIK, C. P. 1987. Convergence vs. nonconvergence in primate communities.Pp. 205–226 in Gee, J. H. R. & Giller, P.S. (eds). Organization of communities, past and present. BlackwellScientific Publications, Oxford.

Fruit and flower phenology in Ugandan forests 211
TUTIN, C. E. G. & FERNANDEZ, M. 1993. Relationships between minimum temperature and fruitproduction in some tropical forest trees in Gabon. Journal of Tropical Ecology 9:241–248.
TUTIN, C. E. G. & WHITE, L. J. T. in press. The recent evolutionary past of primate communities:likely environmental impacts during the past three millennia. In Fleagle, J. G., Janson, C. H. &Reed, K. Primate communities. Cambridge University Press, Cambridge.
VAN SCHAIK, C. P. 1986. Phenological changes in a Sumatran rain forest. Journal of Tropical Ecology2:327–347.
VAN SCHAIK, C. P., TERBORGH, J. W. & WRIGHT, S. J. 1993. The phenology of tropical forests:adaptive significance and consequences for primary consumers. Annual Review of Ecology and Systematics24:353–377.
WHEELWRIGHT, N. T. 1985. Competition for dispersers, and the timing of flowering and fruiting ina guild of tropical trees. Oikos 44:465–477.
WHITE, L. J. T. 1994. Patterns of fruit-fall phenology in the Lope Reserve, Gabon. Journal of TropicalEcology 10:289–312.
WRIGHT, S.J. & VAN SCHAIK, C. P. 1994. Light and the phenology of tropical trees. American Naturalist143:192–199.
WYCHERLEY, P. R. 1973. The phenology of plants in the humid tropics. Micronesia 9:75–96.