Embed Size (px)
Citation preview

Retrospective Theses and Dissertations Iowa State University Capstones, Theses andDissertations
2006
Frying performance of soybean oils with reducedlinolenate content and methods to monitordeteriorative changesJose Arnaldo GerdeIowa State University
Follow this and additional works at: https://lib.dr.iastate.edu/rtd
Part of the Agriculture Commons, and the Food Science Commons
This Thesis is brought to you for free and open access by the Iowa State University Capstones, Theses and Dissertations at Iowa State University DigitalRepository. It has been accepted for inclusion in Retrospective Theses and Dissertations by an authorized administrator of Iowa State University DigitalRepository. For more information, please contact [email protected].
Recommended CitationGerde, Jose Arnaldo, "Frying performance of soybean oils with reduced linolenate content and methods to monitor deteriorativechanges " (2006). Retrospective Theses and Dissertations. 905.https://lib.dr.iastate.edu/rtd/905
Frying performance of soybean oils with reduced linolenate content and methods to monitor deteriorative changes
by
Jose Amaldo Gerde
A thesis submitted to the graduate faculty
in partial fulfillment of the requirements for the degree of
MASTER OF SCIENCE
Major: Food Science and Technology
Program of Study Committee: Pamela White, Major Professor
Lawrence Johnson Linda Pollak
Iowa State University
Ames, Iowa
2006
Copyright © Jose Amaldo Gerde, 2006. All rights reserved.
UMI Number: 1440076
®
UMI UMI Microform 1440076
Copyright 2007 by ProQuest Information and Learning Company.
All rights reserved. This microform edition is protected against unauthorized copying under Title 17, United States Code.
ProQuest Information and Learning Company 300 North Zeeb Road
P.O. Box 1346 Ann Arbor, Ml 48106-1346

ii
To my father, my mother, and my brother
iii
Table of Contents
Abstract iv
Acknowledgements v
General Introduction 1
Literature Review 3
Lipid Degradation During Frying 3 Frying Oils 7 Oil Quality Determination 8 Improving the Stability of Fats and Oils Without Hydrogénation 12
1. Plant Breeding 12 2. Extruded-Expelled and Physically Refined Oils 14
Near-Infrared Spectroscopy 16 References 18
Frying Performance of No-Trans, Low-Linolenic Acid Soybean Oils 27
Abstract 27 Introduction 28 Materials and Methods 30 Results and Discussion 33 Acknowledgments 38 References 38 Tables and Figures 42
Rapid Determination of Degradation in Frying Oils by NIR Spectroscopy 51
Abstract 51 Introduction 52 Materials and Methods 54 Results and Discussion 56 References 57 Tables and Figures 60
General Conclusions 63

The performance during frying of three expeller-pressed physically refined soybean oils with
different contents of linolenic acid (ULL, 1.5%; LL, 2.6%; control, 5.2%) was tested. French
fries were fried in a commercial-like setting for 6 hr/day during 23 consecutive days. There
were no significant differences in color or in polar material content. The amount of
conjugated dienoic acids was higher in the control than in both ULL and LL oils throughout
the frying process. Free fatty acid levels were not different among the oils until day 14, after
which ULL was higher than the control for the remainder of frying. There were no
differences in painty, buttery, and potato flavors, but the control had higher sensory scores
for rancid flavor. NIR spectroscopy calibrations were developed to determine free fatty acids,
conjugated dienes and total polar materials as methods to reduce time and chemical waste in
frying oil quality determinations.
V
Acknowledgments
I sincerely thank Dr. Pamela White for the opportunity of working with her, for all
her guidance and encouragement in my academic life abroad. I am also deeply grateful to my
committee members, Dr. Lawrence Johnson and Dr. Linda Pollak for their guidance and
support.
I am also grateful to Connie Hardy for all her invaluable help and good disposition
and to Cynthia Shriver for all her assistance with the sensory analysis. Thank you to Dr.
Philip Dixon for his statistical help. I am also grateful to Dr. Charles Hurburgh for his help
with the NIR calibration.
Thank you to all my friends and lab mates, for the great times, their advice, help, and
support. Thank you to Natalia for all her love, support and patience.
My deepest thanks are for my mother and brother for their love and continuous
encouragement throughout my life and Cesareo and Raquel for helping me to come to ISU.
Thank you to God for all the blessings I received.
1
General Introduction
Frying is one of the most important processes in the food industry because it has
several advantages over other cooking methods. Food is cooked quickly and the flavor and
other sensory attributes developed during this process give the food unique characteristics.
These characteristics not only depend on the product that is being fried but on the oil that is
used as the frying medium. Oils are subjected to aggressive conditions during the frying
process because of the high temperature, and the presence of oxygen, water and other
compounds from the food that promote oil degradation. The presence of unsaturated fatty
acids increases the breakdown susceptibility of oils.
For many years, hydrogénation seemed to be the solution to the instability problem in
polyunsaturated oils such as soybean oil. During this process, trans fatty acids isomers are
formed. These trans fats have recently been found to be associated with health problems
including increased risk of coronary heart disease and increased cholesterol levels in human
blood serum. Based on these issues, the Food and Drug Administration passed a rule that
starting on January 1, 2006 manufacturers had to declare in their product labels the content of
trans fat. Because of these health concerns the food industry is trying to find healthier
alternatives to partially hydrogenated oils. Breeding oil crops with altered fatty acid
compositions and implementing oil extraction methods that improve oil stability seem to be
the most viable solutions to replacing partially hydrogenated oils in frying operations.
The general objectives of this study were to evaluate the performance of the oils from
two soybean cultivars with reduced linolenic acid content during frying, and to use the data
from this study to explore and develop a calibration procedure to determine the degree of oil
2
degradation by near-infrared spectroscopy. To achieve these objectives three different
expeller-pressed soybean oils, two with reduced linolenic acid content and one commodity
oil, were evaluated during the frying of French fries in a commercial-like setting. Aliquots of
the oils were taken and analyzed to determine the degree of degradation, and sensory
evaluation of the fries was performed by a trained panel. Oil aliquots also were scanned with
a near-infrared spectrometer to develop a calibration to determine free fatty acids, total polar
material, and conjugated dienoic fatty acid contents.
3
LITERATURE REVIEW
Lipid Degradation During Frying
Deep-fat frying is one of the most important cooking processes used in the food
industry, not only because of the fast cooking process that allows the availability of fresh and
ready-to-eat food in just minutes, but also for the desirable flavor and texture characteristics
developed during this process. These flavor attributes are the result of the chemical and
physical interactions between the food and the frying media (hot oil).
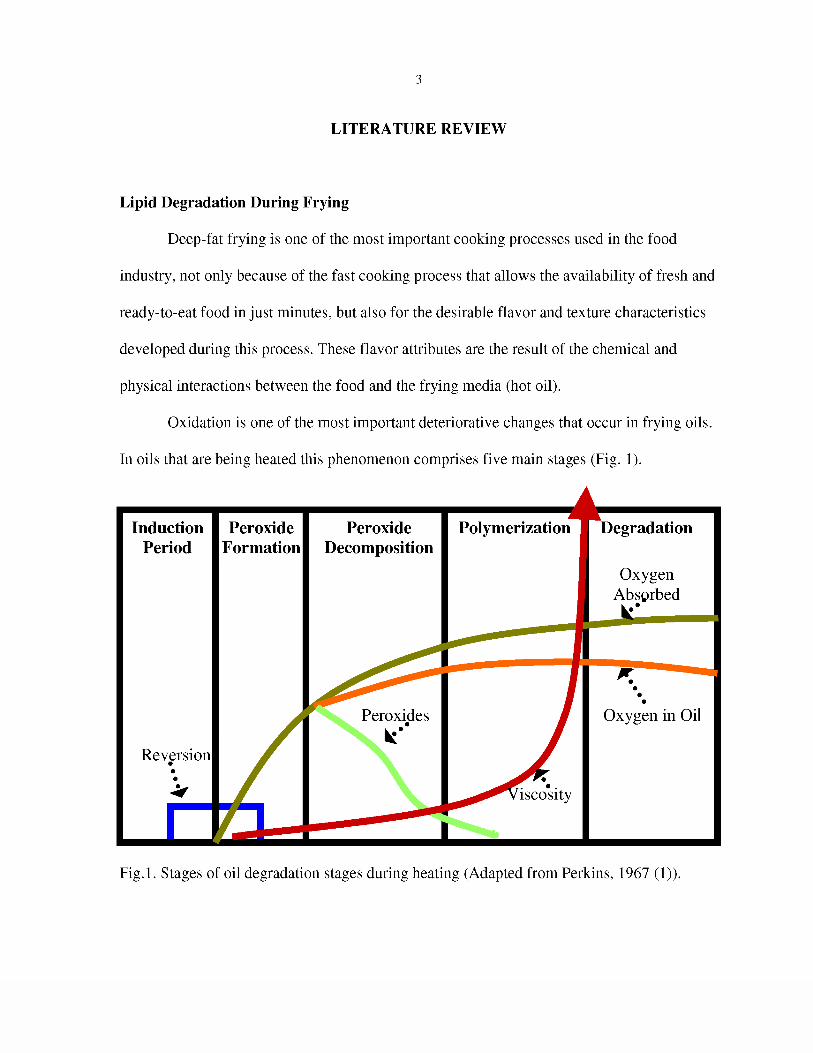
Oxidation is one of the most important deteriorative changes that occur in frying oils.
In oils that are being heated this phenomenon comprises five main stages (Fig. 1).
Induction Period
Peroxide Formation
Peroxide Decomposition
Polymerization Degradation
Oxygen Absorbed
^ I
Reversion
Peroxides
k
Oxygen in Oil
i sco*s i ty
1 1
Fig.l. Stages of oil degradation stages during heating (Adapted from Perkins, 1967 (1)).

4
The first stage of oxidation is the induction period. During this phase, the changes in
the quality of the oil are hard to quantify and the only phenomenon that is significant is oil
reversion where refined oils re-acquire the flavor of crude oils (typical of oils containing
linolenic acid such as soybean, linseed, and rapeseed oils). It is also in this stage that the free
radical mechanism of the oil oxidation is triggered (Initiation).
Initiation:
RH • R + He Eq. 1
Oil reversion can occur under non-oxidative conditions producing some obnoxious
flavors (2). The second stage is signaled by the formation of peroxides through the reaction
of the oxygen present in the system and the fatty acids.
Propagation:
Re + O2 • ROOe Eq. 2
ROOe + RH • ROOH + Re Eq. 3
These peroxides will further degrade in other products that are responsible for the
odor and flavor development (peroxide decomposition).
Decomposition:
ROOH • ROe + OHe Eq.4
5
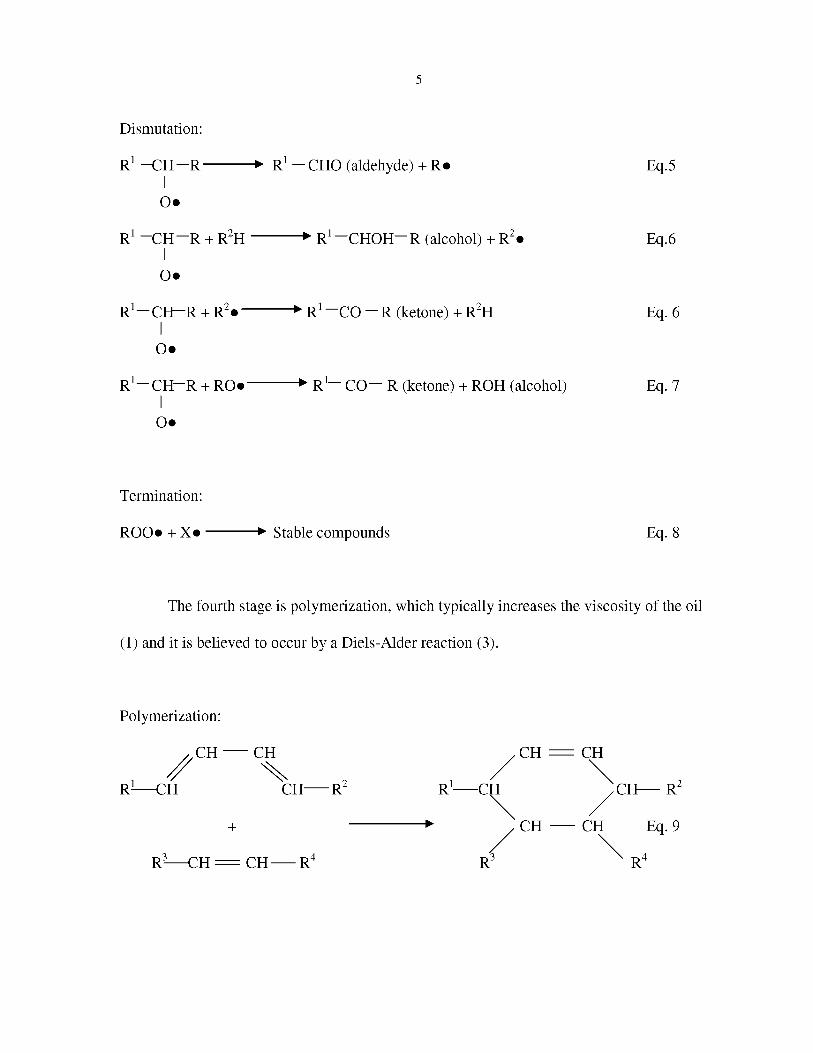
Dismutation:
R1 -CH-R • R1 — CHO (aldehyde) + Re Eq.5 I
Oe
R1 -CH-R + R2H • R1 -CHOH—R (alcohol) + R2e Eq.6
Oe
R1—CH—R + R2e • R1 —CO - R (ketone) + R2H Eq. 6 I
Oe
R1 CH-R + ROe • R1- CO— R (ketone) + ROH (alcohol) Eq. 7 I
Oe
Termination:
ROOe + Xe • Stable compounds Eq. 8
The fourth stage is polymerization, which typically increases the viscosity of the oil
(1) and it is believed to occur by a Diels-Alder reaction (3).
Polymerization:
R-—CH
CH CH
X CH R
+
R3—CH = CH R4
CH = CH
R1 CH :CH R2
CH CH Eq. 9
R R4

6
The final stage is degradation, typical of oils in a very advanced state of
decomposition (1). Beside these reactions which are the result of the oil-oxygen-temperature
interaction, there are other phenomena because of the interaction between food and oil. An
overall scheme of the reactions occurring in an actual fryer is depicted in Fig. 2.
Steam Volatiles (smoke) Antioxidants
Steam Oxygen Food
Free Fatty Acids Di-glycerides
Mono-glycerides Glycerol
Colored Compounds Food Lipids
Hydroperoxides (Conjugated Dienes)
Alcohlols Aldehydes Ketones
Dimers Trimers
Epoxides Alcohols
Flydrocarbons
Acids Flydrocarbons
Dimers Cyclic Compounds
Aeration
Fleating
Oxidation
Fission
Flydrolysis
Dehydration
Absorption Vaporization
Free Radicals
Solubilization
Fig.2. Reactions occurring in a fryer (Adapted from Fritsch (4)).
There are two different types of reactions during frying, physical and chemical
reactions. The most important physical changes are oil absorption by the food, solubilization
of liposoluble compounds from the food into the oil, vaporization of part of the water
7
naturally present in the food, and the introduction of air into the system. Among the chemical
reactions occurring in the oil, besides the oxidative changes already mentioned, hydrolysis of
the triacylglycerides is one of the most important. The steam produced by the vaporization of
the water promotes the formation of free fatty acids and mono and diglycerides, which have
surfactant properties. Hence, they promote foaming (4), which introduces more oxygen as
well as making the frying operation more dangerous for the operator (may produce the
spillage of the oil). Another effect of the high free fatty acids content in the oil is the smoke
produced (5). Simply heating the oil produces dimers and cyclic compounds. Finally, the
oxidation of fatty acids produces a broad variety of hydrocarbons, acids, ketones, alcohols,
and aldehydes (6, 7), most of them accompanied by noticeable sensory properties (8).
Frying Oils
It is because of the reactions that were previously described that the stability of the oil
is of crucial importance when choosing the frying medium. Oil stability is primarily
determined by the fatty acid composition of the oil. The higher the concentration of
unsaturated fatty acids, especially polyunsaturated ones such as linoleic and linolenic acid,
the more unstable the oil (9). It is because of this that the industry has been using
hydrogénation as a means of increasing the stability of oils rich in polyunsaturated fatty acids
(10) such as soybean and canola oils. This process increases the saturation level of the oil,
and also produces trans fatty acid isomers (11). The consumption of fats and oils rich in
trans fatty acids decreases high density lipoprotein cholesterol levels in human blood serum
and increases low density lipoprotein cholesterol levels (12). Also, a positive correlation
between trans fatty acid intake and coronary heart disease in women has been observed in an
8
epidemiological evaluation (13, 14). Because of these effects on human metabolism the
American Heart Association (15) advices consuming not more than 1% of total calories in
the diet from trans fats. The FDA (16) passed a rule that imposed the obligation of including
the amount of trans fats on food labels starting on January 1 2006, in food products
containing 0.5 g of trans fats per serving or more.
For all the above reasons, the food industry is trying to find trans-free alternatives to
hydrogénation. The most promising option is the breeding of oilseeds containing low levels
of fatty acids which are very unstable, such as linolenic acid. There are many studies
showing the benefits of soybean oil with reduced linolenic acid content. Soybean oil typically
contains around 7% linolenic acid. This acid is very unstable because of the presence of three
methylene-separated double bonds (17). Fatemi and Hammond (9) have shown that the
relative reactivity of linolenic acid is 21.6 times the reactivity of oleic acid
(monounsaturated), whereas for linoleic acid (diunsaturated) it is 10.3 times. Because of this
propensity to react in the presence of oxygen, a reduced content of this acid significantly
increases oil stability.
Oil Quality Determination
There are several parameters used to describe the quality and degradation of oils. The
most representative ones are sensory. Flavor, aroma, and color of the oils are the usual
attributes used in food service to decide the continued use or discarding of frying oils (18,
19). It is hard to correlate these subjective aspects to objective and consistent measurements.
Many times the characteristics (chemical or physical) that describe the situation of the oil the
best are difficult or costly to measure. Then, parameters that are directly or indirectly related
9
to the oil quality are measured (20). It is important to make clear that there is no single test
that is totally representative of the overall quality of the oil (4). The following methods are
some of the most widely used means to assess the actual quality of frying oils (20).
Peroxide value (PV) is a measurement of the total oxidative capacity of the
substances formed during the first stages of the oxidation (hydroperoxides). The American
Oil Chemists' Society (AOCS) official method (21) to determine the PV of oils utilizes
indirect titration. The hydroperoxides present in the oil oxidize potassium iodide to iodine.
The iodine formed is further titrated with sodium thiosulfate using starch as indicator. This
method is very sensitive and has been modified by Crowe and White (22) to reduce the
amount of needed sample making it useful for very small samples (0.5 g). Yildiz et al. (23)
compared the performance of three alternative methods to determine peroxide value: NIR
spectroscopy, PeroxySafe™ , and FOX™. They found a very good correlation between the
first two methods and the official method. Because of the short life of the hydroperoxides this
test is useful to determine the quality of fresh oils or of oils that have not been heat abused
(20).
Conjugated dienoic acids (CDA) measures the first change during oxidation of oils
rich in polyunsaturated fatty acids. Generally, this change is the shift in the position of one of
the double bonds, typically separated by a methylene (17), to form conjugated dienoic acids.
The method takes advantage of the capacity of these conjugated double bonds to absorb ultra
violet radiation at 233 nm wavelength. The amount of CDA is determined through
spectrophotometry (21) and is directly calculated from the absorbance value of the sample.
As well as PV, CDA content is a parameter that is representative of the first stages of the
oxidative process.
10
Free fatty acids (FFA) are typically formed through the hydrolysis (chemical or
enzymatic) of the triglycerides. During the frying process the chemical hydrolysis is almost
exclusively the one producing free fatty acids. These free fatty acids, as it previously was
described, are responsible for the smoking and foaming of frying oils (4, 5). The
methodology to determine the content of free fatty acids is based on an acid-base titration
(21, 24). The method senses not only the acids released from the hydrolyzed triglycerides but
the total acidity of the oil. Basically, the oil is dissolved in neutralized ethanol and is titrated
with sodium hydroxide using phenolphthalein as indicator. This acidity is expressed as
milligrams of potassium hydroxide necessary to neutralize one g of fat or directly as a
percentage of oleic acid (21). Percentage as oleic acid is the most preferred way to express
acidity for vegetable oils rich in eighteen-carbon fatty acids. There is no amount of free fatty
acids established as maximum for frying oils in general. For meat and poultry products, the
USDA advices not to continue frying when the free fatty acid level reaches 2% (25).
Fresh refined bleached and deodorized oil is almost completely composed of
triacylglycerides. The polarity of these molecules is very low. When the oils are oxidized, the
fatty acids that comprise the triacylglycerides specifically react with the oxygen to yield
products of a higher polarity. Especially in oils used for frying or that have been heat abused,
the amount of these polar compounds is particularly high. Among these compounds there are
acids, ketones, aldehydes, alcohols, monoglycerides, diglycerides, dimers and polymers. The
total polar material (TPM) content has been found to be a good indicator of the actual abuse
that the oil has had. TPM is measured by column chromatography using a mixture of diethyl
ether and petroleum ether as developing solvents and a silica column. The polar material is
retained by the column and the solvent of the non-polar fraction is evaporated and TPM is

11
calculated by weight difference (26). The maximum amount of TPM allowed in frying oils
ranges between 24 and 27% (27) in many European and South-American countries. In the
United States, legislation does not establish a TPM limit in frying oils. Even though TPM is a
very reliable parameter, the test is time consuming to carry out (26) and the hazardous
solvents needed require using fume hoods. Therefore this test is not widely used by the
industry as a regular quality control tool in frying operations.
High-Performance Size-Exclusion Chromatography (HPSEC) is used to monitor the
formation of high molecular-weight compounds (polymers) in oils that have been heat
abused. White and Wang (28) developed a chromatographic methodology using two p-
spherogel size-exclusion columns (500 and 1000Â). They reported the separation of four
fractions: conjugated triglycerides, dimeric triglycerides, tetrameric triglycerides, and higher
molecular weight compounds. Marquez-Ruiz and Dobarganes (29) reported the separation of
the polar fraction of oils into triacylglycerol dimers, oxidized triacylglycerol monomers,
diacylglycerols and FFA. They reported the successful separation of the polar portion by
solid-phase extraction or by using a silica column and then separating the different polar
compounds by HPSEC.
Several rapid methods have been proposed as quality control tools during frying
operations. These methods are usually based on colorimetric reactions or the measurement of
changes in the dielectric constant of the fat. Dielectric constant has been hard to implement in
real frying operations because the instrument is influenced by many external factors (26).
Croon et al. (30) tested four methods including Foodoil sensor (FOS), RAU-Test, Fritest™,
and Spot test. They found the tests easy to use and accurate enough for evaluating used
frying fat. In another study (31), the performance for monitoring oil degradation of the

12
SafTest™ was evaluated. This test measures malondialdehydes, FFA and peroxides. They
found good correlations for the first two parameters but they do not recommend its use to
determine peroxides in heat-abused oils. Indeed, peroxides should not be used as a measure
of heat abuse in oils, because they are very unstable, and do not give an accurate measure
when extensive heat is applied, as with frying.
Oil Stability Index (OSI) is an accelerated method to determine the oxidative stability
of the oils (21). Two instruments are available to determine the OSI: the Oxidative stability
instrument (Omnion, Inc., Rockland, MA) and the Rancimat (Brinkmann Instruments, Inc.,
Westbury, NY). The oil is placed in a tube that is heated at 100, 110, 120, 130, or 140- C and
air is bubbled in the oil. The volatile compounds formed are absorbed into the water and the
change in the conductivity of the water is constantly measured. OSI is defined as the time
when the change in the rate of oxidation is maximum (maximum of the second derivative of
the conductance with respect to the time). The longer the observed OSI, the more stable the
oil.
Improving the Stability of Fats and Oils Without Hydrogénation
1. Plant Breeding
Breeding oilseeds with modified fatty acid composition is a promising tool to develop
oils that are as stable as those obtained by hydrogénation. The great advantage of breeding is
that it does not produce trans fatty acids while increasing the saturation (stability) level of the
oil.
Soybean, sunflower, corn, and rapeseed (canola) are major crops that have been
13
altered to obtain oils suitable for frying without the need of further chemical hydrogénation.
To accomplish this task, breeders focused their efforts on reducing the amount of linoleic and
linolenic acids in soybean and canola, and the amount of linoleic in sunflower and corn oils.
Rapeseed had been previously modified to reduce the content of erucic acid (22:1) because of
health concerns (32). The result of this work was the development of canola.
Many studies have been conducted to test the performance of these "tailor made" oils
(32, 33). The reduction of linolenic acid in soybean and canola oils increased their oxidative
stability during storage and frying. In the same way, linoleic acid has been replaced by oleic
in sunflower (high and mid-oleic sunflower oils) (34).
In particular, the use of soybean lines with reduced contents of linolenic acid
decreases the formation of some obnoxious odors and flavors typical of the soybean oil
oxidation (fishy, acrid, burnt) (35, 36). In general, soybean oils containing 3% linolenic acid
or less perform better than commodity soybean (36) and cottonseed oils (37). Other studies
showed performances of low-linolenic soybean oils to be similar to partially hydrogenated
soybean oil (36, 38, 39). The increase in the levels of stearic and palmitic acid (saturated)
also increased the oil stability (40, 41). Su and White (42, 43) tested different blends of high-
oleic and regular soybean oils, and found that increasing the content of this monounsaturated
fatty acid enhances the oxidative and flavor stabilities of soybean oils.
Normand et al. (44) compared low-linolenic and commodity soybean oils. They did
not find differences in FFA but based on the TPM content, in contrast to previous work,
regular soybean oil performed better. They suggested that the lower content of tocopherol in
the low-linolenic oil counteracted the effect of the fatty acid modification. They also
proposed tocopherol level as another factor to be considered when breeding crops to enhance

14
oil quality (44, 45).
In corn and sunflower, as well as in soybeans, the stability increased when the
unsaturation level of the oil was reduced (34, 46, 47). Another study showed no differences
in the performance of high-oleic and regular sunflower oils during frying (48) probably
because of the greater tocopherol content in the regular sunflower oil.
2. Extruded-Expelled and Physically Refined Oils
Currently, most of the soybean oil in the United States is solvent-extracted by using
hexane. There has been an increase, however, in the number of plants using mechanical
extraction to recover the oil from the beans (49). These plants have much lower processing
capacities (8-20 tons/day) than do solvent-extraction plants, but at the same time the initial
investment is also much lower ($100,000-$250,000) (50). Because of these two attributes,
farmers, cooperatives and small companies are taking advantage of this technology to
process their grain, especially for processing identity-preserved oilseeds (organic, non-
genetically modified and specialty oils) (49, 51).
This type of processing consists of two stages. The first stage is the extrusion of the
beans during which the material is cooked by the heat generated through friction. This
extrusion process helps to release the oil from the tissues increasing the efficiency of
mechanical extraction (52, 53). The second stage is screw-pressing of the extruded material
to separate the oil from the meal.
The quality of the crude oils when processing commodity soybeans has been reported
to be the same as the quality of solvent-extracted oils (50). However, in beans with increased
content of unsaturated fatty acids the expeller-processed oil was more oxidized and contained

15
lower levels of tocopherols than did solvent-extracted oils, although the differences were
very small (50).
Another process being increasingly used is physical refining of the oils. Typically,
crude oils go through a four-step process after the extraction (degumming, neutralization or
refining, bleaching and deodorization) (54). During neutralization alkali is added to the oil to
convert the FFA to soap, which is later washed away with water. An alternative to this
process is physical refining, which eliminates FFA plus the unsaponifiable fraction by steam
stripping (54). This process is cleaner than alkali refining because it does not use sodium
hydroxide, and requires less initial investment and energy (54, 55). Providing an adequate
pretreatment (degumming and bleaching), the physical refining process is as effective as
alkali refining (56). Physical refining of soybean oil requires exhaustive degumming to
achieve a phosphorus content of 15 ppm (57) to 20 ppm (58). A high content of phosphatides
contributes to darkening of an oil (54).
Because of the small scale and no chemicals needed (hexanes and sodium hydroxide),
expeller extraction and physical refining often are coupled, especially in products that are
considered organic (49, 59). Several studies have been done to determine the effect of the
extraction and refining method on finished oil quality and stability. Leon-Camacho et al. (60)
reported the effects of temperature and time on the formation of trans isomers of linoleic acid
during physical refining of sunflower and soybean oils. They demonstrated that the longer
the time and the greater the temperature, the greater the amount of trans fatty acid isomers
formed. De Greyt et al. (61) reported that the maximum amount of trans isomers of linoleic
acid formed is 2% and that the isomerization of linolenic acid ranged between 3 to 24% of
the initial amount of this fatty acid. Considering soybean oil, these amounts of trans fat are

16
not sufficiently enough to be reported on the label of the commercial oils (16). Minor
changes in the triglyceride composition of the oils that have been physically refined at high
temperatures also have been reported (62).
Regarding the changes in the unsaponifiable fraction, physical refining has been
found to significantly decrease the amount of tocopherols (in the same way as screw-pressing
extraction) (50) and phytosterols naturally present in soybean oil (63). De Greyt and Kellens
(57) reported that the amounts of tocopherols extracted from oil during physical refining can
be controlled by controlling the operation parameters. On the other hand, they reported that
the phytosterols form fatty acid esters because of the high processing temperature and the
substantial FFA (they were not neutralized and washed out) in the medium. These steryl
esters are not as volatile as the free phytosterols and remain in the oil.
Warner and Dunlap (64) found that screw-pressed and physically refined soybean oil
was as stable as solvent-extracted and alkali-refined soybean oil with tertiary butyl
hydroquinone (TBHQ, an antioxidant) and also as partially hydrogenated soybean oil during
frying of French fries. They proposed that the increased stability in the expeller-pressed
physically-refined oil was due to Maillard browning reaction products formed during oil
extraction. Coscione et al. (65) compared screw-pressed, physically refined soybean oil with
solvent-extracted low-linolenic soybean oil during pan-heating for 12 min. The screw-
pressed oil was more stable than the solvent-extracted low linolenic oil.
Near-Infrared Spectroscopy
Spectroscopic techniques have been widely used in detecting and quantifying many
compounds. In general, spectroscopy is based on the capacity of matter to absorb energy.

17
Molecules have two types of properties: static (atomic composition, stereochemistry,
isomeric structure, etc) and dynamic (molecular translation, rotation, and vibration). The last
properties can be considered as energy (66). Generally, dynamic properties depend on static
ones. By measuring changes in the first properties, it is possible to measure the last properties
by extrapolation.
When light hits a molecule, part of the energy is absorbed and the remaining energy is
reflected. Different functional groups absorb energy at different wavelengths and most of
them absorb energy at several wavelengths. Energy absorption also is influenced by other
functional groups close to them. The energy absorbed produces changes in the vibrational
energy of the molecule (atoms oscillations through their bonds). Then, by measuring the
energy absorbed at different wavelengths it is possible to correlate the measurements with
changes in static properties.
Chemometrics is the use of mathematical and statistical methods to correlate
experimental data and the chemical composition or physical properties of the tested samples
(67). The near-infrared zone of the spectrum includes wavelengths from 780 to 2500 nm. By
using chemometric tools such as Partial Least Square (PES) or Principal Component
Analysis (PCA), it is possible to obtain an equation correlating the parts of the spectra that
are most representative of the chemical properties measured in the samples.
NIRS is used widely in crop and plant analyses. Calibrations have been developed to
determine protein, moisture and fiber content in pulses (68), sugar and malic acid in apple
juice, (69) and even fatty acid composition in soybeans (70). Some calibrations have been
successfully developed to monitor oil degradation and quality. Che Man and Moh (71) used
NIR spectroscopy to determine FFA in palm oil over a range of 0.07 to 6.20%. Successful

18
calibrations were developed to determine PV, anisidine value, and CDA (72), FFA, and TPM
(73, 74). NIR spectroscopy is a promising methodology to be used as a clean and fast quality
control tool in food processes in which oil quality has to be monitored (72).
References
1. Perkins, E.G., Formation of Non-Volatile Decomposition Products in Heated Fats and
Oils, Food Technol. 21:611-616 (1967).
2. Frankel, E.N., Volatile Lipid Oxidation Products, Prog. Lipid Res. 22:1-33 (1982).
3. Wang, C., and S. Erhan, Studies of Thermal Polymerization of Vegetable Oils with a
Differential Scanning Calorimeter, J. Am. Oil Chem. Soc. 7(5:1211-1216 (1999).
4. Fritsch, C.W., Measurements of Frying Fat Deterioration: A Brief Review, J. Am. Oil
CAcm. Soc. 58:272-274 (1981).
5. Hartman, L., A.J. Antunes, R. dos Santos Grarati, and M.A. Chaib, The Effect of Free
Fatty Acid on the Taste, Induction Periods and Smoke Points of Edible Oils and Fats,
Lebensm. -Wiss. u. -Technol. 8:114-118 (1975).
6. Thompson, J.A., W.A. May, M.M. Paulose, R.J. Peterson, and S.S. Chang, Chemical
Reactions Involved in the Deep-Fat Frying of Foods. VII. Identification of Volatile
Decomposition Products of Trilinolein, J. Am. Oil Chem. Soc. 55:897-901 (1978).
7. May, W.A., R.J. Peterson, and S.S. Chang, Chemical Reactions Involved in the Deep-Fat
Frying of Foods: IX. Identification of the Volatile Decomposition Products of Triolein, J.
Am. Oil Chem. Soc. 60:990-995 (1983).
8. Dixon, M.D., and E.G. Hammond, The Flavor Intensity of Some Carbonyl Compounds
Important in Oxidized Oils, J. Am. Oil Chem. Soc. <57:1452-1456 (1984).
19
9. Fatemi, S.H., and E.G. Hammond, Analysis of Oleate, Linoleate and Linolenate
Hydroperoxides in Oxidized Ester Mixtures, Lipids 15:379-385 (1980).
10. Frankel, E.N., Lipid Oxidation, Prog. Lipid Res. 19:1-22 (1980).
11. deMan, J.M., Chemical and Physical Properties of Fatty Acids, in Fatty Acids in Foods
and Their Health Implications, edited by C.K. Chow, Marcel Dekker, Inc., New York,
1993, pp 17-46.
12. Mensink, R.P., and M.B. Katan, Effects of Dietary Trans Fatty Acids on High-Density
and Low-Density Lipoprotein Cholesterol levels in Healthy Subjects, N. Engl. J. Med.,
323:439-445 (1990).
13. Willet, W.C., M.J. Stampfer, J.E. Manson, G.A. Colditz, F.E. Speizer, B.A. Rosner, L.A.
Sampson, and C.H. Hennekens, Intakes of Trans Fatty Acids and Risk of Coronary Heart
Disease among Women, Lancet 341:581-585 (1993).
14. Hu, F.B., M.J. Stampfer, J.E. Manson, E. Rimm, G.A. Colditz, B.A. Rosner, C.H.
Hennekens, and W.C. Willett, Dietary Fat Intake and the Risk of Coronary Heart Disease
in Women, M EngZ. J. AW., 337:1491-1499 (1997).
15. Liechtenstein, A.H., L.J., Appel, M. Brands, M. Camethon, S. Daniels, H.A. Franch, B.
Franklin, P. Kris-Etherton, W.S. Harris, B. Howard, N. Karanja, M. Lefevre, L. Rudel, F.
Sacks, L. Van Horn, M. Winston, and J. Wylie-Rosett, Diet and Lifestyle
Recommendations Revision 2006-A Scientific Statement from the American Heart
Association Nutrition Committee, Circulation 114:82-96 (2006).
16. Food and Drug Administration, 21 CFR Part 101 Food Labeling; Trans Fatty Acids in
Nutrition Labeling; Consumer Research to Consider Nutrient Content and Health Claims
and Possible Footnote or Disclosure Statements; Final Rule and Proposed Rule, Federal
20
Register Vol. 68 733:41433-41506 (2003). http://a257.g.akamaitech.net/7/257/2422/14
mar20010800 /edocket.accèss.gpo.gov/2003/pdf/03-17525.pdf (Accessed June 2006).
17. Frankel, E.N., Autoxidation, in Fatty Acids, edited by E.H. Pryde, American Oil
Chemists' Society, Champaign, IL, 1979, pp 353-378.
18. Warner, K., Sensory Evaluation of Oils and Fat-Containing Foods, in Methods to Assess
Quality and Stability of Oils and Fat-Containing Foods, edited by K. Warner and N.A.M.
Eskin, AOCS Press, Champaign, IL, 1995, pp 49-65.
19. Gertz, C., Chemical and Physical Parameters as Quality Indicators of Used Frying Fats,
Eur. J. Lipid S ci. Technol. 103:566-572 (2000).
20. Warner, K., Chemical and Physical Reactions During Frying, in Frying Technology and
Practices, edited by M.K. Gupta, K. Warner, and P.J. White, AOCS Press, Champaign,
IL, 2004, pp 16-28.
21. Official Methods and Recommended Practices of the American Oil Chemists' Society,
edited by D. Firestone, 4th edn., American Oil Chemists' Society, Champaign, IL, 1989.
22. Crowe, T.D., and P.J. White, Adaptation of the AOCS Official Method for Measuring
Hydroperoxides from Small-Scale Oil Samples, J. Am. Oil Chem. Soc. 78:1267-1269
(2001).
23. Yildiz, G. R., Wehling, and S. Cuppett, Comparison of Four Analytical Methods for the
Determination of Peroxide Value in Oxidized Soybean Oils, J. Am. Oil Chem. Soc.
80:103-107 (2003).
24. Rukunudin, I.H., P.J. White, C.J. Bern, and T.B. Bailey, A Modified Method for
Determining Free Fatty Acids from Small Soybean Oil Sample Sizes, J. Am. Oil Chem.
Soc. 75:563-568 (1998).
21
25. Meat and Poultry Inspection Manual, Food Safety and Inspection Service, U.S.
Department of Agriculture, Washington D.C., 1990, section 18.90, p 125.
26. White, P.J., Methods for Measuring Changes in Deep-Fat Frying Oils, Food Tech. 45:15-
80(1991).
27. Firestone, D., Regulatory Requirements for the Frying Industry, in Frying Technology
and Practices, edited by M.K. Gupta, K. Warner, and P.J. White, AOCS Press,
Champaign, IL, 2004, pp 200-216.
28. White, P.J and Y. Wang, A High Performance Size-Exclusion Chromatographic Method
for Evaluating Heated Oils, J. Am. Oil Chem. Soc. 63:914-920 (1986).
29. Marquez-Ruiz, G., and C. Dobarganes, Analysis of Nonvolatile Lipid Oxidation
Compounds by High-Performance Size-Exclusion Chromatography, in Analysis of Lipid
Oxidation, edited by Kamal-Eldin, A. and J. Pokorny, AOCS Press, Champaign, IL,
2005, pp 40-69.
30. Croon, L.B., A. Rogstad, T. Leth, and T. Kiutamo, A Comparative Study of Analytical
Methods for Quality Evaluation of Frying Fat, Fette Seifen Anstrichmittel 88:87-91
(1986).
31. Foo, S.Y., S. Cuppett, and V. Schlegel, Evaluation of SafTest™ Methods for Monitoring
Frying Oil Quality, J. Am. Oil Chem. Soc. 83:15-20 (2006).
32. Sakurai, H., and J. Pokorny, The Development and Application of Novel Vegetable Oils
Tailor-Made for Specific Human Dietary Needs, Eur. J. Lipid Sci. Technol. 105:169-118
(2003).
33. Liu, H., and P.J. White, High-Temperature Stability of Soybean Oils with Altered Fatty
Acid Composition, J. Am. Oil Chem. Soc. 69:533-531 (1992).
34. Dobarganes, M.C., G. Marquez-Ruiz, and M.C. Perez-Camino, Thermal Stability and
Frying Performance of Genetically Modified Sunflower Seed (Helianthus annus L.) Oils,
J. Agric. Food Chem. 47:678-681 (1993).
35. Mounts, T.L., K. Warner, G.R. List, R. Kleiman, W.R. Fehr, E.G. Hammond, and J.R.
Wilcox, Effect of Altered Fatty Acid Composition on Soybean Oil Stability, J. Am. Oil
CAcm. Soc. 65:624-628 (1988).
36. Warner, K., and T.L. Mounts, Frying Stability of Soybean and Canola Oils with Modified
Fatty Acids Compositions, J. Am. Oil Chem. Soc. 70:983-988 (1993).
37. Warner, K., and M. Gupta, Frying Quality and Stability of Low- and Ultra-Low-
Linolenic Acid Soybean Oils, J. Am. Oil Chem. Soc. 80:275-280 (2003).
38. Mounts, T.L., K. Warner, G.R. List, W.E. Neff, and R.F. Wilson, Low-Linolenic Acid
Soybean Oils—Alternatives to Frying Oils, J. Am. Oil Chem. Soc. 71:495-499 (1994).
39. Tompkins, C., and E.G. Perkins, Frying Performance of Low-Linolenic Acid Soybean
Oil, J. Am. OfZ CAem. Soc. 77:223-229 (2000).
40. Miller, L.A., and P.J. White, High-Temperature Stabilities of Low-Linolenate, High-
Stearate and Common Soybean Oils, J. Am. Oil Chem. Soc. (55:1324-1327 (1988).
41. Shen, N., W. Fehr, L. Johnson, and P. White, Oxidative Stabilities of Soybean Oils with
Elevated Palmitate and Reduced Linolenate Contents, J. Am. Oil Chem. Soc. 74:299-302
(1997).
42. Su, C., and P. White, Frying Stability of High-Oleate and Regular Soybean Oil Blends, J.
Am. OfZ CAem. Soc. 87:783-788 (2004).
43. Su, C., and P. White, Frying Flavor Stability and Quality of High-Oleate and Regular
Soybean Oil Blends During Frying, J. Am. Oil Chem. Soc. 81:853-859 (2004).
23
44. Normand, L., N.A.M. Eskin, and R. Przybylski, Comparison of the Frying Stability of
Regular and Low-Linolenic Acid Soybean Oils, J. Food Lipids 10:81-90 (2003).
45. Normand, L., N.A.M. Eskin, and R. Przybylski, Effect of Tocopherols on the Frying
Stability of Regular and Modified Canola Oils, J. Am. Oil Chem. Soc. 78:369-373 (2001).
46. Warner, K., and S. Knowlton, Frying Quality and Oxidative Stability of High-Oleic Corn
Oils, J. Am. OfZ CAcm. Soc. 74:1317-1322 (1997).
47. Shen, N., S. Duvick, P. White, and L. Pollak, Oxidative Stability and AromaScan
Analyses of Corn Oils with Altered Fatty Acid Content, J. Am. Oil Chem. Soc. 76:1425-
1429 (1999).
48. Normand, L., N.A.M. Eskin, and R. Przybylski, Comparison of the Frying Stability of
Regular and High-Oleic Acid Sunflower Oils, J. Am. Oil Chem. Soc. 83:331-334 (2006).
49. Wang, T., and L.A. Johnson, Survey of Soybean Oil and Meal Qualities Produced by
Different Processes, J. Am. Oil Chem. Soc. 78:311-318 (2001).
50. Wang, T., and L.A. Johnson, Refining Normal and Genetically Enhanced Soybean Oils
Obtained by Various Extraction Methods, J. Am. Oil Chem. Soc. 78:809-815 (2001).
51. Wang, T., and L.A. Johnson, Natural Refining of Extrude-Expelled Soybean Oils Having
Various Fatty Acid Compositions, J. Am. Oil Chem. Soc. 78:461-466 (2001).
52. Bargale, P.C., R.J. Ford, F.W. Sosulski, D. Wulfsohn, and J. Irudayaraj, Mechanical Oil
Expression from Extruded Soybean Samples, J. Am. Oil Chem. Soc. 76:223-229 (1999).
53. Nelson, A.I., W.B. Wijeratne, S.W. Yeh, T.M. Wei, and L.S. Wei, Dry Extrusion as an
Aid to Mechanical Expelling of Oil from Soybeans, J. Am. Oil Chem. Soc. (54:1341-1347
(1987).
54. Tandy, D.C., and W.J. McPherson, Physical Refining of Oils, J. Am. Oil Chem. Soc.
24
<%: 1253-1258 (1984).
55. Cmolik, J., W. Schwarz, Z. Svodoba, J. Pokorny, Z. Reblova, M. Dolezal, and H.
Valentova, Effects of Plant-Scale Alkali Refining and Physical Refining on the Quality of
Rapeseed Oil, Eur. J. Lipid Sci. Technol. 102:15-22 (2000).
56. Jawad, I.M., S.P. Kochhar, and B.J.F. Hudson, Quality Characteristics of Physically
Refined Soyabean Oil: Effects pf Pre-Treatment and Processing Time and Temperature,
J. Food Technol. 18:353-360 (1983).
57. De Greyt, W., and M. Kellens, Deodorization, in Bailey's Industrial Oil and Fat
Products, 6th Edn., edited by F. Shahidi, John Wiley and Sons, Inc., Hoboken, 2005, pp
341-383.
58. Cmolik, J., and J. Pokorny, Physical refining of Edible Oils, Eur. J. Lipid Sci. Technol.
702:472-486 (2000).
59. Haumann, B.F., Mechanical Extraction-Capitalizing on Solvent-Free Processing, Inform
8:165-174(1997).
60. Leon-Camacho, M., M.V. Ruiz-Mendez, M. Graciani-Constante, and E. Graciani-
Constante, Kinetics of the Cis-Trans Isomerization of Linoleic acid in the Deodorization
and/or Physical Refining of Edible Fats, Eur. J. Lipid Sci. Technol. 103:85-92 (2001).
61. De Greyt, W.F., M.J. Kellens, and A.D. Huyghebaert, Effect of Physical Refining on
Selected Minor Components in Vegetable Oils, Fett/Lipid 101:428-432 (1999).
62. Jawad, I.M., S.P. Kochhar, and B.J.F. Hudson, The Physical Refining of Edible Oils 1.
Effect Component Fatty Acids and on Triglycerides, Lebensm. -Wiss. u. -Tech. 16:289-
293 (1983).
63. Jawad, I.M., S.P. Kochhar, and B.J.F. Hudson, The Physical Refining of Edible Oils 2.
25
Effect on Unsaponifiable Components, Lebensm. -Wiss. u. -Tech. 17:155-159 (1984).
64. Warner, K., and C. Dunlap, Effects of Expeller-Pressed/Physically Refined Soybean Oil
on Frying Oil Stability and Flavor of French-Fried Potatoes, J. Am. Oil Chem. Soc.
83:435-441 (2006).
65. Coscione, A.R., P.C. Osidacz, S. Kiatsrichart, and W.E. Artz, The Pan-Heating Stability
of and Expeller Expressed Soybean Oil, J. Food Lipids 11:51-64 (2004).
66. Miller C.E. Chemical Principles of Near-Infrared Spectroscopy, in Near-Infrared
Technology in the Agricultural and Food Industries, edited by P. Williams and K. Norris,
2nd edition, American Association of Cereal Chemists, Inc., St. Paul, 2001, pp 19-37.
67. Siesler, H.W., Near Infrared Reflectance Spectroscopy (NIRS): A Method of Rational
Multicomponent Analysis, Mikrochimica Acta 7:117-120 (1988).
68. Flinn, P.C., R.G. Black, L. Iyer, J.B. Brouwer, and C. Meares, Estimating the Food
Processing Characteristics of Pulses by Near Infrared Spectroscopy, Using Ground or
Whole Samples, J. Near Infrared Spectrosc. 6:213-220 (1998).
69. Sinnaeve, G., P. Dardenne, R. Agnes sens, M. Lateur, and A. Hallet, Quantitative
Analysis of Raw Apple Juices Using Near Infrared, Fourier-Transform Near Infrared and
Fourier-Transform Infrared Instruments: A Comparison of Their Analytical
Performances, J. Near Infrared Spectrosc. 5:1-17 (1997).
70. Kovalenko, I.V., G.R. Rippke, and C.R. Hurburgh, Measurement of Soybean Fatty Acids
by Near-Infrared Spectroscopy: Linear and Nonlinear Calibration Methods, J. Am. Oil
CAcm. Soc. 83:421-427 (2006).
71. Che Man, Y.B. and M.H. Moh, Determination of Free Fatty Acids in Palm Oil by Near-
Infrared Reflectance Spectroscopy, J. Am. Oil Chem. Soc. 75:557-562 (1998).

26
72. Yildiz, G., R.L. Wehling, and S.L. Cuppett, Method for Determining Oxidation of
Vegetable Oils by Near-Infrared Spectroscopy, J. Am. Oil Chem. Soc. 78:495-502 (2001).
73. Buning-Pfaue, H., and S. Kehraus, Application of near infrared spectroscopy (NIRS) in
the analysis of frying fats, Eur. J. Lipid Sci. Technol. 103:193-191 (2001).
74. Ng, C.L., R.L. Wehling, and S.L. Cuppett, Determining Frying Oil Degradation by Near
Infrared Spectroscopy, AACC/TIA Program Book, AACC/TIA Joint Meeting September
19-22, 2004 San Diego, CA, 120 (2004).
27
Frying Performance of No-Trans, Low-Linolenic Acid Soybean Oils
A paper to be submitted to the Journal of the American Oil Chemists' Society
Jose Gerde1, Connie Hardy2, Walter Fehr3 and Pamela White1*
^Department of Food Science and Human Nutrition, Iowa State University, Ames, Iowa
50011
2Value Added Agriculture Program, Iowa State University, Ames, Iowa 50011
^Department of Agronomy, Iowa State University, Ames, Iowa 50011
Running Title: FRYING PERFORMANCE OF LOW-LINOLENIC ACID SOYBEAN OILS
*To whom correspondence should be addressed at 2312 Food Sciences Building, Iowa State
University, Ames, IA 50011-1060. Phone: 515-294-9688, Fax: 515-294-8181, Email:
pj white @ iastate.edu
ABSTRACT: Two extruded-expelled soybean oils with reduced contents of linolenic
acid, ultra-low linolenic acid (ULL, 1.5%) and low-linolenic acid (LL, 2.6%), and a
extruded-expelled control oil (control, 5.3% linolenic acid) were evaluated by frying French
fries in a commercial-like setting for 6 h/day during 23 days. The oils became darker,
increased in yellow color at the beginning, and became redder and less green throughout the
process. Free fatty acids levels were not different among the oils until day 14, after which
ULL was different from the control for the remainder of frying. The conjugated dienoic acid
values were greatest in the control. Generally, ULL and LL oils had lower percentages of
28
polar compounds than did the control, providing a frying life 2 d longer than the control and
a -30% increase in frying time. A trained sensory panel evaluated the French fries on days 2,
5, and 6. Buttery and potato flavors decreased, and rancid and painty flavors increased over
frying time for all products. Rancid flavor was highest in the fries from the control oil.
Overall, the ULL and LL oils performed better than did the control oil and ULL tended to
perform better than the LL.
KEY WORDS: French fries, frying, oil stability, sensory evaluation, soybean oil, ultra-low
linolenic acid, extruded-expelled oil, physical refining.
Frying is one of the most common practices used to cook food in both home and industrial
operations. The essence of the fast-food industry is the frying process that provides tasty,
ready-to-eat food in a relatively short period of time. In addition to saving time, frying
reduces the amount of waste because it allows cooking of small batches of food to order. The
stability of the oil is a crucial factor when choosing a frying media because of the highly
aggressive process involving high temperature in the presence of oxygen, water, and the
formation of pro-oxidants. Partially hydrogenated oils have been commonly used as the
frying media because of their stabilities. In 2003, the Food and Drug Administration passed a
ruling requiring labels of all food products containing 0.5 g or more of trans fat per serving
to list the trans content on the nutrient label by January 1, 2006 (1). Other countries, such as
Denmark (2) and Canada (3), have passed legislation that regulates trans fat content labeling
in food products. Companies are increasingly marketing products that do not contain trans
fats (4). Trans fatty acid consumption has been linked to health, including increased serum
29
levels of low-density lipoprotein cholesterol and decreased high-density lipoprotein
cholesterol (5). Because of these health issues and the accompanying trans fats labeling
requirements, the food industry has been trying to find alternatives to partially hydrogenated
oils.
Typical soybean oil with about 7 to 8% linolenic acid (18:3) is known to be
oxidatively unstable, especially during frying (6, 7). Recent studies showed that soybean oil
with only 1.5 to 3.5% of the very unstable 18:3 had better flavor scores and increased
stability during frying than commodity and even partially hydrogenated soybean oils (8-10).
Frying stability of soybean and other oils also is impacted by the extraction method. Indeed,
Warner and Dunlap (11) reported that French fries fried in screw-pressed typical soybean oil
had better sensory characteristics than fries fried in hexane-extracted soybean oil with TBHQ
added, and also better than fries fried in partially hydrogenated soybean oil. Screw pressing is
thought to create Maillard browning reaction products that contribute natural antioxidants to
the pressed oils (11).
The combination of low 18:3 composition along with extrusion-expelling has not
been tested for performance during frying. In this study, the extended frying performance of
three extruded-expelled soybean oils was evaluated: two oils from soybean varieties with
reduced amounts of 18:3 and one oil from commodity soybeans with a typical amount of
18:3. A main goal of the study was to determine whether substantial differences occurred
among these three oil types to help buyers decide the value of selecting one of the low 18:3
acid oils over typical commodity oil.

30
MATERIALS AND METHODS
Soybean oils: Extruded-expelled soybean (Glycine max) oils with three different fatty acid
compositions were obtained from American Natural Soy, Inc., Cherokee, IA. An ultra low-
linolenic acid oil (ULL), having 1.5% 18:3 after processing, was obtained from soybean
cultivar IA2064 produced by Taylor Seeds, Inc. near Hartley, IA in 2003. Low-linolenic acid
oil (LL), having 2.6% 18:3 after processing, was obtained from the soybean cultivar IA3018
produced by Pleasant Valley Farms near Iowa City, IA in 2004. Oil with 5.3% 18:3 (control)
after processing came from a mixture of conventional soybean cultivars produced by
American Natural Soy in 2004. Both ULL and LL oils originated from Iowa State University
(ISU) soybean varieties developed through traditional breeding practices to reduce the 18:3
content of the oil.
Frying of French fries: The frying process was performed simultaneously for two
replicates of the three oils in a total of six twin frying wells of Star Twin Pot deep-fat fryers,
model 530TA (Star Manufacturing International Inc. St. Louis, MO, 7.2 liter per well). Three
0.225-kg batches of commercial extra-long (XL) fancy 0.635-cm (VA inch) shoestring par-
fried frozen French fries obtained commercially were fried per h, for 6 h per day for 23 days.
The fries were provided by a single supplier from a single lot and were par-fried using
partially hydrogenated vegetable shortening (canola and/or soybean oil) and/or palm oil
and/or beef fat. The fatty acid composition of the fat extracted from the par-fried fries was
19.4% 16:0 (palmitic acid), 16.3% 18:0 (stearic acid), 61.9% 18:1 (all isomers), and 2.4%
18:2 (all isomers). The available column did not allow geometric isomer separation. A 100-m
column is needed to obtain a complete profile of fatty acids. The manufacturer also claimed
31
the addition of dihydrogen pyrophosphate (to promote color retention), dextrose and natural
flavoring. The initial frying temperature was 190°C and each batch was fried for 165 s. The
oil temperature was recorded at 30-s intervals and the temperature monitored to ensure
consistent frying temperatures for all batches. At the end of each frying day, the oils were
filtered through fast flute shortening filters (DF1600FF Disco, McDonough, GA) to remove
food particles. Aliquots of the oils were removed for further evaluation and stored at -22°C in
glass jars under nitrogen in the dark to prevent further oxidation. The bulk of the oils was left
overnight in the fryers at room temperature loosely covered with aluminum foil. The
following day, oil was added to bring the level back to normal before heating.
Fry chef evaluations: Fry chefs (9 chefs x 2 frying replicates = 18 total observations)
from the ISU dining service served as an expert panel to evaluate each replicate of the frying
oils during the operation. They were familiarized with the frying set-up and trained to use the
scoring sheet provided for them. They visited the frying operation on days 2, 5, 9, 11, 14, 16,
19, 21, and 23 and at each visit were asked to independently judge the unidentified oils for
their need to be changed, based on their expert judgment as to when they would typically
change the oil during normal use. Frying continued until all the chefs agreed that the oils
(both replicates) needed to be changed (day 23).
Fatty Acid Methyl Ester (FAME) composition: The FAME composition of each oil
was determined by gas-liquid chromatography and was reported in relative area percentage.
The FAME were obtained by using the method described by Hammond (12) and analyzed
with an HP 5890 GC chromatograph. The chromatography conditions were similar to those
described by Onal-Ulusoy et al. (13). Based on FAME composition, oxidizability was
calculated (14). The oils were analyzed fresh and periodically throughout the frying

32
operation.
Free Fatty Acids (FFA): The FFA concentration expressed as oleic acid was
determined by titration following AOCS Official Method Ca 5a-40 (15) as modified by
Rukunudin et al. (16).
Conjugated Dienoic acid (CDA): The CDA content expressed as percentage was
spectrophotometrically determined according to AOCS Official Method Ti la-64 (15).
Total Polar Compounds (TPC): TPC were determined according to AOCS Official
Method Cd 20-91 (15).
Peroxide value (PV): PV of each oil was determined before frying according to
AOCS Official Method Cd 8-53 (15).
Oil Stability Index (OSI): The oil resistance to oxidation, called OSI, was evaluated
according to AOCS Official Method Cd 12b-92 (15) using an Oxidative Stability Instrument
(Omnion Inc., Rockland, MA). OSI was run at 100°C.
Tocopherol content: The a-, y-, and 5-tocopherol contents of the fresh oils were
determined by HPLC following the AOCS Official Method Ce 8-89 (11).
Color: Oil color was analyzed by using a Hunter Lab LabScan XE colorimeter
(Hunter Lab, Reston, VA). The illuminant used was D65 and the standard observer was set at
10°. The oil aliquots were placed in 60 x 15 mm Petri dishes with the edge previously
covered with two layers of white, 1.27-cm width tape (Fisherbrand, Fisher Sc. 11-880A) to
avoid light dispersion caused by sample translucence. The Petri dish was placed on a
standard white tile for oil color measurement. The color results were expressed in Hunter Lab
units.
Sensory evaluation: Sensory evaluations were performed on French fries fried in the

33
oils on days 2, 5 and 6 to correspond with the typical timing of fast food operations, in which
frying oil is typically changed on a weekly basis. Rancid, painty, potato, and buttery flavors
were assessed by a sensory panel of 12 individuals, previously trained during three separate
sessions to recognize and quantify these attributes. The attributes were rated on a 15-cm line,
with the perceived flavor increasing in intensity from 0 to 15. French fries were randomly
coded and served to all panelists on a monadic sequential order (randomized among
sessions).
Statistical analysis: All data were analyzed by using analysis of variance (ANOVA)
with the SAS mixed models procedure (17). For tests performed over time, repeated
measures were used. Multiple comparisons between means were assessed by F-protected
contrasts. The level of significance was set at a=0.05.
RESULTS AND DISCUSSION
The 18:3 concentration in the fresh oils was different for all the treatments (Table 2.), but for
the ULL was greater and for the control was less than expected. The 18:3 of ULL was
measured at 1.0% in the 2003 seed, whereas for LL was measured at 2.5% (Unpublished
data). Also, the control blend, at 5.3%, was lower than is typical for commodity soybean oil
(7). During processing, there likely was some carryover of previously processed commodity
oil into the ULL oil, then of ULL and/or LL oil into the control oil, thus slightly altering the
anticipated 18:3 concentrations of the processed oils. It is possible there also was an
environmental impact on the oil compositions during growing. The reduction of 18:3 in LL
and ULL, compared to the control, was accompanied by increased linoleic (18:2) and oleic
(18:1) acid levels, but the 18:2 acid concentrations were not different between ULL and LL.

34
Also the amount of stearic acid (18:0) was greater in the ULL than in the control and LL.
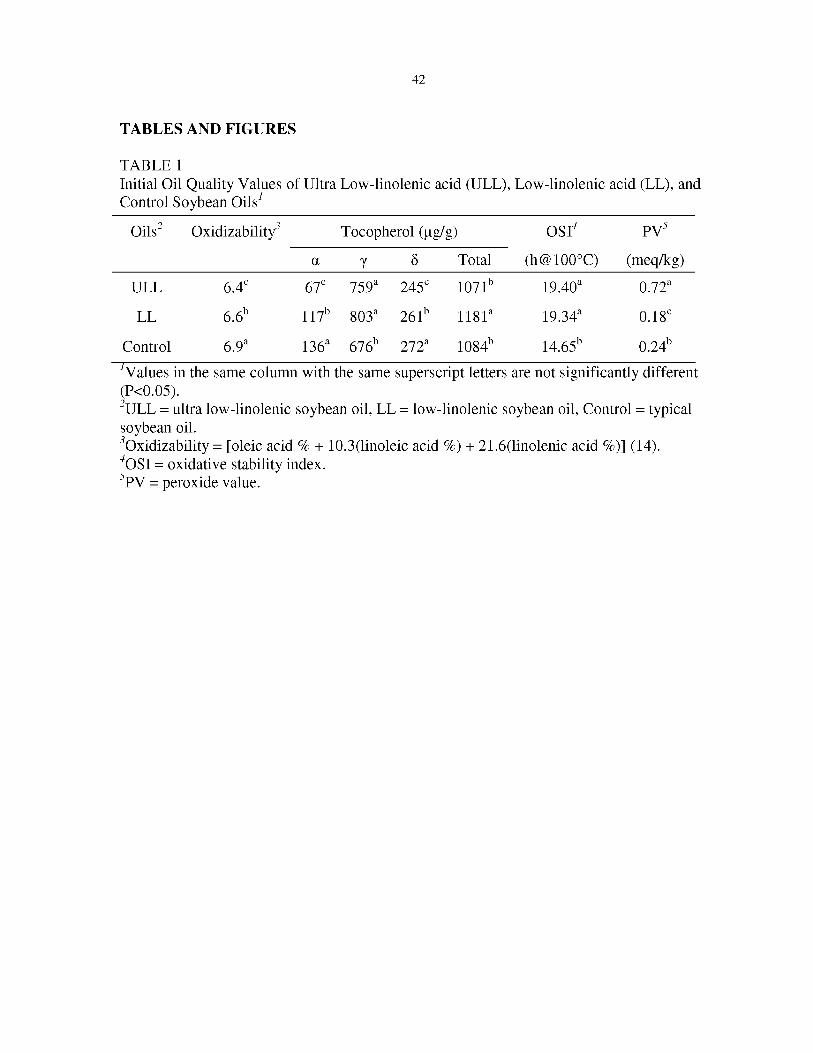
These changes were reflected in the calculated oxidizability (Table 1.). ULL had the lowest
value (highest theoretical stability), LL had an intermediate value, and the control had the
highest value.
Throughout the frying study the percentages of the unstable 18:3 and 18:2 decreased
at the beginning and the percentages of the more stable 18:1, 18:0 and palmitic (16:0) acids
increased. This same tendency was reported by Onal-Ulusoy (13) for soybean oil heated at
frying temperatures. After approximately day 9, however, the changes in the percentages of
each fatty acid reached a plateau, probably because of an equilibrium between the
degradation and the turnover rates of the oils (Table 1).
The a-, y-, and 5-tocopherol concentrations of the fresh oils were different for each of
the oils, and the total tocopherol concentration was greater for LL than for both ULL and the
control which were not different from each other (Table 2.). Warner suggested that although
fatty acid composition is crucial in determining oxidative stability in oils, tocopherol content
also plays an important role in oil stability (18). The greater tocopherol content may have
given LL a slight stability advantage over ULL and the control. Previously, the tocopherol
content affected the TPM content in oils and triglyceride mixtures heated at frying
temperatures (19, 20).
The PVs of the three fresh oil treatments were all less than 1 meq/kg, indicating that
all oils were unoxidized and of high quality, although statistical differences occurred among
the oil types (Table 1). The OSI of the fresh oils was greater (more stable) for ULL and LL
than for the control, which was likely a direct result of the lower level of 18:3 in ULL and LL
(Table 1). These values were consistent with the calculated oxidizability, which showed that

35
the lower the 18:3 the greater the theoretical stability. OSI predicts the oxidative stability of
the oils under the severe conditions employed by this method, but does not necessarily
indicate stability during deep-fat frying of food, because of the differences in the systems
(Unpublished data).
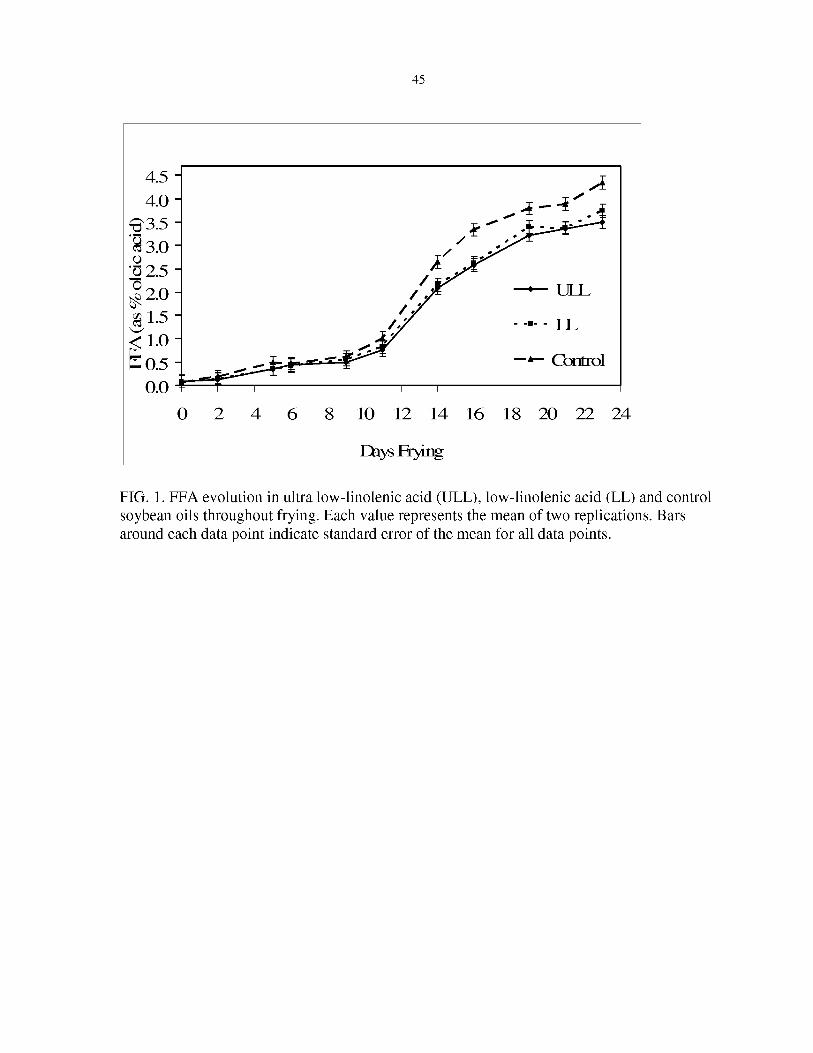
Figure 1 shows the FFA evolution over frying time for each of the oil treatments.
There was no evidence of differences in FFA among the oils until 14 days of frying. At that
point, and generally during the rest of the frying period, the control had a greater FFA level
than did LL and ULL. The control generally had a higher FFA level throughout frying. Oils
with high FFA are known to have a lower smoke point (21, 22) and the surfactant effect of
FFA contributes to the foaming which leads to further oxidation of the oil (23).
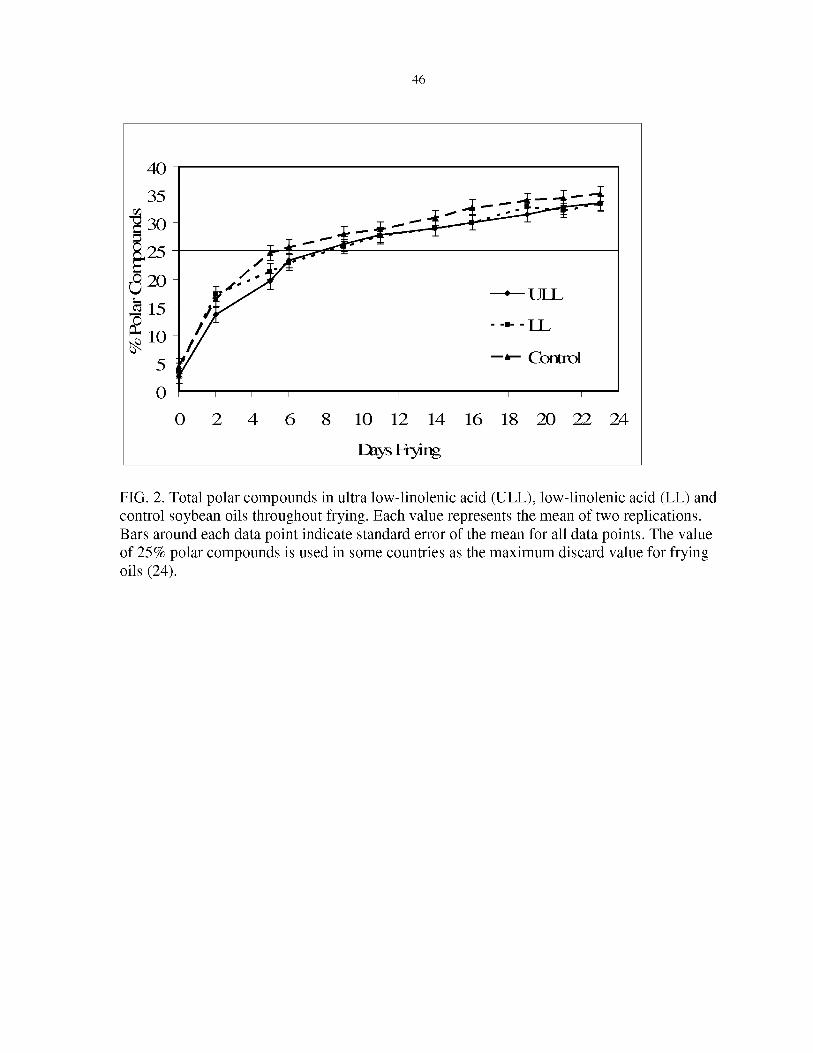
The concentrations of polar compounds were not significantly different among the
oils throughout frying. However, the control tended to have the greatest values, probably a
result of its higher level of 18:3 and overall greater oxidizability (Fig. 2). In many countries
25% polar compounds is considered as the discarding point for frying oils (24). With that
criterion and by interpolating the polar compound levels presented in figure 2, both ULL and
LL had a frying life 2 d longer than control (-30% increase in frying time).
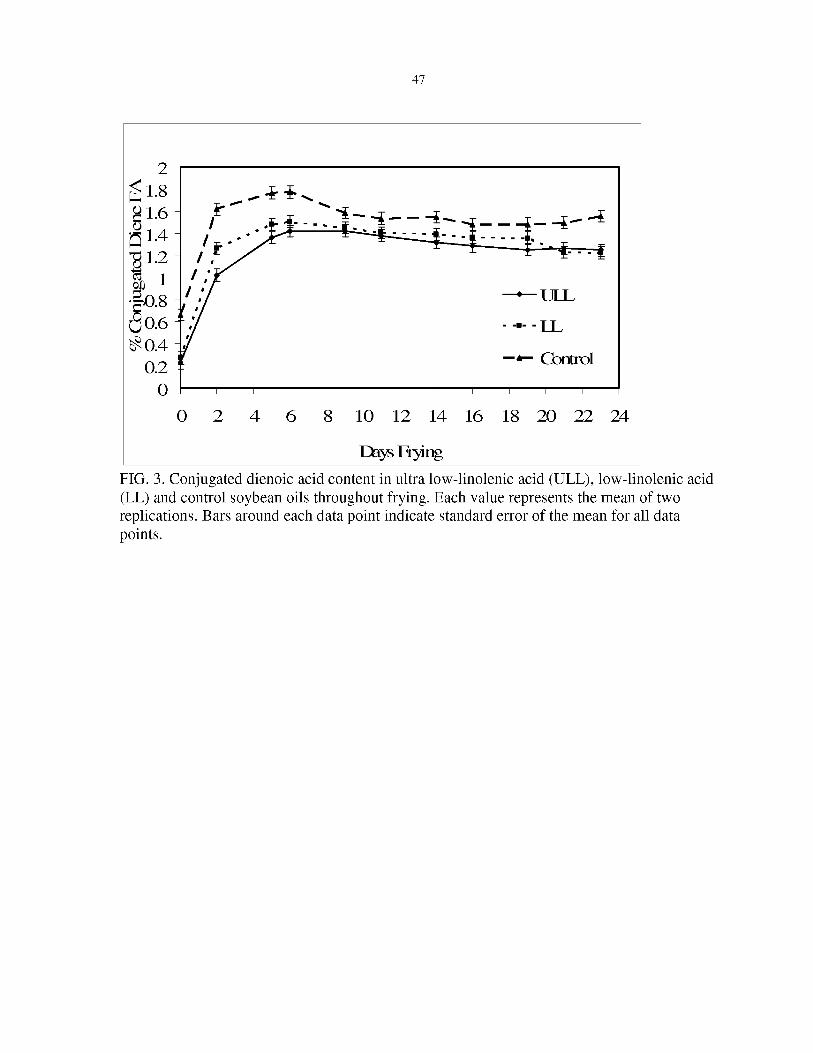
Throughout frying, the control had greater levels of CDA (Fig. 3), which was directly
related to its higher 18:3 content. ULL and LL were not different from each other. Even
though the LL had greater 18:3 content, its higher tocopherol content may have helped
reduce the CDA formation. The greatest changes in CDA content occurred at the beginning
of the frying period, and after day 5 the evolution in the CDA content was much slower. A
previous study showed the same trend in CDA development during the initial stages of frying
(25). All the oils had reached their maximum levels of CDA by day 6. At that point, the CDA
36
of the control and LL started to decrease in value but ULL remained at the maximum level
until day 9. The further decrease might be explained by the degradation of the CDA to form
other secondary breakdown products, such as the FFA, which began to form more quickly at
about day 9 for all treatments.
There was no clear tendency with respect to Hunter a value changes among the oils.
The control was more red (higher a) than were ULL and LL on days 5 and 6. ULL was still
less red than the control on day 9. On day 16, LL was redder than ULL, the only point at
which ULL and LL were significantly different from each other. After 21 days and until the
end of frying, LL became redder than the control as did ULL on day 23. In the fresh oils, the
Hunter b value was greatest in the control (most yellow), followed by ULL and then LL
(fresh oils). On days 14, 19, and 23, LL and ULL were more yellow than the control. Hunter
L values decreased (oils became darker) throughout frying. On day 9 the rate of darkening
decreased and, starting on day 14 and until the end, ULL was significantly lighter (higher
Hunter L value) than the control. The darkening of the oils during frying has been previously
associated with the formation of polymers (22). It is also probable that Maillard browning
products formed in the fries leached into the oil also contributing to its darkening.
Overall, Hunter a values for all oils tended to increase (became more red) during
frying, with a subsequent decrease during the last 4 days. In general, Hunter b values
increased during the first 2 days of frying and then decreased (became less yellow). The
initial rapid increase in darkness, redness and yellowness in the first phase of the process was
likely related to the accumulation of the Maillard browning reaction products from the fries.
Color formation then gradually changed as the oil degradation products formed. These
findings agree with the study of Su and White in which bread cubes were fried in various
37
soybean oils (26). In the current study, CDA and color evolved at faster paces during the first
phase of the process; after day 9 the changes in these two parameters were less pronounced.
At this point, the changes in FFA accelerated. Generally, CDA and color changes were
reflective of the early changes in the oil during frying, whereas changes in FFA were more
pronounced later in frying.
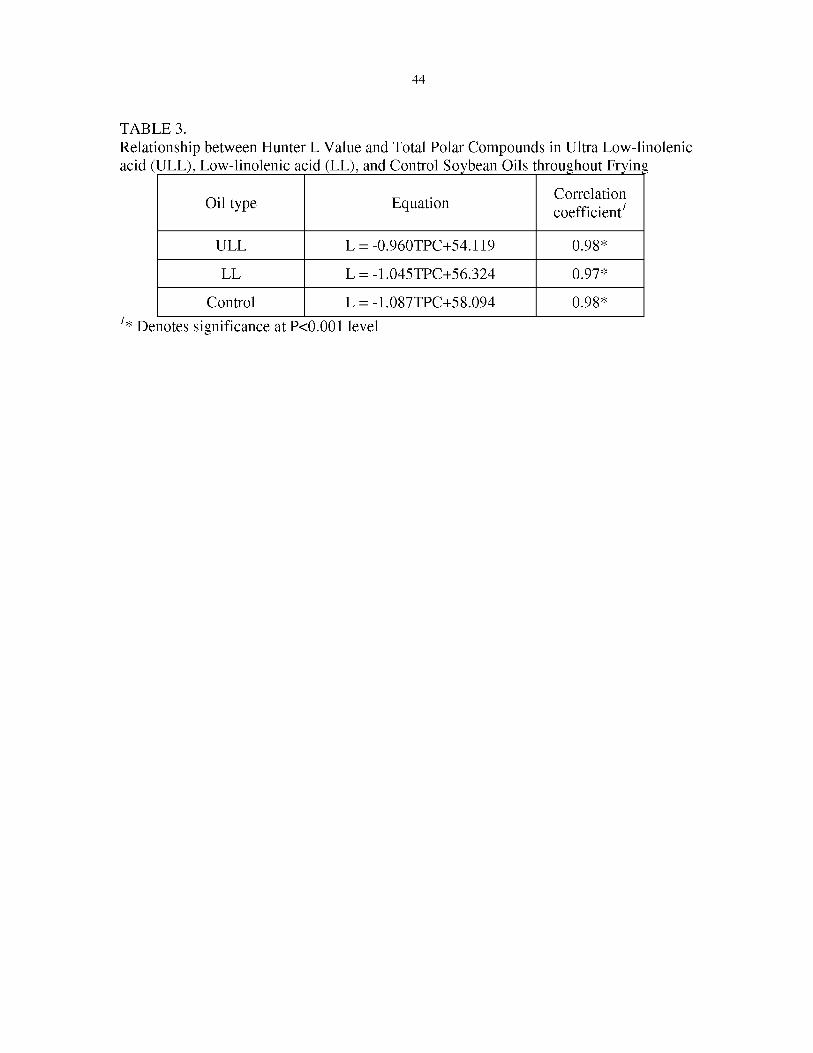
There were strong linear correlations among all the treatments between total polar
compounds content and Hunter L value (Table 3).This decrease in the lightness of the oils
with the increase of the total polar compounds content in the measured range agrees with the
results obtained by Paul and Mittal (27), who noted a third-degree correlation between total
polar material and lightness in canola oil shortening during frying.
Figure 5 shows the mean cumulative number of fry chef observations that stated at
least one replicate of the frying oils ready for changing by the day noted. By day 9, eight out
of eighteen possible observations stated that the control needed to be changed, whereas only
one established ULL and two established LL needing replacement. After day 9, the control
continued to be recommended for changing at a greater rate than the other two oils. Thus, a
longer fry life, and potential monetary savings could arise from use of the ULL or LL.
Finally, there were no differences in buttery, potato, and painty flavors among the
different oils (Fig. 6). All values, except for potato, were relatively low in intensity
throughout testing, indicating there were few rancid and painty off flavors and a low amount
of buttery flavor, with potato flavor predominating. There was a tendency, however, for both
ULL and LL to score lower (better) than the control with respect to painty flavor. For rancid
flavor, ULL and LL were not different from each other, but both were lower (better) than the
control.

38
In general, both ULL and LL oils performed better than the control. ULL tended to be
more stable than LL. Both LL and ULL may be good alternatives to partially hydrogenated
oils in frying operations.
ACKNOWLEDGMENTS
We thank the Michigan Soybean Promotion Committee and the Center for Crops Utilization
Research (CCUR) at Iowa State University for funding, CCUR for facility use, Drs. Lester
Wilson and Tong Wang for use of their laboratory equipment, the Center for Designing
Foods to Improve Nutrition for assistance with sensory evaluations, and Dr. Philip Dixon for
help with the statistical design and analyses.
REFERENCES
1. Food and Drug Administration, 21 CFR Part 101 Food Labeling; Trans Fatty Acids in
Nutrition Labeling; Consumer Research to Consider Nutrient Content and Health Claims
and Possible Footnote or Disclosure Statements; Final Rule and Proposed Rule, Federal
Register Vol. 68 733:41433-41506 (2003), http://a257.g.akamaitech.net/7/257/2422/14m
ar20010800/edocket.access.gpo.gov/2003/pdf/03-17525.pdf (Accessed June 2006).
2. Oresund Food Excellence, Denmark Ahead in Regulation of trans Fatty Acids in Foods,
http://www.foodoresund.com/composite-277.htm (Accessed October 2006).
3. Canadian Food Inspection Agency, 2003 Guide to Food Labeling and Advertising,
http://www.inspection.gc.ca/english/fssa/labeti/guide/toce.shtml (Accessed October
2006).
4. Marks & Spencer, Fats, http://www2.marksandspencer.com/thecompany/trustyour_man
ds/fats.shtml (Accessed October 2006).
5. Mensink, R.P and M.B. Katan, Effects of Dietary Trans Fatty Acids on High-Density and
Low-Density Lipoprotein Cholesterol levels in Healthy Subjects, N. Engl. J. Med.,
323:439-445 (1990).
6. Frankel E.N., K. Warner, and K.J. Moulton, Effects of Hydrogénation and Additives on
Cooking Oil Performance of Soybean Oil, J. Am. Oil Chem. Soc. 62:1354-1358 (1985).
7. Warner, K. and M. Gupta, Frying Quality and Stability of Low- and Ultra-Low-Linolenic
Acid soybean Oils, Ibid. 80:275-280 (2003).
8. Mounts, T.L., K. Warner, G.R. List, W.E. Neff, and R.F. Wilson, Low-Linolenic Acid
Soybean Oils—Alternatives to Frying Oils, Ibid. 71: 495-499 (1994).
9. Miller, L.A., and P.J. White, High-Temperature Stabilities of Low-Linolenate, High-
Stearate and Common Soybean Oils, Ibid. (55:1324-1327 (1988).
10. Liu, H., and P.J. White, High-Temperature Stability of Soybean Oils with Altered Fatty
Acid Composition, Ibid. 69:533-537 (1992).
11. Warner, K., and C. Dunlap, Effects of Expeller-Pressed/Physically Refined Soybean Oil
on Frying Oil Stability and Flavor of French-Fried Potatoes, Ibid. 83:435-441 (2006).
12. Hammond, E.G., Organization of Rapid Analysis of Lipids in Many Individual Plants, in
Modern Methods of Plant Analysis, New Series, Volume 12. Essential Oils and Waxes,
edited by H.F. Linskens and J.F. Jackson, Springer-Verlag, New York, 1991, pp. 321-
330.
13. Onal-Ulusoy, B., E. Hammond, and P. White, Linalyl Oleate as a Frying Oil
Autoxidation Inhibitor, J. Am. Oil Chem. Soc. 82:433-438 (2005).
14. Fatemi, S.H. and E.G. Hammond, Analysis of Oleate, Linoleate and Linolenate
Hydroperoxides in Oxidized Ester Mixtures, Lipids 15:379-385 (1980).
15. Official Methods and Recommended Practices of the American Oil Chemists' Society,
edited by D. Firestone, 4th edn., American Oil Chemists' Society, Champaign, IL, 1989.
16. Rukunudin, I.H., P.J. White, C.J. Bern, and T.B. Bailey, A Modified Method for
Determining Free Fatty Acids from Small Soybean Oil Sample Sizes, J. Am. Oil Chem.
Soc. 75:563-568 (1998).
17. Littell, R.C, G.A. Milliken, W.W. Stroup, and R.D. Wolfinger, SAS System for Mixed
Models, SAS Institute Inc., Cary, NC, 1996, pp. 87-134.
18. Warner, K., Effects on the Flavor and Oxidative Stability of Stripped Soybean and
Sunflower Oils with Added Pure Tocopherols, J. Agric. Food Chem. 53:9906-9910
(2005).
19. Barrera-Arellano, D., V. Ruiz-Mendez, G. Marquez Ruiz, and C. Dobarganes, Loss of
Tocopherols and Formation of Degradation Compounds in Triacylgrlycerol Model
Systems Heated at High Temperature, J. Sci. Food Agric. 79:1923-1928 (1999).
20. Barrera-Arellano, D., V. Ruiz-Mendez, J. Velasco, G. Marquez Ruiz, and C. Dobarganes,
Loss of Tocopherols and Formation of Degradation Compounds in Triacylglycerol Model
Systems Heated at High Temperature, J. Sci. Food Agric. 82:1696-1702 (2002).
21. Hartman, L., A.J. Antunes, R. dos Santos Graruti, and M.A. Chaib, the Effect of Free
Fatty Acid on the Taste, Induction Periods and Smoke Points of Edible Oils and Fats,
Lebensm. -Wiss. u. -Technol. 8:114-118 (1975).
22. Augustin, M.A., T. Asap, and L.K. Heng, Relationships Between Measurements of Fat
Deterioration During Heating and Frying in RBD Olein, J. Am. Oil Chem. Soc. (54:1670-

41
1675 (1987).
23. Blumenthal, M.M., and R.F. S tier, Optimization of Deep-Fat Frying Operations, Trends
So. TgcAW. 2:144-148 (1991).
24. Firestone, D., Regulatory Requirements for the Frying Industry, in Frying Technology
and Practices, edited by M.K. Gupta, K. Warner, and P.J. White, AOCS Press,
Champaign, IL, 2004, pp 200-216.
25. Fritsch C.W., D.C. Egberg, and J.S. Magnuson, Changes in Dielectric Constant as a
Measure of Frying Oil Deterioration, J. Am. Oil Chem. Soc. 56:746-750 (1979).
26. Su, C., and P. White, Frying Stability of High-Oleate and Regular Soybean Oil Blends,
7W. 87:783-788 (2004).
27. Paul, S. and G.S. Mittal, Dynamics of Fat/Oil Degradation during Frying Based on
Optical Properties, J. Food Eng. 30:389-403 (1996).
42
TABLES AND FIGURES
TABLE 1 Initial Oil Quality Values of Ultra Low-linolenic acid (ULL), Low-linolenic acid (LL), and Control Soybean Oils7
Oils2 Oxidizability3 Tocopherol (jag/g) OSI4 PV5
a y Ô Total (h@100°C) (meq/kg)
ULL 6.4" 67" 759* 245" 107 lb 19.40* 0.72*
LL 6.6b 117b 803* 261" 1181* 19.34* 0.18"
Control 6.9* 136* 676" 272* 1084b 14.65b 0.24^ 1Values in the same column with the same superscript letters are not significantly different (P<0.05). 2ULL = ultra low-linolenic soybean oil, LL = low-linolenic soybean oil, Control = typical soybean oil. ^Oxidizability = [oleic acid % + 10.3(linoleic acid %) + 21.6(linolenic acid %)] (14). 4OSI = oxidative stability index. 5PV = peroxide value.

43
TABLE 2 FAME Composition (%) of Ultra Low-linolenic acid (ULL), Low-linolenic acid (LL), and Control Soybean Oils throughout Frying7,2
Oil 16:0 18:0 18:1 18:2 18:3 ULL 9.9" 6.0* 26.0" 56.6* 1.5"
Fresh LL 10.0b 4.5" 26.5* 56.4* 2.6" Control 10.9* 4.7" 25.5" 53.7" 5.3* ULL 10.8" 6.9* 28.8" 52.3* 1.2"
2 days LL 10.9" 5.5" 29.6* 51.9* 2.2" Control 12.1* Lfi
oo
cr
28.5" 49.0" 4.7* ULL 11.5" 7.9* 31.0" 48.6* 1.0"
5 days LL 11.6" 6.3" 31.5* 48.7* 1.9b
Control 12.7* 6.7" 30.7" 46. lb 3.9* ULL 12.2"
\o OO
32.9* 45.5* 0.9" 9 days LL 12.1" 7.Ie 33.2* 45.9* 1.8"
Control 13.0* 7.3" 32.2" 43.8" 3.7* ULL 12.2" 8.9* 33.6" 44.4* 0.9"
14 days LL 12.1" 7.5" 34.1* 44.6* 1.7b
Control 13.1* 7.7b 33.2" 42.5" 3.6* ULL 12.2" 9.1* 33.6" 43.9* 0.9"
19 days LL 12.3" 7.8" 34.1* 43.4* 1.7b
Control 13.2* 8.1" 33.2" 41.9b 3.5* ULL 12.2" 9.1* 34.3* 43.5* 0.9"
23 days LL 12.2" 7.6" 34.3* 44.2* 1.7b
Control 13.4* OO
Nr
34.4* 40.6" 3.4* 7Values in the same column within the same day with the same superscript letters are not significantly different (P<0.05). 2FAME= fatty acid methyl esters of 16:0 (palmitic acid); 18:0 (stearic acid); 18:1 (oleic acid); 18:2 (linoleic acid); 18:3 (linolenic acid).
44
TABLE 3. Relationship between Hunter L Value and Total Polar Compounds in Ultra Low-linolenic acid (ULL), Low-linolenic acid (LL), and Control Soybean Oils throughout Frying
Oil type Equation Correlation coefficient7
ULL L = -0.960TPC+54.119 0.98*
LL L = -1.045TPC+56.324 0.97*
Control L = -1.087TPC+58.094 0.98*
Denotes significance at PcO.OOl level
45
4.5
4.0 03.5
*3.0
12.5 ^20
<1.0 Ê0.5 0.0
0 2 4 6 8 10 12 14 16 18 20 22 24
Days Frying
ULL
LL
Gontrol
FIG. 1. FFA evolution in ultra low-linolenic acid (ULL), low-linolenic acid (LL) and control soybean oils throughout frying. Each value represents the mean of two replications. Bars around each data point indicate standard error of the mean for all data points.
46
40
35
i 30
25
ULL
- LL
Gontrol
0 2 4 6 8 10 12 14 16 18 20 22 24
Days Fryirg
FIG. 2. Total polar compounds in ultra low-linolenic acid (ULL), low-linolenic acid (LL) and control soybean oils throughout frying. Each value represents the mean of two replications. Bars around each data point indicate standard error of the mean for all data points. The value of 25% polar compounds is used in some countries as the maximum discard value for frying oils (24).
47
JLT.i $--$
TJLL
- LL
Gontrol
FIG. 3. Conjugated dienoic acid content in ultra low-linolenic acid (ULL), low-linolenic acid (LL) and control soybean oils throughout frying. Each value represents the mean of two replications. Bars around each data point indicate standard error of the mean for all data points.

48
9
8
7
6
5
« 4
3
2 ULL
1 0 1
Gcrtrci -2
-3 0 2 4 6 8 10 12 14 16 18 20 24
Days Frying
19 ITT 17
15 Gxitrol
13
11 9
7
5
3
10 12 14 16 18 0 2 4 6 8 20 24
Days Frying
55
LLL 50
- LL 45
Gcntrol 40
J 35
30
25
20
10 12 14 16 18 0 2 4 6 8 20 24
Days Ryirg
FIG. 4. Color Hunter L, a, and b values in ultra low-linolenic acid (ULL), low-linolenic acid (LL) and control soybean oils throughout frying. Each value represents the mean of two replications. Bars around each data point indicate standard error of the mean for all data points.
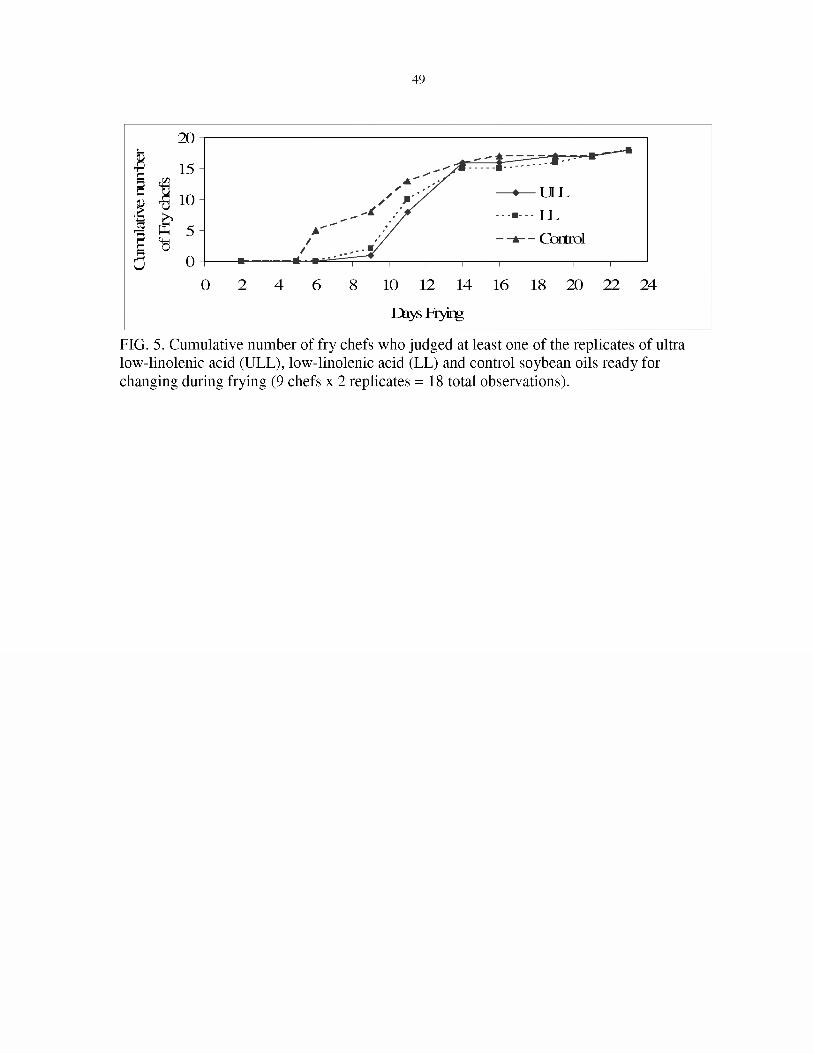
49
20
15
10
£ 5 tti 0 0
r:y :
\rrrrrrr.m- -
—•— ULL ------ y j,
Gartrol
0 8 10 12 14 16 18 20 22 24
Days Frying
FIG. 5. Cumulative number of fry chefs who judged at least one of the replicates of ultra low-linolenic acid (ULL), low-linolenic acid (LL) and control soybean oils ready for changing during frying (9 chefs x 2 replicates =18 total observations).

50
Buttery Potato
* ULL
- - " - - L L
—a— Control
T =1
4
litre (days)
- - ULL
— A— Control *-•
- —
4
litre (days)
Rancid Painty
•—ULL
•- • LL
A— Control
4
Titre (days)
14
f 2 ® 10
—>—ULL
- - LL
— A— Central
4
Titre(days)
FIG. 6. Sensory scores for buttery, potato, rancid, and painty flavors in French fries fried in ultra low-linolenic acid, low-linolenic acid and control soybean oils throughout the first week of frying. Data are the average of two replications.
51
Rapid Determination of Degradation in Frying Oils by NIR Spectroscopy
A paper to be submitted to the Journal of the American Oil Chemists' Society
Jose Gerde1, Connie Hardy2, Charles Hurburgh1'3, and Pamela White1*
^Department of Food Science and Human Nutrition, Iowa State University, Ames, Iowa
50011
^Value Added Agriculture Program, Iowa State University, Ames, Iowa 50011
^Department of Agricultural and Biosystems Engineering, Iowa State University, Ames,
Iowa 50011
Running Title: NIR MEASUREMENT OF OIL DEGRADATION
*To whom correspondence should be addressed at 2312 Food Sciences Building, Iowa State
University, Ames, IA 50011-1060. Phone: 515-294-9688, Fax: 515-294-8181, Email:
pj white @ iastate.edu
ABSTRACT: Free fatty acids (FFA), total polar material (TPM), and conjugated dienoic
acid (CDA) contents are typical indices of oil degradation. Soybean oils with different
linolenic acid concentrations were used to fry French fries. Oil aliquots were taken daily and
analyzed to determine FFA, TPM and CDA. These aliquots also were scanned with a
reflectance spectrometer by using a wavelength range of 350 to2500 nm. By using partial
least squares and one-out cross validation, calibrations were developed to quantitatively
52
determine FFA, TPM, and CDA by NIR spectroscopy (NIRS). Successful calibrations were
obtained for the measurement of FFA and TPM. The coefficients of determination (R2) when
compared to the standard procedures were 0.974 for FFA and 0.958 for TPM. The use of
NIRS for the determination of CDA was less effective (R2= 0.775). NIRS was an accurate
and fast method to determine FFA and TPM in oxidized oils. The ability to obtain different
parameters simultaneously makes NIRS a potentially valuable tool for food quality
assurance.
KEYWORDS: calibration, conjugated dienoic fatty acids, free fatty acids, frying, NIR
spectroscopy, soybean oil, total polar material.
The frying industry uses several parameters to determine the quality of oil in deep-fat fryers.
Speed and consistency are extremely important characteristics in choosing measurement
methodologies to be used. Acidity expressed as free fatty acid (FFA) content is one of the
most common oil quality assays used to assess the quality of frying oils. The official
methodology has been modified to use small oil samples in order to reduce cost and waste
(1).
Total polar material (TPM) content is also a reliable indicator of frying oil
deterioration. TPM uses hazardous organic solvents (petroleum ether and diethyl ether) and
requires 3.5 h per sample (2). This index is not commonly used by the industry as a daily
quality control index; its use is often limited to research studies.
Conjugated diene fatty acids (CDA) in polyunsaturated oil is an indicator of the initial
oxidation stages. This index is not commonly used by the food industry but is very useful in
53
scientific studies. Measurement of CDA is done by spectrophotometry (3).
Near infrared spectroscopy (NIRS) is a clean, fast, and nondestructive method proven
to be useful in determining fatty acid composition in soybeans (4). It also has been used to
determine the quality of edible oils (5-7). Previous work by Ng et al. (8) showed strong
spectral correlations between FFA and NIRS using transmission spectra in samples of oils
heated at 190°C with the added water to promote the formation of FFA and TPM. The FFA
range was 0.020 to 0.568 % oleic acid. Relative predictive determinants (RPD) ( 9), were
between 2.5 to 6.0 for the FFA calibration, and between 15.3 and 19.7 for TPM. For TPM,
the oil samples ranged between 2.18 and 62.93% polar material. It is generally accepted that
a calibration with an RPD > 5.0 is a good calibration and can be applied in quality control
operations; if the RPD is > 8.1 the calibration can be used in any application (9).
Buning-Pfaue and Kehraus (10) developed multiple partial least squares (PLS)
models for FFA in the range of 0.03 to 2.76% as oleic acid and for TPM in the range of 7.6 to
48.1%. RPD were 5.5 for the FFA calibration and 5.0 for the TPM calibration. In this case,
the oils being tested were obtained from actual fryers in restaurants and bars.
Yildiz et al. (11) reported a PLS calibration for CDA determination in soybean oils
using transmittance NIRS, with RPD of 3.6 and 4.5 for two path lengths.
The previous studies were limited because the oxidation of the oils was done by
heating and pumping water into the oils or by inducing the oxidation with a fluorescent lamp
(9, 11) and when done with actual frying oils the number of samples used was too small (10).
The objectives of this study were to determine FFA, TPM, and CDA with NIRS in actual
frying oils with ranges typical of food service use.
54
MATERIALS AND METHODS
This NIRS study was conducted as part of a frying stability test of oils with varying linolenic
acid content (12).
Oils: Extruded-expelled, physically refined soybean oils with three different levels of
linolenic acid were obtained through Innovative Growers from American Natural Soy, Inc.,
Cherokee, Iowa. The cultivars from which the oils came were: IA2064 produced by Taylor
Seeds, Inc. near Hartley, IA in 2003, ultra low-linolenic acid oil (ULL) and IA3018 produced
by Pleasant Valley Farms near Iowa City, IA, in 2004, low linolenic acid oil (LL). The third
oil was obtained from conventional beans produced by American Natural Soy (Control
(Ctrl)). The starting linolenic acid contents of the oils were: 1.5 (ULL), 2.6 (LL), and 5.3%
(Ctrl) The two lines with reduced content of linolenic acid originated from Iowa State
University soybean varieties developed through traditional breeding practices.
French fries: Extra-long (XL) fancy 0.635-cm (VA inches) shoestring par-fried frozen
French fries were obtained from a commercial supplier. The fries were par-fried by the
processor in partially hydrogenated shortening (canola and/or soybean oil) and/or palm oil,
and/or beef fat. They also contained dihydrogen phosphate (to retain color), dextrose, and
natural flavoring.
Frying operation: Three Star Twin-Pot deep-fat fryers model 530TA (Star
Manufacturing International Inc., St. Louis, MO, 7.2 liter per well) were used to heat the oils.
Oil treatments were heated in duplicate and French fries were fried according to Gerde et al.
(12). The oil in the fryers was replenished to the starting level with fresh material.
Oil sampling: Aliquots from the filtered oils were taken at the end of each frying day
for further analysis. The samples were stored at -22°C in glass jars under nitrogen in the dark

55
to prevent further oxidation.
Free Fatty Acids (FFA): FFA content was measured daily from the oil aliquots (n =
138) by titration using a modification of the AOCS Official Method Ca 5a-40 (3) for small
samples (1). The acidity was expressed as percentage of oleic acid. FFA are formed during
the frying process from hydrolysis of triglycerides, however, the AOCS method does not
discriminate between acidity from actual fatty acids and acidity from other organic acids
formed during oil oxidation. Because the AOCS method is a titration procedure, with a
colorimetric end point, it is not easy to get consistency among different laboratories and
operators, and even from an individual operator.
Total Polar Compounds (TPC): TPC content was measured by column
chromatography with AOCS Method Cd 20-91(3). The TPC content was measured after days
2, 5,6,9,11,14,16,19, 21, and 23 (n = 60).
Conjugated Diene Fatty Acids (CDA): The CDA content was determined as described
in the AOCS Official Method Ti la-64 (3). The sample is dissolved in isooctane and the
absorbance of the solution is measured in a spectrophotometer at 233 nm. The concentration
of oil needs to be adjusted to fit the absorbance values between 0.2 and 0.8 (3). The oil
samples were from the same days as for TPM, with the total number of samples again being
60.
Near Infrared Spectroscopy: Daily oil aliquots were allowed to come to room
temperature in the dark and poured into 64/51 mm approximate internal diameter top/base
weighing boats (Fisherbrand, Fisher Scientific, Pittsburgh, PA). They were scanned with a
reflectance spectrometer using a wavelength range of 350-2500 nm (Lab S pec Pro, Analytical
Spectral Devices, Boulder, CO). The samples were not tested on-line and the test does not

56
include temperature compensation.
Spectra were analyzed with Unscrambler 9.6 using Partial Least Squares (PLS)
modeling, with three Principal Components (PC) for FFA and TPM and nine PC for CDA.
Wavelengths in the range of 445 to 1675 nm were selected for CDA and TPM analyses and
1141 to 1675 nm for FFA analysis. These ranges contained the most useful information about
the parameters measured. The validity of the models was tested by cross validation.
RESULTS AND DISCUSSION
Free Fatty Acids: The FFA level of the oil aliquots measured was 0.10 to 4.35 % oleic acid
equivalent, with an average of 1.80 %. The best PLS model (3 PC) using one-out cross
validation yielded a coefficient of determination (R2) of 0.974 and a standard error of cross
validation (SECV) of 0.219 with an RPD of 6.4. Eight aliquots out of the 138 were removed
as spectral outliers, but no particular oil type or frying stage showed a tendency to produce
spectral outliers. Figure 1 shows the regression between the reference and the predicted
values.
Total Polar Compounds: The number of aliquots used for the TPM calibration was
60, rather than the 138 used for the FFA calibration, because of the time and resources
needed to analyze all the samples. The TPM contents of the samples used ranged between
15.04 and 39.20 %, with a mean of 28.39%. The maximum TPM value was far above 24 to
27% that many countries accept as the maximum allowable for frying oils (12). Figure 2
shows the regression curve between the reference and the predicted values. The best PLS
model yielded a R2 of 0.958 with a SECV of 1.051 and an RPD of 4.9. Seven outliers were
removed. The removed samples belonged to different stages in the frying process and did not
57
show any tendency to produce outliers.
Conjugated diene fatty acids: Figure 3 shows the regression curve between the
reference CDA method and the predicted values. The R2 for by this model was 0.775 with a
SECV of 0.080 and an RPD of 2.1. The range of CDA measured in the oil was from 0.86 to
1.80%, with a mean of 1.41%. Four outliers were removed.
In general the tested samples had a wider range of FFA and CDA compared to
previous work (9, 11), however the range of TPM was narrower. Reflectance NIRS
spectroscopy is a reliable, accurate and fast technique to determine the FFA and TPM
contents in actual frying oils after lengthy use. The calibration to determine CDA was not as
strong as for FFA and TPM. NIR spectroscopy can be used for quality control of frying
operations in the food industry.
REFERENCES
1. Rukunudin, I.H., P.J. White, C.J. Bern, and T.B. Bailey, A Modified Method for
Determining Free Fatty Acids from Small Soybean Oil Sample Sizes, J. Am. Oil Chem.
75:563-568 (1998).
2. White, P.J., Methods for Measuring Changes in Deep-Fat Frying Oils, Food Technol.
45:75-80 (1991).
3. Official Methods and Recommended Practices of the American Oil Chemists' Society,
edited by D. Firestone, 4th edn., American Oil Chemists' Society, Champaign, IL, 1989.
4. Kovalenko, I.V., G.R. Rippke, and C.R. Hurburgh, Measurement of Soybean Fatty Acids
by Near-Infrared Spectroscopy: Linear and Nonlinear Calibration Methods, J. Am. Oil
CAcm. Soc. 83:421-427 (2006).
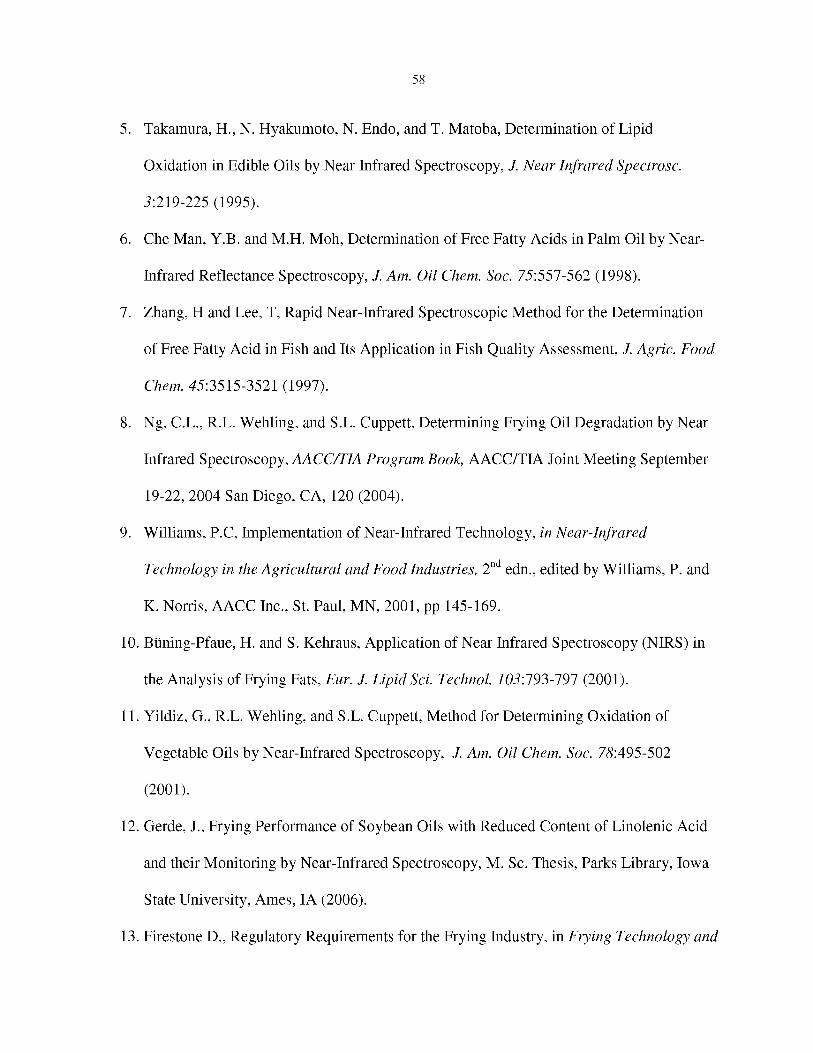
58
5. Takamura, H., N. Hyakumoto, N. Endo, and T. Matoba, Determination of Lipid
Oxidation in Edible Oils by Near Infrared Spectroscopy, J. Near Infrared Spectrosc.
3:219-225 (1995).
6. Che Man, Y.B. and M.H. Moh, Determination of Free Fatty Acids in Palm Oil by Near-
Infrared Reflectance Spectroscopy, J. Am. Oil Chem. Soc. 75:557-562 (1998).
7. Zhang, H and Lee, T, Rapid Near-Infrared Spectroscopic Method for the Determination
of Free Fatty Acid in Fish and Its Application in Fish Quality Assessment, J. Agric. Food
CAcm. 45:3515-3521 (1997).
8. Ng, C.L., R.L. Wehling, and S.L. Cuppett, Determining Frying Oil Degradation by Near
Infrared Spectroscopy, AACC/TIA Program Book, AACC/TIA Joint Meeting September
19-22, 2004 San Diego, CA, 120 (2004).
9. Williams, P.C, Implementation of Near-Infrared Technology, in Near-Infrared
Technology in the Agricultural and Food Industries, 2nd edn., edited by Williams, P. and
K. Norris, AACC Inc., St. Paul, MN, 2001, pp 145-169.
10. Buning-Pfaue, H. and S. Kehraus, Application of Near Infrared Spectroscopy (NIRS) in
the Analysis of Frying Fats, Eur. J. Lipid Sci. Technol. 103:193-191 (2001).
11. Yildiz, G., R.L. Wehling, and S.L. Cuppett, Method for Determining Oxidation of
Vegetable Oils by Near-Infrared Spectroscopy, J. Am. Oil Chem. Soc. 78:495-502
(2001).
12. Gerde, J., Frying Performance of Soybean Oils with Reduced Content of Linolenic Acid
and their Monitoring by Near-Infrared Spectroscopy, M. Sc. Thesis, Parks Library, Iowa
State University, Ames, IA (2006).
13. Firestone D., Regulatory Requirements for the Frying Industry, in Frying Technology and

59
Practices, edited by M.K. Gupta, K. Warner, and P.J. White, AOCS Press, Champaign,
IL, 2004, pp. 200-216.
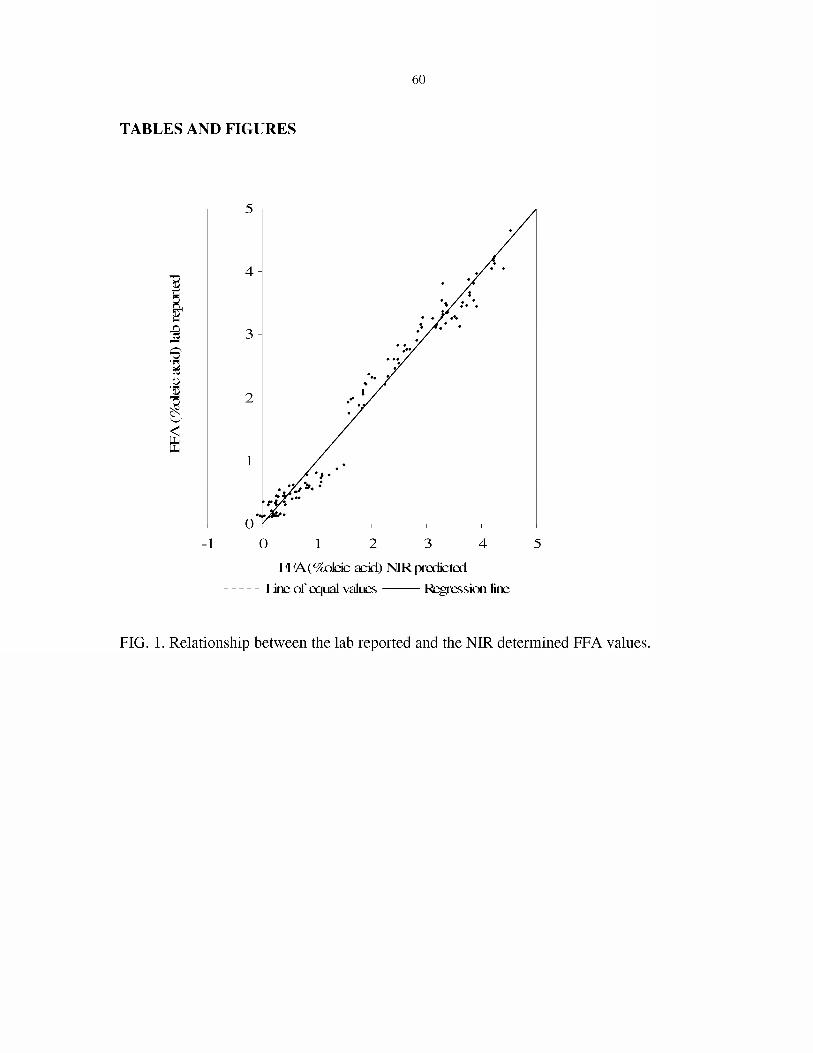
60
TABLES AND FIGURES
-1 0 1 2 3 4 5
FFA(%oleic acid) MR predicted
line of equal values Regression line
FIG. 1. Relationship between the lab reported and the NIR determined FFA values.
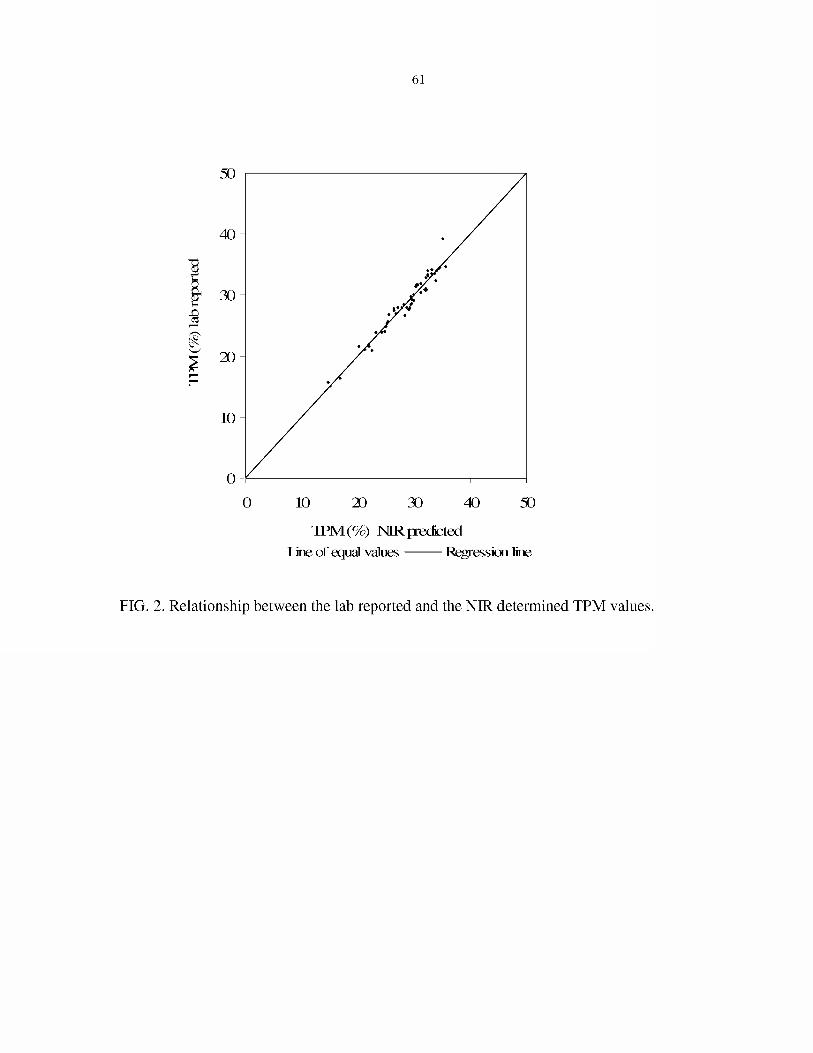
61
50
40
30
i $
I 20
0 10 20 30 40 50
TPM(%) NIR predicted
Line of cc|ual values Regression line
FIG. 2. Relationship between the lab reported and the NIR determined TPM values.
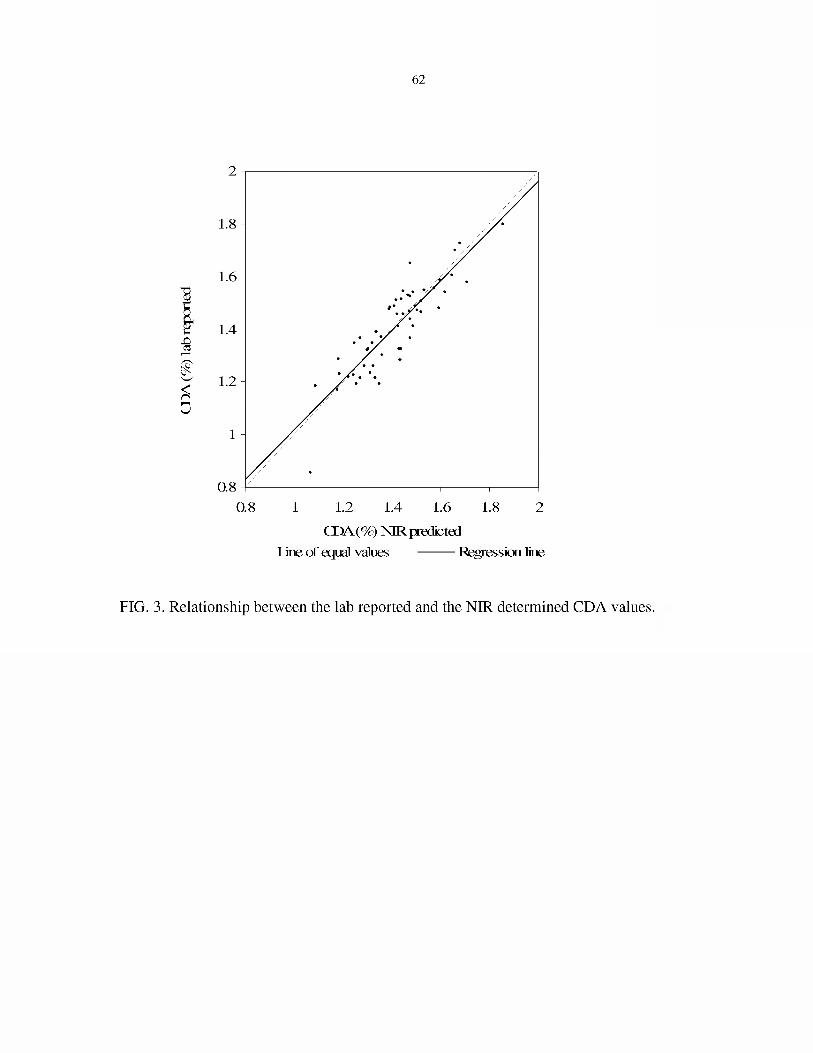
62
1.8
1.6
1.4
1.2
0.8
0.8 1 1.2 1.4 1.6 1.8 2
CDA(%) NIR predicted
Line of equal values Regression line
FIG. 3. Relationship between the lab reported and the NIR determined CDA values.

63
General Conclusions
This study demonstrated that the use of extruded-expelled soybean oil with reduced
contents of linolenic acid improved the stability of soybean oil during frying. Both, ULL and
LL performed better than the commodity oil and ULL tended to be more stable than LL
according to the chemical parameters measured. Based on the TPM content, the frying life of
both ULL and LL was -30% longer than regular soybean oil. Indeed, the fry chefs'
evaluation showed control was judged to be changed much earlier than both ULL and LL.
The sensory evaluation of the French fries did not show differences among the treatments for
potato, buttery, and painty flavors. For rancid flavor, fries fried in both ULL and LL scored
lower (less intensity) than when fried in the control oil. The small differences between ULL
and LL might be due to the higher content of tocopherols in LL and to the small difference in
linolenic acid contents between the oils. In general, both ULL and LL oils seem to be
promising alternatives to partially hydrogenated oils in frying processes.
For the evaluation of the oil degradation during frying using near-infrared
spectroscopy, successful correlations were obtained for the determination of FFA and TPM.
For CDA, the correlation was not as robust as for the other two parameters. Near-infrared
spectroscopy was a fast and clean tool for determining the degree of degradation of frying
oils in food quality assurance.
Continued development of soybean lines with enhanced fatty acid composition is
desirable to meet the changing market demands for new oil types. For example, the linoleic
acid content is a crucial factor in the stability of the oil, as well as in the diet. It will be
necessary to explore the performance of oils with not only reduced content of linolenic acid

64
but linoleic, too. Testing the NIR calibrations with an independent set of frying oils is needed
to evaluate the usefulness of NIR as a quick testing method under different conditions.
![· PDF filesunflower, soybean, corn and crude rape seed oils [13]. Steven and co-workers [14] found that on deep- frying of triolein, polymer formation exceeded 20%](https://img.pdfslide.net/doc/110x75/5aa477fc7f8b9a2f048c3338/soybean-corn-and-crude-rape-seed-oils-13-steven-and-co-workers-14-found-that.jpg)