Embed Size (px)
Citation preview

TVE 16 079
Examensarbete 15 hpOktober 2016
FTIR spectroscopy of glucose
Louise Nybacka

Teknisk- naturvetenskaplig fakultet UTH-enheten Besöksadress: Ångströmlaboratoriet Lägerhyddsvägen 1 Hus 4, Plan 0 Postadress: Box 536 751 21 Uppsala Telefon: 018 – 471 30 03 Telefax: 018 – 471 30 00 Hemsida: http://www.teknat.uu.se/student
Abstract
FTIR spectroscopy of glucose
Louise Nybacka
Approximately 450 000 people have diabetes in Sweden today, and the number ofdiabetics only rises. Monitoring blood sugar several times a day is a fundamental partof managing the disease, and reducing the risks of complications. Today’s glucosemonitoring devices are invasive and require small needle sticks for a measurement.Providing a painless method of monitoring the blood sugar level would relieve thelives of diabetics world-wide.
The objective of this project was to investigate the absorption spectra of aqueousglucose concentrations (100 to 5000 mg/dl) in the mid infrared region with FourierTransform spectroscopy (FTIR), and finally implementing a hand-held monochromaticspectrometer to demonstrate a non-invasive concept. The method chosen forimplementing the hand-held demo is due to the commercial availability of diodes anddetectors at those wavelengths.
The results from the FTIR showed a trend among concentrations in all wavelengths,in between 1180 to 980 cm-1, specifically at 1035 cm-1, but also in the region 2920 to2850 cm-1. The hand-held spectrometer did not register any transmittance of theglucose samples. For future implementations, 1035 cm-1 should be investigated morein-depth for a hand-held device.
TVE 16 079Examinator: Hana BarankovaÄmnesgranskare: Ladislav BardosHandledare: Dragos Dancila

3
Table of Contents
1 Introduction .................................................................................................................................................... 4
2 Theory ............................................................................................................................................................ 5
2.1 FTIR ...................................................................................................................................................... 5
2.2 Glucose samples .................................................................................................................................... 6
3 Experimental apparatus and procedure........................................................................................................... 7
3.1 FTIR ...................................................................................................................................................... 7
3.2 Hand-held spectrometer ......................................................................................................................... 7
4 Results ............................................................................................................................................................ 9
4.1 FTIR ...................................................................................................................................................... 9
4.1.1 Absorption spectra and graphs .......................................................................................................... 9 4.1.2 Integration graphs ............................................................................................................................ 11
4.2 Hand-held spectrometer ....................................................................................................................... 13
5 Discussion .................................................................................................................................................... 14
5.1 FTIR .................................................................................................................................................... 14
5.2 Hand-held spectrometer ....................................................................................................................... 14
6 Conclusion .................................................................................................................................................... 16
7 Acknowledgements ...................................................................................................................................... 17
8 References .................................................................................................................................................... 18
9 Appendix ...................................................................................................................................................... 19

4
1 Introduction
Around 450 000 people have diabetes in Sweden in 20161 and 422 million have diabetes across
the world2. The diagnosis is chronic and has many complications, such as cardiovascular
diseases, chronic kidney failure, blindness etc. The number of diabetics only increases each
year, and so an easy, non-invasive method of monitoring the blood sugar level is vital for
reducing the risks of further complications. Modern monitoring techniques are invasive and an
easier, less painful method of monitoring ones blood glucose should relieve difficulties for
diabetic patients.
Fourier Transform Infra-red spectroscopy (FTIR) is a well-established method of identifying
unknown substances and their composition. Mid infra-red (MIR) covers the electromagnetic
region between 4000 to 900 cm-1 (alternatively, 2500 to 11000 nm or 120 to 27 THz). Different
approaches for non-invasive glucose monitoring have been made before3 4, besides the MID-
FTIR, specifically the near infra-red region (NIR) (14000 to 4000 cm-1, alternatively, 800 to
2500 nm or 120 to 375 THz). Some of these approaches include analyzing the FTIR absorbance
spectra of oral mucous5 and blood serum6.
The objective of this project was to investigate the absorption of varying glucose concentrations
in the MID-FTIR spectra, and furthermore to look into the possibility of implementing a
portable device for non-invasive measurements as a proof of concept.
1 Diabetesförbundet, (2016). Diabetes i siffror. [Online]. Available at: http://www.diabetes.se/Diabetes/Om-
diabetes/Diabetes-i-siffror/ [Accessed 13 Aug. 2016]. 2 Svensson, L. (2016). WHO: Fyra gånger fler har diabetes. SVT Nyheter. [Online] Available at:
http://www.svt.se/nyheter/vetenskap/who-fyra-ganger-fler-har-diabetes [Accessed 13 Aug 2016]. 3 Ahmad, M., Kamboh, A. and Khan, A. (2013). Non-invasive blood glucose monitoring using near-infrared
spectroscopy. [Online]. EDN Network. Available at: http://www.edn.com/design/systems-design/4422840/Non-
invasive-blood-glucose-monitoring-using-near-infrared-spectroscopy [Accessed 13 Aug 2016]. 4 Saptari, V. A. (2004). A Spectroscopic System for Near Infrared Glucose Measurement. Diss., Massachusetts
Institute of Technology, p. 15. 5 Kajiwara K, et al. (1993). Noninvasive measurement of blood glucose concentrations by analysing Fourier
transform infra-red absorbance spectra through oral mucosa. Med Biol Eng Comput. Jul 31. Suppl:S17-22.
PubMed PMID: 8231320. 6 Shaw, R. A. and Mantsch, H. H. Infrared Spectroscopy in Clinical and Diagnostic Analysis, Encyclopedia of
Analytical Chemistry, p. 14.

5
2 Theory
2.1 FTIR
Fig. 2.1. Michelson interferometer for FTIR
The optical instrumentation in an FTIR spectroscope requires an infra-red light source, a
Michelson interferometer which consists of two mirrors, a beam splitter, and one detector. In
the Michelson interferometer the infrared light strikes on the beam splitter, which reflects 50 %
of the incoming light on a stationary mirror and transmits the remaining 50 % on a moving
mirror. The two beams from the moving mirror and stationary mirror are then recombined and
50 % of the combined beam travels to the detector through the sample, and the other 50 %
travels back to the light source. The interferogram, or interference pattern, is generated when
the combined beam strikes through the beam splitter. The pattern varies relative to the position
of the moving mirror. The interferogram is later converted to a spectrum through a Fourier
Transform.
To further quantitative analyze the absorbance, integration of peaks can be calculated.
The absorbance at a wavelength is given by:
𝐴 = log101
𝑇 (1)
where T, the transmittance is given by
𝑇 =𝐼
𝐼0 (2)
where I is the transmitted intensity and Io is the incoming intensity on the sample.

6
2.2 Glucose samples
Figure 2.2.1 Chain structure of glucose
The fundamental frequencies of glucose are found in the MID-IR region7. The fundamental
frequencies have the strongest absorption of all the types of frequencies: fundamental,
combination, first overtone, second overtone etc.
Wavenumber [cm-1] Assignment
3350 Stretch of OH
2920 Asymmetric vibration of CH
2850 Symmetric vibration of CH8
1450 Bending vibration of CH
1035 Vibration of CO and vCC9
Table 2.2.1 The fundamental frequencies of glucose and their corresponding assignments.
The blood sugar level of a healthy diabetic should be in between 90 and 130 mg/dl fasting, and
less than 180 mg/dl after eating. A blood sugar level less than 50 mg/dl is a diagnostic for
hypoglycemia, which might cause clumsiness, confusion, and seizures. A blood sugar level
higher than 200 mg/dl is hyperglycemia, but may not be noticeable until higher levels of blood
sugar are reached.
7 Geddes, C.D. and Lakowicz, J.R. (2006). Glucose Sensing. New York: Springer, p. 169. 8 Dopico, A. (2007). Methods in Membrane Lipids. Totowa: Human Press, p. 212. 9 Ibrahim, M. et al. (2006). Analysis of the structure and vibrational spectra of glucose and fructose. Eclética
Química,.p. 20.

7
3 Experimental apparatus and procedure
3.1 FTIR
The spectrometer used in this project was a Bruker IFS 66 V/S. The light source used was a
HeNe laser and the beam splitter KBr. The detector was a deuterated L-alanine doped triglycine
sulfate (DLaTGS) detector. The measurements was done with 256 scans, and a resolution of 2
cm-1 between 4000 and 900 cm-1. In the following graphs, atmospheric compensation was made
to remove H2O and CO2 vapor bands in the spectra. These bands arise due to different H2O
vapor concentrations in the beam path. No baseline correction was made, since it was not
considered to be necessary. Integration and processing the spectra were done with OPUS
software10.
In the beginning of a new experiment the sample compartment was cleansed with ethanol to
remove any traces of old samples and dirt. After each measurement the sample cell was purged
three times with deionized water to remove any residue of alcohol. For a sample measurement,
the sample compartment was filled with 30 µl of solution, slowly whisking around in the sample
compartment to remove any bubbles. For the dry sample, 3 µl of 300 mg/ml was added on the
sample surface and was set to dry.
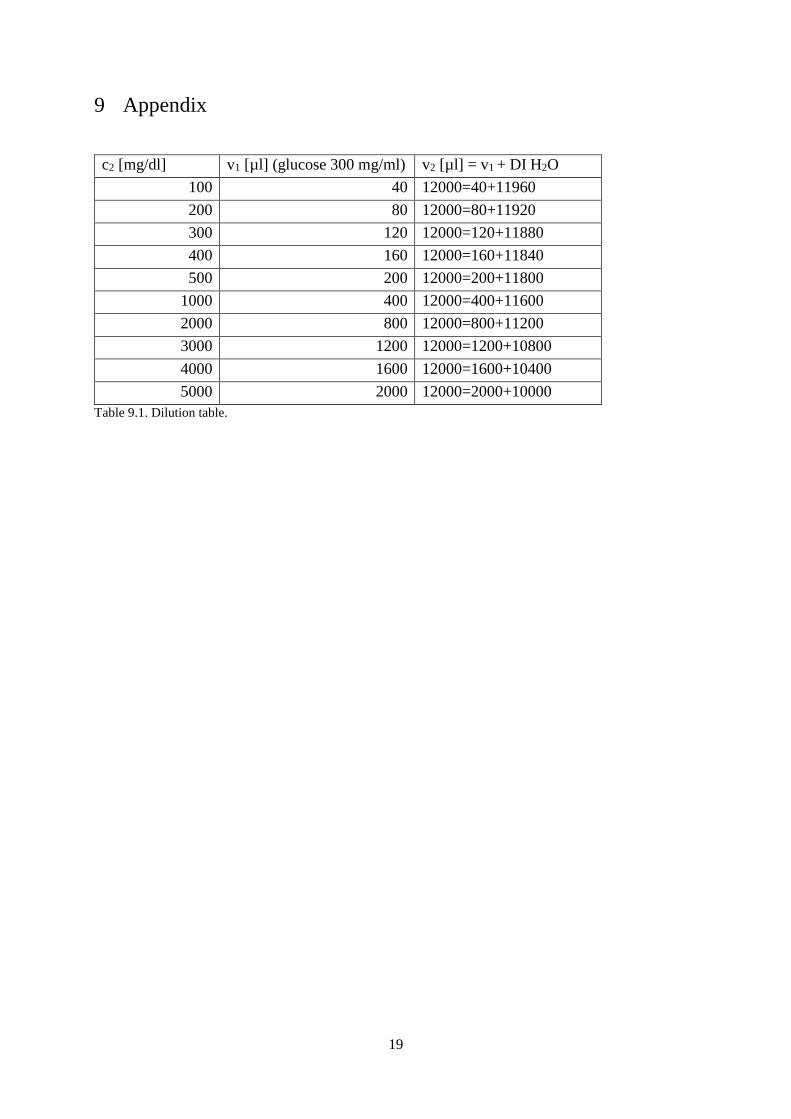
For preparation of the samples, a glucose concentration of 300 mg/ml was diluted with
deionized water according to table 9.1. The concentrations prepared for this experiment ranged
between 100 to 5000 mg/dl, in steps of 100 mg/dl between 100 and 500 mg/dl and 1000 mg/dl
between 1000 to 5000 mg/dl. Many attempts at verifying the concentrations with a glucometer
were made, however it did not register any glucose.
3.2 Hand-held spectrometer
For selecting the external light source and detection, two regions of absorption were considered:
The absorption peak at 1035 cm-1 (31,03 Tand the absorption band between 2920 and 2850 cm-
1. The light sources and detectors 1035 cm-1 are expensive, and were considered to be too
advanced for this project. The light sources in the absorption band between 2920 and 2850 cm-
1 were within the limitations of this project. The light source selected was a LED34-PR11 and
the photodiode chosen was a PD36-03-PR12. Both the LED and photodiode had parabolic
reflectors for a narrower, more directed beam. A PCB-mdriver-P13 delivered a pulsed square
wave for maximum peak output from the LED.
The aim for the demonstration was to manufacture a small, hand-held spectrometer for
measuring the glucose samples. The design had a few criteria: It had to be small, not let any
light in, and the led and photodiode should be stationary in the spectrometer since they were
very sensitive.
10 OPUS. (2016). Bruker. 11 Roithner LaserTechnik. Light emitting diode LED34-PR. 12 Roithner LaserTechnik. Photodiode PD36-03-PR. 13 Roithner LaserTechnik. PCB-mdriver-P.

8
The portable spectrometer was made of a small, black, plastic box with the measurements 5x4x3
cm. The box was filled with several layers of black, thin foam. In the middle of each foam layer,
a hole for the sample container was cut out. In the middle layers, additional holes were cut out
for the LED and photodiode. Two separate holes were drilled in the sides for the cables. The
cables were isolated with tape to prevent any possible short-circuit. A lid was taped to the plastic
box for blocking external light. The PerkinElmer spectroscopy UV/VIS cells was used for a
sample container.
The driver delivered a 1 % duty cycle 2 kHz 2 A square wave, for obtaining maximum peak
power. The LED was connected to the driver. The output voltage was measured from the
photodiode anode which was connected to the ground, and analyzed with an oscilloscope. For
calculating the transmittance of the samples, the sample cell was filled with deionized water
and the incoming intensity was measured. The transmittance was calculated relative the sample
cell filled with DI water.
Figure 3.2.1. Schematic of the spectrometer
Figure 3.2.2. The hand-held spectrometer. To the left: The LED and photodiode setup. To the right: The open spectrometer
with the sample cell

9
4 Results
4.1 FTIR
4.1.1 Absorption spectra and graphs
The following spectra have been slightly shifted to have as similar baseline as possible.
Figure 4.1.1. The entire absorbance spectra with all concentrations
Figure 4.1.2. Absorbance between 3020 and 2760 cm-1. A trend can be noticed between 2000 and 5000 mg/dl.
Abso
rban
ce
Abso
rban
ce
Wavenumbers [cm-1]
Wavenumbers [cm-1]

10
Figure 4.1.3. Absorbance spectra between 1480 to 1200 cm-1, no trend between 100 and 500 mg/dl can be noticed.
Figure 4.1.4. Absorbance spectra between 1180 and 960 cm-1. A trend in absorption can be noticed specifically at 1035 cm-1,
from 100 mg/dl to 5000 mg/dl.
Abso
rban
ce
Abso
rban
ce
Wavenumbers [cm-1]
Wavenumbers [cm-1]
11
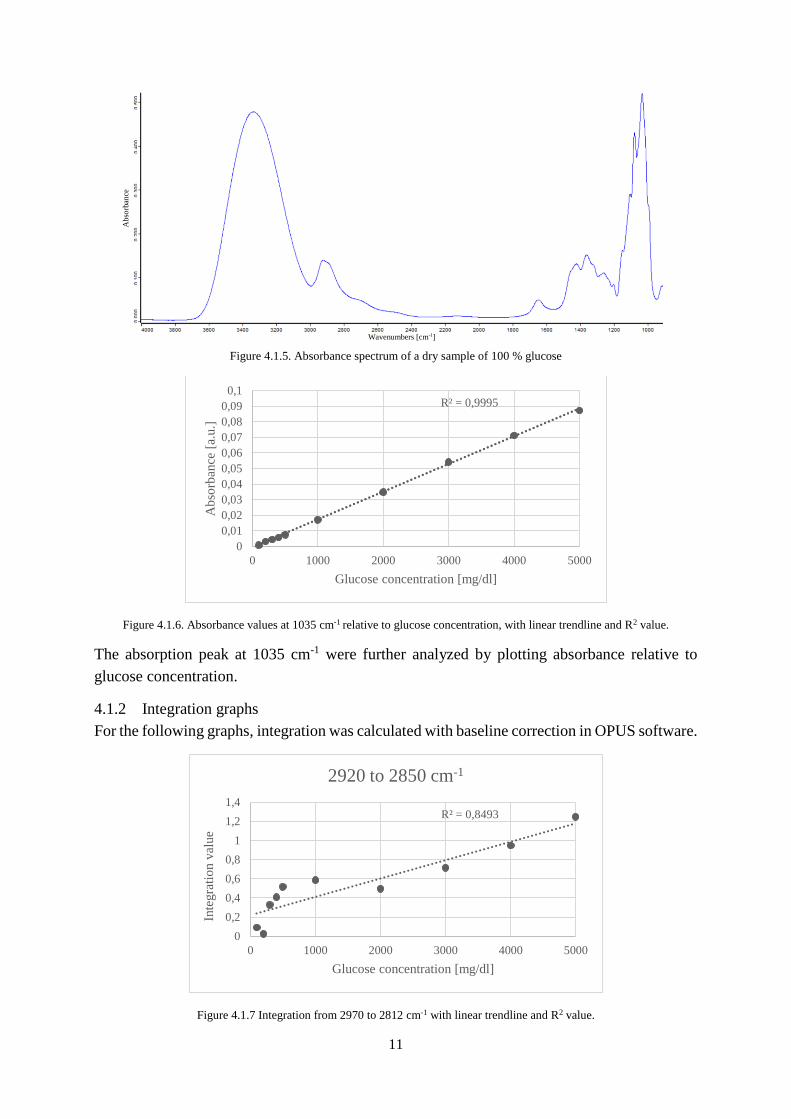
Figure 4.1.5. Absorbance spectrum of a dry sample of 100 % glucose
Figure 4.1.6. Absorbance values at 1035 cm-1 relative to glucose concentration, with linear trendline and R2 value.
The absorption peak at 1035 cm-1 were further analyzed by plotting absorbance relative to
glucose concentration.
4.1.2 Integration graphs
For the following graphs, integration was calculated with baseline correction in OPUS software.
Figure 4.1.7 Integration from 2970 to 2812 cm-1 with linear trendline and R2 value.
R² = 0,9995
0
0,01
0,02
0,03
0,04
0,05
0,06
0,07
0,08
0,09
0,1
0 1000 2000 3000 4000 5000
Ab
sorb
ance
[a.
u.]
Glucose concentration [mg/dl]
R² = 0,8493
0
0,2
0,4
0,6
0,8
1
1,2
1,4
0 1000 2000 3000 4000 5000
Inte
gra
tio
n v
alue
Glucose concentration [mg/dl]
2920 to 2850 cm-1
Abso
rban
ce
Wavenumbers [cm-1]

12
Figure 4.1.8 Integration from 1485 to 1395 cm-1 with linear trendline and R2 value
Figure 4.1.9 Integration from 1180 cm-1 to 996 cm-1 with linear trendline and R2 value.
Figure 4.1.10 Integration from 1066 to 1000 cm-1 with linear trendline and R2 value
R² = 0,9945
0
0,1
0,2
0,3
0,4
0,5
0,6
0,7
0,8
0,9
0 1000 2000 3000 4000 5000
Inte
gra
tio
n v
alue
Glucose concentration [mg/dl]
1430 cm-1 peak
R² = 0,9962
0
1
2
3
4
5
6
7
8
0 1000 2000 3000 4000 5000
'Inte
gra
tio
n v
alue
[a.u
.]
Glucose concentration [mg/dl]
1180 to 993 cm-1
R² = 0,9995
0
0,5
1
1,5
2
2,5
3
3,5
4
0 1000 2000 3000 4000 5000
Inte
gra
tio
n v
alue
Glucose concentration [mg/dl]
1035 cm-1 peak
13
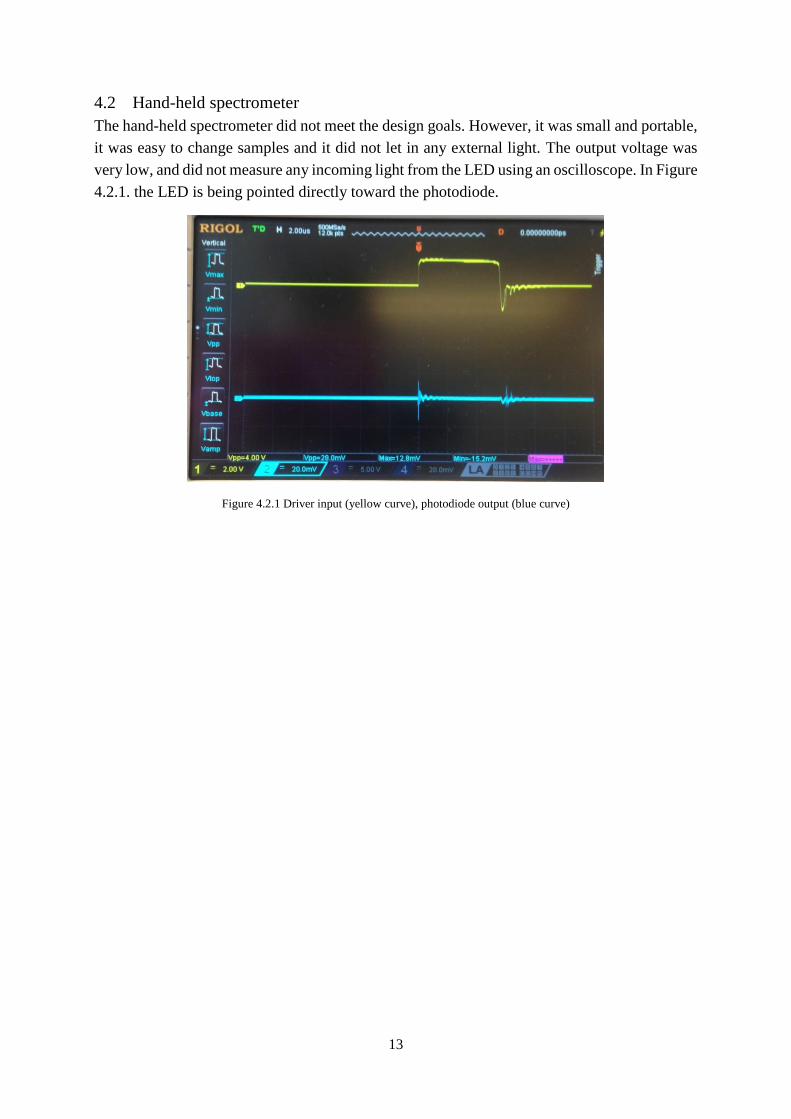
4.2 Hand-held spectrometer
The hand-held spectrometer did not meet the design goals. However, it was small and portable,
it was easy to change samples and it did not let in any external light. The output voltage was
very low, and did not measure any incoming light from the LED using an oscilloscope. In Figure
4.2.1. the LED is being pointed directly toward the photodiode.
Figure 4.2.1 Driver input (yellow curve), photodiode output (blue curve)

14
5 Discussion
5.1 FTIR
From the absorbance of the dry sample in Figure 4.1.5, all of the absorption peaks of glucose
can be viewed. It can be noticed that the region between 3000 and 2900 cm-1 and 1645 cm-1 has
a very strong absorption, which does not register in the aqueous samples. This is because water
has a very strong absorptivity in MID-IR region, which leads to a negative absorbance in the
OH assignments.
Between 2000 and 5000 mg/dl, there was a trend in all of the absorption regions. Between 1180
and 993 cm-1 there was a visible correlation between absorbance and all the glucose samples.
This indicates that the hand-held device may not register any transmittance of the lower
concentrations, regardless if the spectrometer had worked or not. But it could perhaps work
within the higher ranges of concentrations.
Since the results did not show an obvious trend in the lower concentrations in the 2920-2850
cm-1 region, the absorption region around 1430 cm-1 could be considered for future
developments. It is possible to do so since it’s the partially same assignment but different
vibrational mode, see table 2.2.1. The integration curve for 1430 cm-1 correlates better to the
glucose concentrations.
As previously mentioned in results, there was a varying trend relative to the concentration in
the aqueous solutions, both in absorption and integration. 1035 cm-1 had evidently the most
linear correlation between glucose concentration and absorption, and integration value
respectively. 1035 cm-1 is a characteristic peak of glucose, and has been investigated in previous
research14 15. A potential source for 1035 cm-1 could be a Quantum Cascade Laser (QCL). A
QCL was briefly considered for the hand-held spectrometer, but was out of budget.
When the samples were prepared, small amounts of glucose were diluted in large amounts of
DI water. This could be a possible source of error for the low absorptivity in the lower
concentrations. Unfortunately, the glucometer did not measure the solutions properly. Ideally,
the concentrations should be checked. Another possible source of error is the location of the
vacuum pump. In this experiment, the vacuum pump was located very close (ca 3 m) from the
FTIR spectroscope. The optimal location for a vacuum pump is in another room, to lower
vibrations.
5.2 Hand-held spectrometer
The cause of the photodiode not registering any input from the LED is unclear. It’s possible
that the LED or photodiode was faulty from the beginning, or that some part was damaged
during the handling (e.g. soldering) of the equipment. To pin-point what part of the apparatus
14 Martin, W.B., Mirov S., Venugopalan R. (2002). Using two discrete frequencies within the middle infrared to
quantitatively determine glucose in serum. J Biomed Opt. 2002. 15 Kajiwara K, et al. (1993). Noninvasive measurement of blood glucose concentrations by analysing Fourier
transform infra-red absorbance spectra through oral mucosa. Med Biol Eng Comput. Jul 31. Suppl:S17-22.
PubMed PMID: 8231320.

15
is faulty is difficult to say, since trouble-shooting was not successful within the time-frame of
this project.

16
6 Conclusion
The higher concentrations (>2000 mg/dl) had a correlation in absorbance and concentration
throughout the wavelengths, while the lower concentrations a correlation was observed between
1180 and 993 cm-1. For future practical applications, the absorption peak at 1035 cm-1 should
be further investigated. The results showed a positive trend both in the raw absorbance
measurements and the qualitative analysis integrations as expected, which opens the perspective
of future continuation of the work.
The hand-held spectrometer did not work, and trouble-shooting was not within the time-frame.
Trouble-shooting should be carried out for future improvements.

17
7 Acknowledgements
I would like to thank Dragos Dancila for your patience, support, and for introducing this project
to me.
I would like to thank Fredrik Nikolajeff, for your inspiring enthusiasm and willingness to help
me.
I would like to thank Saroj Kumar, for helping me with the FTIR spectrometer, and for your
positivity and encouraging words.
I am very grateful to all three of you for taking your time to help me with this project. It meant
a lot to me!

18
8 References
1. Diabetesförbundet, (2016). Diabetes i siffror. [Online]. Available at:
http://www.diabetes.se/Diabetes/Om-diabetes/Diabetes-i-siffror/ [Accessed 13 Aug. 2016].
2. Svensson, L. (2016). WHO: Fyra gånger fler har diabetes. SVT Nyheter. [Online] Available
at: http://www.svt.se/nyheter/vetenskap/who-fyra-ganger-fler-har-diabetes [Accessed 13 Aug
2016].
3. Ahmad, M., Kamboh, A. and Khan, A. (2013). Non-invasive blood glucose monitoring using
near-infrared spectroscopy. [Online]. EDN Network. Available at:
http://www.edn.com/design/systems-design/4422840/Non-invasive-blood-glucose-
monitoring-using-near-infrared-spectroscopy [Accessed 13 Aug 2016]
4. Saptari, V. A. (2004) A Spectroscopic System for Near Infrared Glucose Measurement. Diss.,
Massachusetts Institute of Technology, p. 15.
5. Kajiwara K, et al. (1993). Noninvasive measurement of blood glucose concentrations by
analysing Fourier transform infra-red absorbance spectra through oral mucosa. Med Biol Eng
Comput. Jul 31. Suppl:S17-22. PubMed PMID: 8231320.
6. Shaw, R. A. and Mantsch, H. H. Infrared Spectroscopy in Clinical and Diagnostic Analysis,
Encyclopedia of Analytical Chemistry, p. 14.
7. Geddes, C.D. and Lakowicz, J.R. (2006). Glucose Sensing. New York: Springer, p. 169.
8. Dopico, A. (2007). Methods in Membrane Lipids. Totowa: Human Press, p. 212.
9. Ibrahim, M. et al. (2006). Analysis of the structure and vibrational spectra of glucose and
fructose. Eclética Química, p. 20.
10. OPUS. (2016). Bruker.
11. Roithner LaserTechnik. Light emitting diode LED34-PR.
12. Roithner LaserTechnik. Photodiode PD36-03-PR.
13. Roithner LaserTechnik. PCB-mdriver-P.
14. Martin, W.B., Mirov S., Venugopalan R. (2002). Using two discrete frequencies within the
middle infrared to quantitatively determine glucose in serum. J Biomed Opt. 2002.
15. Kajiwara K, et al. (1993). Noninvasive measurement of blood glucose concentrations by
analysing Fourier transform infra-red absorbance spectra through oral mucosa. Med Biol Eng
Comput. Jul 31. Suppl:S17-22. PubMed PMID: 8231320.
19
9 Appendix
c2 [mg/dl] v1 [µl] (glucose 300 mg/ml) v2 [µl] = v1 + DI H2O
100 40 12000=40+11960
200 80 12000=80+11920
300 120 12000=120+11880
400 160 12000=160+11840
500 200 12000=200+11800
1000 400 12000=400+11600
2000 800 12000=800+11200
3000 1200 12000=1200+10800
4000 1600 12000=1600+10400
5000 2000 12000=2000+10000
Table 9.1. Dilution table.