Embed Size (px)
Citation preview
ISSN: 0973-4945; CODEN ECJHAO
E-Journal of Chemistry
http://www.e-journals.net 2011, 8(1), 347-353
Impedance Spectroscopy and FTIR
Studies of PEG - Based Polymer Electrolytes
ANJI REDDY POLU* and RANVEER KUMAR
Solid State Ionics Research Laboratory, Department of Physics
Dr. Hari Singh Gour University, Sagar, Madya Pradesh 470003, India
Received 23 May 2010; Accepted 23 July 2010
Abstract: Ionic conductivity of poly(ethylene glycol) (PEG) - ammonium
chloride (NH4Cl) based polymer electrolytes can be enhanced by
incorporating ceramic filler TiO2 into PEG-NH4Cl matrix. The electrolyte
samples were prepared by solution casting technique. FTIR studies indicates
that the complex formation between the polymer, salt and ceramic filler. The
ionic conductivity was measured using impedance spectroscopy technique. It
was observed that the conductivity of the electrolyte varies with TiO2
concentration and temperature. The highest room temperature conductivity
of the electrolyte of 7.72×10⁻⁶ S cm−1 was obtained at 15% by weight of
TiO2 and that without TiO2 filler was found to be 9.58×10⁻⁷ S cm−1. The
conductivity has been improved by 8 times when the TiO2 filler was
introduced into the PEG–NH4Cl electrolyte system. The conductance
spectra shows two distinct regions: a dc plateau and a dispersive region. The
temperature dependence of the conductivity of the polymer electrolytes
seems to obey the VTF relation. The conductivity values of the polymer
electrolytes were reported and the results were discussed. The imaginary
part of dielectric constant (εi) decreases with increase in frequency in the low
frequency region whereas frequency independent behavior is observed in the
high frequency region.
Keywords: Polymer electrolytes, Impedance spectroscopy, FTIR, Ceramic filler, Conductivity.
Introduction
Polymer electrolytes have been considered as attractive electrolyte material for different
electrochemical applications in the past decade on account of certain distinctive properties
like ease of fabrication, mouldability into any shape and size good electrode-electrolyte
contact, etc1. Interest in solid proton-conducting polymer electrolytes started with the
development of perfluorinated sulfonic membranes in the 1960s2. Since then, a lot of work
has been developed on proton-conducting polymer electrolytes3–6
. One promising candidate

348 A. REDDY POLU et al.
to act as polymer host for proton-conducting polymer electrolyte is PEG7-8
. To enhance the
conductivity, several approaches were suggested in the literature, including the use of blend
polymers, the addition of a ceramic filler, plasticizer and even radiation. Compared to other
methods, the addition of a ceramic filler is the simplest and most effective way to improve
the conductivity of a solid polymer electrolytes (SPEs). The variation of ionic conductivity
with salt fraction is an interesting but difficult challenge for both experimental and
theoretical research. Most studies have been on high molecular weight [e.g., PEO, with mol
wt. ~ 106] polymers complexed with alkali metal salts. Little attention has been paid to the
somewhat low molecular weight polymers. Bearing these facts in mind, we have prepared
poly (ethylene) glycol (PEG) of molecular weight 4000, complexed with NH4Cl salt.
In this work, we report the composite solid polymer electrolytes prepared by the addition
of TiO2 particles to PEG-NH4Cl. The purpose of this work is to emphasis the extraordinary
effect occurring in the PEG-NH4Cl-TiO2 composite polymer electrolytes. Our results
demonstrate that the dispersion of TiO2 particles in the PEG-NH4Cl matrix leads to an increase
in the ionic conductivity of the composite polymer electrolytes without introducing any liquid
phase. These composite polymer electrolytes have been characterized using Fourier transform
infrared spectroscopy (FTIR) and impedance spectroscopic techniques.
Experimental
PEG (average molecular weight 4,000) purchased from CDH, India, was dried at 45 °C for 5 h;
NH4Cl (CDH, India) was dried at 50 °C for 24 h and TiO2 procured from Aldrich, USA of
particle size <5 µm was used after annealing at 100 °C for 10 h. Solid polymer electrolyte
samples were prepared using the solution cast technique. PEG (molecular weight of 4,000)
was used as the polymer.NH4Cl was added accordingly. The solvent used in this work is
distilled water. The mixture was stirred up to 10 h to obtain a homogeneous solution. After
incorporating the required amount of inorganic filler (TiO2 powder) was suspended in the
solution and stirred for about 10 h. The solution was then poured into the glass petri dishes
and evaporated slowly at room temperature under vaccum. The polymer electrolyte samples
were then transferred into a desiccator for further drying before the test.
When the polymer electrolytes have formed they were placed between the blocking
stainless steel electrodes of the conductivity cell with leads connected to a HIOKI 3532-50
LCR meter interfaced to a computer for conductivity measurements. The measurements
were made over a frequency range of 50 Hz to 5 MHz at different temperatures. The
conductivity σ and imaginary part of complex dielectric constant (εi) of the samples were
determined using the standard relations:
σ = d / RA (1)
εi = Z′ / ωC0[Z′2+Z″
2] (2)
Here A is the electrode area, d is the thickness of the sample, R is the bulk resistance
and ω= 2πf. f being the frequency in Hertz. The temperature dependent conductivity studies
were carried out for PEG-NH4Cl-x wt % TiO2 (x= 0, 5, 10, 15, 20) polymer electrolytes.
Conductivity measurements were carried out over the same frequency range for
temperatures ranging from laboratory temperature to 333 K. The conductivity cell with
connecting lead wires were placed in an oven with temperature control facilities.
Infrared spectra profiles were obtained using SHIMADZU-8000 Fourier transform
infrared (FTIR) spectrophotometer in the range 400-4,000 cm-1
in the transmittance mode at
room temperature.

Wavenumber 1/cm
Impedance Spectroscopy and FTIR Studies 349
Results and Discussion
FTIR analysis
FTIR spectroscopy is important for the investigation of polymer structure. Since, it provides
information about the complexation and interactions between the various constituents in the
polymer electrolyte. These interactions can induce changes in the vibrational modes of the
molecules in the polymer electrolyte. The FTIR spectra of PEG, PEG:NH4Cl and
PEG:NH4Cl+ x wt % TiO2 (x=5, 10, 15) are shown in Figure 1.
Figure 1. FTIR spectra of pure (a) PEG and complexes PEG–NH4Cl–X % TiO2; (b) 0%;
(c) 5%; (d) 10%; (e) 15%
The Polyethylene glycol exhibits absorptions those of a primary alcohol. Hence
these absorptions, which comprise stretching and bending vibrations restricted to C-C
stretch, C-O stretch, CH stretch (methylene absorptions) and the C-H bending. The OH
stretching vibration is observed in the region 3378 cm-1
exhibiting hydrogen bonded
nature. The same absorption is not observed in any polymer complexes. This clearly
indicates that the influence of NH4Cl does affect the absorption of the respective
functional groups. The methylene group found in PEG has been found to vibrate in the
stretching mode around 2803 cm-1
. The absorption around 1474 cm-1
is due to binding
vibration of –CH2. As in the case of primary alcohol, the C-O stretching vibration, a
strong band around 1362 cm-1
and 1287 cm-1
is also observed. A similar vibration is
exhibited by pure PEG and PEG: NH4Cl complexes. A sharp - strong band at 966 cm-1
and 849 cm-1
is due to the C-C stretching.
The group frequencies at 3,268, 2,095, 1,790, 1,044 and 835 cm–1
of PEG are found absent
in all the complexes and some new peaks at 2,592, 2,425, 2,357, 1,973, 812 and 636 cm–1
are
found present. The above analysis establishes the formation of the polymer–salt–filler complex.
Impedance analysis
Figure 2 represents the complex impedance spectrum/ Nyquist plot (Z″ vs. Z′) of composite
polymer electrolytes of PEG-NH4Cl + x wt % of TiO2 for various ceramic filler
concentrations (x) at room temperature.

Z i
mag
inaa
ry,
oh
m
Z real, ohm
350 A. REDDY POLU et al.
0 50000 100000 150000 200000
0
50000
100000
150000
200000
0.00E+00
4.00E+04
8.00E+04
1.20E+05
1.60E+05
0.00E+00 4.00E+04 8.00E+04 1.20E+05 1.60E+05Z real (ohm)
Z i
ma
gin
ary
(o
hm
)
0% TiO2
5% TiO2
10% TiO2
15% TiO2
20% TiO2
Figur 2. Variation of imaginary (Z″) with real (Z′) part of impedance of PEG–NH4Cl + x wt
% of TiO2 with different concentrations (x) of TiO2 at room temperature (30 °C)
The typical Nyquist plot of the samples comprises of a broadened semicircle in the high
frequency region followed by a tail (spike) in the lower frequency region (in some plots).
The higher frequency semicircle can be ascribed mainly to the bulk properties of the
materials, where as the low frequency spike indicates the presence of double layer
capacitance at the electrode/sample interface9. The intercept of the semicircle with the real
axis (Z′) at low frequency (end) give rise to the bulk (ionic) resistance (Rb) of the materials.
By knowing the value of bulk resistance along with the dimensions of the sample, the ionic
conductivity has been calculated and has been given in Table 1.
Table 1. Ac conductivity values of PEG–NH4Cl + x wt % of TiO2 (x= 0, 5, 10, 15, 20) at 303K
Sample Conductivity σb at 303K, S/cm
85-15-00 9.58E-07
85-15-05 1.50E-06
85-15-10 3.59E-06
85-15-15 7.72E-06
85-15-20 4.27E-06
Temperature dependent ionic conductivity
The temperature dependence of electrical conductivity of the polymer samples is shown in
Figure 3. The non- linearity in the plot indicates that the ion transport in polymer electrolytes
is dependent on polymer segmental motion10
.
Thus the result may be more effectively represented by the Vogel-Tamman- Fulcher
(VTF) equation
σ = AT-1/2
exp [-Ea/K(T0-Tg)] (3)
Where A-fitting constant proportional to the number of charge carriers. Ea-pseudo activation
energy, K-Boltzmann constant and T0-equilibrium temperature of the system corresponding to
zero configuration entropy. Tg-the thermodynamic glass transition temperature of the system.
Figure 4 shows the variation of conductivity with TiO2 concentration for different
temperatures. The enhancement in the ionic conductivity with the increasing concentration of
TiO2 may be due to TiO2 which interacts with either of both the anion and cation thereby
reducing ion pairing and increases the free charge carriers. The same type of behaviour has been

1000/T, k-1
Lo
g σ
, S
/cm
TiO2 concentration in wt %
log
σ,
/cm
log
σ,
/cm
Impedance Spectroscopy and FTIR Studies 351
reported in Al2O3 dispersed PEO-LiTFSI based polymer composites11
. A further increment in
TiO2 concentrations results in a decrease in conductivity which may be due to the restricted
ionic and polymer segmental mobility in a rigid matrix at room temperature. As the temperature
increases the charge carries are thermally activated and the free volume increases and more
vacant sites are created for the motion of ions, which in turn enhances the conductivity.
3.00 3.05 3.10 3.15 3.20 3.25 3.30
-6.0
-5.8
-5.6
-5.4
-5.2
-5.0
-4.8
0% TiO
2
5% TiO2
10% TiO2
15% TiO2
20% TiO2
Figure 3. Temperature dependent ionic conductivity for all samples
AC Conductivity analysis
The variation of the ac conductivity with frequency for different TiO2 concentration with
polymer electrolytes at 303K is shown in Figure 5. The frequency dependent ac conductivity
of the polymer electrolyte is described by almond and west formalism12
,
σ(ω) = σdc + Aωn
(4)
Where A and n are material parameters, 0<n<l, σdc is dc ionic conductivity and ω is the
angular frequency. The plot shows two regions: The first one is the low frequency dispersion
region observed which can be ascribed to the space charge polarization at the blocking
electrodes. The second region corresponds to the frequency independent plateau region.
0 5 10 15 20
-6.0
-5.8
-5.6
-5.4
-5.2
-5.0
-4.8
303 K
308 K
313 K
318 K
323 K
328 K
333 K
1 2 3 4 5 6 7
-6.0
-5.5
-5.0
-4.5
-4.0
-3.5
-3.0
0% TiO2
5% TiO2
10% TiO2
15% TiO2
20% TiO2
Figure 4. Dependence of ionic conductivity
on filler concentration for PEG-NH4Cl
polymer complex at different temperatures
Figure 5. Variation of conductivity with
frequency for all the samples at 303K
log f, Hz
log
σ
, S
/cm
log
σ
, S
/cm
logf, Hz
ε im
agin
aary
352 A. REDDY POLU et al
The conductivity is found almost frequency independent in this region and the extrapolation
of the plot to y-axis gives the value of dc conductivity for all samples. From the plot it is observed
that the dc conductivity increases from 9.36 x 10⁻⁷ S/cm to 7.42 x 10
-6 S/cm with increase of TiO2
concentration up to 15 wt % and after which the conductivity decreases which is in good
agreement with the impedance analysis. The possible decrease in the ionic conductivity at 20 wt
% TiO2 can be attributed to the restricted motion of ions in the rigid polymer matrix.
Dielectric studies
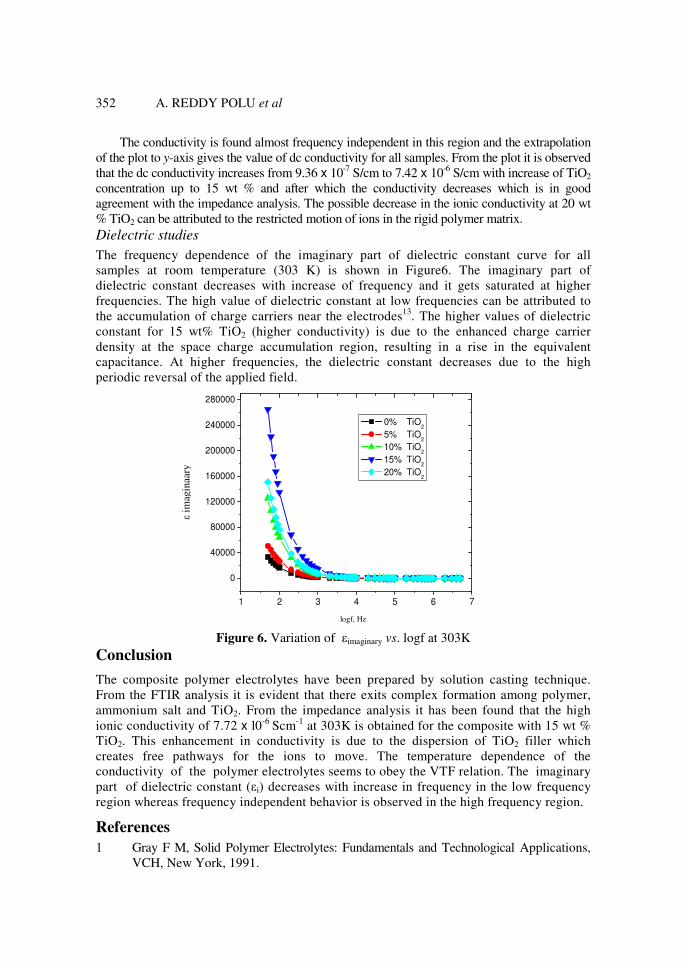
The frequency dependence of the imaginary part of dielectric constant curve for all
samples at room temperature (303 K) is shown in Figure6. The imaginary part of
dielectric constant decreases with increase of frequency and it gets saturated at higher
frequencies. The high value of dielectric constant at low frequencies can be attributed to
the accumulation of charge carriers near the electrodes13
. The higher values of dielectric
constant for 15 wt% TiO2 (higher conductivity) is due to the enhanced charge carrier
density at the space charge accumulation region, resulting in a rise in the equivalent
capacitance. At higher frequencies, the dielectric constant decreases due to the high
periodic reversal of the applied field.
1 2 3 4 5 6 7
0
40000
80000
120000
160000
200000
240000
280000
0% TiO2
5% TiO2
10% TiO2
15% TiO2
20% TiO2
Figure 6. Variation of εimaginary vs. logf at 303K
Conclusion
The composite polymer electrolytes have been prepared by solution casting technique.
From the FTIR analysis it is evident that there exits complex formation among polymer,
ammonium salt and TiO2. From the impedance analysis it has been found that the high
ionic conductivity of 7.72 x l0-6
Scm-1
at 303K is obtained for the composite with 15 wt %
TiO2. This enhancement in conductivity is due to the dispersion of TiO2 filler which
creates free pathways for the ions to move. The temperature dependence of the
conductivity of the polymer electrolytes seems to obey the VTF relation. The imaginary
part of dielectric constant (εi) decreases with increase in frequency in the low frequency
region whereas frequency independent behavior is observed in the high frequency region.
References
1 Gray F M, Solid Polymer Electrolytes: Fundamentals and Technological Applications,
VCH, New York, 1991.

Impedance Spectroscopy and FTIR Studies 353
2 Bozkurt A and Meyer W H, Solid State Ionics, 2001, 138, 259-265.
3 Stevens J R, Wieczorek W, Raducha D and Jeffrey K K, Solid State Ionics, 1997,
97(1-4), 347-358.
4 Asensio J A, Borros S and Gomez-Romero P, J Membr Sci., 2004, 241(1), 89-93.
5 Qu X, Wirse’n A and Albertsson A C, Polymer, 2000, 41, 4841-4847.
6 Khalid M N, Agnely F, Yagoubi N, Grossiord J L and Couarraze G, Eur J Pharm.,
Sci., 2002, 15(5), 425-432.
7 Nader Binesh and Bhat S V, Solid State Ionics, 1999, 122(1-4), 291-299.
8 Nader Binesh and Bhat S V, Solid State Ionics, 1996, 92, 261.
9 Macdonald J R, Impedance spectroscopy, Emphasizing Solid Materials and Systems.
Wiley, New York 1987.
10 Okamoto Y, Yeh T F, Lee H. S and Skotheimk T A, J Polym Sci A: Poly Chem.,
1993, 31, 2573.
11 Jayathilaka P A R D, Dissanayake M A K L, Albinsson I and Mellander B E,
Electrochimica Acta., 2002, 47(20), 3257-3568.
12 Almond D P and West A R, Solid State Ionics, 1987, 23, 27.
13 Armstrong R D, Dickinson T D and Willis P M, Electroanal Chem Interfacial
Electrochem., 1974, 53, 389.

Submit your manuscripts athttp://www.hindawi.com
Hindawi Publishing Corporationhttp://www.hindawi.com Volume 2014
Inorganic ChemistryInternational Journal of
Hindawi Publishing Corporation http://www.hindawi.com Volume 2014
International Journal ofPhotoenergy
Hindawi Publishing Corporationhttp://www.hindawi.com Volume 2014
Carbohydrate Chemistry
International Journal of
Hindawi Publishing Corporationhttp://www.hindawi.com Volume 2014
Journal of
Chemistry
Hindawi Publishing Corporationhttp://www.hindawi.com Volume 2014
Advances in
Physical Chemistry
Hindawi Publishing Corporationhttp://www.hindawi.com
Analytical Methods in Chemistry
Journal of
Volume 2014
Bioinorganic Chemistry and ApplicationsHindawi Publishing Corporationhttp://www.hindawi.com Volume 2014
SpectroscopyInternational Journal of
Hindawi Publishing Corporationhttp://www.hindawi.com Volume 2014
The Scientific World JournalHindawi Publishing Corporation http://www.hindawi.com Volume 2014
Medicinal ChemistryInternational Journal of
Hindawi Publishing Corporationhttp://www.hindawi.com Volume 2014
Chromatography Research International
Hindawi Publishing Corporationhttp://www.hindawi.com Volume 2014
Applied ChemistryJournal of
Hindawi Publishing Corporationhttp://www.hindawi.com Volume 2014
Hindawi Publishing Corporationhttp://www.hindawi.com Volume 2014
Theoretical ChemistryJournal of
Hindawi Publishing Corporationhttp://www.hindawi.com Volume 2014
Journal of
Spectroscopy
Analytical ChemistryInternational Journal of
Hindawi Publishing Corporationhttp://www.hindawi.com Volume 2014
Journal of
Hindawi Publishing Corporationhttp://www.hindawi.com Volume 2014
Quantum Chemistry
Hindawi Publishing Corporationhttp://www.hindawi.com Volume 2014
Organic Chemistry International
Hindawi Publishing Corporationhttp://www.hindawi.com Volume 2014
CatalystsJournal of
ElectrochemistryInternational Journal of
Hindawi Publishing Corporation http://www.hindawi.com Volume 2014