Embed Size (px)
Citation preview
Optics 2015; 4(3-1): 9-13
Published online July 6, 2015 (http://www.sciencepublishinggroup.com/j/optics)
doi: 10.11648/j.optics.s.2015040301.13
ISSN: 2328-7780 (Print); ISSN: 2328-7810 (Online)
Full-Field Displacement Measurement Technique by Using Repeated Patterns and JPEG Compressed Images
Shien Ri1, *
, Satoshi Hayashi1, 2
, Hiroshi Tsuda1, Shinji Ogihara
2
1Research Institute of Instrumentation Frontier, National Institute of Advanced Industrial Science and Technology, Tsukuba, Japan 2Department of Mechanical Engineering, Tokyo University of Science, Chiba, Japan
Email address: [email protected] (S. Ri)
To cite this article: Shien Ri, Satoshi Hayashi, Hiroshi Tsuda, Shinji Ogihara. Full-Field Displacement Measurement Technique by Using Repeated Patterns and
JPEG Compressed Images. Optics. Special Issue: Optical Techniques for Deformation, Structure and Shape Evaluation.
Vol. 4, No. 3-1, 2015, pp. 9-13. doi: 10.11648/j.optics.s.2015040301.13
Abstract: This paper presents an experimental technique for measuring displacement distribution from an image of repeated
patterns and JPEG compressed images. The measurement accuracy of the developed method is insusceptible to the degree of
JPEG compression because only lower spatial frequency components of the repeated pattern are used to calculate the
displacement distribution, and high spatial frequency components have high priority to cut-off according to the JPEG
compression algorithm. The insensitivity to the JPEG compression was confirmed by a displacement measurement using JPEG
images of various compression ratios or image qualities. We found that by using the highest quality JPEG image, the accuracy of
displacement measurement could research 1/1000 of the repeated pattern pitch, as same the uncompressed BMP images. In
addition, displacement with accuracy of 1/500 pitch could be measured from a compressed JPEG image of which the file size was
1/50 of that of the BMP image. This technique is useful for measurement using a high-speed camera with high-resolution digital
images for a long-term or wireless image transfer.
Keywords: Deformation Measurement, Sampling Moiré Method, Repeated Pattern, Compressed image, Phase Analysis
1. Introduction
Displacement distribution gives useful information to
understand the deformation behavior in materials science and
to ensure health monitoring of infrastructures such as bridges
and buildings. Both mechanical contact displacement sensor
and noncontact laser Doppler vibrometer (LDV) [1] have
widely used in displacement measurement. These
instruments, however, are basically point measurement
systems and are quite costly for distribution analysis.
Compared with point measurement method, image-based
measurement using a digital camera attracts a lot of attention
because its simple setup, low cost, high accuracy and
full-field measurement [2, 3]. The image-based methods can
be classified in terms of the patterns of the target marker.
Digital image correlation (DIC) [4-6], as well known, uses
random patterns in a subset region to determine the
displacement distribution by using the images before and
after deformations. On the other hand, various moiré methods
[7-9] use regular and periodical patterns as the marker to
measure displacement, strain and residual stress.
We recently developed a fast, simple, and accurate
small-displacement distribution measurement technique [10]
using arbitrary repeated patterns based on the sampling moiré
method [11]. By analyzing digital images of a regular
repeated patterns with known pitch on the materials or
structures, we can obtain in-plane displacement distribution
across the target [12, 13]. To improve the measurement
accuracy for arbitrary repeated patterns, in this method, we
use not only the first frequency component, but also use the
multiple low frequency components of the moiré fringes.
To perform accurate displacement distribution
measurement, generally, RAW or bitmap (BMP) images of
lossless compression are used in most image-based
measurement methods. Recent digital cameras feature high
resolution and fast recording. For example, using the Nikon
digital single-lens reflex (DSLR) camera D800/D800E, we
can capture a high-resolution image with 7360 by 4912
pixels in speed of 4 frames per second. This means if the
image format is chose as RAW (lossless compression; 14-bit
record), the size of each image is 41.3 MB. In case that we
capture continually for 10 seconds, the image size is bigger
than 1 GB. On the other hand, if the image format is chosen
10 Shien Ri et al.: Full-Field Displacement Measurement Technique by Using Repeated Patterns and JPEG Compressed Images
as the JPEG (basic quality) compressed format, the image
size can be reduced to 4 MB, i.e., 10 times smaller compared
with the RAW image. By the way, image compression is
achieved by removing the high spatial frequency components
in the JPEG algorithm [14]. Therefore, we consider that our
developed image-based method is insusceptible to the
influence of JPEG compression because only low spatial
frequency components are used.
In this study, an experimental technique for measuring
displacement distribution is proposed, by using a
combination of repeated patterns and JPEG compressed
images. The effectiveness is confirmed by a displacement
measurement experiment by using JPEG images for various
qualities. This technique could be useful for measurement
using a high-speed camera with high-resolution digital
images for a long-term experiment to analyze a great number
of images.
2. Principle
2.1. Displacement Measurement Using Repeated Patterns
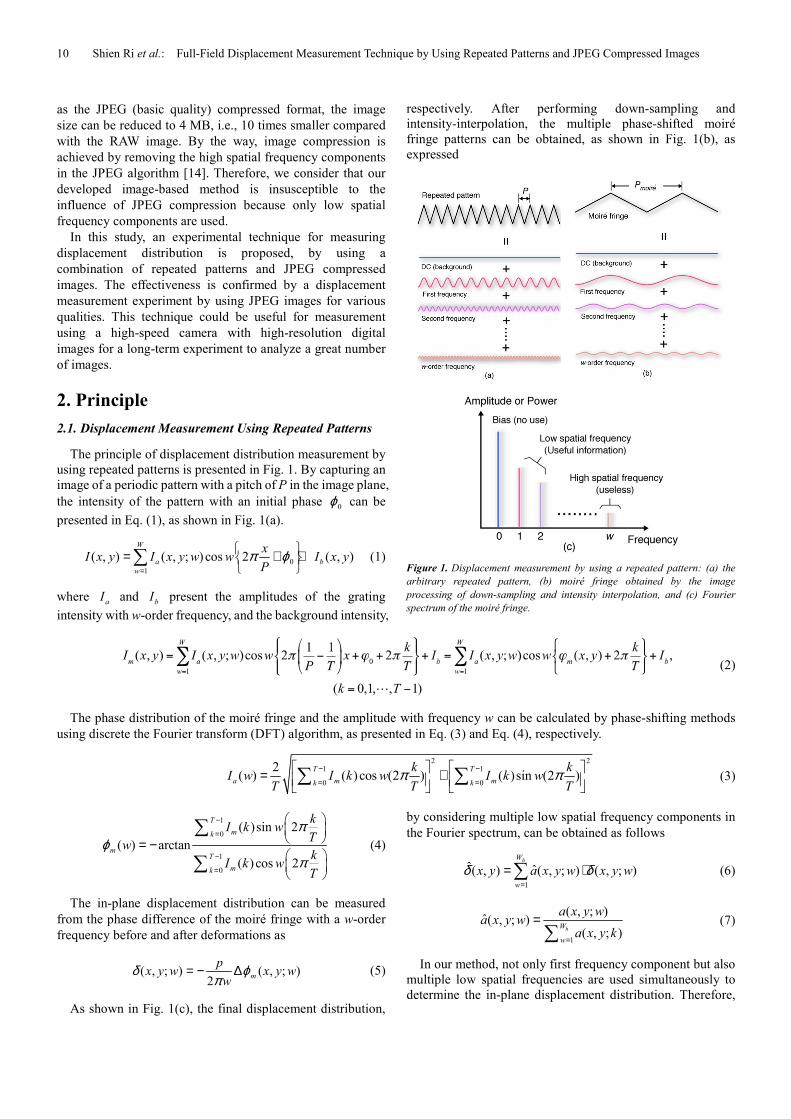
The principle of displacement distribution measurement by
using repeated patterns is presented in Fig. 1. By capturing an
image of a periodic pattern with a pitch of P in the image plane,
the intensity of the pattern with an initial phase 0
ϕ can be
presented in Eq. (1), as shown in Fig. 1(a).
0
1
( , ) ( , ; ) cos 2 ( , )W
a b
w
xI x y I x y w w I x y
Pπ ϕ
=
= + +
∑ (1)
where a
I and b
I present the amplitudes of the grating
intensity with w-order frequency, and the background intensity,
respectively. After performing down-sampling and
intensity-interpolation, the multiple phase-shifted moiré
fringe patterns can be obtained, as shown in Fig. 1(b), as
expressed
Figure 1. Displacement measurement by using a repeated pattern: (a) the
arbitrary repeated pattern, (b) moiré fringe obtained by the image
processing of down-sampling and intensity interpolation, and (c) Fourier
spectrum of the moiré fringe.
(2)
The phase distribution of the moiré fringe and the amplitude with frequency w can be calculated by phase-shifting methods
using discrete the Fourier transform (DFT) algorithm, as presented in Eq. (3) and Eq. (4), respectively.
2 21 1
0 0
2( ) ( )cos (2 ) ( )sin (2 )
T T
a m mk k
k kI w I k w I k w
T T Tπ π− −
= =
= + ∑ ∑ (3)
1
0
1
0
( )sin 2
( ) arctan
( ) cos 2
T
mk
mT
mk
kI k w
Tw
kI k w
T
πϕ
π
−
=
−
=
= −
∑
∑ (4)
The in-plane displacement distribution can be measured
from the phase difference of the moiré fringe with a w-order
frequency before and after deformations as
( , ; ) ( , ; )2
m
px y w x y w
wδ ϕ
π= − ∆ (5)
As shown in Fig. 1(c), the final displacement distribution,
by considering multiple low spatial frequency components in
the Fourier spectrum, can be obtained as follows
1
ˆ ˆ( , ) ( , ; ) ( , ; )hW
w
x y a x y w x y wδ δ=
= ⋅∑ (6)
1
( , ; )ˆ( , ; )
( , ; )hW
w
a x y wa x y w
a x y k=
=∑
(7)
In our method, not only first frequency component but also
multiple low spatial frequencies are used simultaneously to
determine the in-plane displacement distribution. Therefore,
Optics 2015; 4(3-1): 9-13 11
this method allows accurate measurement using arbitrary
repeated patterns on the structure surface. In the case of w = 1,
it corresponds to the sampling moiré method [11].
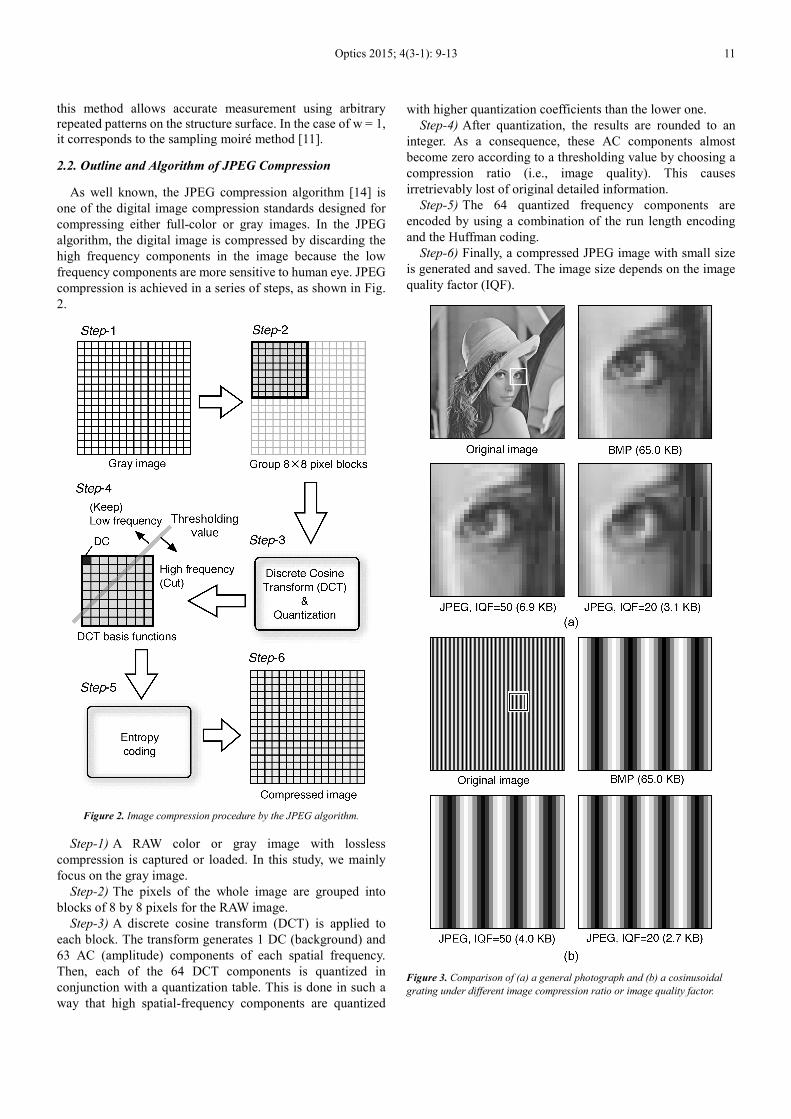
2.2. Outline and Algorithm of JPEG Compression
As well known, the JPEG compression algorithm [14] is
one of the digital image compression standards designed for
compressing either full-color or gray images. In the JPEG
algorithm, the digital image is compressed by discarding the
high frequency components in the image because the low
frequency components are more sensitive to human eye. JPEG
compression is achieved in a series of steps, as shown in Fig.
2.
Figure 2. Image compression procedure by the JPEG algorithm.
Step-1) A RAW color or gray image with lossless
compression is captured or loaded. In this study, we mainly
focus on the gray image.
Step-2) The pixels of the whole image are grouped into
blocks of 8 by 8 pixels for the RAW image.
Step-3) A discrete cosine transform (DCT) is applied to
each block. The transform generates 1 DC (background) and
63 AC (amplitude) components of each spatial frequency.
Then, each of the 64 DCT components is quantized in
conjunction with a quantization table. This is done in such a
way that high spatial-frequency components are quantized
with higher quantization coefficients than the lower one.
Step-4) After quantization, the results are rounded to an
integer. As a consequence, these AC components almost
become zero according to a thresholding value by choosing a
compression ratio (i.e., image quality). This causes
irretrievably lost of original detailed information.
Step-5) The 64 quantized frequency components are
encoded by using a combination of the run length encoding
and the Huffman coding.
Step-6) Finally, a compressed JPEG image with small size
is generated and saved. The image size depends on the image
quality factor (IQF).
Figure 3. Comparison of (a) a general photograph and (b) a cosinusoidal
grating under different image compression ratio or image quality factor.
12 Shien Ri et al.: Full-Field Displacement Measurement Technique by Using Repeated Patterns and JPEG Compressed Images
Figure 3 shows the compression results for a photograph of
“Lena” and a repeated pattern of “cosinusoidal grating” with
256 by 256 pixels by using JPEG compression with different
IQFs. In the JPEG image of “Lena”, the block noise of 8 by 8
pixels becomes conspicuous with the decreasing IQF, as
shown in the enlarged part (the image size is 32 by 32 pixels)
in Fig. 3(a). On the other hand, such a block noise is hardly
observed in the JPEG image of “cosinusoidal grating” with a
low IQF, as shown in Fig. 3(b). The reason is that the
cosinusoidal grating has only low spatial frequency
component and high spatial frequency components have high
priority to cut-off according to the JPEG compression
algorithm.
2.3. Combination of Repeated Patterns and JPEG
Compressed Images
From the results of Fig. 3, we found that our method as
mentioned in Sec. 2.1 can be considered that the measurement
accuracy is insusceptible to JPEG compression. In addition,
the high frequency components due to camera noise can be cut
off in the process of image compression. That is to say the
combination of our displacement measurement method using
repeated patterns and JPEG compressed images acts well for
accurate displacement distribution measurement.
3. Experiment
3.1. Experimental Setup
Here, a simple displacement experiment was performed to
investigate the relationships between displacement accuracy,
the JPEG IQF, and the file size.
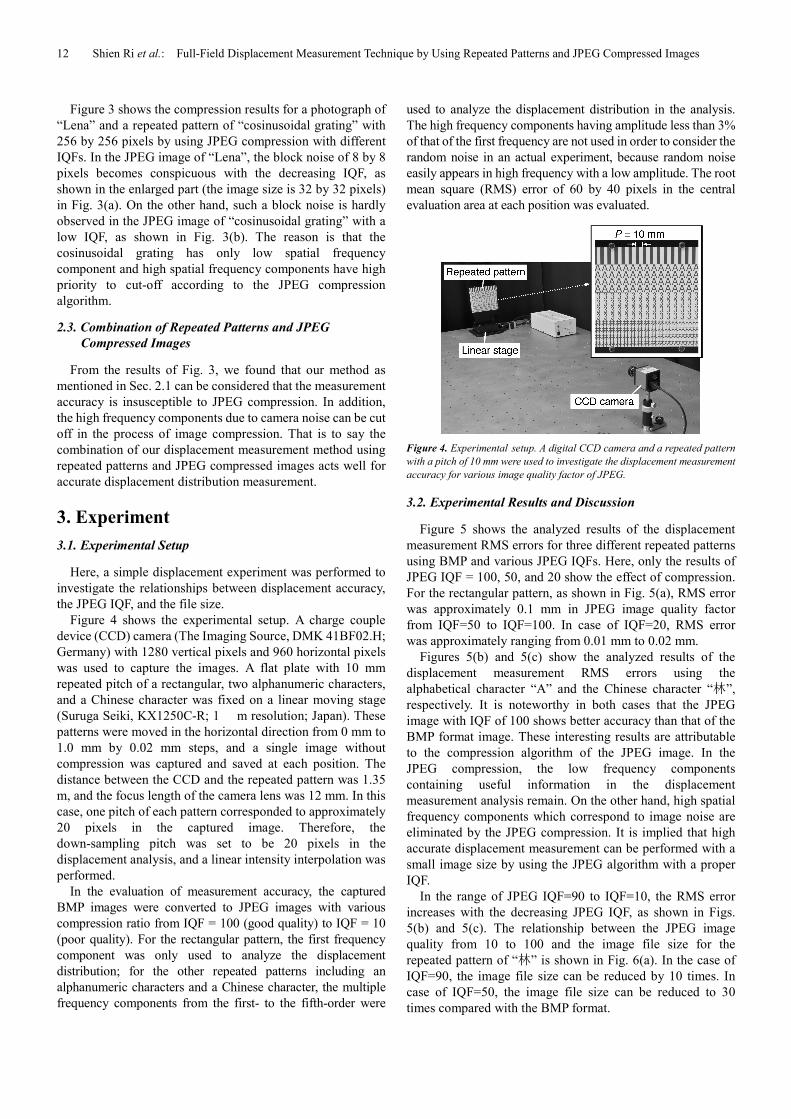
Figure 4 shows the experimental setup. A charge couple
device (CCD) camera (The Imaging Source, DMK 41BF02.H;
Germany) with 1280 vertical pixels and 960 horizontal pixels
was used to capture the images. A flat plate with 10 mm
repeated pitch of a rectangular, two alphanumeric characters,
and a Chinese character was fixed on a linear moving stage
(Suruga Seiki, KX1250C-R; 1 m resolution; Japan) . These
patterns were moved in the horizontal direction from 0 mm to
1.0 mm by 0.02 mm steps, and a single image without
compression was captured and saved at each position. The
distance between the CCD and the repeated pattern was 1.35
m, and the focus length of the camera lens was 12 mm. In this
case, one pitch of each pattern corresponded to approximately
20 pixels in the captured image. Therefore, the
down-sampling pitch was set to be 20 pixels in the
displacement analysis, and a linear intensity interpolation was
performed.
In the evaluation of measurement accuracy, the captured
BMP images were converted to JPEG images with various
compression ratio from IQF = 100 (good quality) to IQF = 10
(poor quality). For the rectangular pattern, the first frequency
component was only used to analyze the displacement
distribution; for the other repeated patterns including an
alphanumeric characters and a Chinese character, the multiple
frequency components from the first- to the fifth-order were
used to analyze the displacement distribution in the analysis.
The high frequency components having amplitude less than 3%
of that of the first frequency are not used in order to consider the
random noise in an actual experiment, because random noise
easily appears in high frequency with a low amplitude. The root
mean square (RMS) error of 60 by 40 pixels in the central
evaluation area at each position was evaluated.
Figure 4. Experimental setup. A digital CCD camera and a repeated pattern
with a pitch of 10 mm were used to investigate the displacement measurement
accuracy for various image quality factor of JPEG.
3.2. Experimental Results and Discussion
Figure 5 shows the analyzed results of the displacement
measurement RMS errors for three different repeated patterns
using BMP and various JPEG IQFs. Here, only the results of
JPEG IQF = 100, 50, and 20 show the effect of compression.
For the rectangular pattern, as shown in Fig. 5(a), RMS error
was approximately 0.1 mm in JPEG image quality factor
from IQF=50 to IQF=100. In case of IQF=20, RMS error
was approximately ranging from 0.01 mm to 0.02 mm.
Figures 5(b) and 5(c) show the analyzed results of the
displacement measurement RMS errors using the
alphabetical character “A” and the Chinese character “林”,
respectively. It is noteworthy in both cases that the JPEG
image with IQF of 100 shows better accuracy than that of the
BMP format image. These interesting results are attributable
to the compression algorithm of the JPEG image. In the
JPEG compression, the low frequency components
containing useful information in the displacement
measurement analysis remain. On the other hand, high spatial
frequency components which correspond to image noise are
eliminated by the JPEG compression. It is implied that high
accurate displacement measurement can be performed with a
small image size by using the JPEG algorithm with a proper
IQF.
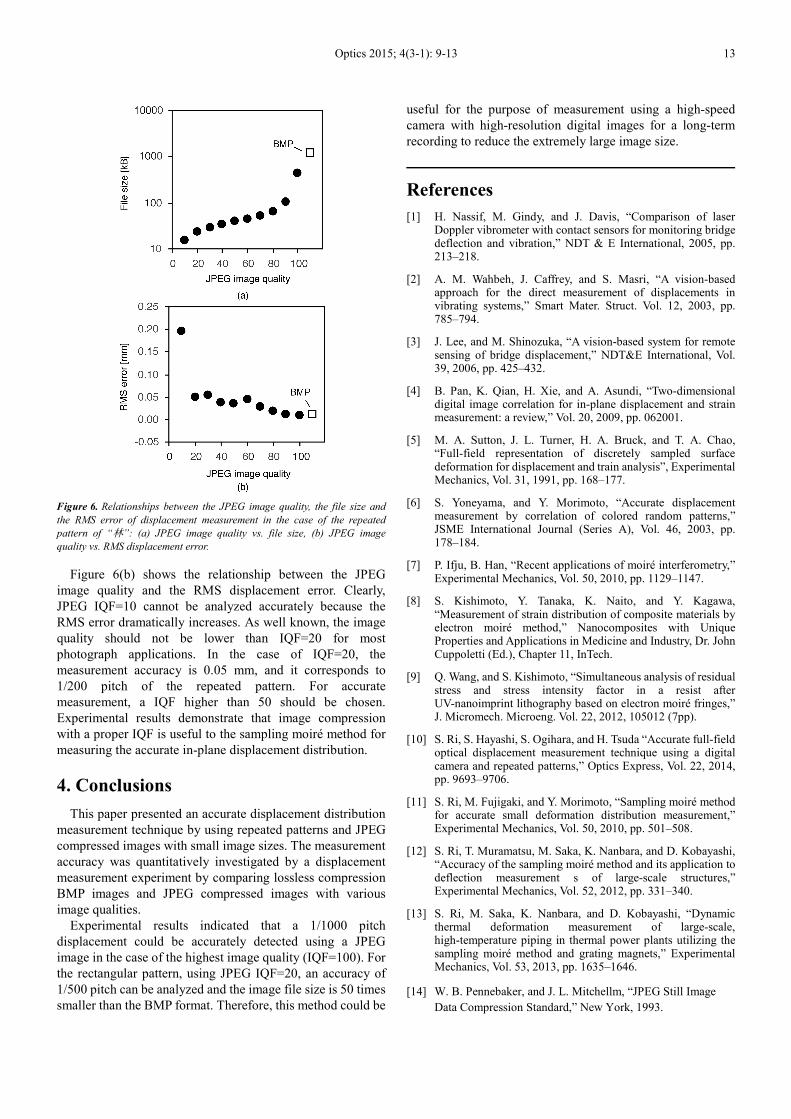
In the range of JPEG IQF=90 to IQF=10, the RMS error
increases with the decreasing JPEG IQF, as shown in Figs.
5(b) and 5(c). The relationship between the JPEG image
quality from 10 to 100 and the image file size for the
repeated pattern of “林” is shown in Fig. 6(a). In the case of
IQF=90, the image file size can be reduced by 10 times. In
case of IQF=50, the image file size can be reduced to 30
times compared with the BMP format.
Optics 2015; 4(3-1): 9-13 13
Figure 6. Relationships between the JPEG image quality, the file size and
the RMS error of displacement measurement in the case of the repeated
pattern of “林”: (a) JPEG image quality vs. file size, (b) JPEG image
quality vs. RMS displacement error.
Figure 6(b) shows the relationship between the JPEG
image quality and the RMS displacement error. Clearly,
JPEG IQF=10 cannot be analyzed accurately because the
RMS error dramatically increases. As well known, the image
quality should not be lower than IQF=20 for most
photograph applications. In the case of IQF=20, the
measurement accuracy is 0.05 mm, and it corresponds to
1/200 pitch of the repeated pattern. For accurate
measurement, a IQF higher than 50 should be chosen.
Experimental results demonstrate that image compression
with a proper IQF is useful to the sampling moiré method for
measuring the accurate in-plane displacement distribution.
4. Conclusions
This paper presented an accurate displacement distribution
measurement technique by using repeated patterns and JPEG
compressed images with small image sizes. The measurement
accuracy was quantitatively investigated by a displacement
measurement experiment by comparing lossless compression
BMP images and JPEG compressed images with various
image qualities.
Experimental results indicated that a 1/1000 pitch
displacement could be accurately detected using a JPEG
image in the case of the highest image quality (IQF=100). For
the rectangular pattern, using JPEG IQF=20, an accuracy of
1/500 pitch can be analyzed and the image file size is 50 times
smaller than the BMP format. Therefore, this method could be
useful for the purpose of measurement using a high-speed
camera with high-resolution digital images for a long-term
recording to reduce the extremely large image size.
References
[1] H. Nassif, M. Gindy, and J. Davis, “Comparison of laser Doppler vibrometer with contact sensors for monitoring bridge deflection and vibration,” NDT & E International, 2005, pp. 213–218.
[2] A. M. Wahbeh, J. Caffrey, and S. Masri, “A vision-based approach for the direct measurement of displacements in vibrating systems,” Smart Mater. Struct. Vol. 12, 2003, pp. 785–794.
[3] J. Lee, and M. Shinozuka, “A vision-based system for remote sensing of bridge displacement,” NDT&E International, Vol. 39, 2006, pp. 425–432.
[4] B. Pan, K. Qian, H. Xie, and A. Asundi, “Two-dimensional digital image correlation for in-plane displacement and strain measurement: a review,” Vol. 20, 2009, pp. 062001.
[5] M. A. Sutton, J. L. Turner, H. A. Bruck, and T. A. Chao, “Full-field representation of discretely sampled surface deformation for displacement and train analysis”, Experimental Mechanics, Vol. 31, 1991, pp. 168–177.
[6] S. Yoneyama, and Y. Morimoto, “Accurate displacement measurement by correlation of colored random patterns,” JSME International Journal (Series A), Vol. 46, 2003, pp. 178–184.
[7] P. Ifju, B. Han, “Recent applications of moiré interferometry,” Experimental Mechanics, Vol. 50, 2010, pp. 1129–1147.
[8] S. Kishimoto, Y. Tanaka, K. Naito, and Y. Kagawa, “Measurement of strain distribution of composite materials by electron moiré method,” Nanocomposites with Unique Properties and Applications in Medicine and Industry, Dr. John Cuppoletti (Ed.), Chapter 11, InTech.
[9] Q. Wang, and S. Kishimoto, “Simultaneous analysis of residual stress and stress intensity factor in a resist after UV-nanoimprint lithography based on electron moiré fringes,” J. Micromech. Microeng. Vol. 22, 2012, 105012 (7pp).
[10] S. Ri, S. Hayashi, S. Ogihara, and H. Tsuda “Accurate full-field optical displacement measurement technique using a digital camera and repeated patterns,” Optics Express, Vol. 22, 2014, pp. 9693–9706.
[11] S. Ri, M. Fujigaki, and Y. Morimoto, “Sampling moiré method for accurate small deformation distribution measurement,” Experimental Mechanics, Vol. 50, 2010, pp. 501–508.
[12] S. Ri, T. Muramatsu, M. Saka, K. Nanbara, and D. Kobayashi, “Accuracy of the sampling moiré method and its application to deflection measurement s of large-scale structures,” Experimental Mechanics, Vol. 52, 2012, pp. 331–340.
[13] S. Ri, M. Saka, K. Nanbara, and D. Kobayashi, “Dynamic thermal deformation measurement of large-scale, high-temperature piping in thermal power plants utilizing the sampling moiré method and grating magnets,” Experimental Mechanics, Vol. 53, 2013, pp. 1635–1646.
[14] W. B. Pennebaker, and J. L. Mitchellm, “JPEG Still Image
Data Compression Standard,” New York, 1993.