Embed Size (px)
Citation preview
Contents lists available at ScienceDirect
Mechanical Systems and Signal Processing
Mechanical Systems and Signal Processing 42 (2014) 404–414
0888-32http://d
n CorrE-m
journal homepage: www.elsevier.com/locate/ymssp
Full-life dynamic identification of wear state based on on-linewear debris image features
Tonghai Wu n, Yeping Peng, Hongkun Wu, Xiaogang Zhang, Junqun WangKey Laboratory of Education Ministry for Modern Design and Rotor-Bearing System, Xi'an Jiaotong University, Xi'an 710049, China
a r t i c l e i n f o
Article history:Received 30 December 2012Received in revised form4 July 2013Accepted 31 August 2013Available online 19 September 2013
Keywords:Wear stateMachine condition monitoringDynamic identification
70/$ - see front matter & 2013 Elsevier Ltd.x.doi.org/10.1016/j.ymssp.2013.08.032
esponding author. Tel.: þ86 29 82669161.ail address: [email protected] (T. Wu).
a b s t r a c t
Wear state identification is a bottleneck for the monitoring of engine's condition due to itscomplex characteristics as system-dependent, time-dependent and physical coupling.Correspondingly, full-life dynamic identification of the wear state of an engine in servicewas investigated for real-time performance evaluation. As wear information carrier,images of wear debris carried by the cycling lubricant were sampled by an OLVF(On-line Visual Ferrograph) sensor. Two characteristic indexes including IPCA (Index ofParticle Coverage Area) and EDLWD (Equivalent Diameter of Large Wear Debris) extractedfrom the on-line wear images, were adopted to characterize the wear state quantitatively byrepresenting wear rate and mechanisms, respectively. A dynamic feature-matching modelfor real-time identification was studied comprehensively by referring to the stage featuresof wear state variation. Furthermore, a one-class model was built using the SVDD (SupportVector Data Description) method for categorizing statistical samples. By integrating thefeature-matching and de-noising methods, a good identification was achieved with thosesamples. On this basis, a stage-based model for real-time wear state monitoring was builtand verified with time-sequence monitoring samples from an engine bench test. Themethod shows potential as a promising on-line wear state evaluation tool, especially forfull-life monitoring.
& 2013 Elsevier Ltd. All rights reserved.
1. Introduction
Wear is one of the most important indicators of engine's performance. It affects not only the wear behavior but also thedynamic and thermodynamic performance. State monitoring is effective method to acquire the changing performance of arunning machine. With the development of condition-based maintenances, real-time monitoring becomes the focus ofengine's state monitoring [1]. However, wear state monitoring and identification is becoming a bottleneck in real-timemonitoring due to the complex characteristics of tribological systems, such as system-dependent, time-dependent andphysical coupling [2]. Therefore, the study of real-time wear state monitoring and analysis is critical to engine's full-lifeperformance maintenance.
Although wear mechanisms have been comprehensively studied with various specific tribo-pairs, researchers stillencountered many difficulties in understanding the wear state of a machine in service [3]. In the following sections, we willdiscuss the progress of wear monitoring technology focusing on two main aspects: monitoring methods and analysismethodologies. For monitoring methods, people have tried to obtain the real-time wear state by means of many indirect
All rights reserved.
T. Wu et al. / Mechanical Systems and Signal Processing 42 (2014) 404–414 405
measurements such as vibration, temperature and performance parameter monitoring. Eventually, only the information offailure was obtained, while the initiation and propagation of the fault were absent [4]. In essence, wear is a processcharacterized with systematic effects and multi-field couples, thus indirect monitoring seems difficult to provide profoundinformation about the mechanisms. Oil analysis, a direct analysis means of wear mechanisms, has been adopted in manyengineering applications for wear and lubricant monitoring [5]. When applied to the real-time monitoring of an engine'sperformance, traditional oil analysis encounters two problems: one is the lack of on-line monitoring means, which retardsobtaining the real-time information, and the other is the shortage of knowledge about full-life variations, which preventsreliable fault identification and maintenance decision making. In analysis methodologies, as analytical models are generallydifficult to build for most engineering problems, most of the literatures focused on identification models based onmonitoring data, namely data models [1]. Some were confined to condition data, others included event data. Event data canbe used to assess current condition indicators and their performance, but needs the involvement of human. Some time-sequence data models, like the ARMA model by Jihong Yan [6] and the discrete Markov process by D. Banjevic [7], focusedon trend predication and abnormality warning [8]. However, for data models, the accuracy of predication is the mainproblem for monitoring. Self-learning data models, like the artificial neural network model [9], have higher identificationaccuracy with self-adjusting property. However, the accuracy of an artificial neural network model is determined by notonly suitable variables and initiations but also large number of both normal and abnormal samples [10]. Generally, datamodels can reflect the regularities among the mass of data, but not physical mechanisms, e.g. wear mechanisms.
Accordingly, comprehensive understanding of wear state monitoring and identification should include the followingaspects:
(1)
Wear states are fully determined by micro-scale wear mechanisms and macro-scale wear quantity. Therefore, datamodels, without physical mechanism involvements, have congenital deficiencies for characterizing wear state.(2)
Wear state is highly dependent on machines with different tribo-components and working conditions, thus isincomparable for different machines. Therefore, each machine needs a particular prediction model.(3)
Wear is affected by many factors including material properties, lubricants and even conditions, thus wear properties arerandom over a short period. On the other hand, wear is also a process of structure damage and material loss, thus wearproperties are regular over a long term. Therefore, both dynamic and statistical methods should be taken intoconsideration for modeling.In this paper, a new wear state characterization modeling method was investigated with on-line wear debris images.The characteristics of the wear debris images were adopted for characterizing wear rate and wear mechanism. For full-lifemonitoring, an automatic identification model was investigated with two categories: normal and abnormal. Finally, themethod was examined with real-time image data sampled from an engine bench test.
2. Wear state characterization based on features extracted from on-line wear debris image
Wear state characterization is the premise of wear analysis. Furthermore, wear monitoring is the base of wear statecharacterization. As described above, direct monitoring is necessary to understand wear state more in depth. Wear debris isthe by-product of wear process, thus the images of wear debris contain profound information of not only wear quantity butalso wear mechanisms. Besides, on-line monitoring is necessary for real-time analysis. Correspondingly, an on-line visualferrograph (OLVF) [11], providing real-time wear debris images, was adopted to monitor the lubricant in a running engine.
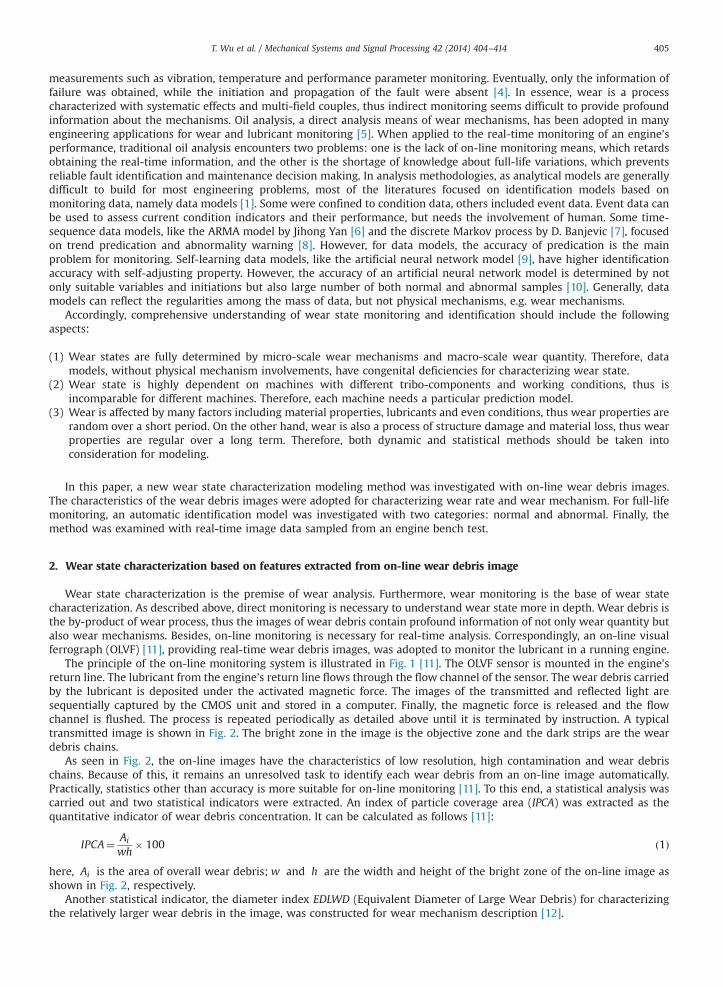
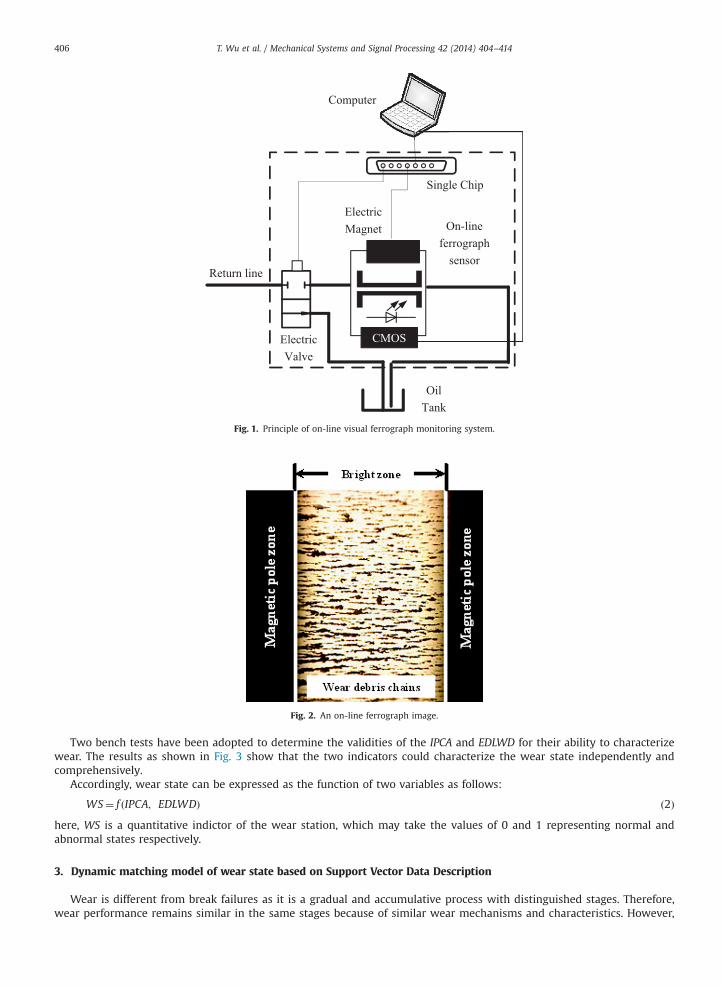
The principle of the on-line monitoring system is illustrated in Fig. 1 [11]. The OLVF sensor is mounted in the engine'sreturn line. The lubricant from the engine's return line flows through the flow channel of the sensor. The wear debris carriedby the lubricant is deposited under the activated magnetic force. The images of the transmitted and reflected light aresequentially captured by the CMOS unit and stored in a computer. Finally, the magnetic force is released and the flowchannel is flushed. The process is repeated periodically as detailed above until it is terminated by instruction. A typicaltransmitted image is shown in Fig. 2. The bright zone in the image is the objective zone and the dark strips are the weardebris chains.
As seen in Fig. 2, the on-line images have the characteristics of low resolution, high contamination and wear debrischains. Because of this, it remains an unresolved task to identify each wear debris from an on-line image automatically.Practically, statistics other than accuracy is more suitable for on-line monitoring [11]. To this end, a statistical analysis wascarried out and two statistical indicators were extracted. An index of particle coverage area (IPCA) was extracted as thequantitative indicator of wear debris concentration. It can be calculated as follows [11]:
IPCA¼ Ai
wh� 100 ð1Þ
here, Ai is the area of overall wear debris; w and h are the width and height of the bright zone of the on-line image asshown in Fig. 2, respectively.
Another statistical indicator, the diameter index EDLWD (Equivalent Diameter of Large Wear Debris) for characterizingthe relatively larger wear debris in the image, was constructed for wear mechanism description [12].
CMOSElectricValve
On-lineferrographsensor
OilTank
Return line
Single Chip
Computer
ElectricMagnet
Fig. 1. Principle of on-line visual ferrograph monitoring system.
Fig. 2. An on-line ferrograph image.
T. Wu et al. / Mechanical Systems and Signal Processing 42 (2014) 404–414406
Two bench tests have been adopted to determine the validities of the IPCA and EDLWD for their ability to characterizewear. The results as shown in Fig. 3 show that the two indicators could characterize the wear state independently andcomprehensively.
Accordingly, wear state can be expressed as the function of two variables as follows:
WS¼ f IPCA; EDLWDð Þ ð2Þhere, WS is a quantitative indictor of the wear station, which may take the values of 0 and 1 representing normal andabnormal states respectively.
3. Dynamic matching model of wear state based on Support Vector Data Description
Wear is different from break failures as it is a gradual and accumulative process with distinguished stages. Therefore,wear performance remains similar in the same stages because of similar wear mechanisms and characteristics. However,

Fig. 3. Variations of IPCA and EDLWD in monitoring two bench tests (a) The Eaton engine bench test; (b) The gear reducer of the mine scraper conveyorbench test.
Fig. 4. Schematic diagram of the hyper-sphere of SVDD.
T. Wu et al. / Mechanical Systems and Signal Processing 42 (2014) 404–414 407
there is no definite boundary between every two stages. Accordingly, dynamic matching based on wear characteristics,other than turning point, is suitable for stage identification. In this section, a dynamic matching model for wearcharacterization was studied with a modeling method, Support Vector Data Description (SVDD).
3.1. Principle of state identification of SVDD
Support Vector Data Description is a one class classification method, which is suitable for the non-linear problem withsmall samples [13]. The mathematical principle of SVDD is a constrained optimization category problem for samples.By alternating the inner product with kernel function, the high-dimensional inner product space can be mapped to anotherlow-dimensional space, so-called hyper-sphere space, which increases the divisibility for ambiguity problems.
The principle can be sketchy described as follows [14,15]. Assume a set of samples is subjected to category, as shown inFig. 4; the aim is to include all interested samples into a closed hyper-sphere with the minimum volume. If all samples areincluded, the experience error satisfies the equation:
εðR; aÞ ¼ R2 ð3Þtherefore, the constraint for minimum ε is defined as:
jjxi�ajjrR2 ð4ÞHere, xi is the i-th sample, a and R are the center and the radius of hyper-sphere, respectively.Lagrangian functional was established as follows. By solving the extreme conditions, the minimum radius R of the hyper-
sphere can be obtained.
LðR; aÞ ¼ R2� ∑N
i ¼ 1αiðR2�‖a�xi‖2Þ ð5Þ
In practice, due to the randomness of samples, the volume of the hyper-sphere may become extremely large to involvesome dispersed samples far away from the center. To improve the robustness of the model, the toleration for excluding someinterested samples is accepted by relaxing the constraints. The minimum problem can be transformed into:
min R2þC∑iξi
" #ð6Þ
jjxi�ajjrR2þξi ; ξiZ0 ; 8 i ð7Þ
T. Wu et al. / Mechanical Systems and Signal Processing 42 (2014) 404–414408
here, ξi is slack variable for relaxing the constraints and C is the balance between the volume of the hyper-sphere and thenumber of the non interested samples.
The lower value of variable C means more relaxed restrictions allowing the training samples falling outside the hyper-sphere. Accordingly, a non-strict experience value was assigned as 0.05 in this work.
Support Vector Data Description has different formats in different identifications. In static identification of cluster data,the center of the sphere is fixed and only the radius varies for different samples. In dynamic identification of time sequencedata, the center and radius both vary but are non-synchronized. Generally, dynamic identification is integrated with staticidentification. Specifically, time sequence data can be divided into many time stages and the center is fixed for each stage forstatic identification. Thus the radius will vary to identify samples. When the non-interested samples constantly increasing,the center is transferring into a new stage and a readjustment is started for the value of R. Therefore, SVDD can be appliedinto the dynamic identification of stage-variation sequences.
3.2. Stage similarities of the characteristics of wear state
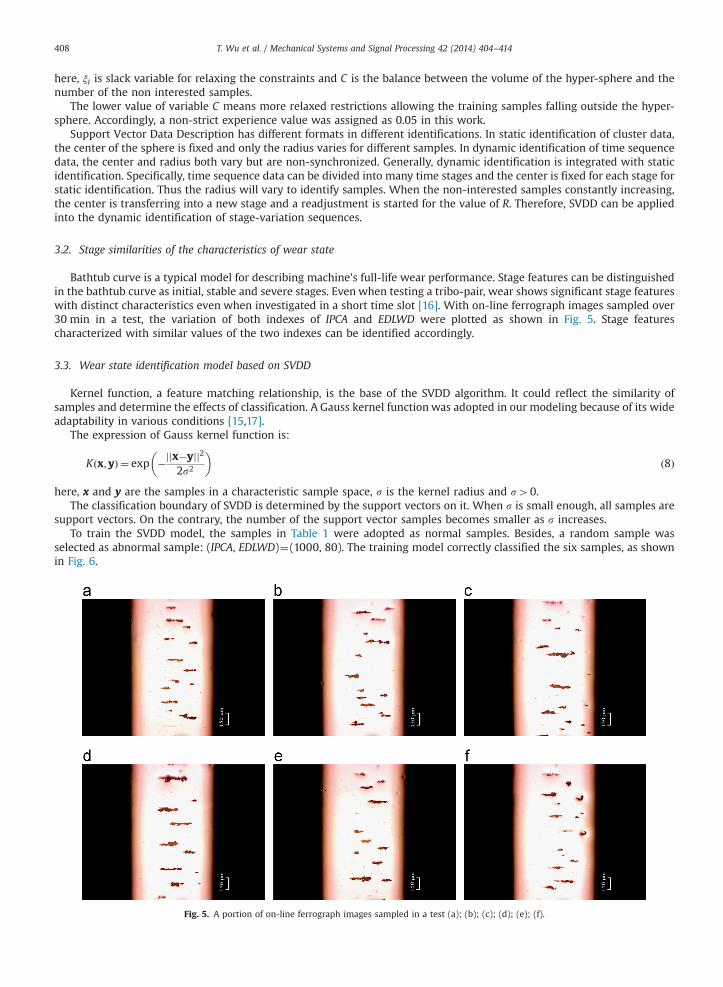
Bathtub curve is a typical model for describing machine's full-life wear performance. Stage features can be distinguishedin the bathtub curve as initial, stable and severe stages. Even when testing a tribo-pair, wear shows significant stage featureswith distinct characteristics even when investigated in a short time slot [16]. With on-line ferrograph images sampled over30 min in a test, the variation of both indexes of IPCA and EDLWD were plotted as shown in Fig. 5. Stage featurescharacterized with similar values of the two indexes can be identified accordingly.
3.3. Wear state identification model based on SVDD
Kernel function, a feature matching relationship, is the base of the SVDD algorithm. It could reflect the similarity ofsamples and determine the effects of classification. A Gauss kernel functionwas adopted in our modeling because of its wideadaptability in various conditions [15,17].
The expression of Gauss kernel function is:
Kðx; yÞ ¼ exp �jjx�yjj22s2
� �ð8Þ
here, x and y are the samples in a characteristic sample space, s is the kernel radius and s40.The classification boundary of SVDD is determined by the support vectors on it. When s is small enough, all samples are
support vectors. On the contrary, the number of the support vector samples becomes smaller as s increases.To train the SVDD model, the samples in Table 1 were adopted as normal samples. Besides, a random sample was
selected as abnormal sample: (IPCA, EDLWD)¼(1000, 80). The training model correctly classified the six samples, as shownin Fig. 6.
Fig. 5. A portion of on-line ferrograph images sampled in a test (a); (b); (c); (d); (e); (f).
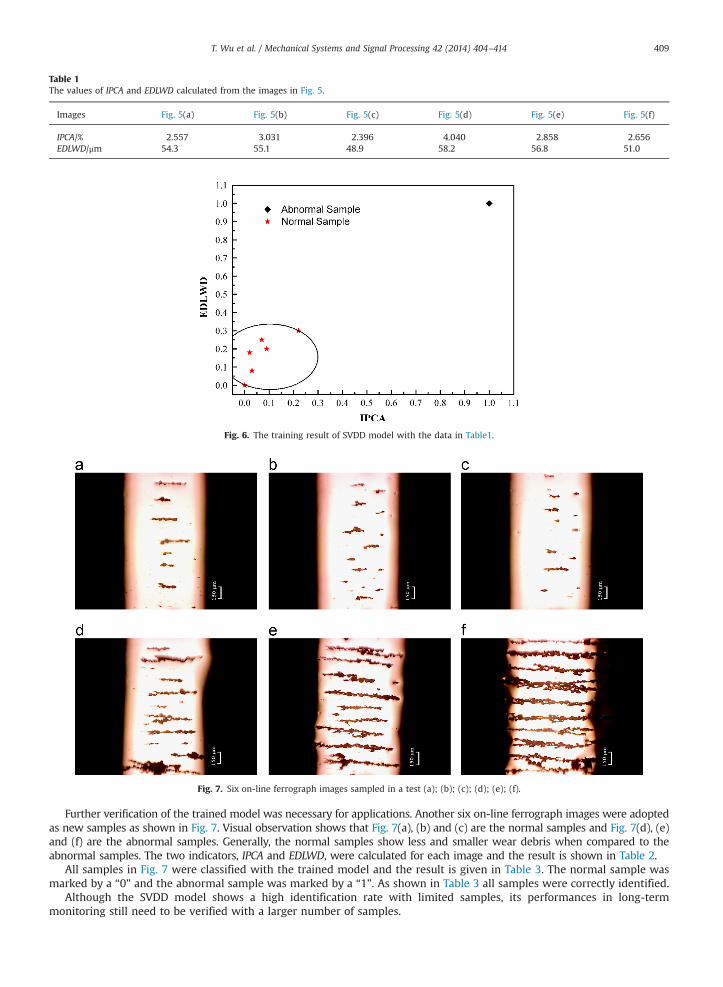
Table 1The values of IPCA and EDLWD calculated from the images in Fig. 5.
Images Fig. 5(a) Fig. 5(b) Fig. 5(c) Fig. 5(d) Fig. 5(e) Fig. 5(f)
IPCA/% 2.557 3.031 2.396 4.040 2.858 2.656EDLWD/μm 54.3 55.1 48.9 58.2 56.8 51.0
Fig. 6. The training result of SVDD model with the data in Table1.
Fig. 7. Six on-line ferrograph images sampled in a test (a); (b); (c); (d); (e); (f).
T. Wu et al. / Mechanical Systems and Signal Processing 42 (2014) 404–414 409
Further verification of the trained model was necessary for applications. Another six on-line ferrograph images were adoptedas new samples as shown in Fig. 7. Visual observation shows that Fig. 7(a), (b) and (c) are the normal samples and Fig. 7(d), (e)and (f) are the abnormal samples. Generally, the normal samples show less and smaller wear debris when compared to theabnormal samples. The two indicators, IPCA and EDLWD, were calculated for each image and the result is shown in Table 2.
All samples in Fig. 7 were classified with the trained model and the result is given in Table 3. The normal sample wasmarked by a “0” and the abnormal sample was marked by a “1”. As shown in Table 3 all samples were correctly identified.
Although the SVDD model shows a high identification rate with limited samples, its performances in long-termmonitoring still need to be verified with a larger number of samples.
T. Wu et al. / Mechanical Systems and Signal Processing 42 (2014) 404–414410
4. Dynamic identification of wear states in an engine test
4.1. Wear analysis of engine bench test with on-line ferrograph data
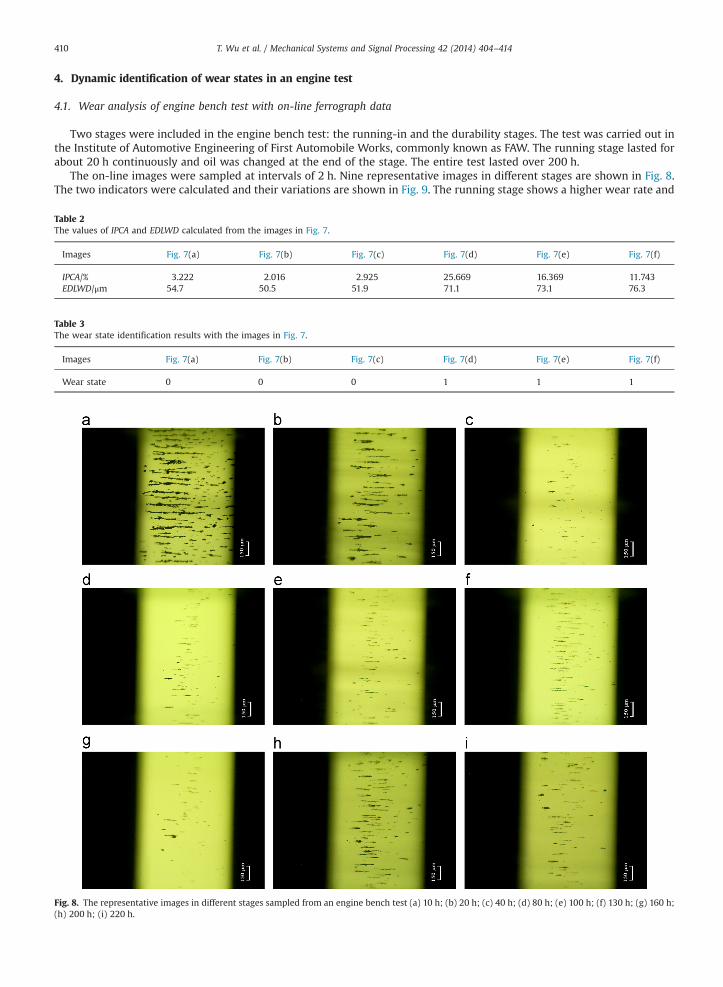
Two stages were included in the engine bench test: the running-in and the durability stages. The test was carried out inthe Institute of Automotive Engineering of First Automobile Works, commonly known as FAW. The running stage lasted forabout 20 h continuously and oil was changed at the end of the stage. The entire test lasted over 200 h.
The on-line images were sampled at intervals of 2 h. Nine representative images in different stages are shown in Fig. 8.The two indicators were calculated and their variations are shown in Fig. 9. The running stage shows a higher wear rate and
Table 3The wear state identification results with the images in Fig. 7.
Images Fig. 7(a) Fig. 7(b) Fig. 7(c) Fig. 7(d) Fig. 7(e) Fig. 7(f)
Wear state 0 0 0 1 1 1
Fig. 8. The representative images in different stages sampled from an engine bench test (a) 10 h; (b) 20 h; (c) 40 h; (d) 80 h; (e) 100 h; (f) 130 h; (g) 160 h;(h) 200 h; (i) 220 h.
Table 2The values of IPCA and EDLWD calculated from the images in Fig. 7.
Images Fig. 7(a) Fig. 7(b) Fig. 7(c) Fig. 7(d) Fig. 7(e) Fig. 7(f)
IPCA/% 3.222 2.016 2.925 25.669 16.369 11.743EDLWD/μm 54.7 50.5 51.9 71.1 73.1 76.3

Fig. 9. The variations of IPCA and EDLWD in an engine bench test.
Fig. 10. The training result of SVDD model with IPCA and EDLWD of the initial test stage.
T. Wu et al. / Mechanical Systems and Signal Processing 42 (2014) 404–414 411
larger wear debris. A drop in wear rate happened due to the oil change at about 50 h. Wear remained stable for a time afterthis, but towards the end of the test wear rate increased. Stage features can be identified from the joint variation of the twoindicators through the on-line wear debris images.
4.2. Dynamic identification SVDD model
For real-time monitoring, the dynamic identification of the SVDD model includes dynamic training and dynamicidentifying. Generally, the present N samples were accepted as normal samples for training, and the following samplesconsistently received from the monitoring process were identified by the trained model. The need for a stage transitionwould be determined when enough abnormalities were consistently found, and the model would be modified.Correspondingly, the present N “abnormal samples” were accepted as normal samples for the model modification. Thusthe identification was repeated for the following data. In this way, the dynamic identification was performed.
The initial 30 samples were accepted as normal samples for model training. As shown in Fig. 10, the boundary of normalwear state was explicitly identified. The model was ready for identification for the following data and the result is shown inFig. 11. Some singularity points emerged after the training stage and were identified as noise points. After a state transition,the identified “abnormal samples” increased stably, thus a new state was reached. Correspondingly, the model wasautomatically modified following the identification as described above.
Singularity points may be introduced by the influence of wear mechanism transference on the identification. Thus, theycan be treated as noise points in the wear description. The identification efficiency and accuracy may be affected by thenoise points.
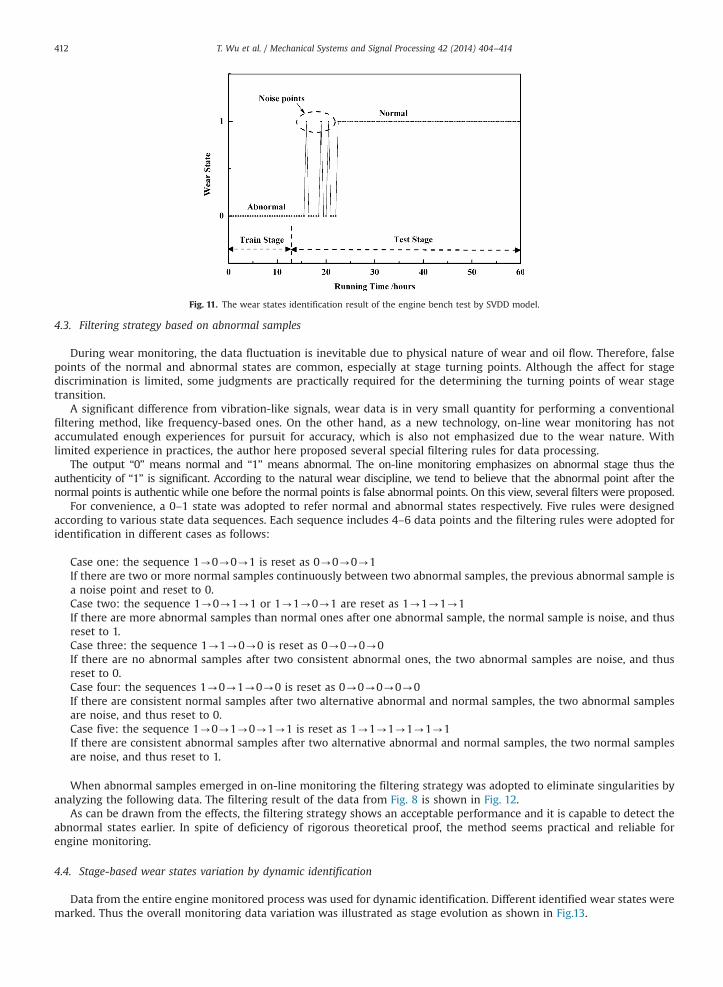
Fig. 11. The wear states identification result of the engine bench test by SVDD model.
T. Wu et al. / Mechanical Systems and Signal Processing 42 (2014) 404–414412
4.3. Filtering strategy based on abnormal samples
During wear monitoring, the data fluctuation is inevitable due to physical nature of wear and oil flow. Therefore, falsepoints of the normal and abnormal states are common, especially at stage turning points. Although the affect for stagediscrimination is limited, some judgments are practically required for the determining the turning points of wear stagetransition.
A significant difference from vibration-like signals, wear data is in very small quantity for performing a conventionalfiltering method, like frequency-based ones. On the other hand, as a new technology, on-line wear monitoring has notaccumulated enough experiences for pursuit for accuracy, which is also not emphasized due to the wear nature. Withlimited experience in practices, the author here proposed several special filtering rules for data processing.
The output “0” means normal and “1” means abnormal. The on-line monitoring emphasizes on abnormal stage thus theauthenticity of “1” is significant. According to the natural wear discipline, we tend to believe that the abnormal point after thenormal points is authentic while one before the normal points is false abnormal points. On this view, several filters were proposed.
For convenience, a 0–1 state was adopted to refer normal and abnormal states respectively. Five rules were designedaccording to various state data sequences. Each sequence includes 4–6 data points and the filtering rules were adopted foridentification in different cases as follows:
Case one: the sequence 1-0-0-1 is reset as 0-0-0-1If there are two or more normal samples continuously between two abnormal samples, the previous abnormal sample isa noise point and reset to 0.Case two: the sequence 1-0-1-1 or 1-1-0-1 are reset as 1-1-1-1If there are more abnormal samples than normal ones after one abnormal sample, the normal sample is noise, and thusreset to 1.Case three: the sequence 1-1-0-0 is reset as 0-0-0-0If there are no abnormal samples after two consistent abnormal ones, the two abnormal samples are noise, and thusreset to 0.Case four: the sequences 1-0-1-0-0 is reset as 0-0-0-0-0If there are consistent normal samples after two alternative abnormal and normal samples, the two abnormal samplesare noise, and thus reset to 0.Case five: the sequence 1-0-1-0-1-1 is reset as 1-1-1-1-1-1If there are consistent abnormal samples after two alternative abnormal and normal samples, the two normal samplesare noise, and thus reset to 1.
When abnormal samples emerged in on-line monitoring the filtering strategy was adopted to eliminate singularities byanalyzing the following data. The filtering result of the data from Fig. 8 is shown in Fig. 12.
As can be drawn from the effects, the filtering strategy shows an acceptable performance and it is capable to detect theabnormal states earlier. In spite of deficiency of rigorous theoretical proof, the method seems practical and reliable forengine monitoring.
4.4. Stage-based wear states variation by dynamic identification
Data from the entire engine monitored process was used for dynamic identification. Different identified wear states weremarked. Thus the overall monitoring data variation was illustrated as stage evolution as shown in Fig.13.
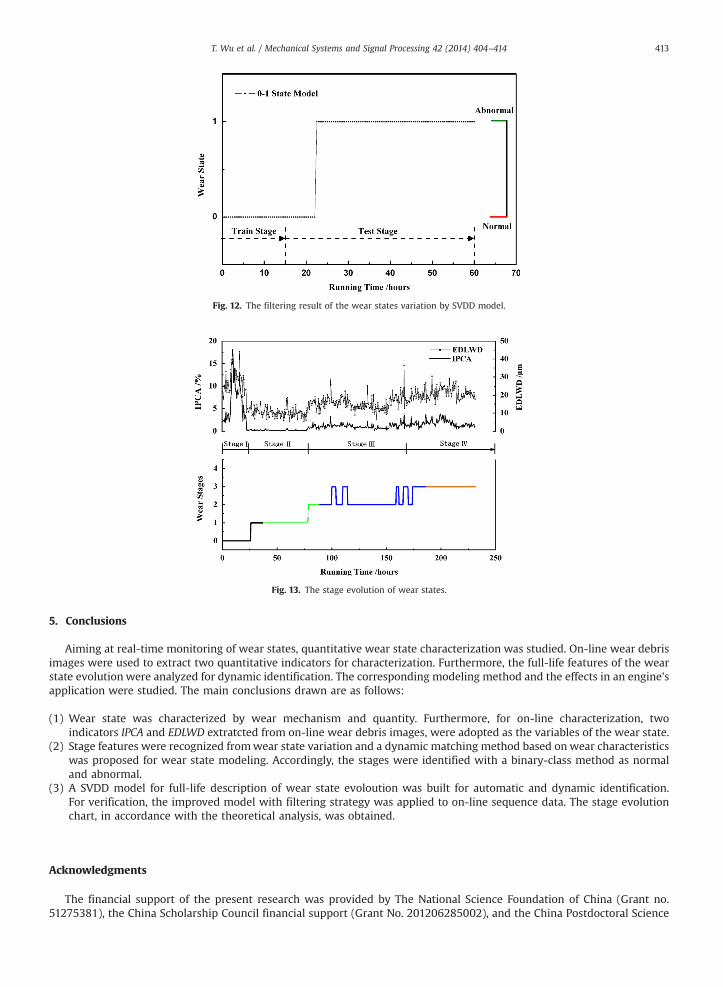
Fig. 12. The filtering result of the wear states variation by SVDD model.
Fig. 13. The stage evolution of wear states.
T. Wu et al. / Mechanical Systems and Signal Processing 42 (2014) 404–414 413
5. Conclusions
Aiming at real-time monitoring of wear states, quantitative wear state characterization was studied. On-line wear debrisimages were used to extract two quantitative indicators for characterization. Furthermore, the full-life features of the wearstate evolution were analyzed for dynamic identification. The corresponding modeling method and the effects in an engine'sapplication were studied. The main conclusions drawn are as follows:
(1)
Wear state was characterized by wear mechanism and quantity. Furthermore, for on-line characterization, twoindicators IPCA and EDLWD extratcted from on-line wear debris images, were adopted as the variables of the wear state.(2)
Stage features were recognized fromwear state variation and a dynamic matching method based on wear characteristicswas proposed for wear state modeling. Accordingly, the stages were identified with a binary-class method as normaland abnormal.(3)
A SVDD model for full-life description of wear state evoloution was built for automatic and dynamic identification.For verification, the improved model with filtering strategy was applied to on-line sequence data. The stage evolutionchart, in accordance with the theoretical analysis, was obtained.Acknowledgments
The financial support of the present research was provided by The National Science Foundation of China (Grant no.51275381), the China Scholarship Council financial support (Grant No. 201206285002), and the China Postdoctoral Science
T. Wu et al. / Mechanical Systems and Signal Processing 42 (2014) 404–414414
Foundation funded project (Grant no. 201003672). The author would also like to acknowledge The Institute of AutomotiveEngineering of First Automobile Works, commonly known as FAW. The author is also most grateful to the anonymousreferees and the Editor for their constructive comments. Special thanks to the MogoEdit for language polishing.
References
[1] G. Niu, B.S. Yang, M. Pecht, Development of an optimized condition-based maintenance system by data fusion and reliability-centered maintenance,Reliability Engineering and System Safety 95 (2010) 786–796.
[2] G.W. Stachowiak, P. Podsiadlo, Towards the development of an automated wear particle classification system, Tribology International 39 (2006)1615–1623.
[3] S. Raadnui, Wear particle analysis—utilization of quantitative computer image analysis: a review, Tribology International 38 (2005) 871–878.[4] B. Sick, On-line and indirect tool wear monitoring in turning with artificial neural networks: a review of more than a decade of research, Mechanical
Systems and Signal Processing 16 (4) (2002) 487–546.[5] I. Plascak, T. Juric, R. Emert, Application of ferrography in condition based maintenance, Strojarstvo 52 (2) (2010) 233–240.[6] J.H. Yan, M. Koc, J. Lee, A prognostic algorithm for machine performance assessment and its application, Production Planning and Control: Journal of
Operations Management 15 (2004) 796–801.[7] D. Banjevic, A.K.S. Jardine, Calculation of reliability function and remaining useful life for a Markov failure time process, IMA Journal of Management
Mathematics 17 (2006) 115–130.[8] S.K. Yang, A condition-based failure-prediction and processing-scheme for preventive maintenance, IEEE Transactions on Reliability 52 (2003)
373–383.[9] S. Wu, N. Gebraeel, M.A. Lawley, A neural network integrated decision support system for condition-based optimal predictive maintenance policy,
IEEE Transactions on Systems Man and Cybernetics A 37 (2007) 226–236.[10] G. Vachtsevanos, P. Wang, Fault prognosis using dynamic wavelet neural networks, Ai Edam 15 (4) (2001) 349–365.[11] Y.L. Zhang, J.H. Mao, Y.B. Xie, Engine wear monitoring with OLVF, Tribology Transactions 54 (2011) 201–207.[12] T.H. Wu, J.Q. Wang, J.Y. Wu, Y.B. Xie, J.H. Mao, Wear characterization by an on-line ferrograph image, Mechanical Engineers J-Journal of Engineering
255 (2011) 23–34.[13] D.M.J. Tax, R.P.W. Duin, Support vector domain description, Pattern Recognition Letters 20 (1999) 1191–1199.[14] W. Sakla, A. Chan, J. Ji, A. Sakla, An SVDD-based algorithm for target detection in hyperspectral imagery, IEEE Geoscience and Remote Sensing 8 (2011)
384–388.[15] S.M. Guo, L.C. Chen, J.S.H. Tsai, A boundary method for outlier detection based on support vector domain description, Pattern Recognition 42 (2009)
77–83.[16] B.J. Roylance, Ferrography-then and now, Tribology International 38 (2005) 857–862.[17] N.k. Verma, M. Hanmandlu, From a gaussian mixture model to non-additive fuzzy systems, IEEE Transactions on Fuzzy Systems 15 (2007) 809–826.


![Analysis of Wear Particles Formed in Boundary-Lubricated ... · tionally, it is believed that the wear debris also reflects the wear mechanism [14–16], and therefore, significant](https://img.pdfslide.net/doc/110x75/5ed0021901eb6c0e46324747/analysis-of-wear-particles-formed-in-boundary-lubricated-tionally-it-is-believed.jpg)


![Recovery of low volumes of wear debris from rat stifle ...eprints.whiterose.ac.uk/128378/7/1-s2.0-S... · result of reactions to wear debris [2,3]. Device failure may be due to a](https://img.pdfslide.net/doc/110x75/5e997a9b31745954816ba0b8/recovery-of-low-volumes-of-wear-debris-from-rat-stifle-result-of-reactions-to.jpg)