Embed Size (px)
Citation preview

Banks
www.fitchratings.com 17 September 2013
` Sweden
Swedbank AB Full Rating Report
Key Rating Drivers
Strong Standalone Strength: Swedbank AB‟s ratings reflect its strong Swedish franchise,
solid capitalisation, good profitability and resilient asset quality in its largely retail portfolio.
These factors outweigh Swedbank‟s reliance on wholesale funding and exposure to the Baltics,
although the bank has significantly reduced this risk.
Good Profitability, High Efficiency: Swedbank‟s profitability compares well with that of its peers.
The bank has boosted lending margins, which is compensating for continued margin pressure on
deposits. Despite some signs of increased competition in the Swedish mortgage market, Fitch
Ratings expects Swedbank to maintain its revenue-generating capacity while keeping its costs
low. Loan impairment charges (LICs) are low, and the agency expects them to remain modest in
2013 and 2014.
Strong Asset Quality: Non-performing loans steadily reduced to below 1% of gross loans
(around SEK10bn) at end-June 2013, from a peak of almost SEK40bn in 2009. Fitch expects
asset quality to remain sound in the remaining book, supported by strong risk management,
with a focus on risk returns rather than volume growth.
Structural Wholesale Funding Reliance: Like its peers, Swedbank‟s structural reliance on
wholesale funding makes it sensitive to prolonged dislocations in funding markets, as at the
height of the global financial crisis. A substantial portion of the bank‟s funding is also raised in
international markets. Therefore, its funding and liquidity management are important ratings
drivers. Fitch expects these risks to be mitigated by Swedbank‟s lengthened maturity profile,
large liquidity reserve and focus on liquidity stress testing.
Solid Capitalisation: Swedbank‟s capital adequacy ratios compare well with those of its
Nordic and international peers. However, its large portfolio of mortgages with low risk weights
boosts capital ratios. Leverage, defined as tangible common equity/tangible assets, was a
moderate 4.7% at end-June 2013.
Extremely High Support Probability: Fitch considers there to be an extremely high
probability of support from the Swedish authorities, if required, due to Swedbank‟s importance
within the Swedish financial sector (around a 20% market share in deposits at end-June 2013).
Rating Sensitivities
Stability Most Likely: Fitch‟s expectation that Swedbank will retain its focus on strong capital
and liquidity while not increasing risk in its businesses drives the Stable Outlook. Upside
potential is limited in light of the already high ratings.
Sensitive to Funding Access: Downward pressure on the bank‟s ratings would most likely be
due to a prolonged inability to competitively access the debt capital markets or renewed
uncertainty in its Baltic portfolio. A shift away from long-term funding or significant reliance on
international investors would probably be ratings negative.
Performance Linked to Sweden: Because Swedbank‟s Swedish business is its main profit
driver and represents the majority of credit exposure, its ratings are inevitably sensitive to a
severe downturn in Sweden. This would particularly be the case should a downturn lead to a
significant correction in house prices and higher losses in both Swedbank‟s mortgage and
corporate portfolios. This scenario is not Fitch‟s expectation.
Ratings
Foreign Currency
Long-Term IDR A+ Short-Term IDR F1 Viability Rating a+ Support Rating 1 Support Rating Floor A−
Sovereign Risk Long-Term Foreign-Currency IDR AAA Long-Term Local-Currency IDR AAA
Outlooks
Long-Term Foreign-Currency IDR Stable Sovereign Long-Term Foreign-Currency IDR
Stable
Sovereign Long-Term Local-Currency IDR
Stable
Financial Data
Swedbank AB
30 Jun
13 31 Dec
12 c
Total assets (USDm) 280,419 283,948 Total assets (SEKm) 1,882,622 1,846,860 Total equity (SEKm) 101,403 103,186 Operating profit (SEKm) 9,744 19.466 Published net income (SEKm)
5,121 14,312
Comprehensive income (SEKm)
8,851 12,086
Operating ROAA (%) 1.0 1.0 Operating ROAE (%) 19.6 19.1 Fitch core capital/ weighted risks (%)
a
18.3 18.1
Core Tier 1 ratio (%)a 18.0 16.7
Common equity Tier 1 ratio (%)
b
17.2 15.4
a Excluding Basel II transitional rules b Swedbank‟s estimate under Basel III c Swedbank has reclassified its Russian and Ukrainian operations as discontinued operations.
Analysts
Jens Hallen +44 20 3530 1326 [email protected] Olivia Perney Guillot +33 1 44 29 91 74 [email protected]

Banks
Swedbank AB
September 2013 2
Profile – Strong Swedish Retail and SME Franchise
Swedbank is predominantly a retail and SME bank with a focus on the Swedish market, where
it has significant market shares, including a 26% market share of the mortgage business and
21% of deposits at end-June 2013. Its market shares of Swedish corporate loans and deposits
range between 15% and 20%, and its mutual funds business is the largest in Sweden, with a
24% market share.
Swedbank considers the three Baltic states (Estonia, Latvia and Lithuania), where it is the
largest bank (with market shares ranging from 10% to 55%, depending on product and country),
part of its home markets.
From Savings Bank to Swedish and Baltic Universal Bank
Swedbank was created in 1997 through the merger of Sparbanken Sverige and
Föreningsbanken, both of which were also formed through mergers of various cooperative and
savings banks. During the 2000s, Swedbank grew rapidly organically and via acquisitions in the
Baltics, Russia and Ukraine – which at their 2009 peak made up around 15% of total lending.
The Baltics, Russia and Ukraine were severely hit by sharp recessions in 2009, culminating in
significant LICs, leading to a large loss for the bank. However, in 2009 Swedbank began
reshaping its business, including hiring a new CEO and CFO. Management‟s subsequent focus
has been on addressing the bank‟s asset quality and funding challenges. As a result,
Swedbank has reduced its risk profile, strengthened risk management and implemented a risk-
return culture. The focus on profit and high-quality assets has resulted in reduced market share,
although this has been in line with management‟s expectations. In Fitch‟s view, Swedbank has
achieved a significant turnaround and is now building on strong Swedish and Baltic franchises.
(See the Appendix for group structure.)
Swedbank has recently been reducing its operations in Russia and Ukraine. It sold its
Ukrainian business in H113 and is winding down its remaining Russian exposure (around
SEK2bn net lending at end-June 2013).
Figure 2
-5
0
5
10
Denmark Estonia Finland Latvia Lithuania Norway Sweden
2011 2012 2013f 2014f 2015f
GDP Growth - Select Markets
(%)
Source: Fitch, 2 August 2013
Corporate Governance
Swedbank‟s internal control processes appear adequate and transparency is good. The bank is
listed on the Stockholm stock exchange and complies with all relevant rules and principles. At
its AGM, 12 members are elected to the board of directors, including two staff representatives.
All are independent of the bank, except for the CEO of a local savings bank (there is a
cooperation agreement with Swedbank) and the two staff representatives.
Figure 1
Swedbank
Source: Swedbank
Other operating markets
Home markets
Related Criteria
Global Financial Institutions Rating Criteria (August 2012)
Evaluating Corporate Governance (December 2012)

Banks
Swedbank AB
September 2013 3
Performance – Good Profitability; High Efficiency
Swedbank‟s profitability remained good in H113, driven by maintained revenue growth and
strict cost controls. Swedbank has taken a cautious stance on loan growth in Sweden, and
combined with reducing exposures in the Baltics, margin improvements have been the clear
focus of management. While margins are not yet back to pre-crisis levels, its net interest
margin has recovered significantly to H113 from 2010, due to active repricing of lending
offsetting pressure on deposit margins. Figures 3 and 4 emphasise these points. Fitch expects
Swedbank to allow some margin compression in H213 to retain part of the increased market
share obtained in H113 (although still lower than its market share of the outstanding volume).
LICs remain low for Swedbank, partly due to reversals from its Baltic business. LICs peaked in
2009 (which also include some credit impairments on investments), but have remained minimal
since then. Fitch expects LICs to approach more normal levels in 2014 and Swedbank‟s pre-
impairment operating profit will allow it to absorb increased LICs arising from a moderate
deterioration in asset quality – which is not Fitch‟s base case.
Figure 3 Figure 4
-40-20
020406080
100120140160180
2005
2006
2007
2008
2009
2010
2011
2012
H113
0.0
0.2
0.4
0.6
0.8
1.0
1.2
1.4
1.6
Net interest margin (RHS)
Impairment charge/pre-impairment profit (LHS)
Margins
(%)
Source: Swedbank, Fitch
(%)
0
10
20
30
40
50
60
70
-15
-10
-5
0
5
10
15
20
25
30
20
05
20
06
20
07
20
08
20
09
20
10
20
11
20
12
H1
13
Cost/income (RHS)
Operating ROAE (LHS)
(%)
Key Profitability
Source: Swedbank, Fitch
(%)
Most of Swedbank‟s profits are generated in Sweden‟s retail banking business, with an
increasing share from the large corporate sector (companies with turnover above SEK2bn).
Therefore, Swedbank‟s revenue-generating capacity depends on the performance of the
Swedish economy, as well as Swedish consumers‟ credit appetite to drive net interest income
and commission.
Fitch expects continued modest GDP growth in Sweden in 2013 (1.4%) and 2014 (2.5%), from
0.7% in 2012. The agency expects this to translate into low revenue growth for Swedbank,
driven by low transaction volumes and credit demand. Sweden is export oriented, and while it
has outperformed many European countries since 2010, Swedish corporates are not immune
to the eurozone‟s problems. Nevertheless, Fitch expects Swedbank‟s revenue to be primarily
affected by a deterioration in the Eurozone, with asset quality and LICs moderately affected,
because of their relatively strong starting point.
The sale of Swedbank‟s Ukrainian business in Q213 led to Swedbank taking a SEK1.9bn hit to
the income statement from cumulative negative exchange rate differences; this was offset by
an equal positive movement in comprehensive income. The remaining Russian business is
reported under discontinued operations.
Retail (Sweden) – Swedbank‟s Core Customer Group
Retail is responsible for Swedbank‟s Swedish customers (except large corporates) and is the
backbone of the bank‟s business. This segment represents over 50% of operating profit and
around three-quarters of its loan book.
Figure 5 Operating Profit by Division (SEKm) H113 2011
Retail 5,793 10,806 Large corporates & institutions
1,948 3,754
Baltic 1,587 3,708 Asset management
a n.a. 794
Group functions & Other
-41 -564
Total 9,287 18,498 a Asset Management is from 2013 reported
under Group Functions & Other Source: Swedbank, Fitch

Banks
Swedbank AB
September 2013 4
Returns are moderate because of the historically low risk of these assets, which explains the
relatively low contribution to group profits on a return on assets basis. However, by allocated
capital the return in this segment has been around 25% since 2010 (28% in H113).
Management is implementing various efficiency measures – including reducing the amount of
cash handling, merging branches and introducing new channels – and Fitch expects Retail to
remain Swedbank‟s core segment. The cost/income ratio in Retail was a strong 45% in H113.
Large Corporates & Institutions (LC&I) – Stable Performance
Net interest income (NII) is improving as Swedbank, like its peers, is re-pricing its lending
products, accounting for higher capital requirements and funding costs; however, credit
demand remains subdued and loan volumes are relatively flat. NII remains the most important
revenue driver for LC&I.
Baltic Banking – LIC Reversals Coming to End; Performance Bottomed Out
Swedbank‟s Baltic business had significant LICs in 2009 and 2010, during the initial
assessments of the loan portfolios, and deleveraging in 2011 and 2012. Fitch expects positive
economic growth in all three countries to be maintained in 2013 and 2014, although the agency
expects credit demand to remain low.
Fitch expects the underlying performance to remain relatively stable, but for NII to remain under
pressure from low deposit margins. Contribution to group profit has improved since 2010, partly
driven by LIC reversals, although it slightly decreased in H113. The agency expects LICs to
normalise in 2014. While further eurozone uncertainty may affect exporters, and continued
deleveraging from households would affect domestic demand, Fitch expects the impact of
moderately higher LICs to be manageable for the bank.
Risk Management – Primary Focus
Credit risk represents over 80% of Swedbank‟s Basel II capital requirements and is the most
significant risk for the bank. As a predominately retail lender with low risk weights for residential
mortgages, Swedbank benefited from the implementation of the Capital Requirement Directive
III, with risk-weighted assets (RWAs) 40% lower than under Basel I.
The bank‟s exposure to the Baltic countries has emphasised the importance of risk
management, and the changes implemented under the new management team support risk-
based decision-making throughout the group. As Swedbank is reducing its Russian and
Ukrainian operations, the Baltics remain Swedbank‟s main area of risk in terms of loss rates;
however, Fitch expects this risk to be manageable for the bank because of the low volume of
unreserved or uncollateralised exposures remaining.
Credit Risk – Largest Risk for Swedbank
Figure 6
-10
-5
0
5
10
15
20
25
End-
2005
End-
2006
End-
2007
End-
2008
End-
2009
End-
2010
End-
2011
End-
2012
End-
H113
Loan growth (bank) Net impaired loans/equity
Loan Quality
(%)
Source: Swedbank, Fitch

Banks
Swedbank AB
September 2013 5
Swedbank‟s model is focused on decentralised decision-making for lending, within set
parameters, based on knowledge of local markets and an ability to monitor individual risks
more closely. Exposures above certain limits remain under the control of central credit
committees. The bank uses the internal ratings-based (IRB) approach to calculate capital
requirements for credit risk for most of its retail and corporate exposures.
Figure 7
-0.5
0.0
0.5
1.0
1.5
2.0
2.5
3.0
3.5
End-
2005
End-
2006
End-
2007
End-
2008
End-
2009
End-
2010
End-
2011
End-
2012
End-
H113
Impaired loans Loan impairment charge Reserves for impaired loans
Loan Quality
(%)
Source: Swedbank, Fitch
Swedbank‟s loan portfolio represented around two-thirds of total assets at end-June 2013, with
retail mortgages accounting for around 55% of the loan book. Most of the loan book is to
Swedish counterparties, with around 10% to the Baltics. Non-Nordic exposures have
decreased since 2008 as a result of significant write-downs and lower net lending, but these
regions constitute the most significant risk area for Swedbank and account for the majority of
the stock of impaired loans.
Figure 8 Figure 9
LC&I
16.3%
Baltic
9.6%
Sweden -
Retail
73.8%
Other
0.4%
Loan BookBy region, end - June 2013
Source: Swedbank, Fitch
0
5,000
10,000
15,000
20,000
25,000
30,000
Sweden
Retail
LC&I Baltic Otherª
End-2009 End-2010 End-2011
End-2012 End-H113
Gross Impaired Loans
(SEKm)
ª Transferred to discontinued operations in H113;
Largely Russia and Ukraine
Source: Swedbank, Fitch
Baltics – High Non-Performing Loans (NPLs), but Significantly Reduced Since Peak
Baltic loans represent most of Swedbank‟s NPLs. Although representing less than 10% of
gross loans, NPLs in the region made up around three-quarters of Swedbank‟s gross impaired
loans at end-June 2013; Baltic NPLs/gross loans was just under 6% at the same date.
Within the bank‟s Baltic portfolio, property management and private customers are the two
main causes of impaired loans. Lending to households makes up around half of the Baltic loan
book. Fitch expects challenges to remain for the Baltic property sector, but for the stock of
impaired loans to decrease further as the loans are worked out (see Figure 9 for reduction from
peak). In addition, while unemployment increased significantly in all three countries to a peak in
2010 of 15%-20%, Fitch expects unemployment to decline somewhat in 2013. Nevertheless,
the agency expects NPLs to remain high.

Banks
Swedbank AB
September 2013 6
Property Management – Large Swedish Exposures, but Good Quality
Swedbank‟s largest corporate sector exposure is property management (excluding exposures
in the Baltics), representing around 12% of the total loan book at end-June 2013. The asset
quality of these exposures is strong, with a gross impaired loans/gross loans ratio of just over
20bp at end-June 2013.
Within this segment, around half of the exposure is to residential property management, which
operates under rent control in Sweden. The requirements from banks for a high level of pre-lets
and conservative loan/value ratios for new builds, as well as low vacancy rates in Sweden for
the property stock, have driven very low levels of impaired loans. Construction has remained
low in Sweden and because of the shortage of rental properties, particularly in the large cities,
Fitch expects asset quality to remain resilient in this portfolio. In the LC&I portfolio, Swedbank‟s
focus on large property managers, combined with cash-flow assessments rather than only
collateral values, have kept asset quality very strong.
Retail – Resilient Asset Quality; Making up Three-Quarters of the Loan Book
Exposures to private customers, largely mortgages, make up around half of Swedbank‟s total
loan book. In addition, lending to housing associations, which is more similar to retail
mortgages than commercial real estate, make up a further 7% of gross loans. The quality of
mortgages remains strong, with impaired loans standing at 8bp of gross loans at end-June
2013. Fitch believes the largest direct risk to this portfolio would be in a scenario of rising
interest rates, higher unemployment and falling house prices. However, Fitch expects that this
portfolio would remain resilient should this occur, with lower consumption a more likely
outcome. This would affect Swedish corporates.
On loan approval, the bank focuses on debt serviceability and generally factors in a 400bp
margin over five-year fixed mortgage rates for its affordability calculations, which supports debt-
servicing ability in a rising interest rate environment. Swedbank has also introduced mandatory
amortisation for mortgages in excess of 75% of the property value. In addition, the still
generous Swedish welfare system limits the negative effects of rising unemployment levels.
Fitch does not rule out the possibility of a house price correction, although its base case is for
stabilisation or moderate falls.
The asset quality of Swedbank‟s SME exposure remains solid, and the impaired loans ratio
was a low 51bp at end-June 2013. Fitch believes exposure to manufacturing and the retail
sector may result in further impaired loans in the medium term, although the agency expects
these to remain manageable for the bank.
Market Risk is Moderate
Market risk is modest and primarily arises from structural interest rate positions and limited
trading, mainly on customers‟ accounts, although there is a degree of position-taking within set
limits ultimately assigned at board level.
A 100bp parallel increase (decrease) in the yield curve would have increased (decreased) NII
by SEK2.1bn (SEK2.2bn) at end-June 2013 – a notable around 10% of annual NII.
Swedbank uses value at risk (VaR) to monitor trading market risks based on a one-day holding
period, a 99% confidence interval and a one-year observation period. Total average VaR for
H113, scaled up to a 10-day period, was a low SEK240m. Swedbank group‟s 10-day high VaR
in H113 was SEK281m (SEK414m in 2012).
Insurance products are predominately unit linked, and the risk for Swedbank is therefore not
material. Equity price risk is similarly low.
Focus on Reducing Operational Risks
Swedbank, like most of its peers, has adopted the standardised method to calculate capital
Figure 10 Loan Book by Industry End-June 2013 (%)
Private 64 Of which Mortgages 54 Housing cooperatives 7
Other 3 Corporate 36
Of which Agriculture 6 Construction 1 Property management 13 Shipping 2 Manufacturing 3 Other 11
Total gross loans (SEKbn) 1,194 Top 20 corporate exposures
% of gross loans 8 % of CET1 111
Source: Swedbank, Fitch
Figure 11
Other
1%
ST dept
9%
Non-Equity Funding Mix End-June 2013
Source: Swedbank, Fitch; excluding repos
Covered bonds
33%
Retail deposits
22%
Corporate
deposits
20%
Interbank
8%
Subordinated
1%

Banks
Swedbank AB
September 2013 7
requirements for operational risk. With a somewhat fragmented IT infrastructure, the bank
continues to report somewhat elevated operational risks. The bank is simplifying its IT systems,
and also focusing on meeting new customer expectations for both ease and safety of new
distribution channels.
Fitch expects Swedbank to continue to invest in technology, both to meet customer
expectations and to achieve the most cost-efficient distribution and communication channels.
Swedbank is working internally on aligning its capital calculations for operational risk to the
advanced measurement approach. The capital requirement for operational risk was moderate,
at around SEK4bn at end-June 2013, or 5% of Fitch core capital.
Funding, Liquidity and Capital
Funding and Liquidity – Significant Covered Bonds Funding Mitigated by Large Liquidity Buffer
Swedbank funds around half of its loan book using customer deposits, with covered bonds
largely funding the rest. The bank has had good access to domestic funding markets, and has
maintained its ability to make private placements and issue covered bonds in international
markets since 2010. Its funding strategy is based on covered bond issuance, with more limited
needs for senior unsecured bonds. It issued around SEK68bn in H113 (SEK46bn covered
bonds and SEK22bn senior unsecured bonds) and around SEK142bn in 2012 (SEK77bn
covered bonds and SEK65bn senior unsecured bonds). Its adjusted asset encumbrance ratio
(encumbered assets/(total assets minus derivatives minus insurance assets)) was acceptable
at end-June 2013, at around 1/3 excluding unused covered bond overcollateralization (around
45% including all assets in the covered bond cover pool). At the height of the financial crisis,
Swedbank made use of the Swedish guarantee scheme for bond issuance and had a limited
SEK8bn outstanding at end-June 2013.
Like its Nordic peers Swedbank is reliant on wholesale investors for its structural funding. The
debt capital markets reliance reflects a structural shortage of deposits in Sweden, largely
caused by household preferences for pension and investment products. These preferences are
driven by tax incentives and a culture of financial investments. However, Swedish banks benefit
from the recycling of retail savings via domestic pension funds and insurance companies,
where a significant proportion of household wealth is held. Fitch believes these institutional
investors, as well as domestic financial institutions, need to invest in local-currency assets to
match their liabilities. However, the relatively low level of Swedish government bonds leaves
bank paper as one of the few investment options.
Management places great emphasis on stress testing, including the bank‟s liquidity position. At
end-June 2013 it held around SEK290bn in its significant liquidity reserve, comprised almost
entirely of „AAA‟ assets (around 80% cash or government issued/guaranteed bonds and 20%
covered bonds). It also held around SEK35bn in similar assets outside the treasury function at
end-June 2013.
Swedbank‟s reported liquidity coverage ratio, according to Swedish requirements, was 129% at
end-June 2013; 166% according to Basel recommendations. Its net stable funding ratio was
95% at the same date.
Strong Capitalisation
Swedbank‟s capitalisation is strong, with Fitch core capital of SEK83bn, or 18.3% of RWAs
excluding transitional floors, at end-June 2013. Swedbank benefits significantly from the low
risk weights it uses for residential mortgages under the Basel II internal ratings-based approach.
Data for historical loss ratios appears to substantiate the low risk weights, although it may not
adequately reflect future risk. Despite the low risk weights, leverage (tangible common
equity/tangible assets) remains good, at just below 5%. Swedbank estimates that a move to
Basel III would largely affect capitalisation via an increase in RWAs, resulting in an around
Banks
Swedbank AB
September 2013 8
80bp reduction in its Common Equity Tier 1 capital ratio, to a still strong 17.2% at end-June
2013.
The Swedish regulator introduced a minimum common equity ratio of 10% under the Basel III
regime in January 2013, increasing to 12% in 2015. It is also introducing in 2013 a floor on risk
weights for mortgages of 15% as a Pillar II requirement. In response to likely additional capital
requirements, management is proposing a 15% minimum target for its Common Equity Tier 1
ratio. At the same time, with limited growth expected in the short to medium term – and strong
capital ratios – the board has increased the dividend pay-out ratio to 75% from 50%.
Figure 12
0
40,000
80,000
120,000
End-
2009
End-
2010
End-
2011
End-
2012
End-
H113
0
5
10
15
20
Tier 1 (LHS) Total capital (LHS)
Tier 1 ratio (RHS) Fitch core capital/RWA (RHS)
Tangible common equity/tangible assets (RHS)
Capital & Leverage
(SEKm)
Source: Swedbank, Fitch
(%)

Banks
Swedbank AB
September 2013 9
Appendix: Group Structure
Retail Banking – Sweden
This division incorporates Swedbank‟s traditional lending and deposit business for retail and
corporate customers, cards and finance products, and mortgage lending via Swedbank
Mortgage. It had around 300 branches and 5,000 staff at end-June 2013. Through cooperation
agreements with a number of local savings banks, an additional 245 branches are available for
its customers.
Large Corporate and Institutions
Swedbank‟s large corporate and financial institutions clients are catered for in this division,
which includes its trading and capital market products.
Baltic Banking
This business has grown rapidly since Swedbank acquired Estonian Hansapank in 1998 (50%
acquired in 1998; 50% in 2005). Swedbank is the largest bank in the region and had around
200 branches and 4,000 employees at end-June 2013.
Group Functions and Other
Group Functions and Other includes Ektornet and Swedbank‟s operations in Russia and
Ukraine. Ektornet was established to manage repossessed assets, in particular real estate in
the Baltics, and its purpose is to minimise associated costs/losses.
Swedbank is winding down its Russian business and sold its Ukrainian operations in H113.
Swedbank‟s asset management offering is conducted via its wholly owned subsidiary
Swedbank Robur, Sweden‟s largest unit-linked fund management company. It provides over
140 funds, pension savings and discretionary asset management to institutional and private
investors.
Banks
Swedbank AB
September 2013 10
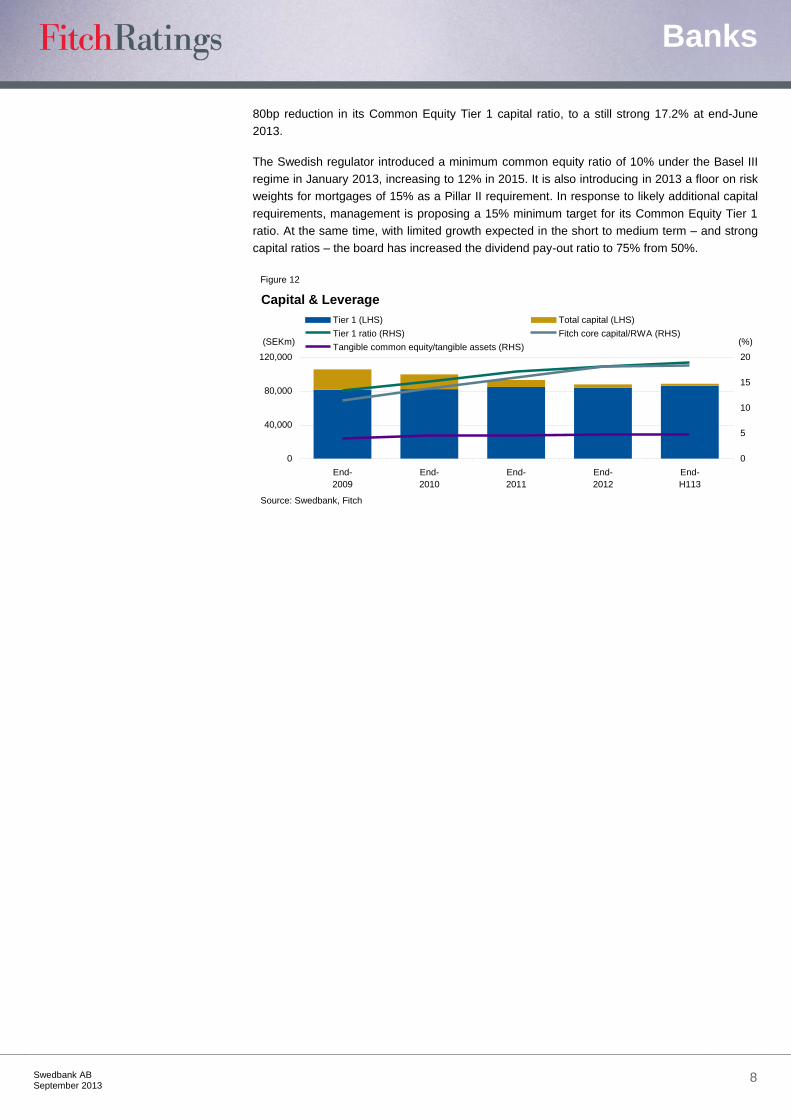
Swedbank AB
Income Statement30 Jun 2013 31 Dec 2012 a 31 Dec 2011 31 Dec 2010
6 Months - Interim6 Months - Interim As % of Year End As % of Year End As % of Year End As % of
USDm SEKm SEKm SEKm SEKm
Unaudited Unaudited Unqualified Unqualified Unqualified
1. Interest Income on Loans 3,110.8 20,875.0 2.56 48,180.0 2.87 47,509.0 2.87 37,518.0 2.26
2. Other Interest Income 281.4 1,888.0 0.23 4,703.0 0.28 6,068.0 0.37 8,351.0 0.50
3. Dividend Income 35.0 235.0 0.03 266.0 0.02 148.0 0.01 207.0 0.01
4. Gross Interest and Dividend Income 3,427.2 22,998.0 2.82 53,149.0 3.16 53,725.0 3.25 46,076.0 2.78
5. Interest Expense on Customer Deposits 388.6 2,608.0 0.32 7,415.0 0.44 7,585.0 0.46 4,272.0 0.26
6. Other Interest Expense 1,387.1 9,308.0 1.14 24,280.0 1.44 26,978.0 1.63 25,268.0 1.52
7. Total Interest Expense 1,775.7 11,916.0 1.46 31,695.0 1.89 34,563.0 2.09 29,540.0 1.78
8. Net Interest Income 1,651.4 11,082.0 1.36 21,454.0 1.28 19,162.0 1.16 16,536.0 1.00
9. Net Gains (Losses) on Trading and Derivatives (8.6) (58.0) (0.01) (5,619.0) (0.33) 751.0 0.05 (10,732.0) (0.65)
10. Net Gains (Losses) on Other Securities n.a. n.a. - n.a. - 10.0 0.00 (16.0) (0.00)
11. Net Gains (Losses) on Assets at FV through Income Statement 19.2 129.0 0.02 7,725.0 0.46 658.0 0.04 12,941.0 0.78
12. Net Insurance Income 50.2 337.0 0.04 595.0 0.04 506.0 0.03 612.0 0.04
13. Net Fees and Commissions 732.1 4,913.0 0.60 9,636.0 0.57 9,597.0 0.58 9,525.0 0.57
14. Other Operating Income 187.0 1,255.0 0.15 2,032.0 0.12 2,594.0 0.16 1,449.0 0.09
15. Total Non-Interest Operating Income 980.0 6,576.0 0.81 14,369.0 0.85 14,116.0 0.85 13,779.0 0.83
16. Personnel Expenses 707.7 4,749.0 0.58 9,413.0 0.56 9,917.0 0.60 9,392.0 0.57
17. Other Operating Expenses 509.6 3,420.0 0.42 7,536.0 0.45 8,482.0 0.51 8,250.0 0.50
18. Total Non-Interest Expenses 1,217.3 8,169.0 1.00 16,949.0 1.01 18,399.0 1.11 17,642.0 1.06
19. Equity-accounted Profit/ Loss - Operating 60.1 403.0 0.05 797.0 0.05 767.0 0.05 624.0 0.04
20. Pre-Impairment Operating Profit 1,474.1 9,892.0 1.21 19,671.0 1.17 15,646.0 0.95 13,297.0 0.80
21. Loan Impairment Charge 22.1 148.0 0.02 721.0 0.04 (1,704.0) (0.10) 2,804.0 0.17
22. Securities and Other Credit Impairment Charges n.a. n.a. - (34.0) (0.00) (207.0) (0.01) 643.0 0.04
23. Operating Profit 1,452.1 9,744.0 1.19 18,984.0 1.13 17,557.0 1.06 9,850.0 0.59
24. Equity-accounted Profit/ Loss - Non-operating n.a. n.a. - n.a. - n.a. - n.a. -
25. Non-recurring Income n.a. n.a. - n.a. - n.a. - 105.0 0.01
26. Non-recurring Expense 68.1 457.0 0.06 486.0 0.03 2,134.0 0.13 n.a. -
27. Change in Fair Value of Own Debt n.a. n.a. - n.a. - n.a. - n.a. -
28. Other Non-operating Income and Expenses n.a. n.a. - n.a. - n.a. - n.a. -
29. Pre-tax Profit 1,384.0 9,287.0 1.14 18,498.0 1.10 15,423.0 0.93 9,955.0 0.60
30. Tax expense 281.5 1,889.0 0.23 4,039.0 0.24 3,669.0 0.22 2,472.0 0.15
31. Profit/Loss from Discontinued Operations (339.3) (2,277.0) (0.28) (13.0) (0.00) 4.0 0.00 n.a. -
32. Net Income 763.1 5,121.0 0.63 14,446.0 0.86 11,758.0 0.71 7,483.0 0.45
33. Change in Value of AFS Investments n.a. n.a. - n.a. - n.a. - n.a. -
34. Revaluation of Fixed Assets n.a. n.a. - n.a. - n.a. - n.a. -
35. Currency Translation Differences 110.6 742.0 0.09 (1,480.0) (0.09) (284.0) (0.02) (4,257.0) (0.26)
36. Remaining OCI Gains/(losses) 445.3 2,988.0 0.37 576.0 0.03 590.0 0.04 2,494.0 0.15
37. Fitch Comprehensive Income 1,319.0 8,851.0 1.08 13,542.0 0.81 12,064.0 0.73 5,720.0 0.34
38. Memo: Profit Allocation to Non-controlling Interests 0.6 4.0 0.00 8.0 0.00 14.0 0.00 39.0 0.00
39. Memo: Net Income after Allocation to Non-controlling Interests 762.5 5,117.0 0.63 14,438.0 0.86 11,744.0 0.71 7,444.0 0.45
40. Memo: Common Dividends Relating to the Period 1,622.1 10,885.0 1.33 10,880.0 0.65 5,825.0 0.35 2,995.0 0.18
41. Memo: Preferred Dividends Related to the Period n.a. n.a. - n.a. - n.a. - n.a. -
Exchange rate USD1 = SEK6.71050 USD1 = SEK6.50450 USD1 = SEK6.88770 USD1 = SEK6.70970
a Swedbank has reclassified its Russian and Ukrainian operations as discontinued operations. The 2012 income statement has been reclassified in the first page summary but not in the spreads due to lack of detail.
Earning Assets
Earning
Assets
Earning
Assets
Earning
Assets

Banks
Swedbank AB
September 2013 11
Swedbank AB
Balance Sheet30 Jun 2013 31 Dec 2012 31 Dec 2011 31 Dec 2010
6 Months - Interim6 Months - Interim As % of Year End As % of Year End As % of Year End As % of
USDm SEKm Assets SEKm Assets SEKm Assets SEKm Assets
AssetsA. Loans
1. Residential Mortgage Loans 96,109.5 645,241.0 34.27 640,756.0 34.69 632,035.0 34.03 n.a. -
2. Other Mortgage Loans 12,553.0 84,276.0 4.48 82,209.0 4.45 71,556.0 3.85 n.a. -
3. Other Consumer/ Retail Loans 4,979.3 33,429.0 1.78 34,587.0 1.87 38,823.0 2.09 n.a. -
4. Corporate & Commercial Loans 65,343.3 438,689.0 23.30 441,919.0 23.93 441,834.0 23.79 n.a. -
5. Other Loans n.a. n.a. - n.a. - n.a. - 1,208,942.0 70.46
6. Less: Reserves for Impaired Loans/ NPLs 801.5 5,381.0 0.29 8,558.0 0.46 15,192.0 0.82 21,716.0 1.27
7. Net Loans 178,183.7 1,196,254.0 63.54 1,190,913.0 64.48 1,169,056.0 62.95 1,187,226.0 69.20
8. Gross Loans 178,985.2 1,201,635.0 63.83 1,199,471.0 64.95 1,184,248.0 63.77 1,208,942.0 70.46
9. Memo: Impaired Loans included above 1,506.0 10,111.0 0.54 14,900.0 0.81 25,480.0 1.37 34,703.0 2.02
10. Memo: Loans at Fair Value included above n.a. n.a. - n.a. - n.a. - n.a. -
B. Other Earning Assets
1. Loans and Advances to Banks 8,779.3 58,941.0 3.13 69,557.0 3.77 64,737.0 3.49 166,417.0 9.70
2. Reverse Repos and Cash Collateral 9,491.8 63,724.0 3.38 63,874.0 3.46 74,856.0 4.03 n.a. -
3. Trading Securities and at FV through Income n.a. n.a. - 141,485.0 7.66 136,320.0 7.34 98,266.0 5.73
4. Derivatives 10,610.7 71,236.0 3.78 102,265.0 5.54 103,726.0 5.59 65,051.0 3.79
5. Available for Sale Securities n.a. n.a. - 66.0 0.00 64.0 0.00 56.0 0.00
6. Held to Maturity Securities n.a. n.a. - 2,362.0 0.13 3,942.0 0.21 4,511.0 0.26
7. At-equity Investments in Associates 486.6 3,267.0 0.17 3,552.0 0.19 3,111.0 0.17 2,710.0 0.16
8. Other Securities 20,875.5 140,150.0 7.44 n.a. - n.a. - 34,924.0 2.04
9. Total Securities 41,464.6 278,377.0 14.79 313,604.0 16.98 322,019.0 17.34 205,518.0 11.98
10. Memo: Government Securities included Above n.a. n.a. - 19,248.0 1.04 25,729.0 1.39 n.a. -
11. Memo: Total Securities Pledged n.a. n.a. - n.a. - n.a. - n.a. -
12. Investments in Property 214.3 1,439.0 0.08 2,393.0 0.13 3,910.0 0.21 n.a. -
13. Insurance Assets 16,500.8 110,780.0 5.88 104,194.0 5.64 95,747.0 5.16 100,628.0 5.87
14. Other Earning Assets n.a. n.a. - n.a. - 0.0 0.00 n.a. -
15. Total Earning Assets 245,142.8 1,645,791.0 87.42 1,680,661.0 91.00 1,655,469.0 89.14 1,659,789.0 96.74
C. Non-Earning Assets
1. Cash and Due From Banks 29,772.3 199,879.0 10.62 130,058.0 7.04 164,307.0 8.85 17,109.0 1.00
2. Memo: Mandatory Reserves included above n.a. n.a. - n.a. - n.a. - n.a. -
3. Foreclosed Real Estate n.a. n.a. - n.a. - n.a. - n.a. -
4. Fixed Assets 581.5 3,904.0 0.21 4,638.0 0.25 4,383.0 0.24 5,679.0 0.33
5. Goodwill 1,730.8 11,620.0 0.62 11,452.0 0.62 11,762.0 0.63 13,733.0 0.80
6. Other Intangibles 277.8 1,865.0 0.10 1,988.0 0.11 2,037.0 0.11 2,061.0 0.12
7. Current Tax Assets 93.7 629.0 0.03 1,082.0 0.06 2,083.0 0.11 1,156.0 0.07
8. Deferred Tax Assets 72.1 484.0 0.03 657.0 0.04 872.0 0.05 1,218.0 0.07
9. Discontinued Operations 355.7 2,388.0 0.13 208.0 0.01 250.0 0.01 n.a. -
10. Other Assets 2,392.5 16,062.0 0.85 16,116.0 0.87 15,902.0 0.86 14,936.0 0.87
11. Total Assets 280,419.1 1,882,622.0 100.00 1,846,860.0 100.00 1,857,065.0 100.00 1,715,681.0 100.00
Liabilities and Equity
D. Interest-Bearing Liabilities
1. Customer Deposits - Current 95,638.9 642,081.0 34.11 557,898.0 30.21 547,378.0 29.48 534,237.0 31.14
2. Customer Deposits - Savings n.a. n.a. - n.a. - n.a. - n.a. -
3. Customer Deposits - Term n.a. n.a. - n.a. - n.a. - n.a. -
4. Total Customer Deposits 95,638.9 642,081.0 34.11 557,898.0 30.21 547,378.0 29.48 534,237.0 31.14
5. Deposits from Banks 17,003.5 114,155.0 6.06 113,492.0 6.15 117,013.0 6.30 136,766.0 7.97
6. Repos and Cash Collateral 6,098.1 40,940.0 2.17 30,475.0 1.65 36,903.0 1.99 n.a. -
7. Other Deposits and Short-term Borrowings 19,654.6 131,953.0 7.01 202,600.0 10.97 202,974.0 10.93 244,163.0 14.23
8. Total Deposits, Money Market and Short-term Funding 138,395.0 929,129.0 49.35 904,465.0 48.97 904,268.0 48.69 915,166.0 53.34
9. Senior Debt Maturing after 1 Year 91,500.8 614,300.0 32.63 564,854.0 30.58 578,484.0 31.15 442,354.0 25.78
10. Subordinated Borrowing 675.3 4,534.0 0.24 8,029.0 0.43 12,730.0 0.69 20,272.0 1.18
11. Other Funding n.a. n.a. - n.a. - n.a. - n.a. -
12. Total Long Term Funding 92,176.2 618,834.0 32.87 572,883.0 31.02 591,214.0 31.84 462,626.0 26.96
13. Derivatives 8,916.5 59,862.0 3.18 92,141.0 4.99 90,484.0 4.87 65,935.0 3.84
14. Trading Liabilities 2,330.9 15,649.0 0.83 18,229.0 0.99 30,603.0 1.65 34,179.0 1.99
15. Total Funding 241,818.7 1,623,474.0 86.23 1,587,718.0 85.97 1,616,569.0 87.05 1,477,906.0 86.14
E. Non-Interest Bearing Liabilities
1. Fair Value Portion of Debt n.a. n.a. - n.a. - n.a. - n.a. -
2. Credit impairment reserves n.a. n.a. - n.a. - n.a. - n.a. -
3. Reserves for Pensions and Other 734.5 4,931.0 0.26 5,424.0 0.29 1,812.0 0.10 1,342.0 0.08
4. Current Tax Liabilities 94.6 635.0 0.03 1,378.0 0.07 472.0 0.03 317.0 0.02
5. Deferred Tax Liabilities 394.0 2,645.0 0.14 2,641.0 0.14 3,183.0 0.17 1,734.0 0.10
6. Other Deferred Liabilities n.a. n.a. - n.a. - n.a. - n.a. -
7. Discontinued Operations 55.9 375.0 0.02 76.0 0.00 97.0 0.01 n.a. -
8. Insurance Liabilities 16,634.9 111,680.0 5.93 106,753.0 5.78 98,327.0 5.29 103,088.0 6.01
9. Other Liabilities 4,681.2 31,428.0 1.67 33,406.0 1.81 31,671.0 1.71 29,344.0 1.71
10. Total Liabilities 264,413.7 1,775,168.0 94.29 1,737,396.0 94.07 1,752,131.0 94.35 1,613,731.0 94.06
F. Hybrid Capital
1. Pref. Shares and Hybrid Capital accounted for as Debt 901.3 6,051.0 0.32 6,278.0 0.34 6,801.0 0.37 6,915.0 0.40
2. Pref. Shares and Hybrid Capital accounted for as Equity n.a. n.a. - n.a. - n.a. - n.a. -
G. Equity
1. Common Equity 15,198.6 102,037.0 5.42 105,921.0 5.74 99,978.0 5.38 97,187.0 5.66
2. Non-controlling Interest 22.8 153.0 0.01 154.0 0.01 140.0 0.01 138.0 0.01
3. Securities Revaluation Reserves n.a. n.a. - n.a. - n.a. - n.a. -
4. Foreign Exchange Revaluation Reserves (192.9) (1,295.0) (0.07) (2,847.0) (0.15) (2,253.0) (0.12) (2,246.0) (0.13)
5. Fixed Asset Revaluations and Other Accumulated OCI 75.7 508.0 0.03 (42.0) (0.00) 268.0 0.01 (44.0) (0.00)
6. Total Equity 15,104.1 101,403.0 5.39 103,186.0 5.59 98,133.0 5.28 95,035.0 5.54
7. Total Liabilities and Equity 280,419.1 1,882,622.0 100.00 1,846,860.0 100.00 1,857,065.0 100.00 1,715,681.0 100.00
8. Memo: Fitch Core Capital 12,414.8 83,348.0 4.43 84,107.0 4.55 78,689.0 4.24 74,790.0 4.36
9. Memo: Fitch Eligible Capital n.a. n.a. - n.a. - n.a. - n.a. -
Exchange rate USD1 = SEK6.71360 USD1 = SEK6.50450 USD1 = SEK6.88770 USD1 = SEK6.70970

Banks
Swedbank AB
September 2013 12
Swedbank AB
Summary Analytics30 Jun 2013 31 Dec 2012 31 Dec 2011 31 Dec 2010
6 Months - Interim Year End Year End Year End
A. Interest Ratios
1. Interest Income on Loans/ Average Gross Loans 3.49 3.96 3.97 3.00
2. Interest Expense on Customer Deposits/ Average Customer Deposits 0.86 1.28 1.41 0.82
3. Interest Income/ Average Earning Assets 2.79 3.17 3.18 2.61
4. Interest Expense/ Average Interest-bearing Liabilities 1.48 1.95 2.23 1.87
5. Net Interest Income/ Average Earning Assets 1.34 1.28 1.13 0.94
6. Net Int. Inc Less Loan Impairment Charges/ Av. Earning Assets 1.32 1.24 1.23 0.78
7. Net Interest Inc Less Preferred Stock Dividend/ Average Earning Assets 1.34 1.28 1.13 0.94
B. Other Operating Profitability Ratios
1. Non-Interest Income/ Gross Revenues 37.24 40.11 42.42 45.45
2. Non-Interest Expense/ Gross Revenues 46.26 47.31 55.29 58.20
3. Non-Interest Expense/ Average Assets 0.88 0.90 1.03 0.96
4. Pre-impairment Op. Profit/ Average Equity 19.92 19.80 16.22 14.49
5. Pre-impairment Op. Profit/ Average Total Assets 1.06 1.05 0.87 0.73
6. Loans and securities impairment charges/ Pre-impairment Op. Profit 1.50 3.49 (12.21) 25.92
7. Operating Profit/ Average Equity 19.62 19.11 18.20 10.73
8. Operating Profit/ Average Total Assets 1.04 1.01 0.98 0.54
9. Taxes/ Pre-tax Profit 20.34 21.83 23.79 24.83
10. Pre-Impairment Operating Profit / Risk Weighted Assets 2.60 2.56 2.07 1.77
11. Operating Profit / Risk Weighted Assets 2.56 2.47 2.32 1.31
C. Other Profitability Ratios
1. Net Income/ Average Total Equity 10.31 14.54 12.19 8.15
2. Net Income/ Average Total Assets 0.55 0.77 0.66 0.41
3. Fitch Comprehensive Income/ Average Total Equity 17.82 13.63 12.51 6.23
4. Fitch Comprehensive Income/ Average Total Assets 0.95 0.72 0.67 0.31
5. Net Income/ Av. Total Assets plus Av. Managed Securitized Assets n.a. n.a. n.a. n.a.
6. Net Income/ Risk Weighted Assets 1.35 1.88 1.55 1.00
7. Fitch Comprehensive Income/ Risk Weighted Assets 2.33 1.76 1.59 0.76
D. Capitalization
1. Fitch Core Capital/Weighted Risks 10.87 10.94 10.40 9.97
2. Fitch Eligible Capital/ Weighted Risks n.a. n.a. n.a. n.a.
3. Tangible Common Equity/ Tangible Assets 4.70 4.88 4.54 4.61
4. Tier 1 Regulatory Capital Ratio 11.30 10.90 11.20 11.00
5. Total Regulatory Capital Ratio 11.60 11.40 12.30 13.30
6. Core Tier 1 Regulatory Capital Ratio 10.70 10.10 10.20 10.10
7. Equity/ Total Assets 5.39 5.59 5.28 5.54
8. Cash Dividends Paid & Declared/ Net Income 212.56 75.31 49.54 40.02
9. Cash Dividend Paid & Declared/ Fitch Comprehensive Income 122.98 80.34 48.28 52.36
10. Cash Dividends & Share Repurchase/Net Income n.a. n.a. n.a. n.a.
11. Net Income - Cash Dividends/ Total Equity (11.46) 3.46 6.05 4.72
E. Loan Quality
1. Growth of Total Assets 1.94 (0.55) 8.24 (4.40)
2. Growth of Gross Loans 0.18 1.29 (2.04) (8.17)
3. Impaired Loans(NPLs)/ Gross Loans 0.84 1.24 2.15 2.87
4. Reserves for Impaired Loans/ Gross loans 0.45 0.71 1.28 1.80
5. Reserves for Impaired Loans/ Impaired Loans 53.22 57.44 59.62 62.58
6. Impaired Loans less Reserves for Imp Loans/ Equity 4.66 6.15 10.48 13.67
7. Loan Impairment Charges/ Average Gross Loans 0.02 0.06 (0.14) 0.22
8. Net Charge-offs/ Average Gross Loans n.a. 0.56 0.38 0.31
9. Impaired Loans + Foreclosed Assets/ Gross Loans + Foreclosed Assets 0.84 1.24 2.15 2.87
F. Funding
1. Loans/ Customer Deposits 187.15 215.00 216.35 226.29
2. Interbank Assets/ Interbank Liabilities 51.63 61.29 55.32 121.68
3. Customer Deposits/ Total Funding excl Derivatives 41.06 37.30 35.87 37.84

Banks
Swedbank AB
September 2013 13
Swedbank AB
Reference Data30 Jun 2013 31 Dec 2012 31 Dec 2011 31 Dec 2010
6 Months - Interim6 Months - Interim As % of Year End As % of Year End As % of Year End As % of
USDm SEKm Assets SEKm Assets SEKm Assets SEKm Assets
A. Off-Balance Sheet Items
1. Managed Securitized Assets Reported Off-Balance Sheet n.a. n.a. - n.a. - n.a. - n.a. -
2. Other off-balance sheet exposure to securitizations n.a. n.a. - n.a. - n.a. - n.a. -
3. Guarantees 3,323.3 22,311.0 1.19 19,812.0 1.07 20,997.0 1.13 23,157.0 1.35
4. Acceptances and documentary credits reported off-balance sheet n.a. n.a. - 2,446.0 0.13 2,919.0 0.16 171.0 0.01
5. Committed Credit Lines 27,582.8 185,180.0 9.84 188,176.0 10.19 185,959.0 10.01 175,382.0 10.22
6. Other Contingent Liabilities n.a. n.a. - 84.0 0.00 335.0 0.02 1,993.0 0.12
7. Total Business Volume 311,325.2 2,090,113.0 111.02 2,057,378.0 111.40 2,067,275.0 111.32 1,916,384.0 111.70
8. Memo: Total Weighted Risks 114,171.7 766,503.0 40.71 769,117.0 41.64 756,762.0 40.75 750,440.0 43.74
9. Fitch Adjustments to Weighted Risks. n.a. n.a. - n.a. - n.a. - n.a. -
10. Fitch Adjusted Weighted Risks 114,171.7 766,503.0 40.71 769,117.0 41.64 756,762.0 40.75 750,440.0 43.74
B. Average Balance Sheet
Average Loans 178,404.7 1,197,738.0 63.62 1,215,434.0 65.81 1,196,562.8 64.43 1,249,811.2 72.85
Average Earning Assets 247,893.6 1,664,258.3 88.40 1,675,586.2 90.73 1,689,759.4 90.99 1,764,305.0 102.83
Average Assets 280,361.7 1,882,236.3 99.98 1,878,311.6 101.70 1,792,140.2 96.50 1,830,188.4 106.67
Average Managed Securitized Assets (OBS) n.a. n.a. - n.a. - n.a. - n.a. -
Average Interest-Bearing Liabilities 242,107.9 1,625,415.7 86.34 1,627,478.6 88.12 1,551,248.6 83.53 1,576,600.4 91.89
Average Common equity 15,249.9 102,382.0 5.44 101,853.6 5.51 98,430.4 5.30 92,928.6 5.42
Average Equity 14,918.8 100,158.7 5.32 99,341.6 5.38 96,450.0 5.19 91,793.6 5.35
Average Customer Deposits 90,737.4 609,174.7 32.36 579,919.6 31.40 537,900.4 28.97 520,506.8 30.34
C. Maturities
Asset Maturities:
Loans & Advances < 3 months n.a. n.a. - 93,967.0 5.09 140,613.0 7.57 n.a. -
Loans & Advances 3 - 12 Months n.a. n.a. - 91,041.0 4.93 67,386.0 3.63 n.a. -
Loans and Advances 1 - 5 Years n.a. n.a. - 242,107.0 13.11 181,077.0 9.75 n.a. -
Loans & Advances > 5 years n.a. n.a. - 811,749.0 43.95 822,378.0 44.28 n.a. -
Debt Securities < 3 Months n.a. n.a. - 12,519.0 0.68 23,484.0 1.26 n.a. -
Debt Securities 3 - 12 Months n.a. n.a. - 27,287.0 1.48 25,082.0 1.35 n.a. -
Debt Securities 1 - 5 Years n.a. n.a. - 78,861.0 4.27 73,375.0 3.95 n.a. -
Debt Securities > 5 Years n.a. n.a. - 17,140.0 0.93 16,370.0 0.88 n.a. -
Interbank < 3 Months n.a. n.a. - 78,545.0 4.25 88,557.0 4.77 n.a. -
Interbank 3 - 12 Months n.a. n.a. - 2,438.0 0.13 2,469.0 0.13 n.a. -
Interbank 1 - 5 Years n.a. n.a. - 2,163.0 0.12 4,702.0 0.25 n.a. -
Interbank > 5 Years n.a. n.a. - 2,334.0 0.13 1,467.0 0.08 n.a. -
Liability Maturities:
Retail Deposits < 3 months n.a. n.a. - n.a. - n.a. - n.a. -
Retail Deposits 3 - 12 Months n.a. n.a. - n.a. - n.a. - n.a. -
Retail Deposits 1 - 5 Years n.a. n.a. - n.a. - n.a. - n.a. -
Retail Deposits > 5 Years n.a. n.a. - n.a. - n.a. - n.a. -
Other Deposits < 3 Months n.a. n.a. - 545,944.0 29.56 522,157.0 28.12 n.a. -
Other Deposits 3 - 12 Months n.a. n.a. - 28,404.0 1.54 33,345.0 1.80 n.a. -
Other Deposits 1 - 5 Years n.a. n.a. - 5,087.0 0.28 5,896.0 0.32 n.a. -
Other Deposits > 5 Years n.a. n.a. - 228.0 0.01 298.0 0.02 n.a. -
Interbank < 3 Months n.a. n.a. - 119,084.0 6.45 134,391.0 7.24 n.a. -
Interbank 3 - 12 Months n.a. n.a. - 2,887.0 0.16 3,774.0 0.20 n.a. -
Interbank 1 - 5 Years n.a. n.a. - 1,773.0 0.10 2,521.0 0.14 n.a. -
Interbank > 5 Years n.a. n.a. - (1,542.0) (0.08) (1,088.0) (0.06) n.a. -
Senior Debt Maturing < 3 months n.a. n.a. - 120,669.0 6.53 123,512.0 6.65 n.a. -
Senior Debt Maturing 3-12 Months n.a. n.a. - 91,066.0 4.93 88,267.0 4.75 n.a. -
Senior Debt Maturing 1- 5 Years n.a. n.a. - 509,909.0 27.61 482,185.0 25.96 n.a. -
Senior Debt Maturing > 5 Years n.a. n.a. - 45,810.0 2.48 87,494.0 4.71 n.a. -
Total Senior Debt on Balance Sheet n.a. n.a. - 767,454.0 41.55 781,458.0 42.08 n.a. -
Fair Value Portion of Senior Debt n.a. n.a. - n.a. - n.a. - n.a. -
Covered Bonds n.a. n.a. - n.a. - 528,987.0 28.49 n.a. -
Subordinated Debt Maturing < 3 months n.a. n.a. - n.a. - n.a. - n.a. -
Subordinated Debt Maturing 3-12 Months n.a. n.a. - n.a. - n.a. - n.a. -
Subordinated Debt Maturing 1- 5 Year n.a. n.a. - n.a. - n.a. - n.a. -
Subordinated Debt Maturing > 5 Years n.a. n.a. - n.a. - n.a. - n.a. -
Total Subordinated Debt on Balance Sheet 675.3 4,534.0 0.24 8,029.0 0.43 12,730.0 0.69 20,272.0 1.18
Fair Value Portion of Subordinated Debt n.a. n.a. - n.a. - n.a. - n.a. -
D. Equity Reconciliation
1. Equity 15,104.1 101,403.0 5.39 103,186.0 5.59 98,133.0 5.28 95,035.0 5.54
2. Add: Pref. Shares and Hybrid Capital accounted for as Equity n.a. n.a. - n.a. - n.a. - n.a. -
3. Add: Other Adjustments n.a. n.a. - n.a. - n.a. - n.a. -
4. Published Equity 15,104.1 101,403.0 5.39 103,186.0 5.59 98,133.0 5.28 95,035.0 5.54
E. Fitch Eligible Capital Reconciliation
1. Total Equity as reported (including non-controlling interests) 15,104.1 101,403.0 5.39 103,186.0 5.59 98,133.0 5.28 95,035.0 5.54
2. Fair value effect incl in own debt/borrowings at fv on the B/S- CC only 0.0 0.0 0.00 0.0 0.00 0.0 0.00 0.0 0.00
3. Non-loss-absorbing non-controlling interests 0.0 0.0 0.00 0.0 0.00 0.0 0.00 0.0 0.00
4. Goodwill 1,730.8 11,620.0 0.62 11,452.0 0.62 11,762.0 0.63 13,733.0 0.80
5. Other intangibles 277.8 1,865.0 0.10 1,988.0 0.11 2,037.0 0.11 2,061.0 0.12
6. Deferred tax assets deduction 0.0 0.0 0.00 301.0 0.02 760.0 0.04 922.0 0.05
7. Net asset value of insurance subsidiaries 680.7 4,570.0 0.24 5,338.0 0.29 4,885.0 0.26 3,529.0 0.21
8. First loss tranches of off-balance sheet securitizations 0.0 0.0 0.00 0.0 0.00 0.0 0.00 0.0 0.00
9. Fitch Core Capital 12,414.8 83,348.0 4.43 84,107.0 4.55 78,689.0 4.24 74,790.0 4.36
10. Eligible weighted Hybrid capital n.a. n.a. - n.a. - n.a. - n.a. -
11. Government held Hybrid Capital 0.0 0.0 0.00 0.0 0.00 0.0 0.00 0.0 0.00
12. Fitch Eligible Capital n.a. n.a. - n.a. - n.a. - n.a. -
Exchange Rate USD1 = SEK6.71360 USD1 = SEK6.50450 USD1 = SEK6.88770 USD1 = SEK6.70970

Banks
Swedbank AB
September 2013 14
The ratings above were solicited by, or on behalf of, the issuer, and therefore, Fitch has been compensated for the provision of the ratings.
ALL FITCH CREDIT RATINGS ARE SUBJECT TO CERTAIN LIMITATIONS AND DISCLAIMERS. PLEASE READ THESE LIMITATIONS AND DISCLAIMERS BY FOLLOWING THIS LINK: HTTP://FITCHRATINGS.COM/UNDERSTANDINGCREDITRATINGS. IN ADDITION, RATING DEFINITIONS AND THE TERMS OF USE OF SUCH RATINGS ARE AVAILABLE ON THE AGENCY'S PUBLIC WEB SITE AT WWW.FITCHRATINGS.COM. PUBLISHED RATINGS, CRITERIA, AND METHODOLOGIES ARE AVAILABLE FROM THIS SITE AT ALL TIMES. FITCH'S CODE OF CONDUCT, CONFIDENTIALITY, CONFLICTS OF INTEREST, AFFILIATE FIREWALL, COMPLIANCE, AND OTHER RELEVANT POLICIES AND PROCEDURES ARE ALSO AVAILABLE FROM THE CODE OF CONDUCT SECTION OF THIS SITE. FITCH MAY HAVE PROVIDED ANOTHER PERMISSIBLE SERVICE TO THE RATED ENTITY OR ITS RELATED THIRD PARTIES. DETAILS OF THIS SERVICE FOR RATINGS FOR WHICH THE LEAD ANALYST IS BASED IN AN EU-REGISTERED ENTITY CAN BE FOUND ON THE ENTITY SUMMARY PAGE FOR THIS ISSUER ON THE FITCH WEBSITE.
Copyright © 2013 by Fitch, Inc., Fitch Ratings Ltd. and its subsidiaries. One State Street Plaza, NY, NY 10004.Telephone: 1-800-753-4824, (212) 908-0500. Fax: (212) 480-4435. Reproduction or retransmission in whole or in part is prohibited except by permission. All rights reserved. In issuing and maintaining its ratings, Fitch relies on factual information it receives from issuers and underwriters and from other sources Fitch believes to be credible. Fitch conducts a reasonable investigation of the factual information relied upon by it in accordance with its ratings methodology, and obtains reasonable verification of that information from independent sources, to the extent such sources are available for a given security or in a given jurisdiction. The manner of Fitch‟s factual investigation and the scope of the third-party verification it obtains will vary depending on the nature of the rated security and its issuer, the requirements and practices in the jurisdiction in which the rated security is offered and sold and/or the issuer is located, the availability and nature of relevant public information, access to the management of the issuer and its advisers, the availability of pre-existing third-party verifications such as audit reports, agreed-upon procedures letters, appraisals, actuarial reports, engineering reports, legal opinions and other reports provided by third parties, the availability of independent and competent third-party verification sources with respect to the particular security or in the particular jurisdiction of the issuer, and a variety of other factors. Users of Fitch‟s ratings should understand that neither an enhanced factual investigation nor any third-party verification can ensure that all of the information Fitch relies on in connection with a rating will be accurate and complete. Ultimately, the issuer and its advisers are responsible for the accuracy of the information they provide to Fitch and to the market in offering documents and other reports. In issuing its ratings Fitch must rely on the work of experts, including independent auditors with respect to financial statements and attorneys with respect to legal and tax matters. Further, ratings are inherently forward-looking and embody assumptions and predictions about future events that by their nature cannot be verified as facts. As a result, despite any verification of current facts, ratings can be affected by future events or conditions that were not anticipated at the time a rating was issued or affirmed.
The information in this report is provided “as is” without any representation or warranty of any kind. A Fitch rating is an opinion as to the creditworthiness of a security. This opinion is based on established criteria and methodologies that Fitch is continuously evaluating and updating. Therefore, ratings are the collective work product of Fitch and no individual, or group of individuals, is solely responsible for a rating. The rating does not address the risk of loss due to risks other than credit risk, unless such risk is specifically mentioned. Fitch is not engaged in the offer or sale of any security. All Fitch reports have shared authorship. Individuals identified in a Fitch report were involved in, but are not solely responsible for, the opinions stated therein. The individuals are named for contact purposes only. A report providing a Fitch rating is neither a prospectus nor a substitute for the information assembled, verified and presented to investors by the issuer and its agents in connection with the sale of the securities. Ratings may be changed or withdrawn at anytime for any reason in the sole discretion of Fitch. Fitch does not provide investment advice of any sort. Ratings are not a recommendation to buy, sell, or hold any security. Ratings do not comment on the adequacy of market price, the suitability of any security for a particular investor, or the tax-exempt nature or taxability of payments made in respect to any security. Fitch receives fees from issuers, insurers, guarantors, other obligors, and underwriters for rating securities. Such fees generally vary from US$1,000 to US$750,000 (or the applicable currency equivalent) per issue. In certain cases, Fitch will rate all or a number of issues issued by a particular issuer, or insured or guaranteed by a particular insurer or guarantor, for a single annual fee. Such fees are expected to vary from US$10,000 to US$1,500,000 (or the applicable currency equivalent). The assignment, publication, or dissemination of a rating by Fitch shall not constitute a consent by Fitch to use its name as an expert in connection with any registration statement filed under the United States securities laws, the Financial Services and Markets Act 2000 of the United Kingdom, or the securities laws of any particular jurisdiction. Due to the relative efficiency of electronic publishing and distribution, Fi tch research may be available to electronic subscribers up to three days earlier than to print subscribers.