Embed Size (px)
Citation preview
Journal of Advanced Concrete Technology Vol. 18, 420-436, July 2020 / Copyright © 2020 Japan Concrete Institute 420
Scientific paper
Full Scale Thermal Stress Simulation of Multiple Span Steel Box Girder Bridge Evaluating Early Age Transverse Cracking Risk of Durable RC Deck Slab Arifa Iffat Zerin1*, Akira Hosoda2, Satoshi Komatsu3 and Hironori Ishii4
Received 28 February 2020, accepted 12 July 2020 doi:10.3151/jact.18.420
Abstract The present research aimed at evaluating early age thermal cracking risk of durable RC slabs incorporating slag cement and expansive additive on multiple span steel box girder bridges utilizing full-scale 3D FEM simulation. First, labora-tory investigations were conducted to calibrate the material models of durable concrete. Second, the material models were utilized in several member level FEM models and the simulation procedure was verified regarding early age vol-ume changes calibrating parameters for expansion energy and reduction factors for creep. Third, thermal and volumetric changes in RC slab were monitored and the simulation procedure was further validated in structural level utilizing full-scale FEM model of the real bridge. The simulated maximum tensile stress along bridge axis in RC slab signify the risk of early age transverse cracking where the accumulated stepping construction stress is comparatively large. The effec-tiveness of expansive additive in reducing the risk of transverse cracking is revealed from the simulation. However, parametric studies of the validated model indicate that the RC slab on the permanent form of seven span steel box girder bridge is vulnerable to early age thermal cracking regardless of ambient conditions and placing temperatures when coef-ficient of thermal expansion of concrete is larger than 6 × 10⁻⁶/℃.
1. Introduction
Transportation infrastructures in cold and snowy regions in Japan are susceptible to sever deterioration due to the combined actions of freezing and thawing, chloride at-tack from deicing agent, alkali silica reaction, cracking, fatigue, and so on. Moreover, the occurrence of early age thermal and shrinkage cracks in RC deck slabs re-strained by girders provide rapid routes for harmful agents aggravating deterioration. In order to ensure the high durability performance of RC decks of bridges along Revival Roads in cold and snowy Tohoku region, a durable concrete design accounting multiple protec-tion countermeasures against deterioration is formulated incorporating low water-to-cement ratio, blast furnace slag and/or fly ash, expansive additive, anti-corrosion rebar and increased entrained air (Tanaka et al. 2017). It is to be noted that such a highly durable concrete speci-
fication may conversely increase the risk of early age cracking in RC slabs owing to the influence of large amount of cement and mineral admixtures (Ishida and Iwaki 2017). Eventually, early age transverse cracks appeared after completion of 28 days special curing period of the durable RC slabs of several multiple span continuous steel box girder bridges such as Shinkesen Ohashi Bridge and Kosano Viaduct in Iwate Prefecture and Koori Viaduct in Fukushima Prefecture along Re-vival Roads. In case of Shinkesen Ohashi RC slab crack width reached 0.2 mm or more after two years of con-struction.
Several investigations were conducted in the past re-garding transverse cracking of bridge decks (PCA 1970; Cady et al. 1971; Purvis et al. 1995; Schmitt and Dar-win 1995; Krauss and Rogalla 1996; Eppers et al. 1998; Altoubat and Lange 2000; ACI 2001; Saadeghvaziri and Hadidi 2002; Frosch et al. 2003; Xi et al. 2003). Based on the field investigations, several structural factors influencing transverse cracking were identified: (1) steel girder bridges had more cracks than prestressed con-crete bridges, (2) continuous span bridges showed more cracking than simply supported span bridges and (3) transverse crack intensity increased as the span length increased (PCA 1970; Cady et al. 1971). Again, envi-ronmental factors such as variations of temperature and moisture in early age concrete were recognized as major causes of transverse cracking (Mohsen 1999; Ramey et al. 1997; Springenschmid 1998). Purvis et al. (1995) revealed that transverse cracks intersected coarse aggre-gates indicating the crack occurrence in hardened con-crete was likely caused by drying and thermal shrinkage. Eppers et al. (1998) identified the dominant design fac-
1Post Doctoral Researcher, Institute of Urban InnovationYokohama National University, 79-5 Tokiwadai, Hodogaya, Yokohama, Japan. *Corresponding author, E-mail: [email protected], Institute of Urban Innovation, Yokohama National University, 79-5 Tokiwadai, Hodogaya, Yokohama, Japan, 3Research Scientist, Structural Engineering Sector, Civil Engineering Research Laboratory, Central Research Institute of Electric Power Industry, 1464 Abiko, Chiba, Japan. 4General Manager, Technical Research Laboratory, Yokogawa Bridge Holdings Corp., Japan.
A. I. Zerin, A. Hosoda, S. Komatsu and H. Ishii / Journal of Advanced Concrete Technology Vol. 18 420-436, 2020 421
tors and material parameters affecting transverse crack-ing. Design factors were longitudinal restraint, deck thickness, and top transverse bar size. Most affecting material parameters were cement content, aggregate type and quantity, and air content. Accordingly, Eppers et al. (1998) recommended reducing restraints by using bridge expansion joints, constructing simply supported spans, increasing girder spacing, and providing fewer shear connectors. Krauss and Rogalla (1996) reported that stiffer decks and larger amounts of reinforcement are effective in reducing cracks. Again, Frosch and Bice (2006) evaluated that the amount and spacing of rein-forcement in the deck influenced the extent of cracking. They recommended providing adequate amount of rein-forcement to prevent localized yielding at cracks. In 2011, Choi et al. assessed the early age temperature and relative humidity distribution in a composite bridge util-izing heat transfer and moisture distribution models. Again, Tanaka et al. (2017) and Ishida et al. (2017) conducted numerical simulations of early age deforma-tion and cracking of multiple protection durable RC deck utilizing multiscale multi-chemo-physical inte-grated analysis (Maekawa et al. 2008). However, early age thermal stress combined with construction stress causing early age transverse cracking was not explicitly addressed. Zerin et al. (2018) performed thermal stress simulation of full-scale multiple span bridge; however, detailed modeling assumptions and quantitative evalua-tion of influential factors causing transverse cracking were not explicated in detail. Hence it is important to establish a full-scale FEM model of multiple span girder bridges to conduct thermal stress simulation of RC slab incorporating construction stresses. The validated FEM model can be effectively utilized in parametric studies for quantitative evaluation of risk and the influential factors causing transverse cracking.
Against this background, the present research aimed at evaluating the cracking risk of the durable RC slab on continuous multiple span steel box girder Shinkesen Ohashi Bridge along the Revival Roads. A three leveled systematic full-scale 3D FEM analysis scheme was fol-lowed in the numerical simulation of early age thermal and volumetric stresses in the corresponding RC slab. First, material level laboratory investigations were con-ducted to calibrate the material models of the durable concrete. Second, the material models were given inputs
in the small-scale member level specimen FEM models and the simulation procedure was verified for early age volume changes. In this level, parameters were cali-brated for expansion energy and reduction factors for effective Young’s modulus considering creep. Third, thermal and volumetric changes were monitored in the real RC slab on Shinkesen Ohashi steel box girder bridge and the simulation scheme was further validated in structural level. The effect of external stresses in-duced by the stepping construction of continuous RC slab was considered in the investigation as well. The cracking risk and the influential factors such as re-strained expansion produced by expansive additive, coefficient of thermal expansion (CTE) of concrete, ambient and concrete placement temperature are evalu-ated based on the structural level simulation and exten-sive parametric studies utilizing the validated FEM bridge model.
2. Cracking scenario of RC slab on multiple span steel box girder bridge
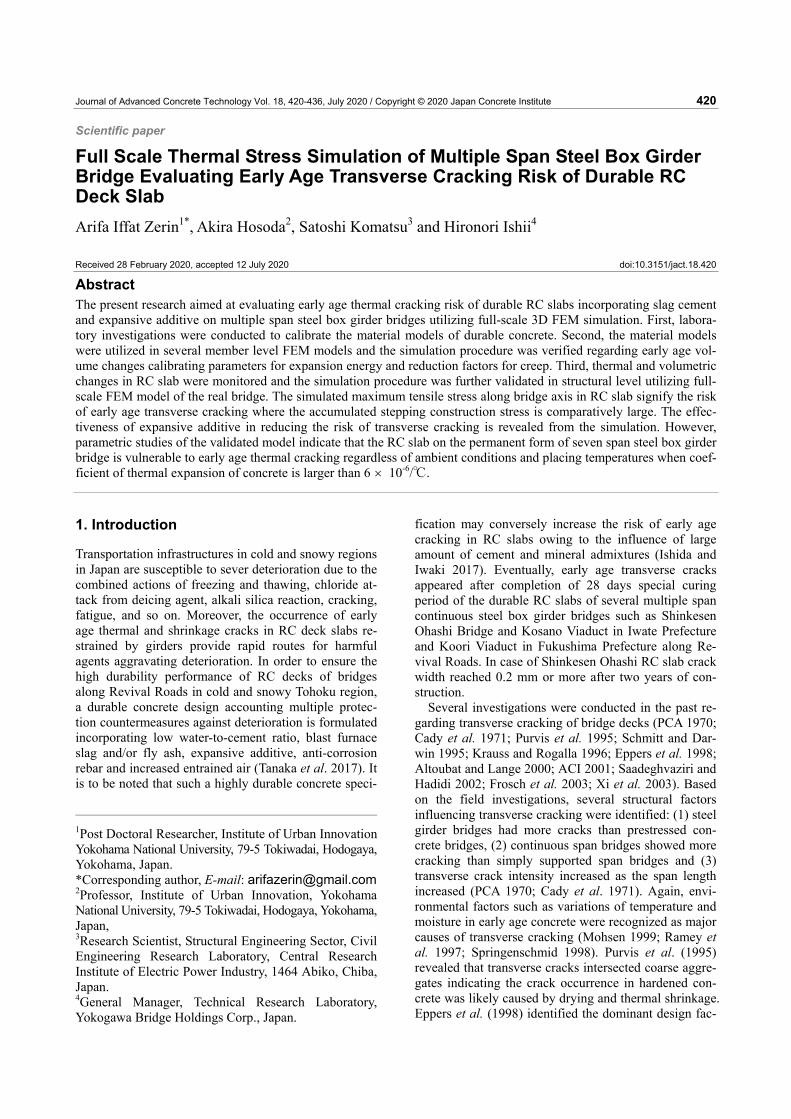
Construction and cracking scenario of RC slab on seven continuous span steel box girder Shinkesen Ohashi Bridge (Figs. 1, 2 and 3) is discussed in the following sections. 2.1 Application of highly durable concrete in Shinkesen Ohashi RC slab The seven continuous span steel box girder Shinkesen Ohashi Bridge (length = 438 m) along Revival Roads in Tohoku region is about three kilometres from the estu-ary of Kesengawa River in Iwate Prefecture. The multi-ple protection highly durable concrete incorporating blast furnace slag cement, low water to binder ratio (W/B = 0.44), expansive additive (20 kg/m3), entrained air (6%) and anti-corrosion rebar were applied in the RC slab during June to July in 2016. Three layers of special curing mats were applied on the RC slab to control thermal changes and prevent evaporation. Twenty-two days of wet curing was followed by initial seven days sealed curing of the RC slab. 2.2 Accumulation of stresses in RC slab induced by stepping construction Systematic stepping construction method was applied in
Fig. 1 structural restraints due to an-chors and connectors.
Fig. 2 Transverse cracks in Shinkesen Ohashi RC slab.
Fig. 3 Efflorescence along the bottom surface of crack.

A. I. Zerin, A. Hosoda, S. Komatsu and H. Ishii / Journal of Advanced Concrete Technology Vol. 18 420-436, 2020 422
the construction of continuous RC slab considering 13 concrete placement lots to minimize adverse structural tensile stresses. Concrete placement order review analy-sis was performed based on the non-linear stress analy-sis incorporating non-linear material models (Maekawa
et. al. 2003; CEB-FIP 1990) and layered fiber model for steel girder and RC slab (MHPS Engineering Co. Ltd. 2006). In the layered model, RC slab sections are con-
Fig. 4 Stepping construction stress of concrete in differ-ent lots of RC slab on the final day of concrete place-ment of Shinkesen Ohashi Bridge.
Fig. 5 Schematic diagram showing the effect of stepping construction stress on thermal cracking.
Fig.6 Cross-section details and location of plywood forms in Shinkesen Ohashi RC slab.
Fig.7 Crack patterns in Lot 1 of Shinkesen Ohashi RC slab according to the dates of observation.

A. I. Zerin, A. Hosoda, S. Komatsu and H. Ishii / Journal of Advanced Concrete Technology Vol. 18 420-436, 2020 423
sidered as layers and steel girders as beams. Calculation of stress is performed only in the longitudinal direction (along bridge axis) at the event of placing of each con-crete lot. Figure 4 represents the estimated tensile strength and cumulative stepping construction stress of each concrete lot along the bridge axis on steel girder G2 (Fig. 6) at final concrete placement day of Lot 13. The cumulative tensile stresses in concrete were com-paratively large in Lot 1, Lot 2 and Lot 3. Minor trans-vers cracks were observed in Lot 1, Lot 2, Lot 3, Lot 8 and Lot 11 primarily after removal of the curing mats at 28th days of curing. It is anticipated that the cracks might have been induced by imposed stepping construc-tion stresses (illustrated in Figs. 4 and 5). Effloresce observed in the bottom surface of the slab confirmed that some cracks were penetrating (Fig. 3).
2.3 Initiation and propagation of cracks in Shinkesen Ohashi RC slab Initially, primary transverse cracks were generated in the RC slab on permanent plywood forms along main girders (Zone P in Figs. 6 and 7). Further, the cracks were propagated towards the cantilever part as well as the central axis of the bridge across the RC slab on tem-porary plywood forms (Zone T). The maximum crack width was 0.08 mm in Lot 1 observed after completion of wet curing. However, some cracks were reported to be widened (0.2 mm or more) along Zone T observed from the exposed bottom surface of the bridge deck after two years of construction. 3. Application of JCI guidelines in thermal stress simulation of RC deck slab
Guidelines for Control of Cracking of Mass Concrete (JCI 2016a) recommends verifying thermal cracking probabilities utilizing 3D FEM thermal stress simulation of concrete structures undergoing large temperature drops. The multiple protection durable concrete incorpo-rates high cement contents contributing to considerable temperature drops. Hence, present investigation focuses on evaluating early age thermal cracking risk of highly durable RC slabs based on JCI 2016 guidelines. 3.1 Time dependent material models of concrete Guidelines for Control of Cracking of Mass Concrete (JCI 2016a) incorporates time dependent material mod-els of concrete for adiabatic temperature rise, compres-sive strength, tensile strength, Young’s modulus, chemi-cal expansion and shrinkage considering the tempera-ture history of the material incorporating effective mate-rial age of concrete as Eq. (1).
( )1 0
4000exp 13.65273
n
e ii i
t tT t T
ΔΔ=
⎧ ⎫⎡ ⎤⎪ ⎪= ⋅ −⎢ ⎥⎨ ⎬+⎢ ⎥⎪ ⎪⎣ ⎦⎩ ⎭∑ (1)
where, te: effective material age (day) considering the
effect of temperature history, Δti: period of constant temperature in concrete (day), T(Δti): concrete tempera-ture for Δti (ºC), To: 1ºC (value that makes temperature non-dimensional).
Further, the influence of creep and micro-cracking is considered in a simple way by calculating the effective Young’s modulus implying reduction factors at tempera-ture increasing and decreasing period of concrete. Addi-tionally, the provision of heat transfer coefficients of concrete structures depending on formwork type, form removal time, curing method and duration, ambient temperature and wind velocity has simplified the FEM thermal and structural stress analysis procedure.
3.2 FEM thermal stress simulation software FEM thermal stress analysis tool JCMAC3 has been utilized in the present research. In JCMAC3, three di-mensional linear hexahedral isoparametric heat generat-ing and non-heat generating solid elements are adopted for material models (JCI 2016b). Reinforcing bars are modeled with one dimensional embedded ETRUSS elements. However, the effect of reinforcing bar is con-sidered in the form of steel ratio in the analysis. Further, two dimensional heat elements are applied as the heat transfer surfaces upon the 3D solid elements. JCMAC3 consists of four analysis modules: temperature module, moisture transfer module, stress module and crack analysis module. The temperature distribution according to each time is calculated in temperature analysis mod-ule. In stress module, normal stress and cracking index defined by the ratio of tensile strength of concrete to the tensile stress are calculated based on simultaneous lin-ear analysis. As cracking is not considered in the stress module, perfect bond is implied at the steel concrete interface. In crack analysis module, smeared crack model is applied where crack width is expressed by crack equivalent strain and stress release after crack initiation is considered. However, the present research intends to evaluate the early age thermal stress and cracking index of the restrained RC slab during the wet curing period utilizing stress module. Hence, the mois-ture transfer (drying shrinkage) and crack analysis are not perused in the present scope. 4. Three leveled systematic FEM thermal stress simulation
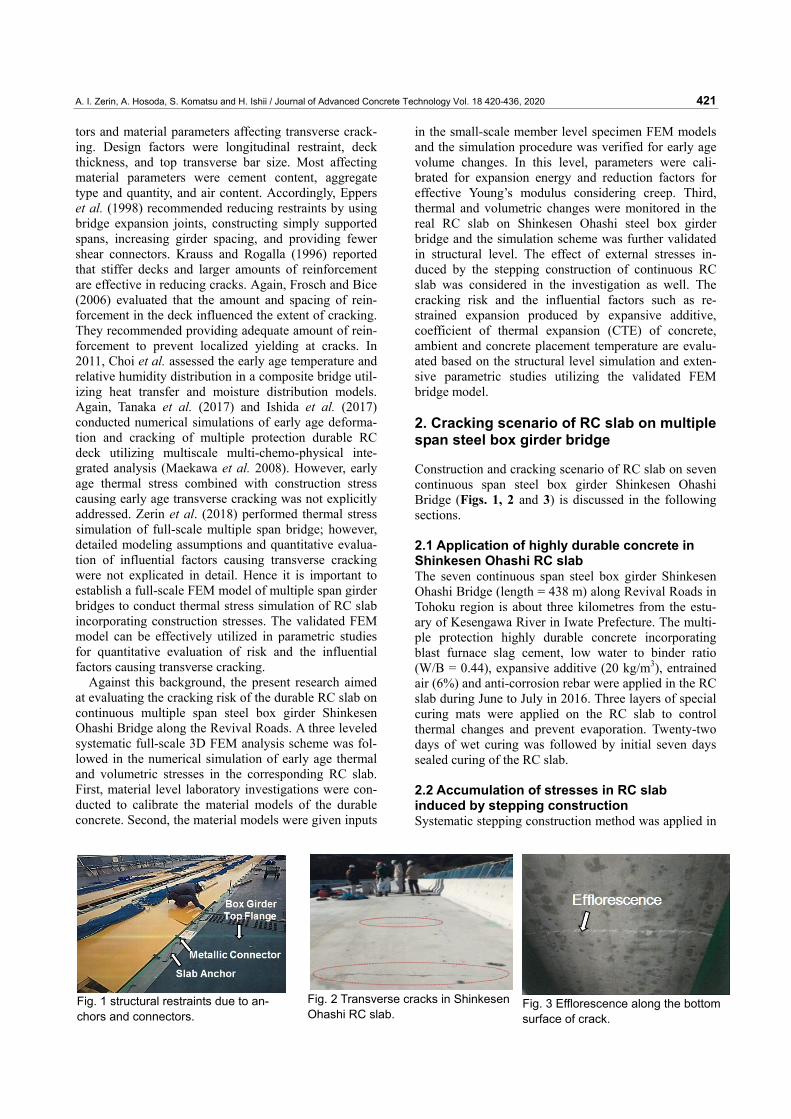
The 3D FEM simulation procedure followed three lev-eled systematic analytical schemes comprising material, member, and full-scale structural levels to simulate early age restrained volume changes in the RC slab on multi-ple span steel box girder Shinkesen Ohashi Bridge. The FEM bridge model is validated with respect to moni-tored temperature, volumetric strains and cracking sce-nario ensuring appropriate thermal and structural boundary conditions along with adopting precise model-ing assumptions. The simulation procedure is illustrated in Fig. 8 and in following sub-sections.
A. I. Zerin, A. Hosoda, S. Komatsu and H. Ishii / Journal of Advanced Concrete Technology Vol. 18 420-436, 2020 424
4.1 Level 1: Laboratory investigations and cali-bration of material models In Level 1, laboratory investigations were performed to calibrate the material models of Shinkesen Ohashi RC slab concrete. The detailed concrete mix design is sum-marized in Table 1 where, C = type B blast furnace slag cement, Ex = expansive additive, S1 = limestone crushed sand, S2 = land sand, G1 = coarse aggregate from crushed lime stone (Ryushin area), G2 = coarse aggregate from crushed lime stone (Waga area), Ad = admixture for achieving workability and AE = air en-training admixture. Time dependent compressive strength and Young’s modulus, setting time and free autogenous shrinkage without expansive additive were measured both under 20°C and 40°C constant room temperature confirming the effect of temperature on concrete properties (Zerin et al. 2018). Adiabatic tem-perature rise of concrete was measured to calibrate the parameters of adiabatic temperature rise model (JCI 2016a). Average value of the coefficient of thermal ex-pansion of the concrete was measured as 8.4 × 10⁻⁶/°C. 4.1.1 Adiabatic temperature rise model JCI 2016a adiabatic temperature rise equation (Eq. (2)) is regressed from the multicomponent model (Shima et al. 2007) for hydration heat of cement. The parameters are formulated as functions of unit cement content and placing temperature.
{ }0,( ) 1 exp ( ) ATSAT QQ t Q r t t∞
⎡ ⎤= − − −⎣ ⎦ (2)
where, Q(t): adiabatic temperature rise at age of t days (°C), Q∞: ultimate adiabatic temperature rise (°C) as a function of unit cement content and initial concrete placement temperature, rAT and SAT: parameters repre-senting the rate of adiabatic temperature rise as func-tions of concrete placement temperature and t0,Q: age of starting of adiabatic temperature rise. The parameters were calibrated based on the laboratory investigation as Q∞ = 56°C, rAT = 1.0 and SAT = 0.85 and t0,Q = 0 day as concrete placing time (Fig. 9(a)). The origin of the time scale is kept same throughout the current analysis scheme. 4.1.2 Strength developmemt model Time dependent compressive strength of concrete can be determined by Eq. (3) where concrete age, tempera-ture dependence, cement type and water-to-cement ratio are considered. Splitting tensile strength and Young’s modulus of concrete are determined by Eqs. (4) and (5) respectively (JCI 2016a).
( ) ( ) ( )e fc e c n
e f
t Sf t f t
a b t S
−′ ′=
+ ⋅ − (3)
Table 1. Concrete mix proportion of Shinkesen Ohashi Bridge RC slab. Unit Weight (kg/m3) W/B
% s/a %
Air % W C Ex S1 S2 G1 G2 Ad AE
44 37.8 6 160 344 20 334 328 558 554 2.18 0.1
Fig. 8 The schematic diagram of three leveled systematic FEM simulation procedure.
A. I. Zerin, A. Hosoda, S. Komatsu and H. Ishii / Journal of Advanced Concrete Technology Vol. 18 420-436, 2020 425
( ) ( ) 2
1C
t e c ef t C f t′= × (4)
( ) ( ) 4
3C
c e c eE t C f t′= × (5)
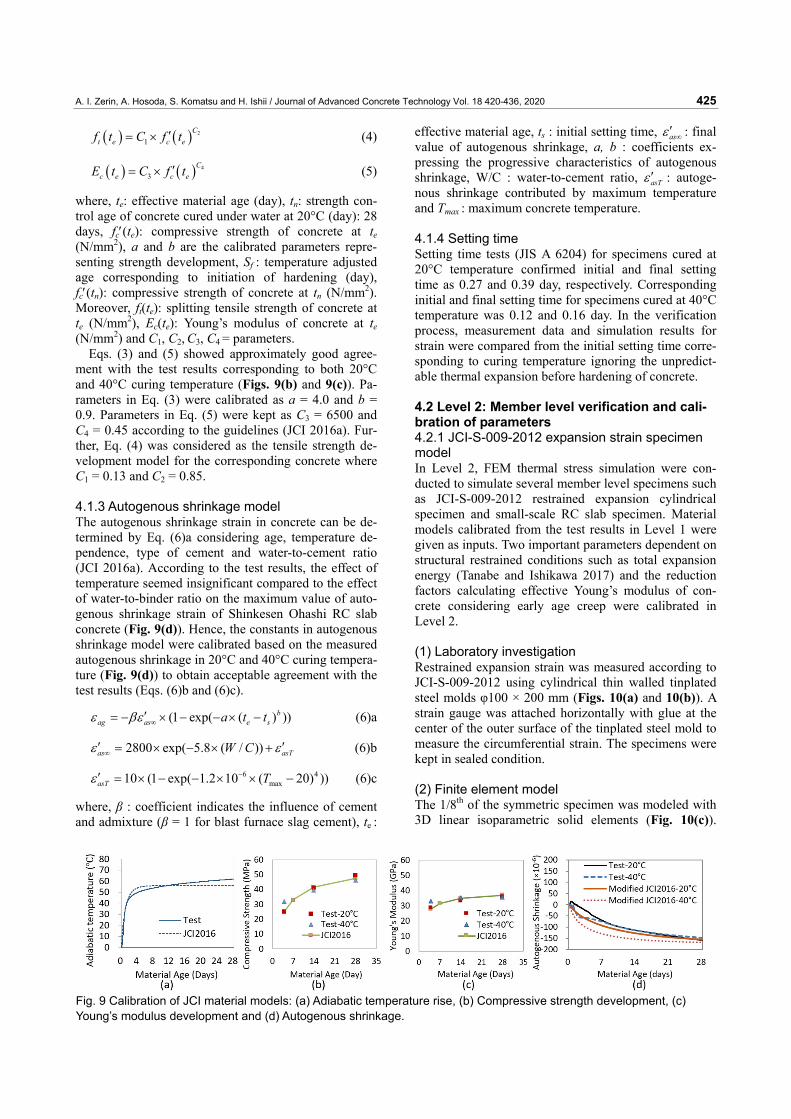
where, te: effective material age (day), tn: strength con-trol age of concrete cured under water at 20°C (day): 28 days, fc′(te): compressive strength of concrete at te (N/mm2), a and b are the calibrated parameters repre-senting strength development, Sf : temperature adjusted age corresponding to initiation of hardening (day), fc′(tn): compressive strength of concrete at tn (N/mm2). Moreover, ft(te): splitting tensile strength of concrete at te (N/mm2), Ec(te): Young’s modulus of concrete at te (N/mm2) and C1, C2, C3, C4 = parameters.
Eqs. (3) and (5) showed approximately good agree-ment with the test results corresponding to both 20°C and 40°C curing temperature (Figs. 9(b) and 9(c)). Pa-rameters in Eq. (3) were calibrated as a = 4.0 and b = 0.9. Parameters in Eq. (5) were kept as C3 = 6500 and C4 = 0.45 according to the guidelines (JCI 2016a). Fur-ther, Eq. (4) was considered as the tensile strength de-velopment model for the corresponding concrete where C1 = 0.13 and C2 = 0.85.
4.1.3 Autogenous shrinkage model The autogenous shrinkage strain in concrete can be de-termined by Eq. (6)a considering age, temperature de-pendence, type of cement and water-to-cement ratio (JCI 2016a). According to the test results, the effect of temperature seemed insignificant compared to the effect of water-to-binder ratio on the maximum value of auto-genous shrinkage strain of Shinkesen Ohashi RC slab concrete (Fig. 9(d)). Hence, the constants in autogenous shrinkage model were calibrated based on the measured autogenous shrinkage in 20°C and 40°C curing tempera-ture (Fig. 9(d)) to obtain acceptable agreement with the test results (Eqs. (6)b and (6)c).
(1 exp( ( ) ))bag as e sa t tε βε ∞′= − × − − × − (6)a
2800 exp( 5.8 ( / ))as asTW Cε ε∞′ ′= × − × + (6)b
6 4max10 (1 exp( 1.2 10 ( 20) ))asT Tε −′ = × − − × × − (6)c
where, β : coefficient indicates the influence of cement and admixture (β = 1 for blast furnace slag cement), te :
effective material age, ts : initial setting time, asε ∞′ : final value of autogenous shrinkage, a, b : coefficients ex-pressing the progressive characteristics of autogenous shrinkage, W/C : water-to-cement ratio, asTε ′ : autoge-nous shrinkage contributed by maximum temperature and Tmax : maximum concrete temperature. 4.1.4 Setting time Setting time tests (JIS A 6204) for specimens cured at 20°C temperature confirmed initial and final setting time as 0.27 and 0.39 day, respectively. Corresponding initial and final setting time for specimens cured at 40°C temperature was 0.12 and 0.16 day. In the verification process, measurement data and simulation results for strain were compared from the initial setting time corre-sponding to curing temperature ignoring the unpredict-able thermal expansion before hardening of concrete. 4.2 Level 2: Member level verification and cali-bration of parameters 4.2.1 JCI-S-009-2012 expansion strain specimen model In Level 2, FEM thermal stress simulation were con-ducted to simulate several member level specimens such as JCI-S-009-2012 restrained expansion cylindrical specimen and small-scale RC slab specimen. Material models calibrated from the test results in Level 1 were given as inputs. Two important parameters dependent on structural restrained conditions such as total expansion energy (Tanabe and Ishikawa 2017) and the reduction factors calculating effective Young’s modulus of con-crete considering early age creep were calibrated in Level 2. (1) Laboratory investigation Restrained expansion strain was measured according to JCI-S-009-2012 using cylindrical thin walled tinplated steel molds φ100 × 200 mm (Figs. 10(a) and 10(b)). A strain gauge was attached horizontally with glue at the center of the outer surface of the tinplated steel mold to measure the circumferential strain. The specimens were kept in sealed condition. (2) Finite element model The 1/8th of the symmetric specimen was modeled with 3D linear isoparametric solid elements (Fig. 10(c)).
Fig. 9 Calibration of JCI material models: (a) Adiabatic temperature rise, (b) Compressive strength development, (c) Young’s modulus development and (d) Autogenous shrinkage.

A. I. Zerin, A. Hosoda, S. Komatsu and H. Ishii / Journal of Advanced Concrete Technology Vol. 18 420-436, 2020 426
Since the concrete inside the steel mold produces radial compressive stress and circumferential tensile stress against the mold due to the expansion of concrete, per-fect bond was considered between the concrete and the mold. 2D heat element was applied upon the outer sur-face of the steel mold and the top surface of the concrete. Moreover, mesh sensitivity analysis was performed to confirm the appropriate mesh sizes of the model. (3) Thermal Analysis Adiabatic temperature rise model (Eq. (2)) with cali-brated parameters was applied in thermal analysis both for 20°C and 40°C curing conditions. Concrete place-ment temperatures were 20°C and 35°C for 20°C and 40°C curing conditions, respectively. Since the speci-mens were kept in the curing room with constant tem-perature, there was no influence of the natural wind flow. Accordingly, heat transfer coefficient was set as 6.0 W/m2ºC for the steel mold and 8.0 W/m2ºC for top sur-face of the concrete sealed by a cellophane plastic sheet. The input properties for thermal analysis i.e. heat con-ductivity, specific heat, density of concrete, steel mold and steel reinforcing bars are described in Table 2.
(4) Stress analysis and calibration of parameters JCI 2016 time dependent models for compressive strength, tensile strength, and Young’s modulus (Eqs. (3), (4) and (5)) with calibrated parameters were applied in stress analysis. The free autogenous shrinkage ob-tained from laboratory investigations at 20°C and 40°C room temperature was given as inputs. (a) Calibration of expansion strain energy model In the present research expansion strain model based on the total energy conservation hypothesis (Eq. (7)) pro-posed by Tanabe and Ishikawa (2017) is applied to simulate the expansion strain of concrete based on the test investigation results.
0( ) (1 exp( ( ) ))be eU t U a t t∞= − − − (7)
where, U(te): total energy at effective concrete age te (N/mm2), U∞ : ultimate value of the total energy (N/mm2), a and b : coefficient indicating the influence of the type of cement on the progressive characteristics of total energy, to : effective material age at the begin-ning of expansion. Parameters for expansion strain en-ergy model (Eq. (7)) were calibrated as U∞ = 100 × 10-6 N/mm2, a = 1.5, b = 1 based on the average of the ex-perimental results. (b) Confirmation of reduction factors for effective Young’s modulus The creep effect is considered by calculating the effec-tive Young’s modulus as a product of Young’s modulus of concrete and a reduction factor as shown in Eq. (8).
( ) ( ) ( )e e e c eE t t E tϕ= × (8)
where, Ee(te): effective Young’s modulus at te (N/mm2),
Table 2. Input thermal and mechanical properties.
Thermal Properties Concrete Steel mold / Steel bar
Heat Conductivity (W/m°C) 2.7 43 Specific Heat (kJ/kg°C) 1.15 0.47 Density (kg/m3) 2300 7890 Young’s Modulus (MPa) JCI2016 2x10⁵ Poisson’s Ratio 0.2 0.3
Fig.10 Experiment and simulation of JCI-S-009-2012 expansion strain cylindrical specimen.
A. I. Zerin, A. Hosoda, S. Komatsu and H. Ishii / Journal of Advanced Concrete Technology Vol. 18 420-436, 2020 427
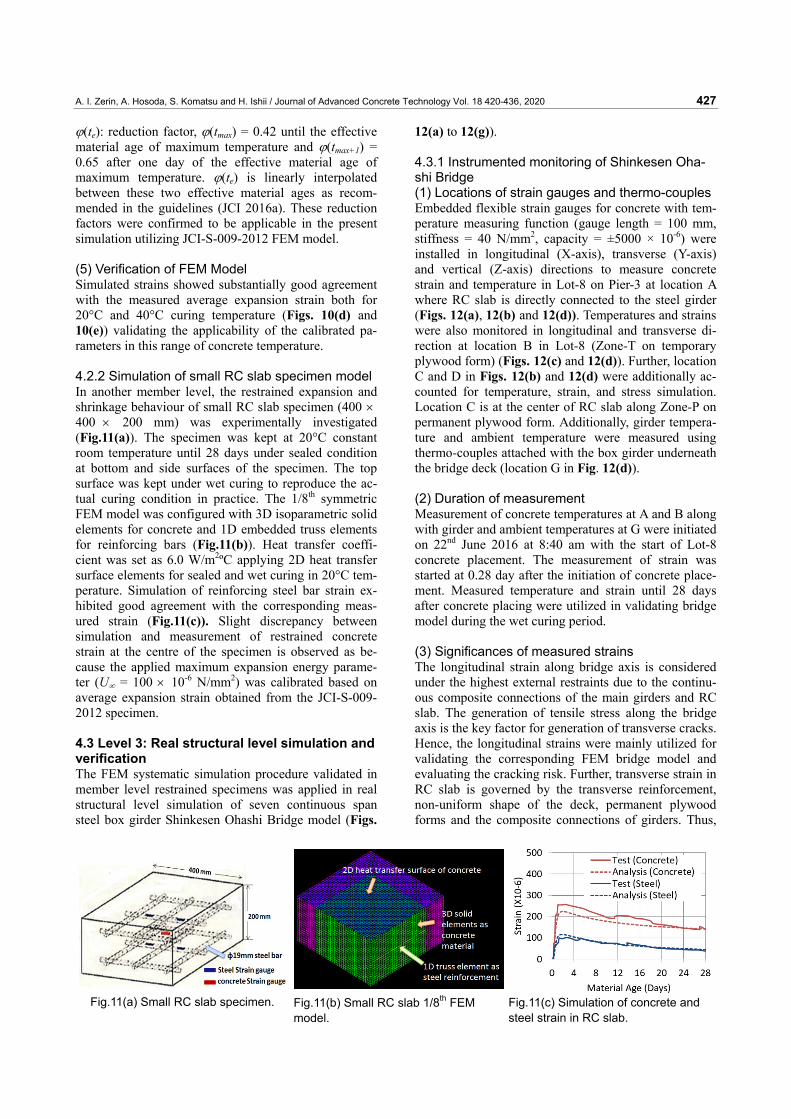
ϕ(te): reduction factor, ϕ(tmax) = 0.42 until the effective material age of maximum temperature and ϕ(tmax+1) = 0.65 after one day of the effective material age of maximum temperature. ϕ(te) is linearly interpolated between these two effective material ages as recom-mended in the guidelines (JCI 2016a). These reduction factors were confirmed to be applicable in the present simulation utilizing JCI-S-009-2012 FEM model. (5) Verification of FEM Model Simulated strains showed substantially good agreement with the measured average expansion strain both for 20°C and 40°C curing temperature (Figs. 10(d) and 10(e)) validating the applicability of the calibrated pa-rameters in this range of concrete temperature. 4.2.2 Simulation of small RC slab specimen model In another member level, the restrained expansion and shrinkage behaviour of small RC slab specimen (400 × 400 × 200 mm) was experimentally investigated (Fig.11(a)). The specimen was kept at 20°C constant room temperature until 28 days under sealed condition at bottom and side surfaces of the specimen. The top surface was kept under wet curing to reproduce the ac-tual curing condition in practice. The 1/8th symmetric FEM model was configured with 3D isoparametric solid elements for concrete and 1D embedded truss elements for reinforcing bars (Fig.11(b)). Heat transfer coeffi-cient was set as 6.0 W/m2ºC applying 2D heat transfer surface elements for sealed and wet curing in 20°C tem-perature. Simulation of reinforcing steel bar strain ex-hibited good agreement with the corresponding meas-ured strain (Fig.11(c)). Slight discrepancy between simulation and measurement of restrained concrete strain at the centre of the specimen is observed as be-cause the applied maximum expansion energy parame-ter (U∞ = 100 × 10-6 N/mm2) was calibrated based on average expansion strain obtained from the JCI-S-009-2012 specimen. 4.3 Level 3: Real structural level simulation and verification The FEM systematic simulation procedure validated in member level restrained specimens was applied in real structural level simulation of seven continuous span steel box girder Shinkesen Ohashi Bridge model (Figs.
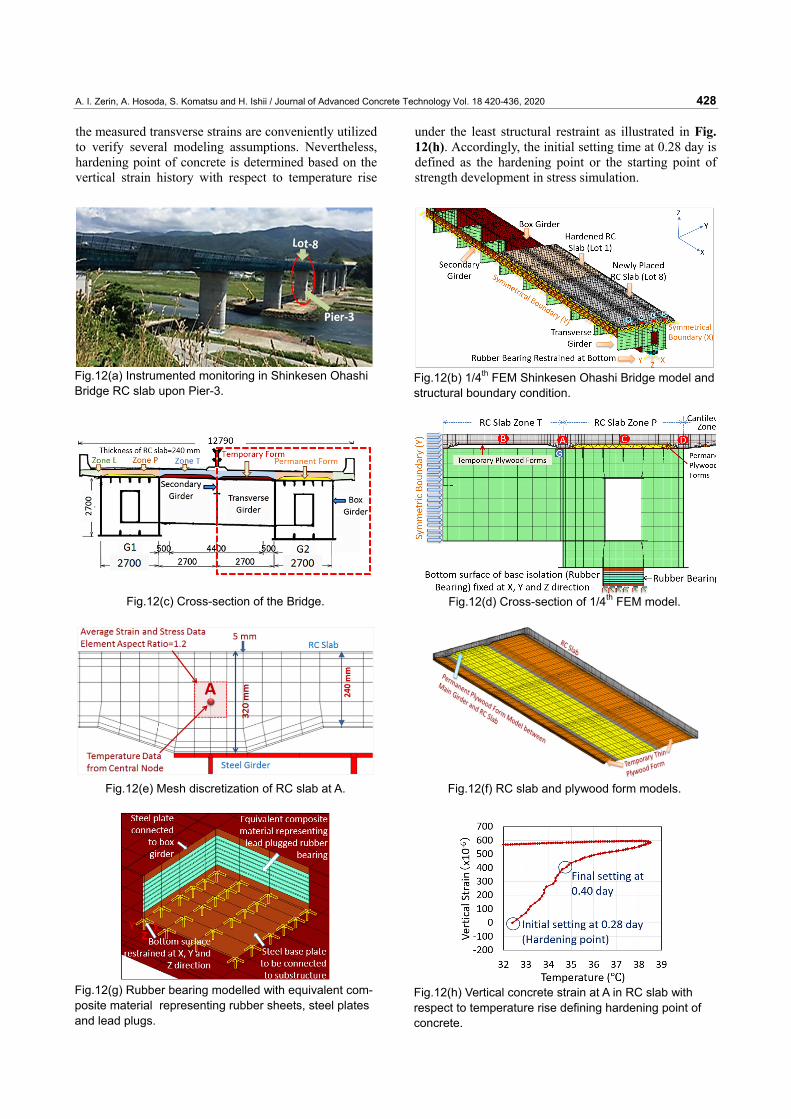
12(a) to 12(g)). 4.3.1 Instrumented monitoring of Shinkesen Oha-shi Bridge (1) Locations of strain gauges and thermo-couples Embedded flexible strain gauges for concrete with tem-perature measuring function (gauge length = 100 mm, stiffness = 40 N/mm2, capacity = ±5000 × 10-6) were installed in longitudinal (X-axis), transverse (Y-axis) and vertical (Z-axis) directions to measure concrete strain and temperature in Lot-8 on Pier-3 at location A where RC slab is directly connected to the steel girder (Figs. 12(a), 12(b) and 12(d)). Temperatures and strains were also monitored in longitudinal and transverse di-rection at location B in Lot-8 (Zone-T on temporary plywood form) (Figs. 12(c) and 12(d)). Further, location C and D in Figs. 12(b) and 12(d) were additionally ac-counted for temperature, strain, and stress simulation. Location C is at the center of RC slab along Zone-P on permanent plywood form. Additionally, girder tempera-ture and ambient temperature were measured using thermo-couples attached with the box girder underneath the bridge deck (location G in Fig. 12(d)). (2) Duration of measurement Measurement of concrete temperatures at A and B along with girder and ambient temperatures at G were initiated on 22nd June 2016 at 8:40 am with the start of Lot-8 concrete placement. The measurement of strain was started at 0.28 day after the initiation of concrete place-ment. Measured temperature and strain until 28 days after concrete placing were utilized in validating bridge model during the wet curing period. (3) Significances of measured strains The longitudinal strain along bridge axis is considered under the highest external restraints due to the continu-ous composite connections of the main girders and RC slab. The generation of tensile stress along the bridge axis is the key factor for generation of transverse cracks. Hence, the longitudinal strains were mainly utilized for validating the corresponding FEM bridge model and evaluating the cracking risk. Further, transverse strain in RC slab is governed by the transverse reinforcement, non-uniform shape of the deck, permanent plywood forms and the composite connections of girders. Thus,
Fig.11(a) Small RC slab specimen. Fig.11(b) Small RC slab 1/8th FEM model.
Fig.11(c) Simulation of concrete and steel strain in RC slab.
A. I. Zerin, A. Hosoda, S. Komatsu and H. Ishii / Journal of Advanced Concrete Technology Vol. 18 420-436, 2020 428
the measured transverse strains are conveniently utilized to verify several modeling assumptions. Nevertheless, hardening point of concrete is determined based on the vertical strain history with respect to temperature rise
under the least structural restraint as illustrated in Fig. 12(h). Accordingly, the initial setting time at 0.28 day is defined as the hardening point or the starting point of strength development in stress simulation.
Fig.12(a) Instrumented monitoring in Shinkesen Ohashi Bridge RC slab upon Pier-3.
Fig.12(b) 1/4th FEM Shinkesen Ohashi Bridge model and structural boundary condition.
Fig.12(c) Cross-section of the Bridge. Fig.12(d) Cross-section of 1/4th FEM model.
Fig.12(e) Mesh discretization of RC slab at A.
Fig.12(f) RC slab and plywood form models.
Fig.12(g) Rubber bearing modelled with equivalent com-posite material representing rubber sheets, steel plates and lead plugs.
Fig.12(h) Vertical concrete strain at A in RC slab with respect to temperature rise defining hardening point of concrete.
A. I. Zerin, A. Hosoda, S. Komatsu and H. Ishii / Journal of Advanced Concrete Technology Vol. 18 420-436, 2020 429
4.3.2 Full-scale FEM modeling of Shinkesen Oha-shi Bridge (1) Modeling of bridge components and structural boundary conditions Full scale Shinkesen Ohashi Bridge FEM model con-sists of RC deck slab, main box girders, secondary gird-ers, transverse girders, permanent and temporary ply-wood forms, and rubber bearing (Figs. 12(b) to 12(g)). Approximately 1/4th of the bridge is modeled with symmetric structural and thermal boundary conditions considering multiple spans. The unique modeling ap-proaches were adopted for lead plugged rubber bearings and plywood forms for accurate simulation of thermal and volumetric behaviour of the bridge model. Thermal and mechanical properties of different component mate-rials are summarized in Table 3. The modeling aspects of different components of Shinkesen Ohashi Bridge are described as below. (a) RC slab and mesh discretization The newly placed Lot-8 slab concrete was modeled with 3D hexahedral isoparametric heat generating solid ele-ments. Previously placed hardened Lot-1 concrete was modeled as the 3D non-heat generating solid elements. As shown in Fig. 12(e), the thickness of slab elements at top and bottom heat transfer and heat conduction sur-faces were finer (5 mm) compared to those at the center of slab to ensure accurate thermal analysis. Temperature simulation was performed at nodal points. Conversely, normal stress is calculated as the average of the stresses at two integral points in each element. Hence, the aspect ratio of the elements at the central part of RC slab along thickness direction was kept 1.2 at location A and D. The maximum aspect ratio was 3.2 at locations B and C to obtain satisfactory results regarding stress analysis. (b) Steel reinforcement The embedded steel reinforcements in RC slab along longitudinal and transverse directions were modeled with 1D embedded truss elements. The minimum and maximum steel reinforcement ratio of the RC slab were 1.32% and 2.4% along Zone-P (on permanent form in Fig. 12(c)) in the mid-span and on the supports, respec-tively. (c) Steel girders Main box girders, transverse girders, and secondary girders in Figs. 12(b) and 12(d) are modeled with non-heat generating 3D solid elements. The connection be-tween the steel girder and the RC slab is considered as
perfect bond representing the effect of shear connectors and slab anchors. (d) Permanent and temporary plywood forms Permanent plywood forms between RC slab and main girders and temporary plywood forms underneath the RC slab are modeled as non-heat generating 3D solid elements considering perfect bond (Figs. 12(c), 12(d) and 12(f)) with appropriate thermal and mechanical properties. As the Young’s modulus of plywood is sig-nificantly smaller than that of concrete after hardening, it is supposed that the modeling of plywood forms con-sidering perfect bond will not generate any substantial stress in RC slab. (e) Rubber bearing Multilayer rubber bearings with alternately piled up rubber and steel plates along with lead plugs installed at bridge supports were modeled with three consecutive sections (Fig. 12(g)). The top steel plate is connected to the bottom surface of the box girder. The bottom steel plate is restrained in longitudinal, transverse, and verti-cal axes at the bottom surface reproducing the real con-nections of the rubber bearing to the substructure (bridge pier). The middle section is modeled with sev-eral layers of elements incorporating the lower bound of equivalent composite properties based on the rule of mixture for composite materials (Alger 1997) as Eq. (9). The thermal and mechanical properties of multilayered rubber sheets, steel plates and lead plugs were used to estimate the composite properties ensuring appropriate movement of the girders due to the thermal changes.
( / / / )C R R S S L LM f M f M f M= + + (9)
where, MC = equivalent composite material property. MR, MS and ML represent the thermal and mechanical proper-ties of rubber sheet, steel plate and lead plug respec-tively. Similarly, fR, fS and fL represent the volume frac-tions of rubber sheet, steel plate and lead plug, respec-tively. (2) Thermal boundary conditions (a) Heat transfer surfaces Heat transfer surfaces were defined by applying 2D heat elements upon 3D solid elements of the FEM model. Heat transfer coefficients were determined based on the parametric studies considering site exposures, curing method, curing duration, formwork type and wind flow
Table 3 Thermal and mechanical input properties of different material components.
Thermal Properties Heat generating
Concrete (Lot 8)
Hardened Concrete (Lot 1)
Steel Girder/Steel Bar Plywood Composite
Rubber Bearing
Heat Conductivity (W/m°C) 2.7 2.7 43 0.13 0.42 Specific Heat (kJ/kg°C) 1.15 1.15 0.47 1.22 0.51
Density (kg/m3) 2300 2300 7890 546 4250 Young’s Modulus (MPa) JCI2016 35000 200000 13000 3
Poisson’s Ratio 0.2 0.2 0.3 0.3 0.37 CTE (x10-6/°C) 8.4 8.4 10 4.5 18
Initial temperature (°C) 25.3 18.4 18.4 18.4 18.4

A. I. Zerin, A. Hosoda, S. Komatsu and H. Ishii / Journal of Advanced Concrete Technology Vol. 18 420-436, 2020 430
conditions. As shown in Fig. 13(a), heat transfer coeffi-cient of the top surface of RC slab with three layered special curing mats is defined as 6.0 W/m2/°C. Exterior surface of the girders were considered to be exposed to wind flow, hence the corresponding heat transfer coeffi-cient was defined as 14.0 W/m2/°C. As the wind flow was obstructed inside the box girder, heat transfer coef-ficient of the interior surface of the box girder was con-sidered 12.0 W/m2/°C. The temporary plywood form underneath the RC slab was precisely modeled consid-ering appropriate thermal properties. The corresponding heat transfer coefficient was defined as 12.0 W/m2/°C based on the parametric study. (b) Input ambient temperature The ambient and the girder temperatures were recorded inside the main girder at location G (Fig. 12(d)). The radiation effect caused by direct sunlight was observed in the measured RC slab concrete temperature in com-parison to the girder temperature (Fig. 13(b)). The aver-age peak temperature difference was 7°C between the girder temperature and the RC slab temperature. Con-sidering the radiation effect in the daytime, measured ambient temperature was calibrated to apply on the top surface of RC slab ensuring realistic temperature simu-lation (Fig. 13(c)). However, the measured ambient temperature was applied on other heat transfer surfaces such as exterior and interior surfaces of the girders as well as the bottom surfaces of the temporary plywood forms replicating real site conditions (Fig. 13(d)). (3) Thermal and Stress analysis inputs Thermal analysis of the FEM bridge model was per-formed based on the adiabatic temperature rise model of
concrete inputting parameters calibrated in Level 1. Thermal analysis is followed by the stress analysis. Hence, material models calibrated in Level 1 and Level 2 were given as inputs in stress module. Other input properties for thermal analysis (heat conductivity, spe-cific heat, density and initial temperature) and for stress analysis (Young’s modulus, Poison’s ratio and CTE cor-responding to concrete, steel, plywood forms and com-posite rubber bearings) are described in Table 3. (4) Starting point of simulation The measurement data prior to hardening of concrete incorporate substantially large strains and comparatively smaller stresses because of the plastic nature and a very large coefficient of thermal expansion. Therefore, the starting point of the strain measurement was defined as the starting point of hardening that could be equivalent to the initial setting time observed in the vertical strain history (Fig. 12(h)). Although thermal and stress analy-ses are initiated considering the starting time of concrete placement, strength development, autogenous shrinkage and expansion strain in stress simulation was considered from 0.28 day of material age. The simulated thermal strain until the material age of 0.28 day is deducted from the simulated total strain in verification process. (5) Validations of Shinkesen Ohashi Bridge FEM model The full-scale FEM model was validated based on the instrumented monitoring and the simulation results at different locations affecting generation and propagation of cracks in the RC slab as discussed below:
Fig.13 Thermal boundary conditions applied in Shinkesen Ohashi Bridge FEM model.
A. I. Zerin, A. Hosoda, S. Komatsu and H. Ishii / Journal of Advanced Concrete Technology Vol. 18 420-436, 2020 431
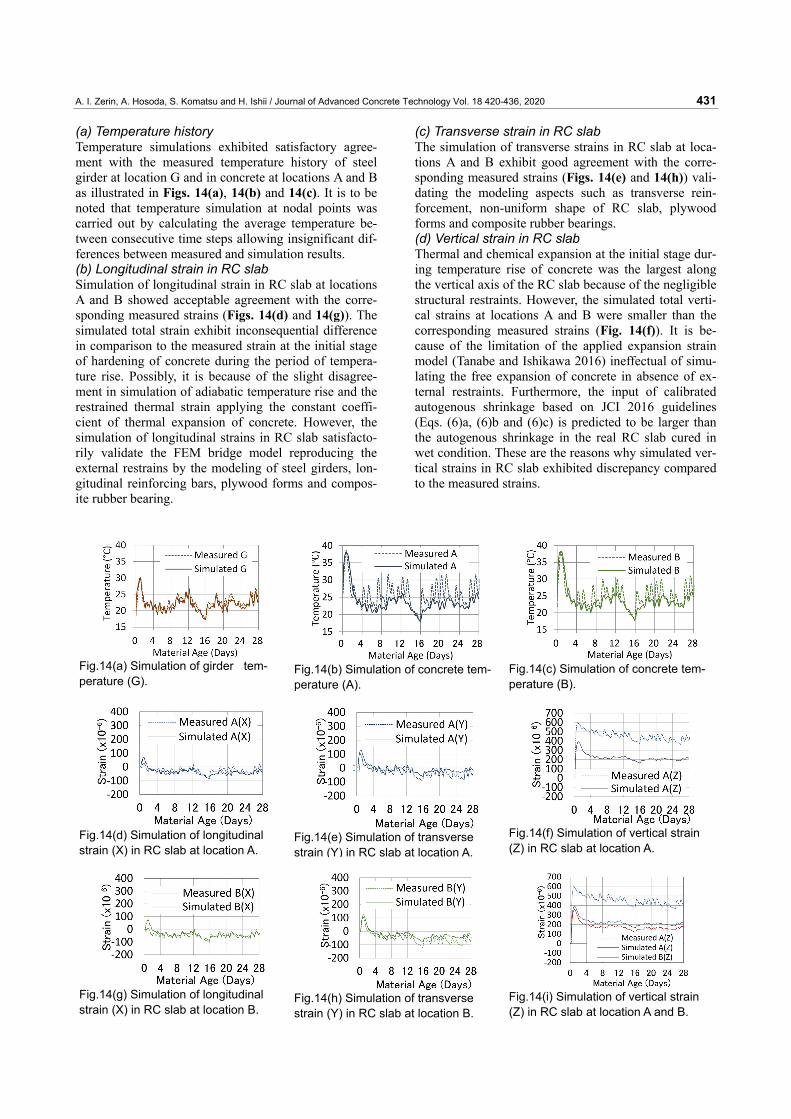
(a) Temperature history Temperature simulations exhibited satisfactory agree-ment with the measured temperature history of steel girder at location G and in concrete at locations A and B as illustrated in Figs. 14(a), 14(b) and 14(c). It is to be noted that temperature simulation at nodal points was carried out by calculating the average temperature be-tween consecutive time steps allowing insignificant dif-ferences between measured and simulation results. (b) Longitudinal strain in RC slab Simulation of longitudinal strain in RC slab at locations A and B showed acceptable agreement with the corre-sponding measured strains (Figs. 14(d) and 14(g)). The simulated total strain exhibit inconsequential difference in comparison to the measured strain at the initial stage of hardening of concrete during the period of tempera-ture rise. Possibly, it is because of the slight disagree-ment in simulation of adiabatic temperature rise and the restrained thermal strain applying the constant coeffi-cient of thermal expansion of concrete. However, the simulation of longitudinal strains in RC slab satisfacto-rily validate the FEM bridge model reproducing the external restrains by the modeling of steel girders, lon-gitudinal reinforcing bars, plywood forms and compos-ite rubber bearing.
(c) Transverse strain in RC slab The simulation of transverse strains in RC slab at loca-tions A and B exhibit good agreement with the corre-sponding measured strains (Figs. 14(e) and 14(h)) vali-dating the modeling aspects such as transverse rein-forcement, non-uniform shape of RC slab, plywood forms and composite rubber bearings. (d) Vertical strain in RC slab Thermal and chemical expansion at the initial stage dur-ing temperature rise of concrete was the largest along the vertical axis of the RC slab because of the negligible structural restraints. However, the simulated total verti-cal strains at locations A and B were smaller than the corresponding measured strains (Fig. 14(f)). It is be-cause of the limitation of the applied expansion strain model (Tanabe and Ishikawa 2016) ineffectual of simu-lating the free expansion of concrete in absence of ex-ternal restraints. Furthermore, the input of calibrated autogenous shrinkage based on JCI 2016 guidelines (Eqs. (6)a, (6)b and (6)c) is predicted to be larger than the autogenous shrinkage in the real RC slab cured in wet condition. These are the reasons why simulated ver-tical strains in RC slab exhibited discrepancy compared to the measured strains.
Fig.14(a) Simulation of girder tem-perature (G).
Fig.14(b) Simulation of concrete tem-perature (A).
Fig.14(c) Simulation of concrete tem-perature (B).
Fig.14(d) Simulation of longitudinal strain (X) in RC slab at location A.
Fig.14(e) Simulation of transverse strain (Y) in RC slab at location A.
Fig.14(f) Simulation of vertical strain (Z) in RC slab at location A.
Fig.14(g) Simulation of longitudinal strain (X) in RC slab at location B.
Fig.14(h) Simulation of transverse strain (Y) in RC slab at location B.
Fig.14(i) Simulation of vertical strain (Z) in RC slab at location A and B.
A. I. Zerin, A. Hosoda, S. Komatsu and H. Ishii / Journal of Advanced Concrete Technology Vol. 18 420-436, 2020 432
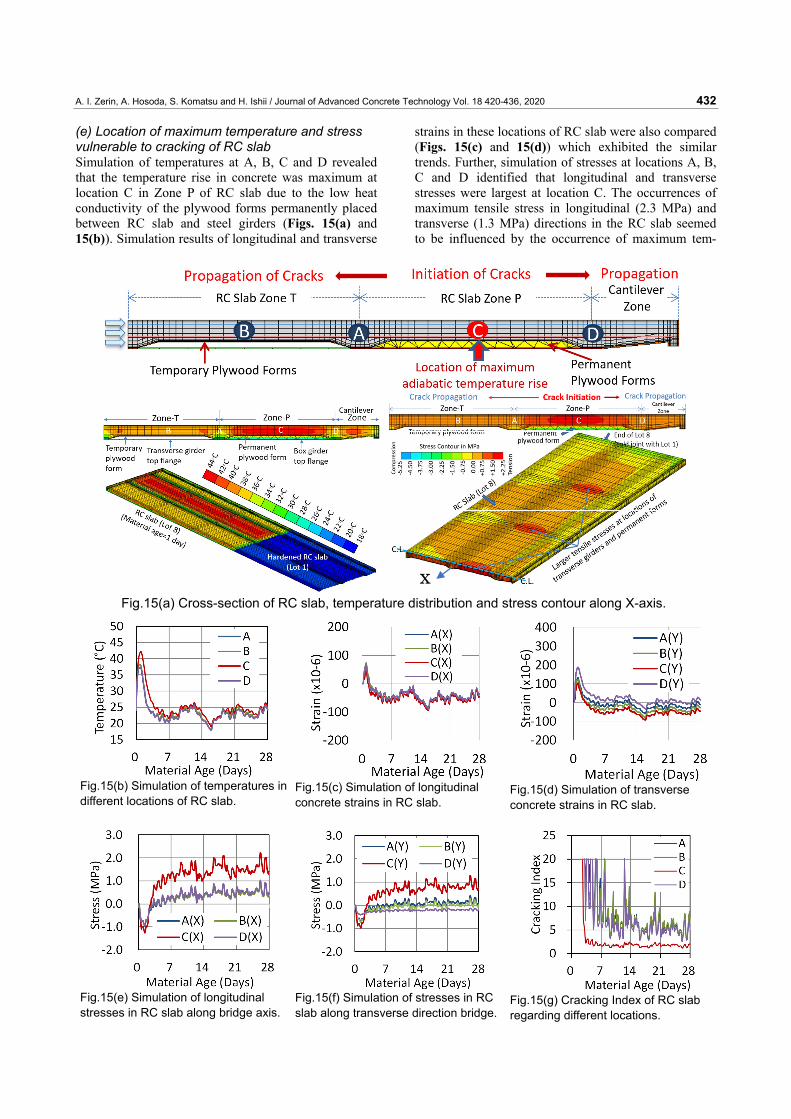
(e) Location of maximum temperature and stress vulnerable to cracking of RC slab Simulation of temperatures at A, B, C and D revealed that the temperature rise in concrete was maximum at location C in Zone P of RC slab due to the low heat conductivity of the plywood forms permanently placed between RC slab and steel girders (Figs. 15(a) and 15(b)). Simulation results of longitudinal and transverse
strains in these locations of RC slab were also compared (Figs. 15(c) and 15(d)) which exhibited the similar trends. Further, simulation of stresses at locations A, B, C and D identified that longitudinal and transverse stresses were largest at location C. The occurrences of maximum tensile stress in longitudinal (2.3 MPa) and transverse (1.3 MPa) directions in the RC slab seemed to be influenced by the occurrence of maximum tem-
x
Fig.15(a) Cross-section of RC slab, temperature distribution and stress contour along X-axis.
Fig.15(b) Simulation of temperatures in different locations of RC slab.
Fig.15(c) Simulation of longitudinal concrete strains in RC slab.
Fig.15(d) Simulation of transverse concrete strains in RC slab.
Fig.15(e) Simulation of longitudinal stresses in RC slab along bridge axis.
Fig.15(f) Simulation of stresses in RC slab along transverse direction bridge.
Fig.15(g) Cracking Index of RC slab regarding different locations.
A. I. Zerin, A. Hosoda, S. Komatsu and H. Ishii / Journal of Advanced Concrete Technology Vol. 18 420-436, 2020 433
perature in concrete at location C in Zone P (Figs. 15(a), 15(e) and 15(f)). Again, the cracking index (CI) was considerably low at location C (lowest CI = 1.2 at 26th day of material age) increasing the risk of cracking compared to those at locations A, B, and D as illustrated in Fig. 15(g).
According to Fig. 4, maximum stepping construction stress was estimated as 1.0 MPa in Lot-1. Cracking in-dex is supposed to be decreased significantly (CI < 1.0) when 1.0 MPa stepping construction stress is imposed to the RC slab. Therefore, early age thermal stress simu-lation of Shinkesen Ohashi Bridge FEM model con-firmed that transverse cracks were initiated primarily along Zone P on permanent plywood form as observed in Fig. 7 owing to the large tensile stresses caused by thermal and volumetric changes of the RC slab where cumulative tensile stresses due to the stepping construc-tion were large. However, the minimum reinforcement ratio (1.32%) used in RC slab is supposed to be ade-quate to prevent local yielding of reinforcement control-ling excessive widening of cracks. Eventually, the mul-tiple span steel box girder full-scale FEM bridge model has been successfully verified in structural level regard-ing temperature, strains and occurrence of cracks through incorporating calibrated material models and parameters, appropriate structural and thermal boundary conditions as well as the precise modeling of the indi-vidual components of the bridge.
5. Influential factors affecting early age transverse cacking
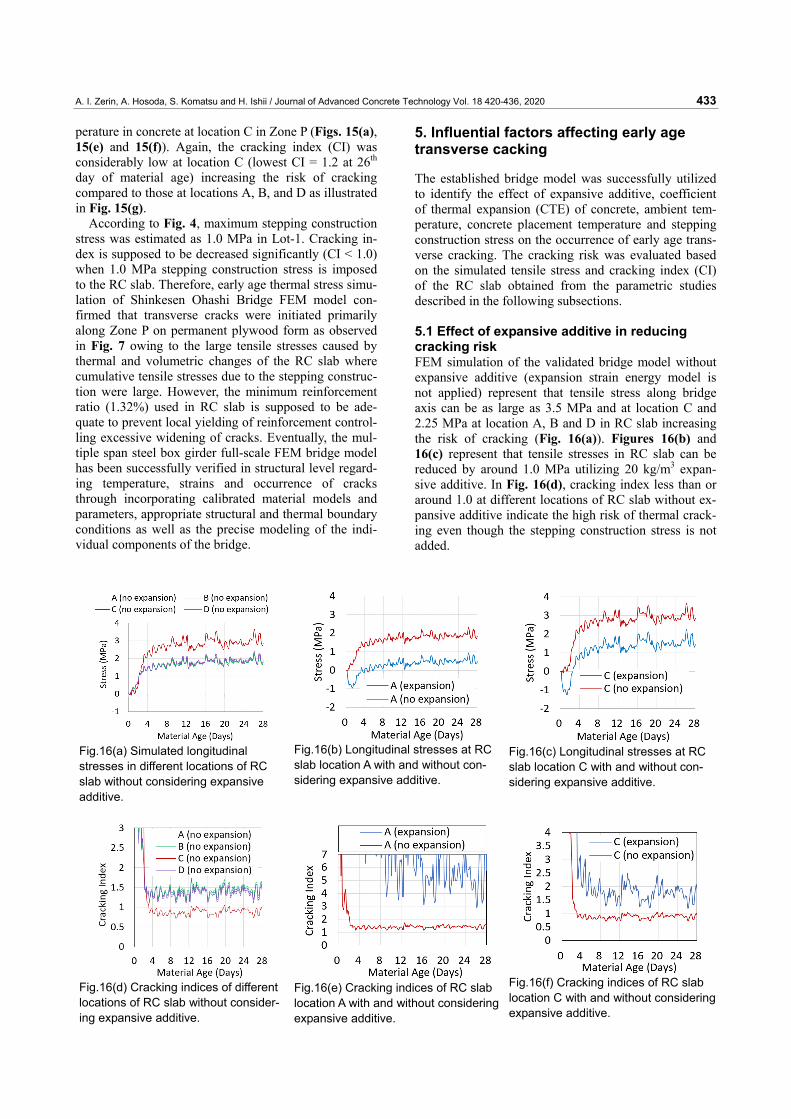
The established bridge model was successfully utilized to identify the effect of expansive additive, coefficient of thermal expansion (CTE) of concrete, ambient tem-perature, concrete placement temperature and stepping construction stress on the occurrence of early age trans-verse cracking. The cracking risk was evaluated based on the simulated tensile stress and cracking index (CI) of the RC slab obtained from the parametric studies described in the following subsections. 5.1 Effect of expansive additive in reducing cracking risk FEM simulation of the validated bridge model without expansive additive (expansion strain energy model is not applied) represent that tensile stress along bridge axis can be as large as 3.5 MPa and at location C and 2.25 MPa at location A, B and D in RC slab increasing the risk of cracking (Fig. 16(a)). Figures 16(b) and 16(c) represent that tensile stresses in RC slab can be reduced by around 1.0 MPa utilizing 20 kg/m3 expan-sive additive. In Fig. 16(d), cracking index less than or around 1.0 at different locations of RC slab without ex-pansive additive indicate the high risk of thermal crack-ing even though the stepping construction stress is not added.
Fig.16(a) Simulated longitudinal stresses in different locations of RC slab without considering expansive additive.
Fig.16(b) Longitudinal stresses at RC slab location A with and without con-sidering expansive additive.
Fig.16(c) Longitudinal stresses at RC slab location C with and without con-sidering expansive additive.
Fig.16(d) Cracking indices of different locations of RC slab without consider-ing expansive additive.
Fig.16(e) Cracking indices of RC slab location A with and without considering expansive additive.
Fig.16(f) Cracking indices of RC slab location C with and without considering expansive additive.

A. I. Zerin, A. Hosoda, S. Komatsu and H. Ishii / Journal of Advanced Concrete Technology Vol. 18 420-436, 2020 434
5.2 Effect of coefficient of thermal expansion of concrete Parametric studies considering different coefficient of thermal expansion (CTE) of concrete proved that CTE larger than 6 × 10⁻⁶/℃ significantly increase the risk of cracking (Figs. 17(a), 17(b) and 17(c)). Further, it is revealed that the effect of CTE in increasing the tensile stress is more prominent at location C (the location of maximum temperature) compared to location A. 5.3 Effect of ambient and concrete placement temperatures Parametric studies are conducted to evaluate the influ-ences of ambient temperature and initial concrete placement temperature considering varying CTE of concrete. Three ambient conditions such as 10℃, 20℃ and 30℃ constant temperatures are applied while con-crete placing temperatures and CTEs are varied corre-spondingly (Figs. 18(a), 18(b) and 18(c)) regarding location C exhibit maximum temperature and lowest cracking index). It is revealed that multiple span steel box girder bridge RC slab is vulnerable to early age thermal cracks (low cracking indices) regardless of am-bient condition, placing temperature when CTE is larger than 6 × 10⁻⁶/℃ because of the higher structural re-straints against volume changes even though expansive additive has been incorporated.
5.4 Effect of stepping construction of RC slab on transverse cracking Simulation of temperature, strain and stress were veri-fied with respect to the measurement data in concrete Lot 8. However, the maximum cumulative tensile stress was estimated as 1.0 MPa occurred in Lot 1 imposed by stepping construction (Fig. 4). Stepping construction stress can be altered depending on the concrete place-ment order arrangement. In this perspective, cracking indices are estimated assuming the maximum cumula-tive tensile stress as 1.0 MPa and added to the simulated thermal stress to visualize the severest condition. In Fig. 19, minimum cracking indices are shifted in vicinity to 1.0 due to the imposed construction stress, even if CTE is as small as 6 × 10⁻⁶/℃ in different ambient and con-crete placement temperatures. It indicates that the risk of cracking in multiple span continuous steel girder bridge increases due to the accumulated tensile stresses induced by the stepping construction. 6. Conclusions
The conclusions of the present research are summarized based on the three aspects described as below: A. Three leveled thermal stress simulation validating
full-scale FEM bridge model The full-scale 3D FEM model of multiple span steel box
Fig.17(a) Simulated longitudinal stresses in RC slab at location A with respect to different CTE of concrete.
Fig.17(b) Simulated longitudinal stresses in RC slab at location C with respect to different CTE of concrete.
Fig.17(c) Cracking indices in RC slab at location C with respect to different CTE of concrete.
Fig.18(a) Effect of concrete placement temperature and CTE on cracking in-dex at location C at 10℃ ambient tem-perature.
Fig.18(b) Effect of concrete placement temperature and CTE on cracking in-dex at location C at 20℃ ambient tem-perature.
Fig.18(c) Effect of concrete placement temperature and CTE on cracking in-dex at location C at 30℃ ambient tem-perature.

A. I. Zerin, A. Hosoda, S. Komatsu and H. Ishii / Journal of Advanced Concrete Technology Vol. 18 420-436, 2020 435
girder bridge is successfully established and verified with respect to monitored temperature, volumetric strains and cracking scenario of the RC slab. The time dependent concrete strength and autogenous shrinkage models calibrated in material level, expansion energy parameters and reduction factors for creep established in member level and detailed modeling of the individual bridge components with appropriate structural and ther-mal boundary conditions in real structural level are the key factors for obtaining good agreements in FEM thermal stress simulation. B. Evaluation of cracking mechanism in Shinkesen
Ohashi durable RC slab (1) Simulation of temperature utilizing the validated
model identify that the temperature rise in concrete seems maximum in RC slab upon permanent forms owing to the low heat conductivity of plywood exist-ing between RC slab and box girders.
(2) Simulation of stresses reveal that longitudinal and transverse stresses due to the restrained thermal and volumetric changes are the largest in RC slab on permanent forms along main girders. Accordingly, estimated cracking indices are considerably low (C.I. = 1.2) intensifying the risk of cracking in RC slab on permanent forms as compared to the other locations.
(3) Eventually, early age thermal stress simulation of the FEM bridge model confirms that transverse cracks were initiated primarily along main girders on per-manent form induced by large tensile stresses in consequence of the restrained thermal and volumet-ric changes of RC slab where cumulative tensile stress due to the stepping construction was large. However, the applied minimum reinforcement ratio (1.32%) in the RC slab is considered adequate in controlling the crack width.
C. Parametric studies confirming significant influencial factors for transverse cracking
(1) Cracking indices of the RC slab without using ex-pansive additive are significantly low (CI ≤ 1.0) in-dicating the high vulnerability to early age thermal cracking. Simulation results imply that tensile stress in RC slab is reduced by around 1.0 MPa utilizing 20 kg/m3 expansive additive. Therefore, it can be conferred that the multiple protection durable con-crete utilizing expansive additive has effectively re-duced the extent and risk of cracking.
(2) Coefficient of thermal expansion larger than 6 × 10⁻⁶/℃
significantly increases the risk of cracking in RC slabs. It is revealed that the effect of CTE in increas-ing the tensile stress is more prominent in RC slab zone upon permanent plywood forms.
(3) Parametric studies based on different ambient tem-peratures, concrete placing temperatures and varying CTEs of concrete signify that multiple span steel box girder bridge RC slab especially along main girders upon permanent form is vulnerable to early age thermal cracks regardless of ambient conditions and placing temperatures when CTE is larger than 6 × 10⁻⁶/℃ even if expansive additive is incorporated.
(4) It is confirmed that the accumulated tensile stresses induced by the stepping construction of RC slab sig-nificantly increase the risk of cracking in case of multiple span continuous steel girder bridges regard-less of ambient conditions, concrete placing tem-perature and CTE of concrete.
Acknowledgement This research was carried out collaborating with “To-hoku Regional Development Bureau of MLIT, Japan” as “Research development on quality and durability at-tainment system for concrete structures in various re-gions utilizing curing techniques and admixtures”, the commissioned research of “National Institute for Land and Infrastructure Management” under technology re-search and development system of “The Committee on Advanced Road Technology” established by MLIT, Ja-pan. Reference ACI, (2001). “Control of cracking in concrete structures
(ACI 224R-01).” Farmington Hills, MI: American Concrete Institute.
Altoubat, S. and Lange, D., (2001). “Creep, shrinkage and cracking of restrained concrete at early age.” ACI Materials Journal, 98(4), 323-331.
Alger, M. S. M., (1997). “Polymer science dictionary.” 2nd ed. Springer Publishing.
Cady, P. D., Carrier, R. E., Bakr, T. A. and Theisen, J. C., (1971). “Final report on the durability of bridge deck concrete.” Harrisburg, PA: Pennsylvania Department of Transportation,153.
CEB-FIP, (1990). “CEB-FIP model code 1990; Design code.” Committee Euro-International du Beton, London: Thomas Telford Services Ltd.
Fig.19 Effect of stepping construction, CTE, ambient and concrete placing temperature on the cracking index of the RC slab at location C on multiple span steel box girder bridge.
A. I. Zerin, A. Hosoda, S. Komatsu and H. Ishii / Journal of Advanced Concrete Technology Vol. 18 420-436, 2020 436
Choi, S., Cha, S. W., Oh, B. H. and Kim, I. H., (2011). “Thermo-hygro-mechanical behavior of early-age concrete deck in composite bridge under environmental loadings. Part 1: temperature and relative humidity.” Materials and Structures, 44(7), 1325-1346.
Eppers, L. J., French, C. E. and Hajjar, J., (1998). “Transverse cracking in bridge decks: Field study.” Rep. No. 1999-05, St. Paul, MN: Minnesota Department of Transportation, 103.
Frosch, R. J., Bice, J. K. and Erickson, J. B., (2006). “Design methods for the control of restrained shrinkage cracking.” Publication FHWA/IN/JTRP-2006/32. Joint Transportation Research Program, Indiana Department of Transportation and Purdue University, West Lafayette, Indiana.
Ishida, T. and Iwaki, I., (2017). “Multi-scale and multi-chemo-physical modeling of cementitious composite and its application to early age crack assessment of reinforced concrete slab decks.” In Proceedings of 2nd RILEM/COST Conference on Early Age Cracking and Serviceability in Cement-based Materials and Structures-EAC2, Brussels 12-14 September.
JCI, (2016a). “Guidelines for control of cracking of mass concrete.” Tokyo: Japan Concrete Institute.
JCI, (2016b). “The computer program of thermal stress analysis for massive concrete structures.” Technical document on JCMAC3 Ver.4.0. Tokyo: Japan Concrete Institute.
Krauss, P. D. and Rogalla, E. A., (1996). “Transverse cracking in newly constructed bridge decks.” NCHRP Report 380, Washington, D.C.: Transportation Research Board.
Maekawa, K., Pimanmas, A. and Okamura, H., (2003). “Nonlinear mechanics of reinforced concrete.” London: Spon Press.
Maekawa, K., Ishida, T. and Kishi, T., (2008). “Multi-scale modeling of structural concrete”, London and New York: Taylor and Francis.
Mohsen, A. I., (1999). “Investigation of cracking in concrete bridge decks at early ages.” ASCE, J. Bridge Eng., 4(2),116-124
MHPS Engineering Co. Ltd., (2006). “Continuous composite girder automatic design system.” Manual of Floor slab placement sequence study program Ver.4.0. (in Japanese).
PCA, (1970). “Durability of concrete bridge decks - Final
report.” Skokie, Illinois, Portland Cement Association. Purvis, R., Babei, K., Udani, N., Qanbari, A. and
Williams, W., (1995). “Premature cracking of concrete bridge decks: Causes and methods of prevention.” In: Proceedings of 4th International Bridge Engineering Conference, Washington, D.C.
Ramey, G. E., Wolff A. R., Wright R. L., (1997). “Structural design, actions to mitigate bridge deck cracking.” ASCE, Practice Periodical on Structure Design and Construction, 2(3),118-124.
Saadeghvaziri, M. and Hadidi, R., (2002). “Cause and control of transverse cracking in concrete bridge decks.” Final Report FHWA-NJ-2002-019. Trenton, NJ: Department of Transportation.
Schmitt, T. R. and Darwin, D., (1995). “Cracking in concrete bridge decks.” Final Report K-TRAN: KU-94-1, Lawrence, KS.
Shima, T., Suzuki, Y., Otabe, Y. and Kishi, T., (2007). “Proposal of standard values of adiabatic temperature rise and development of strength.” In: Proceedings of JCI, 29(2), 181-186. (in Japanese).
Springenschmid, R. (ed), (1998). “Prevention of thermal cracking in concrete at early ages.” State of the Art Report by RILEM TC 119, London and New York: E & FN Spon.
Tanaka, Y., Ishida, T., Iwaki, I. and Sato, K., (2017). “Multiple protection design for durable concrete bridge deck in cold regions.” Journal of JSCE, 5, 68-77.
Tanabe, T. and Ishikawa, Y., (2017). “Chemical expansion effect in concrete and its numerical simulation based on the mechanical energy conservation hypothesis.” In: Proc. of JCI-RILEM International Workshop on Control of Mass Concrete and Related Issues Early Age Cracking of Structures (CONCRACK), Tokyo.
Xi, Y., Shing, B., Abu-Hejleh, N., Asiz, A., Suwito, A., Xie, Z. and Ababneh, A., (2003). “Assessment of the cracking problem in newly constructed bridge decks in Colorado.” Final Report CDOT-DTD-R-2003-3. Denver, CO: Colorado Department of Transportation.
Zerin, A., Hosoda, A., Komatsu, S. and Kashimura, K., (2018). “Numerical simulation of early age thermal stress in durable RC bridge slab utilizing blast furnace slag concrete with expansive additive.” In: Proc. of 12th fib International PhD Symposium in Civil Engineering, Prague 29 August-1 September.