Embed Size (px)
Citation preview

Cover Page
The following handle holds various files of this Leiden University dissertation: http://hdl.handle.net/1887/81582 Author: Horton, A.A. Title: Towards a greater understanding of the presence, fate and ecological effects of microplastics in the freshwater environment Issue Date: 2019-12-19
171
CHAPTER 6
Accumulation of polybrominated diphenyl ethers and microbiome
response in the great pond snail Lymnaea stagnalis with exposure to
nylon (polyamide) microplastics
Alice A. Horton, Lindsay K. Newbold, Angela M Palacio-Cortés, David J. Spurgeon, M. Glória
Pereira, Heather Carter, Hyun S. Gweon, Martina G. Vijver, Peter M. van Bodegom, Mario Antonio
Navarro da Silva and Elma Lahive
Accepted for publication in Ecotoxicology and Environmental Safety
172
CHAPTER 6
Accumulation of polybrominated diphenyl ethers and microbiome response in the great
pond snail Lymnaea stagnalis with exposure to nylon (polyamide) microplastics
Alice A. Horton† a,b*, Lindsay K. Newbold† a, Angela M Palacio-Cortésc, David J. Spurgeona ,
M. Glória Pereirad, Heather Carterd, Hyun S. Gweona, e, Martina G. Vijverb, Peter M. van
Bodegomb, Mario Antonio Navarro da Silvac and Elma Lahivea
a Centre for Ecology and Hydrology, Maclean Building, Benson Lane, Wallingford, Oxfordshire, OX10 8BB, UK. b Institute of Environmental Sciences, University of Leiden, P.O. Box 9518, 2300 RA Leiden, The Netherlands. c Zoology department, Universidade Federal do Paraná, Avenida Coronel Francisco H. dos Santos, Jardim das Americas, Curitiba - PR, 81531-981, Brazil. d Centre for Ecology and Hydrology, Library Avenue, Lancaster Environment Centre, Lancaster, Bailrigg, LA1 4AP, UK.
e School of Biological Sciences, University of Reading, Reading, RG6 6UR, UK.
†These authors contributed equally to this work
173
Abstract
Microplastics attract widespread attention, including for their potential to transport toxic
chemicals in the form of plasticisers and associated hydrophobic organic chemicals, such as
polybrominated diphenyl ethers (PBDEs). The aims of this study were to investigate how nylon
(polyamide) microplastics may affect PBDE accumulation in snails, and the acute effects of
nylon particles and PBDEs on survival, weight change and inherent microbiome diversity and
community composition of the pond snail Lymnaea stagnalis. Snails were exposed for 96 hours
to BDEs-47, 99, 100 and 153 in the presence and absence of 1% w/w nylon microplastics in
quartz sand sediment. No mortality was observed over the exposure period. Snails not exposed
to microplastics lost significantly more weight compared to those exposed to microplastics.
Increasing PBDE concentration in the sediment resulted in an increased PBDE body burden in
the snails, however microplastics did not significantly influence total PBDE uptake. Based on
individual congeners, uptake of BDE 47 by snails was significantly reduced in the presence of
microplastics. The diversity and composition of the snail microbiome was not significantly
altered by the presence of PBDEs nor by the microplastics, singly or combined. Significant
effects on a few individual operational taxonomic units (OTUs) occurred when comparing the
highest PBDE concentration with the control treatment, but in the absence of microplastics
only. Overall within these acute experiments, only subtle effects on weight loss and slight
microbiome alterations occurred. These results therefore highlight that L. stagnalis are resilient
to acute exposures to microplastics and PBDEs, and that microplastics are unlikely to influence
HOC accumulation or the microbiome of this species over short timescales.
174
1. Introduction
Microplastics are a widely-recognised pollutant. The impacts of microplastics on biota and
ecosystems, and their interactions with other environmental pollutants under various
environmental conditions, are highly uncertain and existing studies have produced
contradictory results (see discussions of expert committee summarised in the report published
by SAPEA (2019)). Due to the high affinity of microplastic surfaces for hydrophobic organic
chemicals (HOCs), there is potential for particles to sorb HOCs (Hirai et al., 2011;
Karapanagioti et al., 2011; Rochman et al., 2013d), which may lead to elevated or reduced
bioaccumulation of HOCs by organisms that ingest these microplastics (Bakir et al., 2016;
Besseling et al., 2013; Rochman et al., 2013c). However, other studies have not found clear
evidence for microplastics altering bioaccumulation or toxicity of HOCs (Ašmonaitė et al.,
2018; Beiras and Tato, 2019; Besseling et al., 2017; Horton et al., 2018). The question therefore
remains as to whether microplastics will significantly alter the impacts of HOCs on organisms.
Within the group of HOCs, polybrominated diphenyl ethers (PBDEs), brominated
hydrocarbons commonly used as flame-retardants, are one of the priority pollutant groups.
They are found widely throughout the environment (Guan et al., 2007; Hassanin et al., 2004),
including in riverine sediments (up to 16088 ng g-1 dry weight total PBDEs in riverbank
sediment in China (Luo et al., 2007)). As with other persistent organic pollutants, due to their
relatively high log Kow, PBDEs sorb to particulate and organic matter within the environment,
and to fatty tissues of organisms where they can bioaccumulate (Rahman et al., 2001). Where
microplastics and PBDEs occur together, there is the likelihood of interactions. One
environmental study found microplastics had surface concentrations of PBDEs up to 9900 ng
g-1 (Hirai et al., 2011), suggesting the potential for such interactions to influence organism
exposure. Chua et al. (2014) and Rochman et al. (2013c) have shown that the presence of
microplastics within experimental systems can lead to increased body burdens of PBDEs in
amphipods and fish, with the type and concentration of microplastics affecting the dynamics
of bioaccumulation. Microplastics can also change the way in which different PBDE congeners
are accumulated, with higher brominated congeners more likely to be accumulated when
microplastics are present (Chua et al., 2014).
The gut microbiome is important for nutrition, metabolic function and immunity, with
perturbations to the microbial community understood to have implications for organism health
and fitness (Licht and Bahl, 2018; Zhu et al., 2018a). A number of studies have been carried
175
out to determine the effects of PBDEs on the gut microbiome of various organisms. Chen et al.
(2018) investigated the effects of BDE-71 on the gut microbiome of zebrafish, finding that, in
the presence of BDE-71, bacterial diversity was significantly reduced, and bacterial metabolic
functioning was altered in a 7-day exposure. Li et al. (2018) showed BDEs-47 and 99 to
significantly affect the gut microbial diversity of mice, leading to up- and down-regulation of
45 bacterial OTUs (5-day exposure), while Wang et al. (2018a) also found BDE-47 to also lead
to a significant reduction in mouse gut microbial diversity and an alteration in the community
structure (21-day exposure). Studies have shown that microplastics can similarly alter the gut
microbiome of both vertebrates (Jin et al., 2018; Lu et al., 2018) and invertebrates (Zhu et al.,
2018a; Zhu et al., 2018b). These studies clearly show that microbiome alterations, expressed
as species richness and diversity, are a sensitive endpoint responding to HOC and microplastic
exposure, even over short timescales. Therefore, microbiome analysis together with host fitness
could provide a fast screening tool for assessing the effects of combined HOCs and
microplastics during acute exposures.
The aim of this study was to investigate the effects of microplastics and PBDEs, individually
and in combination, on the accumulation, physiology and microbiome of the great pond snail
Lymnaea stagnalis (Linnaeus 1758). Molluscs have been shown to bioaccumulate organic
chemicals (and metals) as they lack the oxidase systems to metabolise xenobiotic substances
(Geyer et al., 1982). These traits make them well suited as test organism for investigating
organic pollutant accumulation (Amorim et al., 2019). Although microplastics and PBDEs
have been shown to individually alter the gut microbiome of organisms once ingested, no
studies to date have investigated the effects of co-exposure to these pollutants with respect to
microbiome responses. We hypothesise that increasing PBDE sediment concentrations will
lead to significant changes in the microbiome community (diversity and composition) and that
the presence of microplastics will reduce this effect through strong binding of PBDEs, making
them less bioavailable to microbiota within the gut. We also hypothesise that the presence of
microplastics will reduce PBDE accumulation in the snail.
2. Materials and methods
2.1. Organisms
Adult Lymnaea stagnalis were obtained from Blades Biological, UK, and were acclimatised
for one week under laboratory conditions prior to the exposure. Cultures were maintained and
176
exposure studies carried out using ISO artificial freshwater as recommended by the OECD for
L. stagnalis (OECD, 2016). An air pump with an air stone was provided for system
oxygenation. Stock cultures and exposures were maintained at 20°C with a 16:8 h light:dark
cycle. Snails in culture were fed well-washed iceberg lettuce ad libitum. No food was provided
during test exposures. Preliminary experiments showed L. stagnalis to ingest and egest the
nylon microplastics used for this study (personal observation).
2.2. Microplastic particles
Nylon 6 powder (mono-constituent substance, density 1.13 g cm-3) was purchased from
Goodfellow (Huntingdon, UK). This powder consisted of heterogeneous fragments <50 µm,
with a mean size of 13-19 µm, measured using a Coulter Counter (Multisizer 3, Beckman,
USA) and had been previously stained with Nile Red dye.
2.3. PBDEs
Method 527 PBDE Mixture was purchased from LGC Standards (Teddington, UK). This
mixture contained BDE- 47, 99, 100, 153 and PBB- 153 (PBB-153 was not considered or
measured throughout this study), each at a concentration of 500 µg ml-1 in ethyl acetate. With
respectively log Kows of 6.81, 7.32, 7.24, and 7.9 these BDEs were all highly hydrophobic.
These congeners are commonly detected within aquatic organisms and have a high propensity
for bioaccumulation (Hirai et al., 2011; Shanmuganathan et al., 2011). A serial dilution was
carried out in ethyl acetate in order to provide the ultimate concentrations of each BDE
congener in sediment of 3000, 1500, 750, 375, 188 and 94 ng g-1. These concentrations were
chosen to reflect concentrations found within freshwater sediments (Luo et al., 2007; Sellström
et al., 1998; Yin et al., 2017).
2.4. Experimental setup
Experimental treatments consisted of either microplastics (1% nylon powder by sediment
mass) or sediment without added microplastics. Microplastic treatments were prepared by
weighing 0.8 g nylon powder and mixing with white quartz sand (SiO2, particle size 210-300
µm, Sigma-Aldrich, Poole, UK) to make up to 80 g. For each treatment, 1 ml of each diluted
177
PBDE stock was added to the 80 g quartz sand substrate (with or without microplastics,
hereafter referred to as ‘sediment’) and stirred for 2 minutes 30 seconds using a glass rod. This
bulk mixture was divided between six replicate 100 ml glass exposure vessels (13 g per vessel).
As a solvent carrier was used for spiking the PBDEs into the sediment, an ethyl acetate solvent
control was also set up (1.25 % ethyl acetate in sediment) by carrying out this procedure with
ethyl acetate only. Following dosing, the vessels were left under a fume hood for two days with
occasional agitation to ensure complete evaporation of the solvent. Blank control treatments
were made by mixing nylon powder and quartz sand using the same procedure, but without the
need for solvent evaporation.
To prevent suspension of nylon particles due to water surface tension, a small spray bottle of
ISO test water was used to spray eight times onto the surface of the dry sediment. 100 ml of
ISO test water was then gently introduced to the vessel and the water surface sprayed another
seven times to break the water surface tension and allow any floating nylon particles to sink
(15 sprays total). Vessels were left to equilibrate for 48 hours prior to introducing the
organisms.
Before being added to the test vessels, each snail was rinsed in ISO test water and the shell
gently rubbed with a gloved finger to remove any faeces/algae present and patted dry with a
tissue. Each snail was weighed and length of shell measured; only snails > 25mm were used in
the bioassays at which size all individuals can be expected to be mature (Coeurdassier et al.,
2004; Zonneveld and Kooijman, 1989).
During exposures, jars were covered with Parafilm® to prevent escape of snails, pierced 10
times to allow for oxygenation. Exposures ran for 96 hours. Snails were observed daily to check
for mortality. At the end of the exposure, snails were removed from the water, washed in DI
water, patted dry with tissue and weighed. Snails were euthanised and preserved: of the six
replicate snails for each treatment, three were preserved for microbiome analysis (directly
placed into ethanol) and three for tissue PBDE concentration analysis (immediately frozen at -
80°C). Snails were not depurated before weighing or preservation as it was decided that
analysing organisms with a full gut would give a more natural representation of environmental
exposure and associated internal concentration. The overlying water from the exposure vessels
was poured away and sediments were dried in a temperature-controlled chamber at 25°C until
dry (approx. 2 days). Sediment PBDE concentrations were measured in the dried samples at
the end of the experiment.
178
2.5. Chemical analysis
Half of a snail was thawed, removed from the shell and dissected lengthways to obtain a
representative sample of the whole body. This tissue was then weighed, ground with sand and
dried with anhydrous sodium sulphate. Each sample (snail/sediment) was spiked with labelled
recovery standards (13C BDE 47, 13C BDE 126 and 13C BDE 153; Cambridge Isotope
Laboratories) and soxhlet extracted in dichloromethane (DCM) for 16 h. A small portion of the
extract was evaporated to zero volume and the lipid content was determined gravimetrically.
The remaining of the extract was cleaned using automated size exclusion chromatography
followed by deactivated (5% deionised water; w/w) alumina column.
The clean extract, was then spiked with labelled internal standards (BDE 77and 13C BDE 138;
Cambridge Isotope Laboratories) and 100 μl of sample was injected into a GC-MS (Agilent)
with programmable temperature vaporization (PTV) inlet. The PTV injector was kept at 55°C
for 0.45 min, and heated to 325°C at a rate of 700°C min-1 and kept at 325°C for 5 min. Then
the temperature was reduced to 315°C min-1 at a rate of 10°C min-1.The GC-MS had a 25 m
HT8 column (0.22 mm internal diameter and 0.25 μm film thickness, SGE Milton Keynes, UK)
and the carrier gas was helium (2.0 ml min-1). The temperature programme was: isothermal at
80°C for 2.4 min, 25°C min-1 to 200°C, 5°C min-1 to 315°C and was held at 315°C for 9.8 min.
Residues were quantified using internal standard method and also calibration curves of the
standard PBDEs (Cambridge Isotope Laboratories) and were recovery corrected. The mean
recoveries were: 13C BDE 47- 85%, 13C BDE 126 – 105% and 13C BDE 153- 96% and the LOD
was 0.109 ng g-1 wet weight.
2.6. Ingestion of microplastics
The snail tissue remaining following the chemical analysis was analysed using a fluorescence
microscope (Olympus BX41 microscope with an Olympus U-LH100HG 100W mercury lamp
using the green filter of the Cy3 (Olympus U-M39004) filter cube, with Olympus analySIS
software) to verify ingestion of microplastics by the snails.
179
2.7. Microbiome analysis
2.7.1. DNA extraction and sequencing
DNA was extracted from three snails per treatment (whole snail excluding shell) following the
protocol described in the SI. Sample DNA required an additional cleaning step through the
application of Genomic DNA Clean & Concentrator kit (Zymo research, USA) under the
manufacturer’s recommended protocol. Resultant DNA was quantified using the nanodrop
8000 UV-Vis spectrophotometer (ThermoFisher scientific, USA).
Approximately 40 ng of template DNA was amplified using Q5 high-fidelity DNA polymerase
(New England Biolabs, Hitchin, UK) each with a unique dual-index barcode primer
combination (Kozich et al., 2013). Individual PCR reactions employed 25 cycles of an initial
30 s, 98°C denaturation step, followed by an annealing phase for 30 s at 53°C, and a final
extension step lasting 90 s at 72°C. Primers were based upon the universal primer sequence
341F and 806R (Takahashi et al., 2014). An amplicon library consisting of ~550 bp amplicons
spanning the V3-V4 hypervariable regions of encoding for the 16S small subunit ribosomal
RNA gene (16S rRNA), was sequenced at a concentration of 6 pM with a 10% addition of
control phiX DNA, on an Illumina MiSeq platform using V3 chemistry (Illumina Inc., San
Diego, CA, USA).
2.7.2. Bioinformatics analysis
Sequenced paired-end reads were joined using VSEARCH (Rognes et al., 2016), quality
filtered using FASTX tools (hannonlab.cshl.edu), length filtered with the minimum length of
300 bp, presence of PhiX and adapters were checked and removed with BBTools
(jgi.doe.gov/data-and-tools/bbtools/), and chimeras were identified and removed with
VSEARCH_UCHIME_REF (Rognes et al., 2016) using Greengenes Release 13_5 (at 97%)
(DeSantis et al., 2006). Singletons were removed and the resulting sequences were clustered
into operational taxonomic units (OTUs) with VSEARCH_CLUSTER (Rognes et al., 2016) at
97% sequence identity (Tindall et al., 2010). Representative sequences for each OTU were
taxonomically assigned by RDP Classifier with the bootstrap threshold of 0.8 or greater (Wang
et al., 2007) using the Greengenes Release 13_5 (full) (DeSantis et al., 2006) as the reference.
Unless stated otherwise, default parameters were used for the steps listed. The raw sequence

180
data reported in this study have been deposited in the European Nucleotide Archive under study
accession number PRJEB27672 (ERP109787).
2.8. Statistical analysis
2.8.1. Chemistry data
Sediment concentration and snail body concentration data were log transformed for normality.
As only one sediment concentration was measured per treatment, it was assumed that each of
the three snails analysed per treatment was exposed to this measured concentration. To
compare the concentrations of PBDEs in sediment and organisms with and without
microplastics, only treatments with added PBDEs were included in the analyses of chemical
data (i.e. no control treatments) as the control treatments showed very low or non-detected
values which could not be log-transformed. Two-way ANOVAs were carried out for each BDE
congener, and the total PBDEs, to determine the relationship between snail tissue
concentration, the concentration of PBDEs in the sediment and the presence of microplastics
(R statistical software).
2.8.2. Snail weight data
A two-way ANOVA was conducted considering the effects on snail weight change of PBDE
concentration and presence of microplastics as factors, and also their interaction.
2.8.3. Microbiome data
After quality filtering, a total of 2626755 sequences remained. One sample was removed from
the analysis due to low sequencing efficiency (<6000 sequences). Rarefaction curves were used
to ensure the sample depth represented the full community. To account for uneven sequencing
depth (inherent in NGS platforms) samples were normalized to lowest sequence depth using
the rarefy_even_depth function in the R package ‘Phyloseq V 1.22.3’ (McMurdie and Holmes,
2013). For simplicity, for microbiome analysis with respect to PBDE concentration, nominal
PBDE concentrations were used. In order to assess any subtle changes, communities were
subdivided into ‘core’ OTUs (occurring in >50% of samples, at an abundance of >2%) and
‘non-core’ (all other community members), using the function ‘prevalence’ in the R package
181
‘microbiome’ (McMurdie and Holmes, 2013). Analyses were firstly carried out on the whole
community and subsequently on the subdivided core and non-core communities.
To visualise the relationship between 16 rRNA sequence-based community profiles from
different treatments, nonmetric multidimensional scaling (NMDS) was performed using the
‘metaMDS’ function, based on dissimilarities calculated using the Bray–Curtis index.
Additionally, bacterial diversity were assessed using Fishers log series [alpha], as this is largely
unaffected by sample sizes > 1000 (Magurran, 2004). Differences in bacterial diversity for each
PBDE compound and nominal PBDE concentration were tested through the multiple Kruskal-
Wallis (H) test, a test which does not assume data normality, using the function ‘kruskalmc’ in
R package ‘Pgirmess’ version 1.6.9 (Giraudoux et al., 2018). An additional Kruskal-Wallis test
was run to determine whether there were differences in microbiome diversity between control
and solvent control treatments (Fig. 3). Similarity percentages breakdown procedure
(SIMPER) was used to infer the importance of community members within treatments (Clarke,
1993) and again Kruskal-Wallis was used to test significance. Finally, the effect of PBDE
concentration, presence of microplastics and their interaction upon community dissimilarity
was assessed using the Bray–Curtis index through Permutational Multivariate Analysis of
Variance (PERMANOVA, using the ‘ADONIS’ function in R package ‘Vegan’ v2.0-10
(Anderson, 2001; Oksanen et al., 2013)). Taxonomic composition was plotted using the R
package ‘ggplot2’ (Wickham, 2016). For each treatment, relative abundances per treatment
were calculated to account for unequal sampling, taking into account the combined data of the
three replicates (Figs. 5, S4 and S5).
3. Results
3.1. Concentration of PBDEs in the presence and absence of microplastics
The control treatments (no PBDEs, with and without microplastics) contained trace
concentrations of PBDEs in some instances, although most (overall 73%) were below the
detection limit of 0.108 ng g-1. The concentrations of different PBDE congeners in relation to
its nominal concentrations varied between 41% and 74% (Table 1). When considering all
congeners and concentrations both with and without microplastics, measured sediment
concentrations overall were 54% of the nominal concentration. PBDEs were therefore present
within sediment at statistically significantly comparable concentrations regardless of the
presence or absence of microplastics (p > 0.05, ANOVA).
182
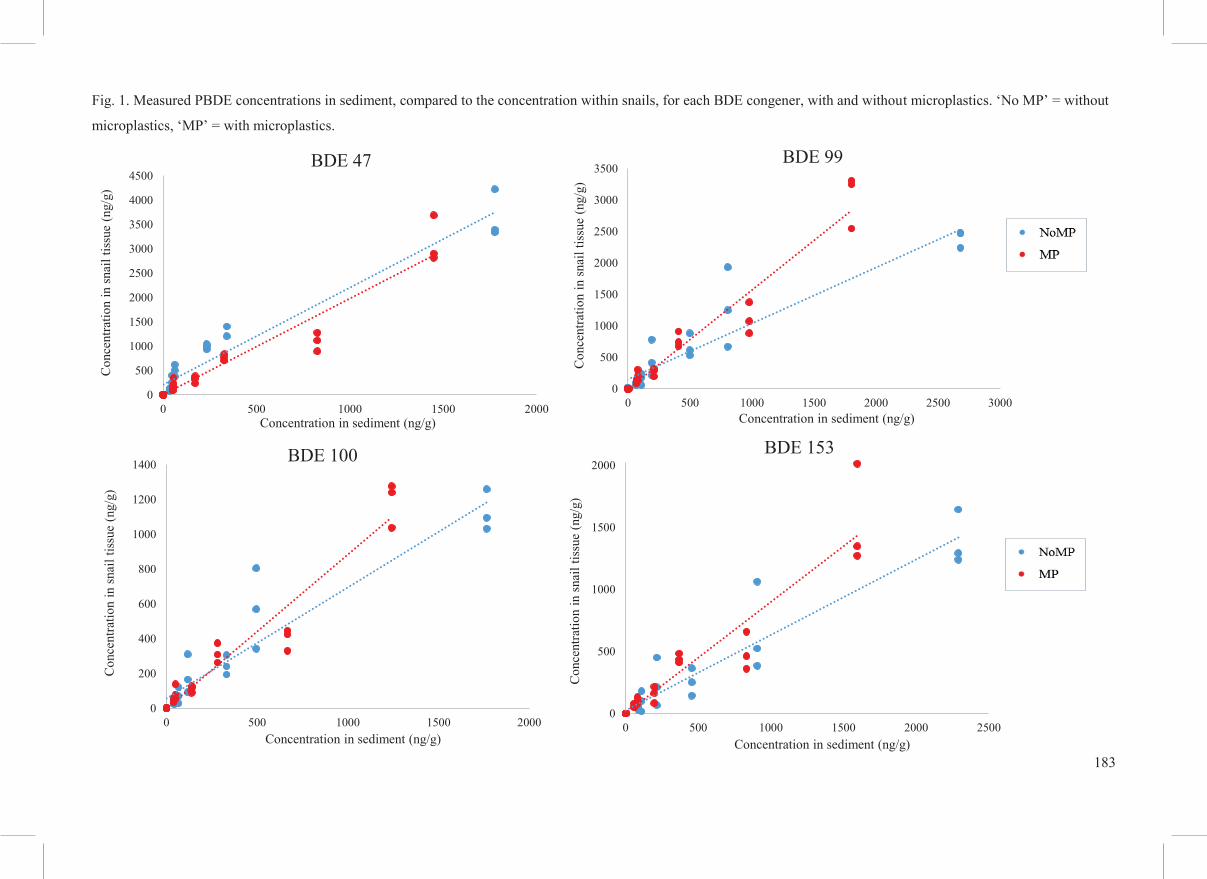
The (measured) sediment PBDE concentrations significantly affected PBDE uptake by snails,
for all PBDEs independently and combined, higher sediment concentrations resulted in a
significantly higher snail body burden (p < 0.01, ANOVA, Fig. 1). BDE 47 was the only PBDE
congener that showed a significant effect of microplastics on the uptake of PBDEs by snails,
with microplastics leading to a significantly lower body burden (p < 0.01, ANOVA, Fig. 1).
There were no significant interactions between the concentration of PBDEs within the sediment
and the presence of microplastics for any of the congeners (p > 0.05, two-way ANOVA).
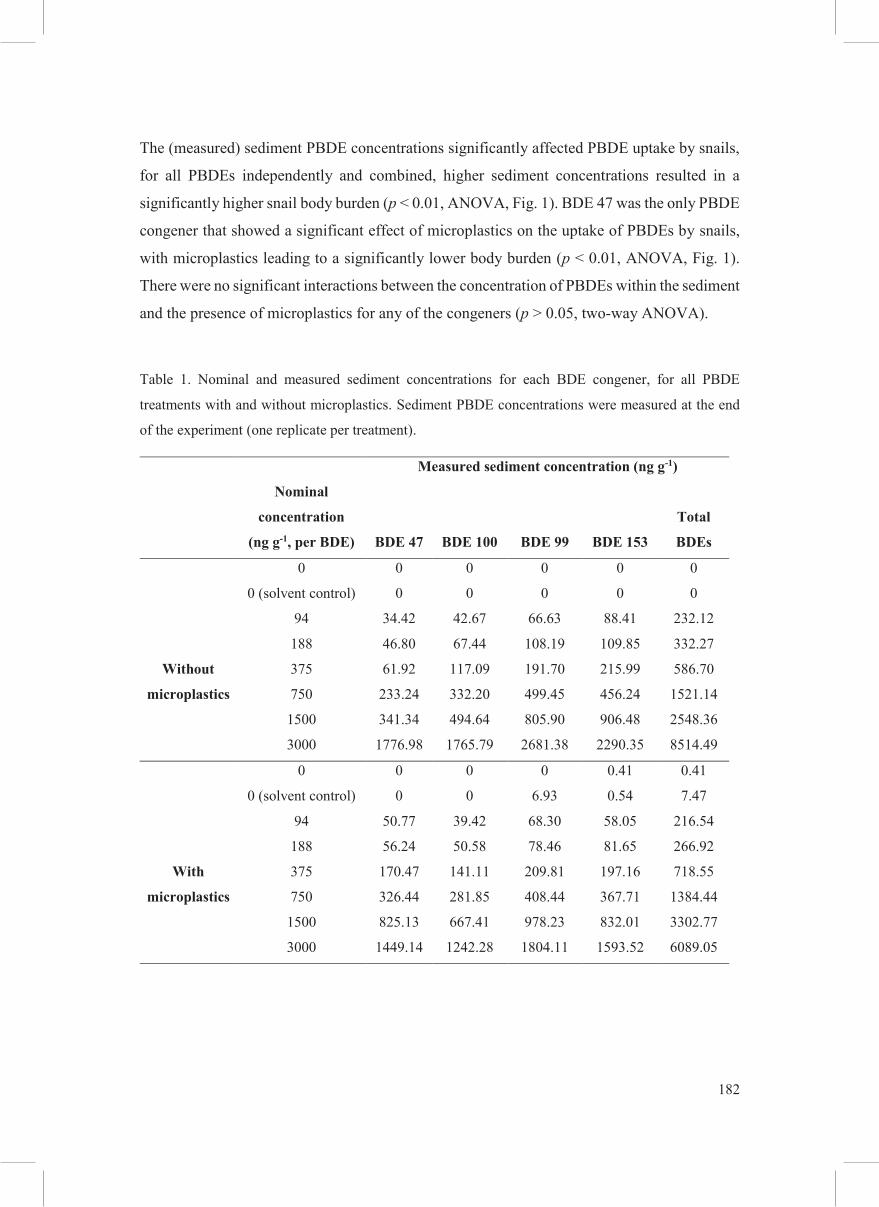
Table 1. Nominal and measured sediment concentrations for each BDE congener, for all PBDE
treatments with and without microplastics. Sediment PBDE concentrations were measured at the end
of the experiment (one replicate per treatment).
Measured sediment concentration (ng g-1)
Nominal
concentration
(ng g-1, per BDE) BDE 47 BDE 100 BDE 99 BDE 153
Total
BDEs
Without
microplastics
0 0 0 0 0 0
0 (solvent control) 0 0 0 0 0
94 34.42 42.67 66.63 88.41 232.12
188 46.80 67.44 108.19 109.85 332.27
375 61.92 117.09 191.70 215.99 586.70
750 233.24 332.20 499.45 456.24 1521.14
1500 341.34 494.64 805.90 906.48 2548.36
3000 1776.98 1765.79 2681.38 2290.35 8514.49
With
microplastics
0 0 0 0 0.41 0.41
0 (solvent control) 0 0 6.93 0.54 7.47
94 50.77 39.42 68.30 58.05 216.54
188 56.24 50.58 78.46 81.65 266.92
375 170.47 141.11 209.81 197.16 718.55
750 326.44 281.85 408.44 367.71 1384.44
1500 825.13 667.41 978.23 832.01 3302.77
3000 1449.14 1242.28 1804.11 1593.52 6089.05
183
Fig. 1. Measured PBDE concentrations in sediment, compared to the concentration within snails, for each BDE congener, with and without microplastics. ‘No MP’ = without
microplastics, ‘MP’ = with microplastics.
0
500
1000
1500
2000
2500
3000
3500
4000
4500
0 500 1000 1500 2000
Con
cent
ratio
n in
snai
l tis
sue
(ng/
g)
Concentration in sediment (ng/g)
BDE 47
0
200
400
600
800
1000
1200
1400
0 500 1000 1500 2000
Con
cent
ratio
n in
snai
l tiss
ue (n
g/g)
Concentration in sediment (ng/g)
BDE 100
0
500
1000
1500
2000
2500
3000
3500
0 500 1000 1500 2000 2500 3000
Con
cent
ratio
n in
snai
l tis
sue
(ng/
g)
Concentration in sediment (ng/g)
BDE 99
0
500
1000
1500
2000
0 500 1000 1500 2000 2500
Con
cent
ratio
n in
snai
l tiss
ue (n
g/g)
Concentration in sediment (ng/g)
BDE 153

184
3.2. Survival and weight change
There was 100% survival throughout the exposure. A significant difference was observed in
snail wet weight change between microplastic and non-microplastic treatments, with non-
microplastic treatments losing significantly more weight on average (0.11 ± 0.13 g) than
microplastic treatments (0.03 ± 0.12 g) (two-way ANOVA, p < 0.01, Fig. 2). Concentration of
PBDE had no effect on weight change (two-way ANOVA, p > 0.05) and there was no
interaction between PBDEs and microplastics (two-way ANOVA, p > 0.05).
Fig. 2. Average snail wet weight change for all PBDE treatments (nominal concentration in ng g-1 within
sediment) with and without microplastics, based on weight difference between 0 and 96 hours exposure.
‘No MP’ = without microplastics, ‘MP’ = with microplastics.
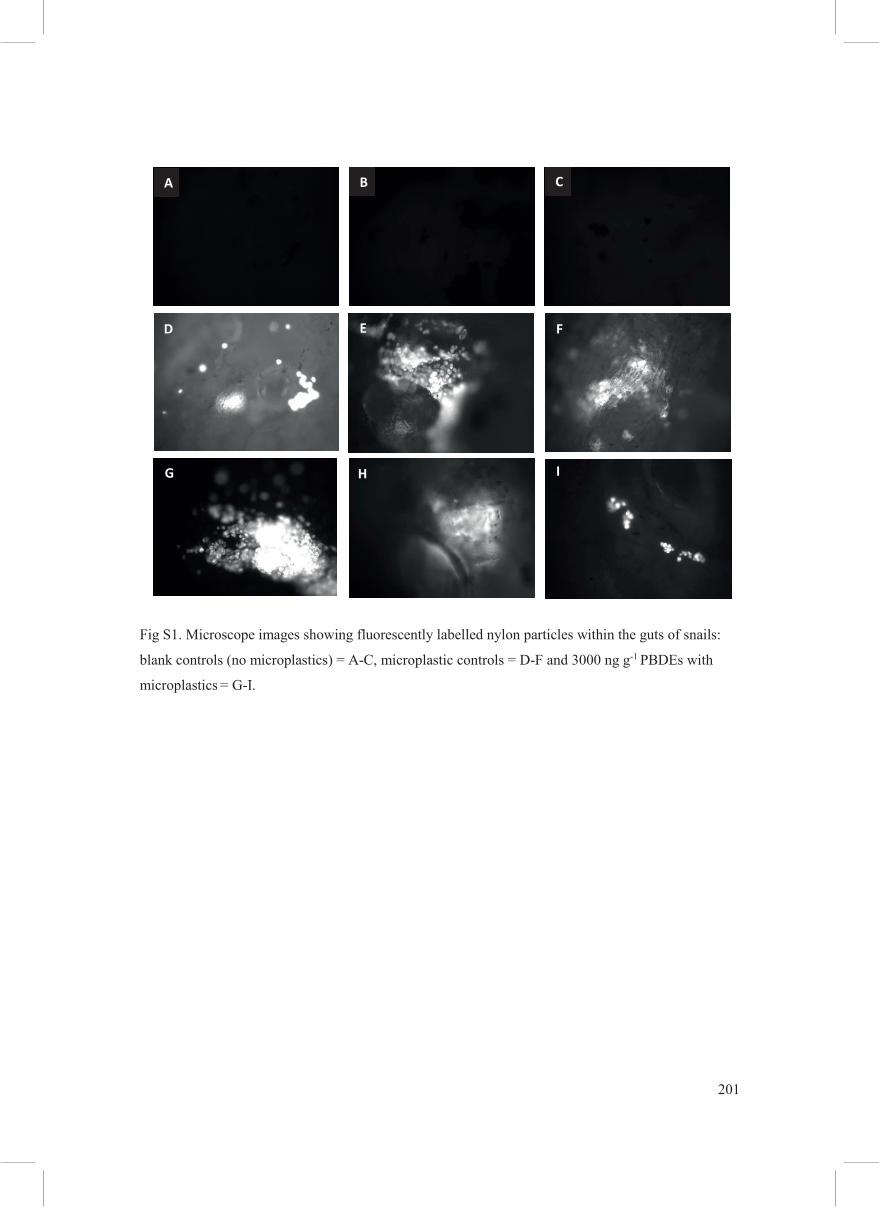
3.3. Ingestion of microplastics
Ingestion of microplastics was qualitatively confirmed using fluorescence microscopy (Fig.
S1). Microplastics are clearly visible within the tissues of the snails, both on the surface of the
sample (Fig. S1, G and I) and behind membranes (i.e. within organs, Figs S1. D, F and H).
Based on the way the samples were prepared and analysed, it is not possible to quantitatively
analyse ingestion, nor to identify the specific locations where microplastics were found or
accumulated. However, microplastics were visibly present within all snails exposed to
microplastics (Fig. S1 D-I).
-0.4
-0.3
-0.2
-0.1
0
0.1
0.2
0.3
Solventcontrol
0 94 188 375 750 1500 3000
Ave
rage
wei
ght c
hang
e (g
)
No MP
MP
185
3.3. Microbiome data
3.3.1. Control treatments
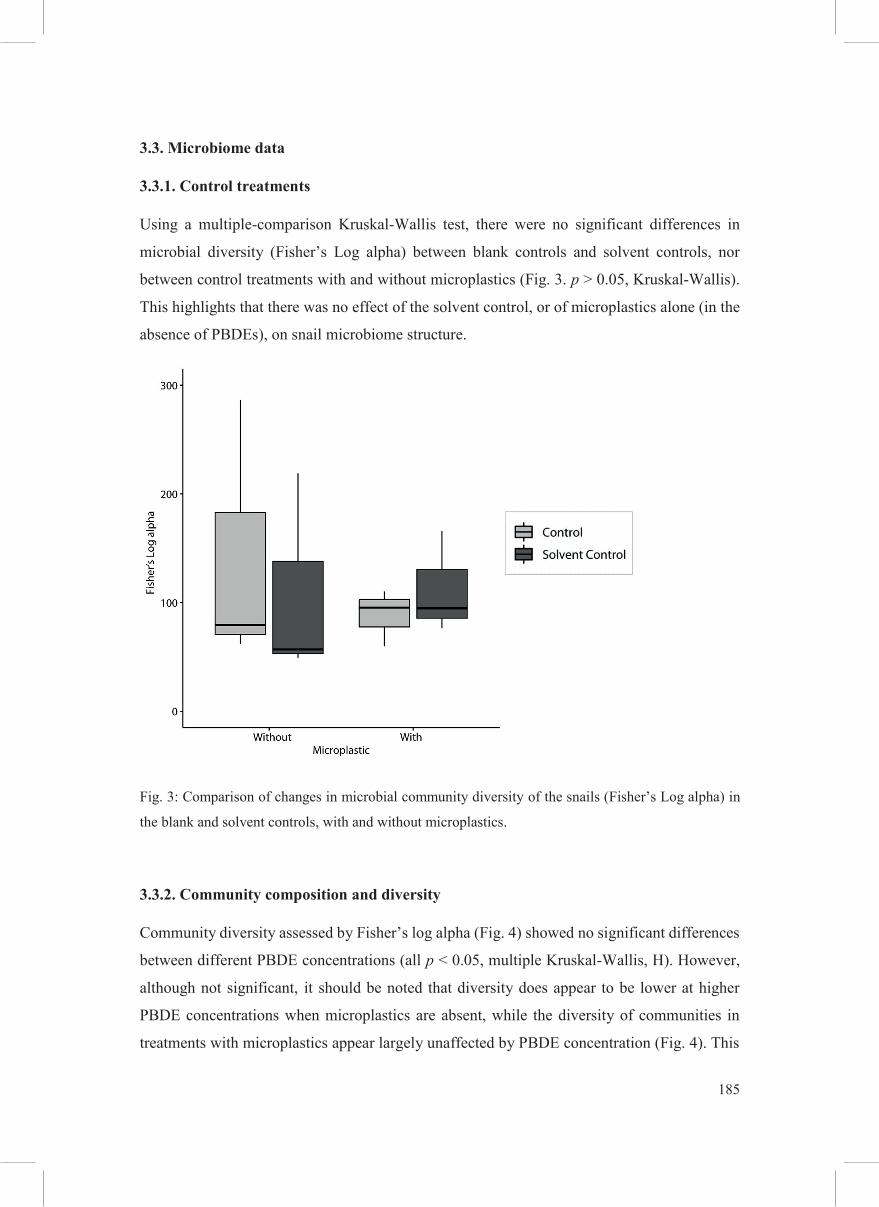
Using a multiple-comparison Kruskal-Wallis test, there were no significant differences in
microbial diversity (Fisher’s Log alpha) between blank controls and solvent controls, nor
between control treatments with and without microplastics (Fig. 3. p > 0.05, Kruskal-Wallis).
This highlights that there was no effect of the solvent control, or of microplastics alone (in the
absence of PBDEs), on snail microbiome structure.
Fig. 3: Comparison of changes in microbial community diversity of the snails (Fisher’s Log alpha) in
the blank and solvent controls, with and without microplastics.
3.3.2. Community composition and diversity
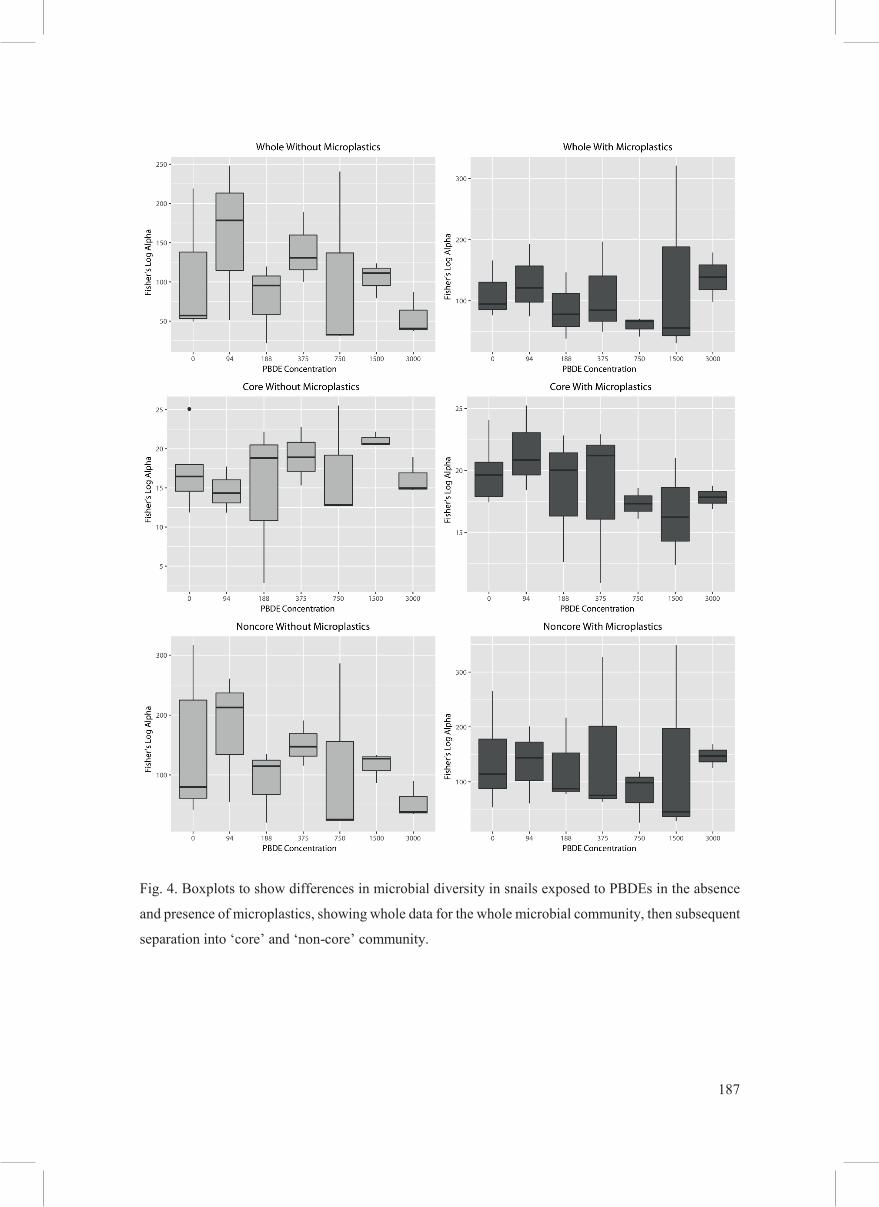
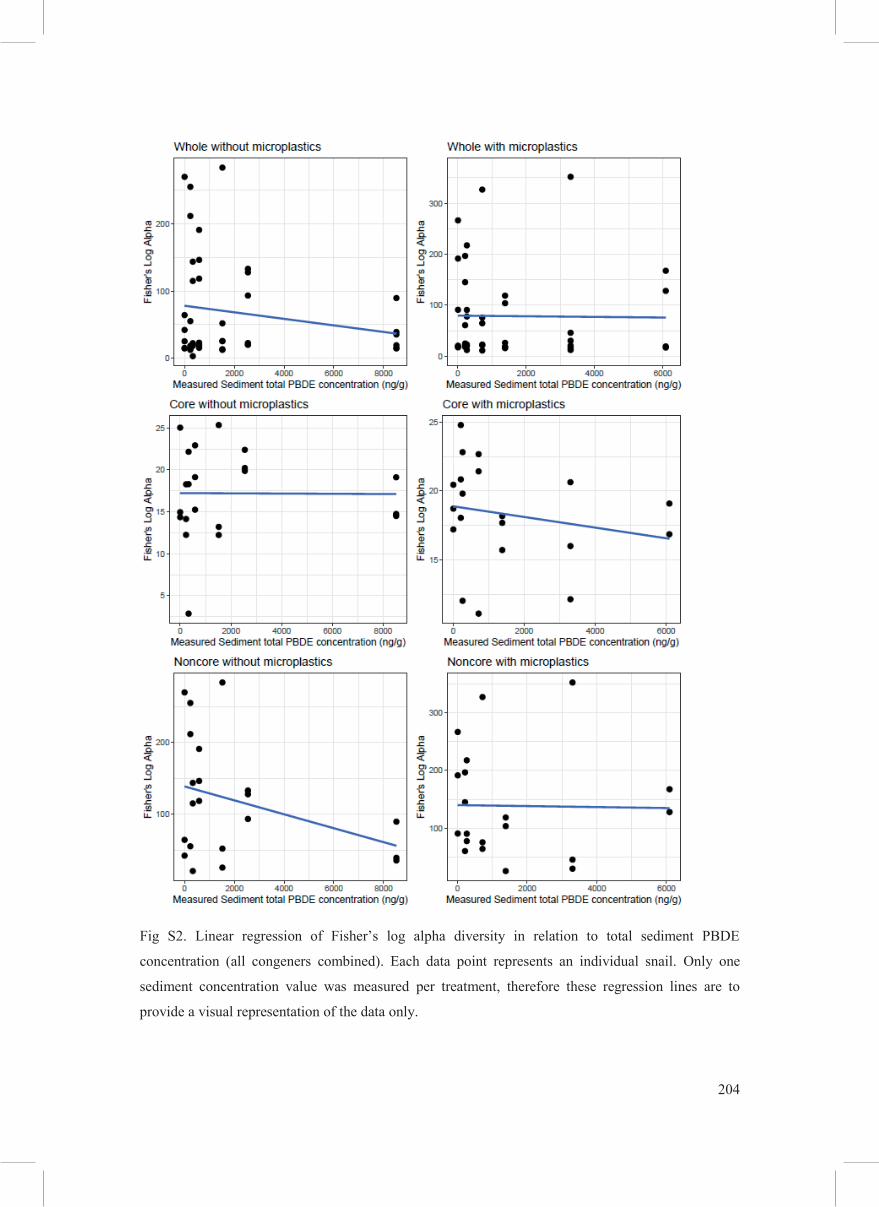
Community diversity assessed by Fisher’s log alpha (Fig. 4) showed no significant differences
between different PBDE concentrations (all p < 0.05, multiple Kruskal-Wallis, H). However,
although not significant, it should be noted that diversity does appear to be lower at higher
PBDE concentrations when microplastics are absent, while the diversity of communities in
treatments with microplastics appear largely unaffected by PBDE concentration (Fig. 4). This
186
decline in diversity pattern could be related to a loss in richness (count) of non-core OTUs in
treatment with high concentrations of PBDE, in the absence of microplastics (Fig. 4 and Fig
S2).
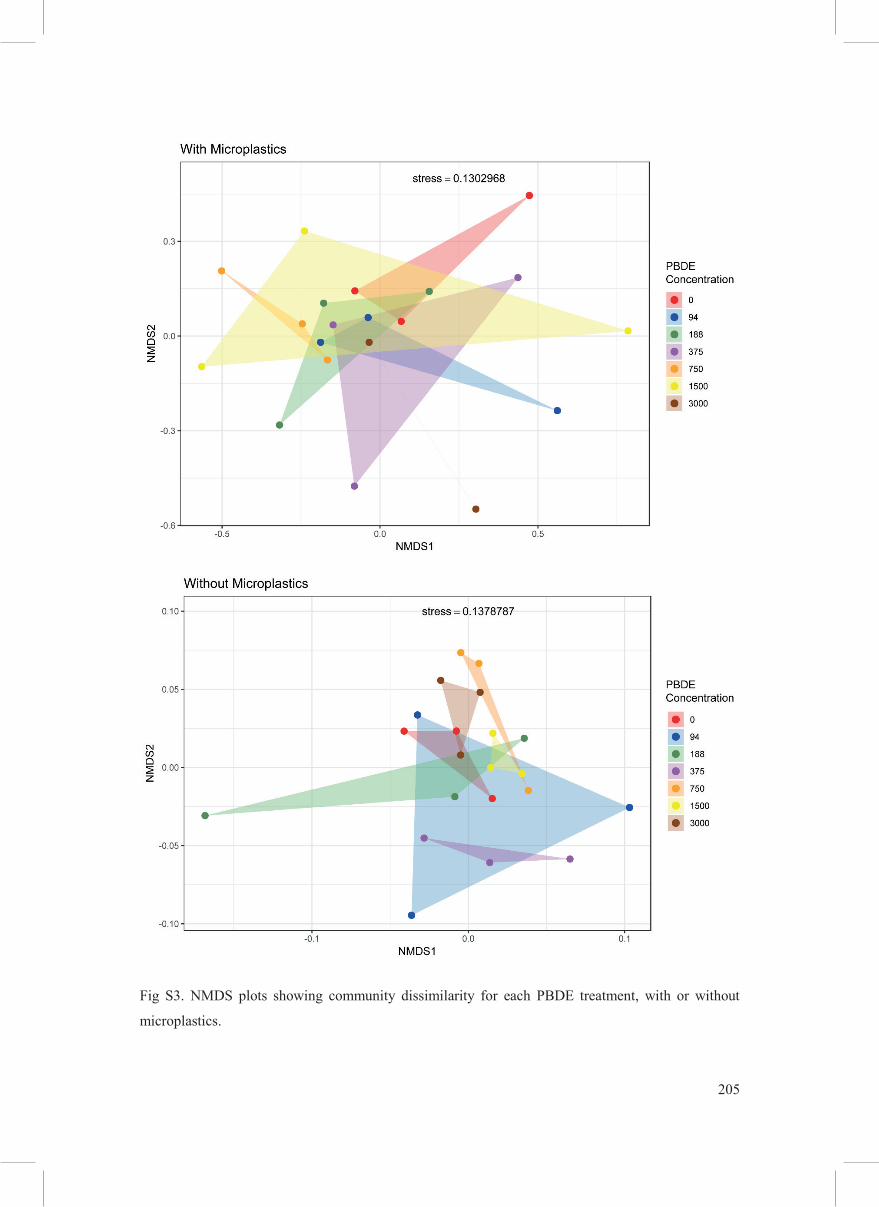
The visualisation of the community composition in the NMDS suggested some clustering at
high PBDE concentrations in the absence of microplastics (Fig. S3). However, the
Permutational Multivariate Analysis of Variance showed that none of this clustering was
significant (p > 0.05 for all comparisons). Replicate variability was high and possibly rendered
this non-significance. Attempting to introduce more stringent criteria to determine core OTUs
did not change the results.
3.3.3. Taxonomic microbiome composition
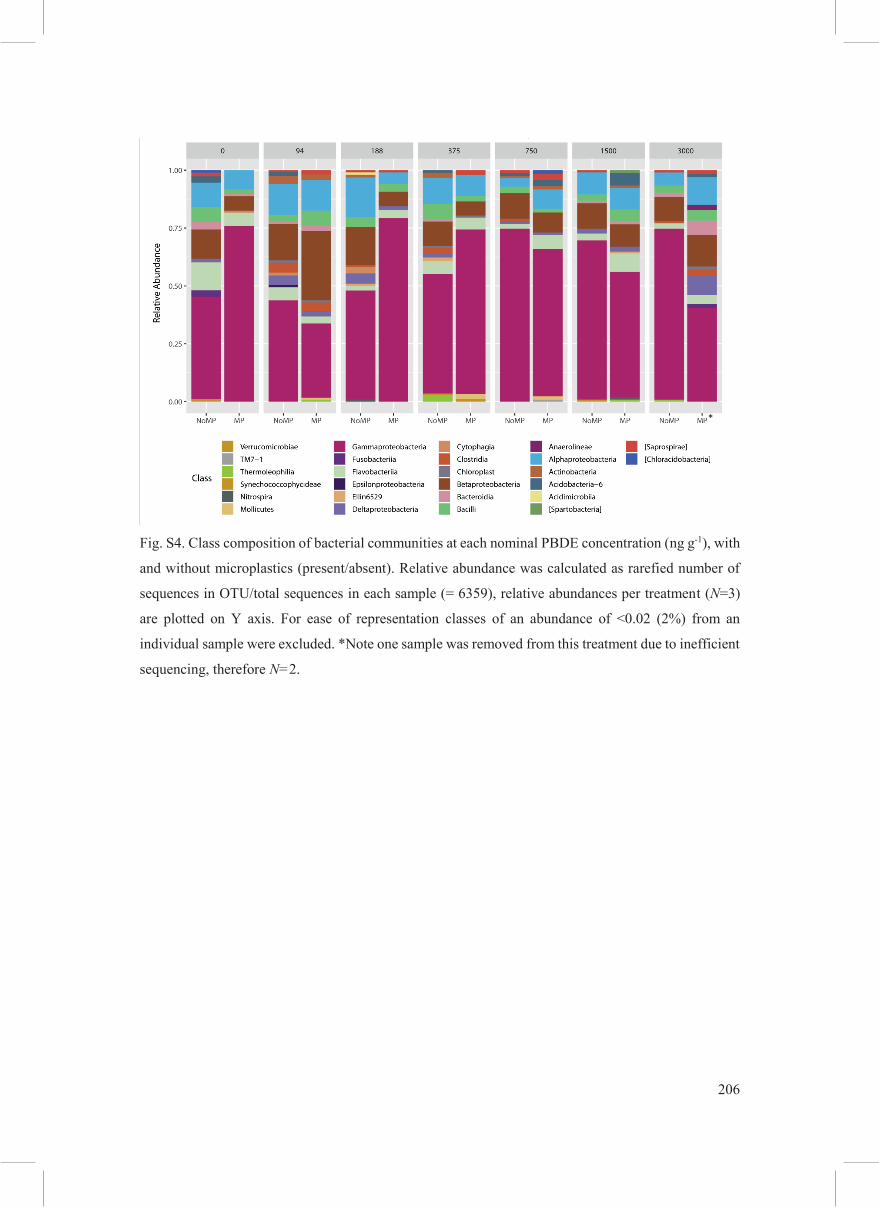
The greatest number of 16S rRNA gene sequences within the L. stagnalis microbiome were
found to be from the Gammaproteobacteria, Betaproteobacteria, Alphaproteobacteria,
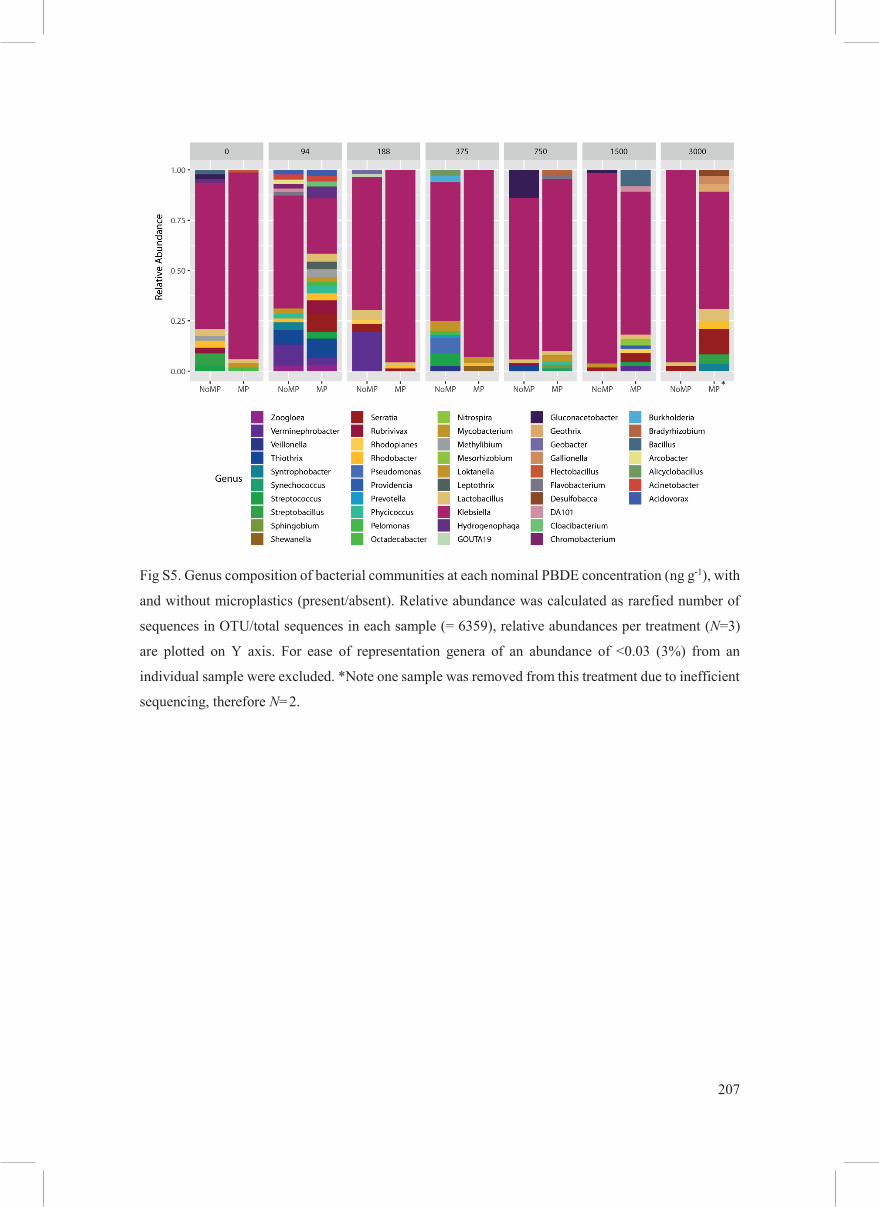
Flavobacteria and Bacilli (Fig. S4) irrespective of treatment. The most dominant order across
all treatments are the Enterobacterales (Fig. 5), and within that order the genus Klebsiella (Fig.
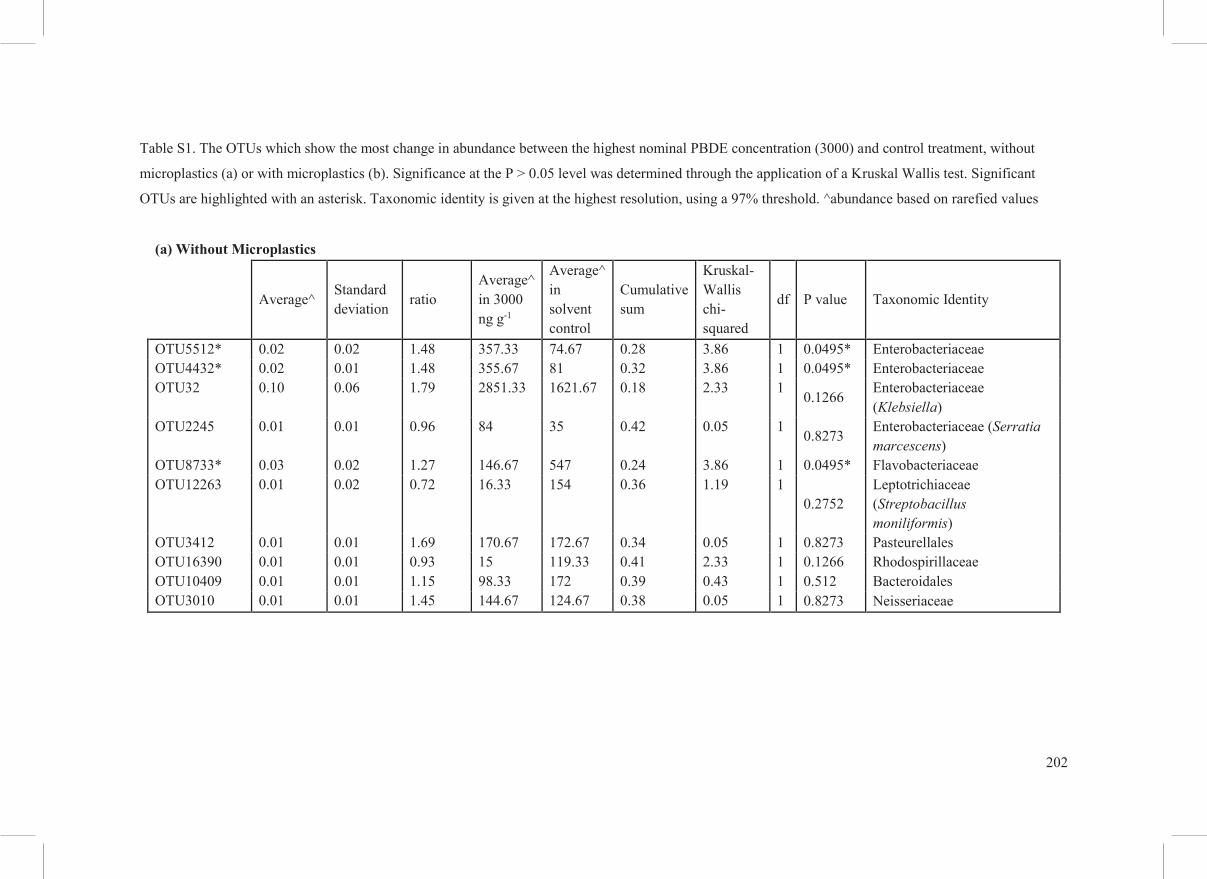
S5). When comparing individual OTUs in the controls vs the highest PBDE concentration,
similarity of percentage (SIMPER) analysis shows that in the absence of microplastics there
was a significantly higher relative abundance of OTUs 5512 and 4432 (both identified as
belonging to the Enterobacteriaceae) in the highest PBDE concentration treatment (Table S1).
There was also a significant reduction in OTU 8733 (identified as belonging to the
Flavobacteriaceae), in the highest dose treatment compared to the control (Kruskal-Wallis test
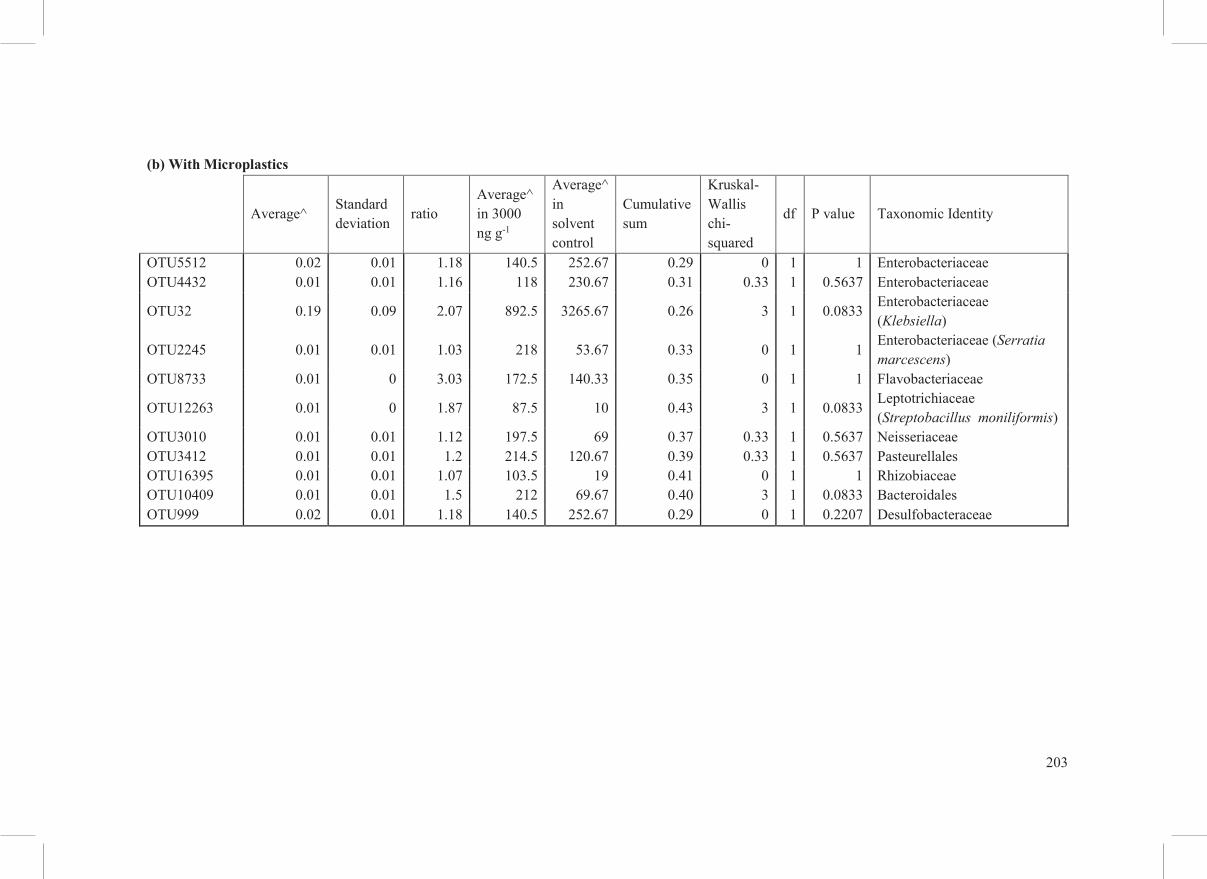
P < 0.05, df =1). In contrast, no significant differences were observed in individual relative
OTU abundance when microplastics were present (Table S1). Some orders are present only in
PBDE treatments, notably sulfate-reducing bacteria (Desulfobacterales and
Syntrophobacterales).
187
Fig. 4. Boxplots to show differences in microbial diversity in snails exposed to PBDEs in the absence
and presence of microplastics, showing whole data for the whole microbial community, then subsequent
separation into ‘core’ and ‘non-core’ community.

188
Fig. 5. Order composition of bacterial communities at each nominal PBDE concentration (ng g-1), with
and without microplastics (present/absent). Relative abundance was calculated as rarefied number of
sequences in OTU/total sequences in each sample (= 6359), relative abundances per treatment (N=3)
are plotted on Y axis. For ease of representation taxa of an abundance of <0.02 (2%) from an individual
sample were excluded. *Note one sample was removed from this treatment due to inefficient
sequencing, therefore N=2.
4. Discussion
4.1. The snail microbiome
The individuals used in this test were taken from the field and acclimated for this test, therefore
the microbial data acquired here is likely representative of biological variability within wild L.
stagnalis. While the microbiome analysis in this study considered the whole microbiome of the
snail, it is expected that the majority of OTUs derive from the gut bacterial community. This
is highlighted in the communities across all treatments being dominated by Enterobacterales
(Fig. 5), a common order comprising gut bacteria (Hu et al., 2018). For example, Klebsiella,
the most dominant genus observed here within the family Enterobacteriacae (Fig. S5), is a
polysaccharide degrader linked to the presence of cellulase (Imran et al., 2016). The L.
stagnalis core microbiome in this study appears to be similar to other freshwater snails and
*
189
associated habitats including Enterobacterales, Flavobacterales and Bacillales corresponding
to lactic acid production (food fermentation) and cellulose degradation (Béguin, 1990; Dar et
al., 2017; Hu et al., 2018).
4.2. PBDE accumulation and effects on microbiome
All sediment PBDE concentrations were lower than the nominal concentrations when measured
at the end of the exposures. The half-lives of BDEs-47, 99, 100 and 153 are all estimated to be
approximately 14,400 hours in sediment (Wania and Dugani, 2003), therefore degradation over
the experimental time period is not likely to have been a significant factor leading to the
discrepancies between nominal and measured concentrations observed here (estimated 0.3%
loss due to degradation over 96 hours based on a half-life of 14,400 hours). Some loss of
PBDEs may have occurred as a result of volatilisation during the solvent evaporation step, and
some may also have bound to the walls of the glass exposure vessels.
BDE 47 has the lowest log Kow, which would indicate a greater (although still low)
partitioning into the water phase than for the other more hydrophobic PDBEs. In a marine
study, Mizukawa et al. (2009) found that proportionally, higher brominated BDE congeners
(BDE 209) associated most strongly with sediments, while the composition within overlying
seawater was dominated by lower brominated congeners (predominantly BDE 47, but also
including BDEs 99 and 100). In our study, BDE 47 followed by BDE 99 accumulated most in
the snails, with higher internal concentrations compared to the other congeners (Fig. 1). This
corresponds with evidence which shows that BDEs 47 and 99 are the most bioavailable PBDE
congeners, due to a lower molecular weight and smaller molecules than higher brominated
congeners (Liang et al., 2010; Mizukawa et al., 2009; Watanabe and Sakai, 2003; Zhang et al.,
2016).
There were a number of sulfate reducing bacteria observed within snails exposed to PBDEs
(most notably Desulfobacterales and Syntrophobacterales, Fig. 5), bacteria also recognised to
be associated with the debromination of PBDEs (Zhao et al., 2018). These bacteria have not
commonly been described in relation to other freshwater snail species (Hu et al., 2018) and
were not present within the controls. Burkholderiales, one of the dominant orders found within
these snails across all treatments, are also associated with PBDE degradation, especially lower
brominated congeners (Robrock et al., 2009).
190
PBDE concentration had no significant influence on the microbiome, a result which is in
contrast to other studies which found that PBDEs affected bacterial community composition
and diversity in sediments and within guts, with changes being congener-dependent (Li et al.,
2018; Wang et al., 2018a; Yen et al., 2009). This difference is likely to be because these studies
represent different exposure scenarios (via food or water) and also generally used much higher
PBDE concentrations (e.g. µg g-1 concentrations in food), although Chen et al. (2018) found
significant microbiome community shift in zebrafish exposed to just 5 ng L-1 in water. We
therefore reject the starting hypothesis that increasing PBDE sediment concentrations lead to
significant structural changes in the microbiome community over an acute timescale.
4.3. Effects of microplastics on snail physiology and microbiome
There was no effect of any exposure condition on survival. Microplastics did subtly affect the
wet weight of the snails. In general, the weight of all snails declined throughout the experiment,
likely due to the lack of food within the exposure. However, this decline was less pronounced
in snails exposed to microplastics (average 0.03 g weight decline in microplastic-exposed
snails, compared to average 0.11 g decline in non microplastic-exposed snails). The reasons
for this difference are not clear; most microplastic exposure studies observe a more pronounced
weight decline in exposed organisms (Besseling et al., 2013; Zhu et al., 2018a).
The lack of significant influence of microplastics on the microbiome (Fig. 3) is in contrast to
other studies on the microbiome response in invertebrates (Zhu et al., 2018a; Zhu et al., 2018b).
For example, Zhu et al. (2018b) found a significant increase in the family Bacillaceae within
collembolan guts following exposure to microplastics, while our analysis found the order
Bacillales to be present in both the microplastic and non-microplastic treatments (Fig 5). Many
gut bacteria are derived from, and influenced by, ingested material, therefore feeding behaviour
is likely to have a significant influence on the gut microbiome (Turnbaugh et al., 2009; Zhu et
al., 2018b). It was chosen not to feed the snails during the acute exposure, and hence any
alterations within the microbiome community could be ascribed solely to the microplastic,
PBDEs and their interaction. Despite the lack of significance of microplastics alone, the
microbiome analysis suggests that microplastics can subtly influence PBDE impacts on the
microbiome. For example, while not significant, there appears to be a tendency for the diversity
of non-core bacteria to be lower at higher PBDE concentrations in the absence of microplastics,
a trend which is not evident when microplastics were present (Fig. 4, Fig S2). Microplastics
191
also appear to slightly reduce variability between individuals within the microplastic controls
compared to non-microplastic controls i.e. ‘reference’ gut conditions (Figs. 3 and 4). Within
natural conditions, a higher microbial diversity between individuals may be beneficial for
populations, increasing resilience to perturbation (Heiman and Greenway, 2016; Lozupone et
al., 2012).
4.4.Influence of microplastics and PBDE co-exposure on accumulation and microbiome
Microplastics did not influence sediment PBDE concentrations. This result was expected as
the microplastics were not removed from the sediment samples before analysis, therefore
during analysis, PBDEs were likely to have been extracted from both the sediment and
microplastics simultaneously. The concentrations of PBDEs within the sediment significantly
affected the amount of PBDEs taken up within the snail, in line with the expected relationship
between external exposure concentration and snail body burden.
Given that snails were not depurated before chemical analysis of the whole body, this analysis
took into account any chemicals present within the gut content, in addition to those in snail
tissues. Microplastics did not influence the uptake of BDEs-99, 100, 153, nor PBDE uptake as
a whole. Therefore these PBDEs were equally available regardless of the presence of
microplastics and our hypothesis was not supported. This is in contrast to previous studies
carried out on microplastic and PBDE interactions, where microplastics have been shown to
enhance uptake of PBDEs into fish tissue (Rochman et al., 2013c).
Previous studies have shown that PBDEs can transfer from microplastics into body tissues
(Chua et al., 2014; Rochman et al., 2013c). Hence, the concentrations measured here are indeed
likely to be a combination of both gut content and tissue concentrations, especially as our
preliminary studies have shown that the nylon particles are ingested by snails (personal
observation.). PBDEs entering tissues are unlikely to be taken up only by ingestion of
contaminated particles, as the foot of the snail will be exposed to the sediment-based PBDEs
by direct contact with the sediment, and to aqueous phase PBDEs through contact with the
water phase (Bakir et al., 2016). To allow uptake into tissues, desorption of the chemical from
the sediment (or microplastic) surface, whether externally or within the gut, is needed as a
prelude to uptake. While it is anticipated that the main route of exposure to PBDEs was via the
sediment (either dermally or via ingestion) (Mizukawa et al., 2009), aqueous phase uptake may
also be important and the precise nature of exposure may also vary dependent on the behaviour
192
of the BDE congener: BDE 47 was the only PBDE whose concentration in snails was
significantly reduced in the presence of microplastics. BDE 47 is the congener with the lowest
log Kow at 6.81, which would be expected to sorb the least strongly to particles (both
microplastics and sediment) compared to the other congeners (although it is still highly
hydrophobic). This reduced binding affinity could have led to greater BDE 47 partitioning into
the water phase in the absence of microplastics, facilitating uptake. The presence of
microplastics may have increased the partitioning of BDE 47 to sediment through the addition
of a further surface binding phase with a high affinity for HOCs, thus reducing BDE 47 in the
more bioavailable water phase, resulting in reduced bioavailability and uptake (Fig. 1).
While microplastics can sorb chemicals, other media (e.g. organic matter, sediment) may also
accumulate HOCs and therefore should be also be taken into account when considering
pathways for exposure and bioavailability (Bakir et al., 2016; Koelmans et al., 2016). Further,
if considering trophic transfer, the interactions with the sediment also indicate the importance
of measuring organisms with a full gut, as we did within this study (rather than depurated
organisms as is usually the case in chemical bioaccumulation studies), given that PBDEs
associated with the gut content may also be bioavailable.
No consistent significant differences were observed in snail microbiome community diversity
in response to either the microplastic or PBDE treatments, although a trend for reduced
diversity at high PDBE concentrations in the absence of microplastics was suggested, which
warrants further investigation. Hence, our hypothesis of chemical effects on the snail
microbiome, influenced by microplastics, was not supported over the short exposure timescale
used. When investigating the differences in abundance of specific OTUs, significant
differences were seen in the abundance of Enterobacteriaceae and Flavobacteriaceae between
the control and high PBDE concentration, only when microplastics were absent (Table S1).
Enterobacterales can be induced to bloom within the gut under conditions of stress, for example
inflammatory responses produced by the gut immune system (Stecher et al., 2012), which may
explain their increase in the presence of high PBDE concentrations. Flavobacterales have been
associated with polymer degradation (Mergaert and Swings, 1996; Nogales et al., 2011) and
have been commonly found associated with marine plastic debris (Bryant et al., 2016;
Oberbeckmann et al., 2018) which could explain their decline in the absence of microplastics
(combined with high PBDE concentrations), although it is not possible to link those
characteristics directly to this study. The fact that these results were seen only in the absence
193
of microplastics suggests that microplastics may be buffering the effects of PBDEs on the
microbiota, although only subtly.
4.5. Long term implications and outlook
Short and long-term exposure are likely to lead to very different microbial community
responses, therefore acute exposures can provide information on initial responses to
perturbation that would be not be observed during chronic tests (Shade et al., 2012). There is
evidence to suggest that microbiomes will respond very quickly to perturbations, for example
a study by Yen et al. (2009) found that BDEs 153 and 154 rapidly and irreversibly changed the
bacterial community within sediment (within 24 hours). Studies which have found significant
changes in organism microbiomes following invertebrate exposure to microplastics usually run
for longer timescales, e.g. enchytraeids exposed for seven days (Zhu et al., 2018a) and
collembolans exposed for 56 days (Zhu et al., 2018b).
The subtle variations in response of the snail microbiome to microplastic exposure, PBDE
exposure and co-exposure over a 96 hour exposure indicated that these stressors do affect the
structure of the gut community. However, overall response to aspects such as overall diversity
were not evident to the same extent as for studies with other species conducted over longer
exposure times. These results, therefore, highlight the complexity of responses of organisms to
microplastics and organic chemicals, and show the importance of carrying out further studies
to understand the interaction between microplastics and HOCs and their influence on
organisms in a variety of exposure scenarios and time-scales.
5. Conclusions
Microplastics did not affect survival of the snails. The weight of all snails generally declined
throughout the exposure period, however, this decline was lower in snails exposed to
microplastics. An increased concentration of PBDE in the sediment led to an increased body
burden within the snails, however microplastics did not significantly influence this uptake
when considering all PBDE congeners overall. BDE 47 was the only congener influenced by
the presence of microplastics, leading to a significantly reduced internal concentration in the
presence of microplastics. Overall, the diversity and composition of the snail microbiome was

194
not significantly altered by the presence of PBDEs or microplastics, or both combined.
However, when considering individual OTUs, significant effects on individual responses were
found that can be functionally linked to the exposure of snails to the PBDEs added, a result
only observed in the absence of microplastics. This suggests that microplastics influence how
PBDEs will impact on specific OTUs. In summary, these results suggest that microplastics and
PBDEs have a limited effect both individually and when combined on HOC accumulation and
the microbiome of Lymnaea stagnalis within an acute exposure. However the subtle effects
seen highlight the importance of carrying out further studies to better understand the
mechanisms causing the interaction between microplastics and HOCs given that these
relationships may become more pronounced over extended time-scales.
Acknowledgements
This study was funded by the Newton Fund, grant number UKNE/N00065X/1 awarded to the
Universidade Federal do Paraná, Brazil and the Centre for Ecology and Hydrology, UK, and
Conselho Nacional das Fundações Estaduais de Amparo à Pesquisa - Fundação Araucária,
grant number 45191.460.30251.29012015. We would like to thank Alex Walton for
characterising the nylon particles.
195
References
Amorim, J., et al., 2019. Lymnaea stagnalis as a freshwater model invertebrate for
ecotoxicological studies. Science of the Total Environment. 669, 11-28.
Anderson, M. J., 2001. A new method for non-parametric multivariate analysis of variance.
Austral Ecology. 26, 32-46.
Ašmonaitė, G., et al., 2018. Size Matters: Ingestion of Relatively Large Microplastics
Contaminated with Environmental Pollutants Posed Little Risk for Fish Health and
Fillet Quality. Environmental Science & Technology. 52, 14381-14391.
Bakir, A., et al., 2016. Relative importance of microplastics as a pathway for the transfer of
hydrophobic organic chemicals to marine life. Environmental Pollution. 219, 56-65.
Béguin, P., 1990. Molecular Biology of Cellulose Degradation. Annual Review of
Microbiology. 44, 219-248.
Beiras, R., Tato, T., 2019. Microplastics do not increase toxicity of a hydrophobic organic
chemical to marine plankton. Marine Pollution Bulletin. 138, 58-62.
Besseling, E., et al., 2017. The Effect of Microplastic on the Uptake of Chemicals by the
Lugworm Arenicola marina (L.) under Environmentally Relevant Exposure
Conditions. Environmental Science & Technology. 51, 8795-8804.
Besseling, E., et al., 2013. Effects of microplastic on fitness and PCB bioaccumulation by the
lugworm Arenicola marina (L.). Environmental Science & Technology. 47, 593-600.
Bryant, J. A., et al., 2016. Diversity and activity of communities inhabiting plastic debris in the
North Pacific Gyre. MSystems. 1, e00024-16.
Chen, L., et al., 2018. Acute exposure to PBDEs at an environmentally realistic concentration
causes abrupt changes in the gut microbiota and host health of zebrafish. Environmental
Pollution. 240, 17-26.
Chua, E. M., et al., 2014. Assimilation of Polybrominated Diphenyl Ethers from Microplastics
by the Marine Amphipod, Allorchestes Compressa. Environmental Science &
Technology. 48, 8127-8134.
Clarke, K. R., 1993. Non-parametric multivariate analyses of changes in community structure.
Australian Journal of Ecology. 18, 117-143.
Coeurdassier, M., et al., 2004. Effects of cadmium on the survival of three life-stages of the
freshwater pulmonate Lymnaea stagnalis (Mollusca: Gastropoda). Bulletin of
Environmental Contamination and Toxicology. 72, 1083-1090.
196
Dar, M. A., et al., Gut Microbiome Analysis of Snails: A Biotechnological Approach.
Organismal and Molecular Malacology. In: Organismal and Molecular Malacology,
InTech, 2017.
DeSantis, T. Z., et al., 2006. Greengenes, a chimera-checked 16S rRNA gene database and
workbench compatible with ARB. Applied and Environmental Microbiology. 72, 5069-
5072.
Geyer, H., et al., 1982. Prediction of ecotoxicological behaviour of chemicals: relationship
between physico-chemical properties and bioaccumulation of organic chemicals in the
mussel Mytilus edulis. Chemosphere. 11, 1121-1134.
Giraudoux, P., et al., pgirmess: Spatial Analysis and Data Mining for Field Ecologists. R
package version 1.6.9., 2018.
Guan, Y.-F., et al., 2007. Riverine inputs of polybrominated diphenyl ethers from the Pearl
River Delta (China) to the coastal ocean. Environmental Science & Technology. 41,
6007-6013.
Hassanin, A., et al., 2004. PBDEs in European Background Soils: Levels and Factors
Controlling Their Distribution. Environmental Science & Technology. 38, 738-745.
Heiman, M. L., Greenway, F. L., 2016. A healthy gastrointestinal microbiome is dependent on
dietary diversity. Molecular Metabolism. 5, 317-320.
Hirai, H., et al., 2011. Organic micropollutants in marine plastics debris from the open ocean
and remote and urban beaches. Marine Pollution Bulletin. 62, 1683-92.
Horton, A. A., et al., 2018. Acute toxicity of organic pesticides to Daphnia magna is unchanged
by co-exposure to polystyrene microplastics. Ecotoxicology and Environmental Safety.
166, 26-34.
Hu, Z., et al., 2018. Compositional and predicted functional analysis of the gut microbiota of
Radix auricularia (Linnaeus) via high-throughput Illumina sequencing. PeerJ. 6,
e5537.
Imran, M., et al., 2016. The gut-associated Klebsiella sp. of the apple snail produces multiple
polysaccharide degrading enzymes.
Jin, Y., et al., 2018. Polystyrene microplastics induce microbiota dysbiosis and inflammation
in the gut of adult zebrafish. Environmental Pollution. 235, 322-329.
Karapanagioti, H. K., et al., 2011. Diffuse pollution by persistent organic pollutants as
measured in plastic pellets sampled from various beaches in Greece. Marine Pollution
Bulletin. 62, 312-317.
197
Koelmans, A. A., et al., 2016. Microplastic as a Vector for Chemicals in the Aquatic
Environment: Critical Review and Model-Supported Reinterpretation of Empirical
Studies. Environmental Science & Technology. 50, 3315-26.
Kozich, J. J., et al., 2013. Development of a dual-index sequencing strategy and curation
pipeline for analyzing amplicon sequence data on the MiSeq Illumina sequencing
platform. Appl Environ Microbiol. 79, 5112-20.
Li, C. Y., et al., 2018. PBDEs Altered Gut Microbiome and Bile Acid Homeostasis in Male
C57BL/6 Mice. Drug metabolism and disposition: the biological fate of chemicals. 46,
1226-1240.
Liang, X., et al., 2010. Bioaccumulation and bioavailability of polybrominated diphynel ethers
(PBDEs) in soil. Environmental Pollution. 158, 2387-2392.
Licht, T. R., Bahl, M. I., 2018. Impact of the gut microbiota on chemical risk assessment.
Current Opinion in Toxicology. . In press.
Lozupone, C. A., et al., 2012. Diversity, stability and resilience of the human gut microbiota.
Nature. 489, 220-230.
Lu, L., et al., 2018. Polystyrene microplastics induce gut microbiota dysbiosis and hepatic lipid
metabolism disorder in mice. Science of the Total Environment. 631-632, 449-458.
Luo, Q., et al., 2007. Polybrominated diphenyl ethers in fish and sediment from river polluted
by electronic waste. Science of the Total Environment. 383, 115-127.
Magurran, A. E., 2004. Measuring Biological Diversity. Blackwell Publishing, Oxford, UK.
McMurdie, P. J., Holmes, S., 2013. phyloseq: an R package for reproducible interactive
analysis and graphics of microbiome census data. PLOS ONE. 8, e61217.
Mergaert, J., Swings, J., 1996. Biodiversity of microorganisms that degrade bacterial and
synthetic polyesters. Journal of industrial microbiology. 17, 463-469.
Mizukawa, K., et al., 2009. Bioconcentration and biomagnification of polybrominated diphenyl
ethers (PBDEs) through lower-trophic-level coastal marine food web. Marine Pollution
Bulletin. 58, 1217-1224.
Nogales, B., et al., 2011. Anthropogenic perturbations in marine microbial communities.
FEMS Microbiology Reviews. 35, 275-298.
Oberbeckmann, S., et al., 2018. Environmental Factors Support the Formation of Specific
Bacterial Assemblages on Microplastics. Frontiers in microbiology. 8, 2709-2709.
OECD, 2016. Test No. 243: Lymnaea stagnalis Reproduction Test. OECD Publishing.
Oksanen, J., et al., 2013. Package vegan: community ecology package. R package version 2.0-
7. R Foundation for Statistical Computing, Vienna, Austria.
198
Rahman, F., et al., 2001. Polybrominated diphenyl ether (PBDE) flame retardants. Science of
the Total Environment. 275, 1-17.
Robrock, K. R., et al., 2009. Aerobic Biotransformation of Polybrominated Diphenyl Ethers
(PBDEs) by Bacterial Isolates. Environmental Science & Technology. 43, 5705-5711.
Rochman, C. M., et al., 2013a. Ingested plastic transfers hazardous chemicals to fish and
induces hepatic stress. Scientific Reports. 3, 3263.
Rochman, C. M., et al., 2013b. Polystyrene plastic: a source and sink for polycyclic aromatic
hydrocarbons in the marine environment. Environmental Science and Technology. 47,
13976-84.
Rognes, T., et al., 2016. VSEARCH: a versatile open source tool for metagenomics. PeerJ. 4,
e2584.
SAPEA, A Scientific Perspective on Microplastics in Nature and Society. Science Advice for
Policy by European Academies, 2019.
Sellström, U., et al., 1998. Polybrominated diphenyl ethers and hexabromocyclododecane in
sediment and fish from a Swedish River. Environmental Toxicology and Chemistry.
17, 1065-1072.
Shade, A., et al., 2012. Fundamentals of microbial community resistance and resilience.
Frontiers in microbiology. 3, 417.
Shanmuganathan, D., et al., 2011. Polybrominated diphenyl ethers (PBDEs) in marine
foodstuffs in Australia: residue levels and contamination status of PBDEs. Marine
Pollution Bulletin. 63, 154-159.
Stecher, B., et al., 2012. Gut inflammation can boost horizontal gene transfer between
pathogenic and commensal Enterobacteriaceae. Proceedings of the National Academy
of Sciences. 109, 1269-1274.
Takahashi, S., et al., 2014. Development of a prokaryotic universal primer for simultaneous
analysis of bacteria and archaea using next-generation sequencing. PLOS ONE. 9,
e105592.
Tindall, B. J., et al., 2010. Notes on the characterization of prokaryote strains for taxonomic
purposes. International Journal of Systematic and Evolutionary Microbiology. 60, 249-
266.
Turnbaugh, P. J., et al., 2009. The effect of diet on the human gut microbiome: a metagenomic
analysis in humanized gnotobiotic mice. Science translational medicine. 1, 6ra14-
6ra14.
199
Wang, D., et al., 2018. In utero and lactational exposure to BDE-47 promotes obesity
development in mouse offspring fed a high-fat diet: impaired lipid metabolism and
intestinal dysbiosis. Archives of Toxicology. 92, 1847-1860.
Wang, Q., et al., 2007. Naive Bayesian classifier for rapid assignment of rRNA sequences into
the new bacterial taxonomy. Applied and Environmental Microbiology. 73, 5261-5267.
Wania, F., Dugani, C. B., 2003. Assessing the long-range transport potential of polybrominated
diphenyl ethers: A comparison of four multimedia models. Environmental Toxicology
and Chemistry. 22, 1252-1261.
Watanabe, I., Sakai, S.-i., 2003. Environmental release and behavior of brominated flame
retardants. Environment International. 29, 665-682.
Wickham, H., 2016. ggplot2: elegant graphics for data analysis. Springer.
Yen, J. H., et al., 2009. Interaction of polybrominated diphenyl ethers (PBDEs) with anaerobic
mixed bacterial cultures isolated from river sediment. Journal of Hazardous Materials.
165, 518-524.
Yin, G., et al., 2017. Spatial distribution and bioaccumulation of polychlorinated biphenyls
(PCBs) and polybrominated diphenyl ethers (PBDEs) in snails (Bellamya aeruginosa)
and sediments from Taihu Lake area, China. Environmental Science and Pollution
Research. 24, 7740-7751.
Zhang, Y., et al., 2016. Environmental Characteristics of Polybrominated Diphenyl Ethers in
Marine System, with Emphasis on Marine Organisms and Sediments. BioMed research
international. 2016, 1317232-1317232.
Zhao, S., et al., 2018. Reductive Debromination of Polybrominated Diphenyl Ethers -
Microbes, Processes and Dehalogenases. Frontiers in microbiology. 9.
Zhu, B.-K., et al., 2018a. Exposure to nanoplastics disturbs the gut microbiome in the soil
oligochaete Enchytraeus crypticus. Environmental Pollution. 239, 408-415.
Zhu, D., et al., 2018b. Exposure of soil collembolans to microplastics perturbs their gut
microbiota and alters their isotopic composition. Soil Biology and Biochemistry. 116,
302-310.
Zonneveld, C., Kooijman, S., 1989. Application of a dynamic energy budget model to Lymnaea
stagnalis (L.). Functional Ecology. 269-278.
200
CHAPTER 6
SUPPLEMENTARY INFORMATION
DNA extraction procedure
Three snails were analysed per treatment. Frozen snails were defrosted, removed from the
shells, then rinsed in phosphate buffered saline prior to DNA extraction. In order to capture the
entire snail microbiome, DNA was extracted from a whole snail through the application of both
chemical and enzymatic lysis. Per 250 mg of snail tissue 100 µl of lysis buffer (10 ppmL 1 M
Tris pH7.5, 1 ppmL 0.5 M EDTA, 2 ppmL 10% SDS and 4 ppmL 5 M NaCl, made up in
molecular grade water) and 20 µl proteinase K solution (20 mg ml-1) was added. Tissue was
ground and mixed with a disposable polypropylene tissue pestle and handheld tissue grinder.
To ensure complete cell lysis, samples were incubated at 37°C overnight. When samples were
fully lysed, proteins were removed through the addition of 600 µl 5M NaCl (per 250 mg of
snail weight), mixed well through vortexing and allowed to precipitate for 10 mins at room
temperature. 700 µl of lysate was moved to a clean tube and centrifuged at 20000 x g for 10
minutes. Supernatant was transferred to a new tube, mixed by inversion and DNA precipitated
through the addition of 650 µl absolute ethanol. DNA was pelleted through centrifugation at
20000 x g for 10 minutes. Ethanol was removed and pelleted DNA was cleaned using 400 µl
70% ethanol. Pellet was centrifuged again at 20000 x g for 2 minutes and ethanol aspirated.
Pelleted DNA was air dried to remove residual ethanol and resuspended in 500 µl molecular
grade water. Sample DNA required an additional cleaning step performed through the
application of Genomic DNA Clean & Concentrator kit (Zymo research) under the
manufacturer’s recommended protocol. Resultant DNA was quantified using the nanodrop
8000 UV-Vis spectrophotometer (ThermoFisher scientific).
201
Fig S1. Microscope images showing fluorescently labelled nylon particles within the guts of snails:
blank controls (no microplastics) = A-C, microplastic controls = D-F and 3000 ng g-1 PBDEs with
microplastics = G-I.
A B C
D E
F
G
I
H
202
Table S1. The OTUs which show the most change in abundance between the highest nominal PBDE concentration (3000) and control treatment, without
microplastics (a) or with microplastics (b). Significance at the P > 0.05 level was determined through the application of a Kruskal Wallis test. Significant
OTUs are highlighted with an asterisk. Taxonomic identity is given at the highest resolution, using a 97% threshold. ^abundance based on rarefied values
(a) Without Microplastics
Average^ Standard deviation ratio
Average^ in 3000 ng g-1
Average^ in solvent control
Cumulative sum
Kruskal-Wallis chi-squared
df P value Taxonomic Identity
OTU5512* 0.02 0.02 1.48 357.33 74.67 0.28 3.86 1 0.0495* Enterobacteriaceae OTU4432* 0.02 0.01 1.48 355.67 81 0.32 3.86 1 0.0495* Enterobacteriaceae OTU32 0.10 0.06 1.79 2851.33 1621.67 0.18 2.33 1
0.1266 Enterobacteriaceae (Klebsiella)
OTU2245 0.01 0.01 0.96 84 35 0.42 0.05 1 0.8273 Enterobacteriaceae (Serratia marcescens)
OTU8733* 0.03 0.02 1.27 146.67 547 0.24 3.86 1 0.0495* Flavobacteriaceae OTU12263 0.01 0.02 0.72 16.33 154 0.36 1.19 1
0.2752 Leptotrichiaceae (Streptobacillus moniliformis)
OTU3412 0.01 0.01 1.69 170.67 172.67 0.34 0.05 1 0.8273 Pasteurellales OTU16390 0.01 0.01 0.93 15 119.33 0.41 2.33 1 0.1266 Rhodospirillaceae OTU10409 0.01 0.01 1.15 98.33 172 0.39 0.43 1 0.512 Bacteroidales OTU3010 0.01 0.01 1.45 144.67 124.67 0.38 0.05 1 0.8273 Neisseriaceae
203
(b) With Microplastics
Average^ Standard deviation
ratio Average^ in 3000 ng g-1
Average^ in solvent control
Cumulative sum
Kruskal-Wallis chi-squared
df P value Taxonomic Identity
OTU5512 0.02 0.01 1.18 140.5 252.67 0.29 0 1 1 Enterobacteriaceae OTU4432 0.01 0.01 1.16 118 230.67 0.31 0.33 1 0.5637 Enterobacteriaceae
OTU32 0.19 0.09 2.07 892.5 3265.67 0.26 3 1 0.0833 Enterobacteriaceae (Klebsiella)
OTU2245 0.01 0.01 1.03 218 53.67 0.33 0 1 1 Enterobacteriaceae (Serratia marcescens)
OTU8733 0.01 0 3.03 172.5 140.33 0.35 0 1 1 Flavobacteriaceae
OTU12263 0.01 0 1.87 87.5 10 0.43 3 1 0.0833 Leptotrichiaceae (Streptobacillus moniliformis)
OTU3010 0.01 0.01 1.12 197.5 69 0.37 0.33 1 0.5637 Neisseriaceae OTU3412 0.01 0.01 1.2 214.5 120.67 0.39 0.33 1 0.5637 Pasteurellales OTU16395 0.01 0.01 1.07 103.5 19 0.41 0 1 1 Rhizobiaceae OTU10409 0.01 0.01 1.5 212 69.67 0.40 3 1 0.0833 Bacteroidales OTU999 0.02 0.01 1.18 140.5 252.67 0.29 0 1 0.2207 Desulfobacteraceae
204
Fig S2. Linear regression of Fisher’s log alpha diversity in relation to total sediment PBDE
concentration (all congeners combined). Each data point represents an individual snail. Only one
sediment concentration value was measured per treatment, therefore these regression lines are to
provide a visual representation of the data only.
205
Fig S3. NMDS plots showing community dissimilarity for each PBDE treatment, with or without
microplastics.
206
Fig. S4. Class composition of bacterial communities at each nominal PBDE concentration (ng g-1), with
and without microplastics (present/absent). Relative abundance was calculated as rarefied number of
sequences in OTU/total sequences in each sample (= 6359), relative abundances per treatment (N=3)
are plotted on Y axis. For ease of representation classes of an abundance of <0.02 (2%) from an
individual sample were excluded. *Note one sample was removed from this treatment due to inefficient
sequencing, therefore N=2.
*
207
Fig S5. Genus composition of bacterial communities at each nominal PBDE concentration (ng g-1), with
and without microplastics (present/absent). Relative abundance was calculated as rarefied number of
sequences in OTU/total sequences in each sample (= 6359), relative abundances per treatment (N=3)
are plotted on Y axis. For ease of representation genera of an abundance of <0.03 (3%) from an
individual sample were excluded. *Note one sample was removed from this treatment due to inefficient
sequencing, therefore N=2.
*