Embed Size (px)
Citation preview

Full-Year 2015 Presentation

Page 2
Full-Year 2015 Presentation
Full-Year 2015 Presentation / February 18, 2016 /
Dr. Dieter Zetsche Bodo Uebber February 18, 2016 The figures in this document have been adjusted subsequent to the disclosure on February 4, 2016
in order to reflect expenses from the recall in connection with Takata airbags.

Daimler AG Full-Year 2015 Presentation / February 18, 2016 / Page 3
Winning a championship is hard. Defending one is even harder

Daimler AG
Contents
Full-Year 2015 Presentation / February 18, 2016 / Page 4
Highlights 2015
Key figures
Divisional information
Group financials
Outlook
Guidance

Daimler AG Full-Year 2015 Presentation / February 18, 2016 / Page 5
2011 2012 2013 2014 2015
Mercedes-Benz Cars: All-time sales record. Again
2 mn
Daimler AG
China
Full-Year 2015 Presentation / February 18, 2016 / Page 6
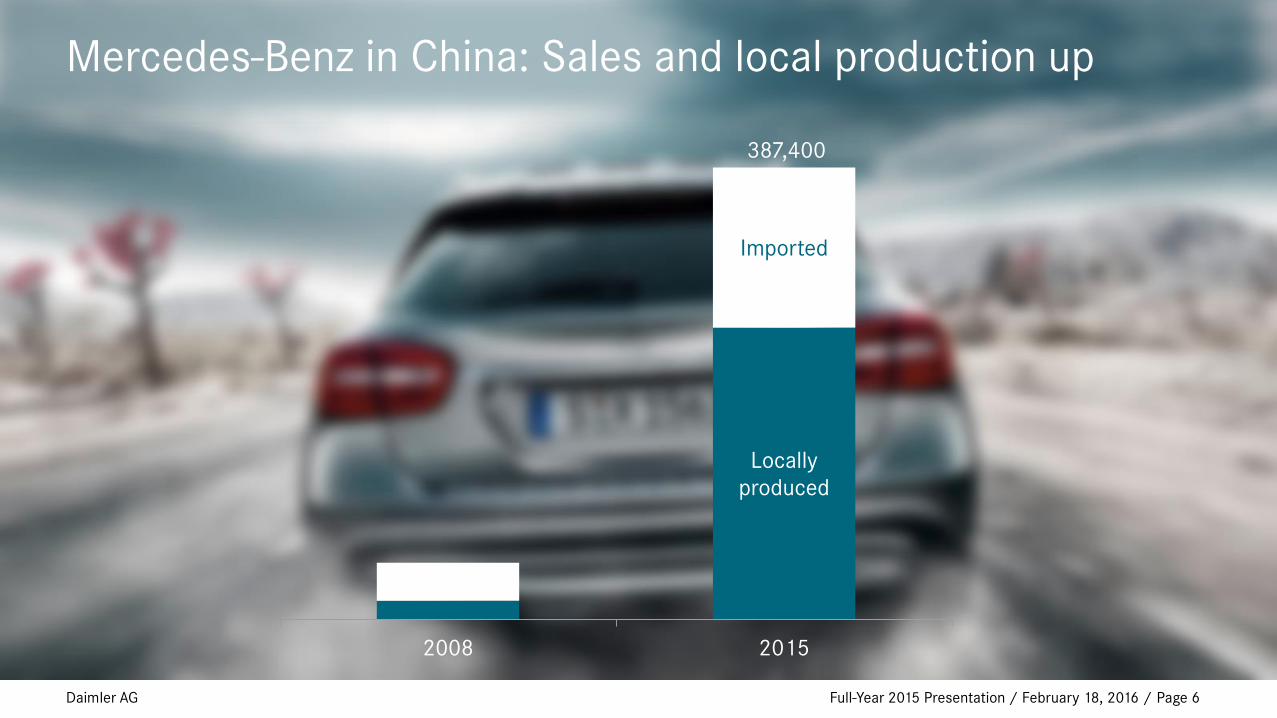
Mercedes-Benz in China: Sales and local production up
Locally
produced
Imported
2008 2015
387,400
Daimler AG Full-Year 2015 Presentation / February 18, 2016 / Page 7
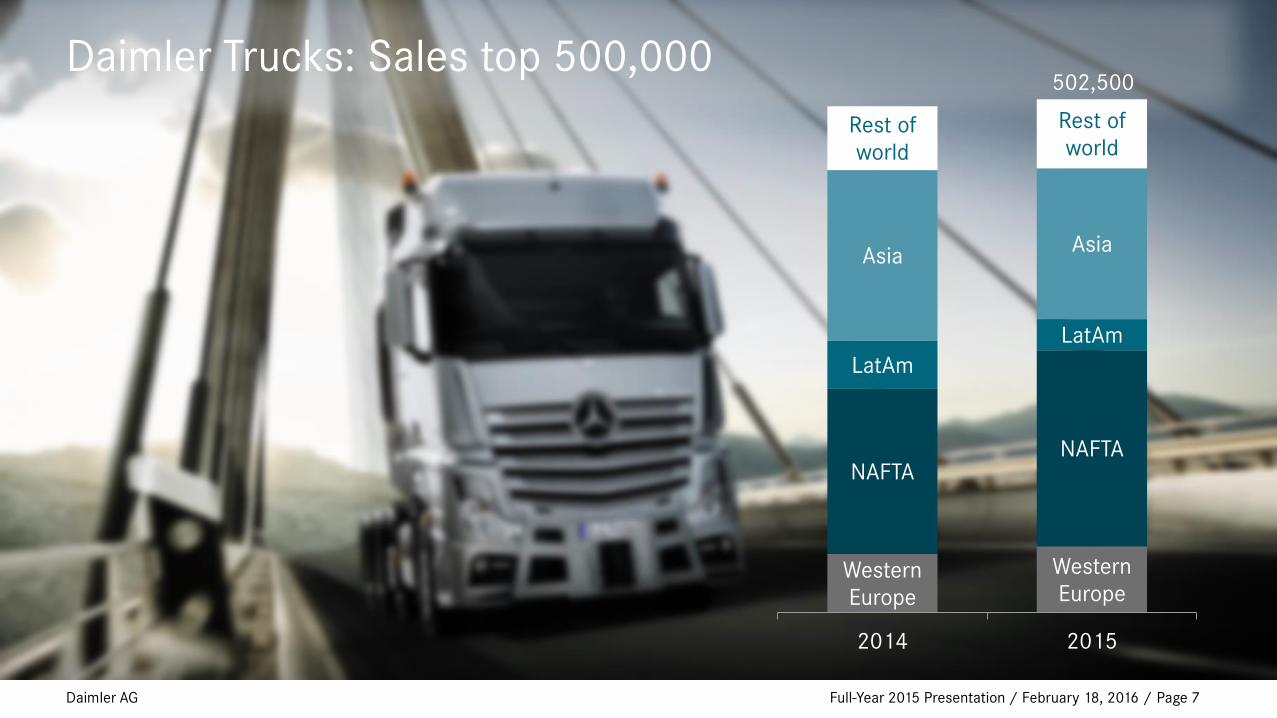
Daimler Trucks: Sales top 500,000
Western
Europe
Western
Europe
NAFTA NAFTA
LatAm
LatAm
Asia Asia
Rest of
world
Rest of
world
2014 2015
502,500

Daimler AG Full-Year 2015 Presentation / February 18, 2016 /
Daimler Buses: Leader in our core markets
Page 8
Western
Europe
Germany
Brazil
Market shares (in percent)*
30.9
49.3
52.5
*Based on estimates in certain markets
Daimler AG Full-Year 2015 Presentation / February 18, 2016 / Page 9
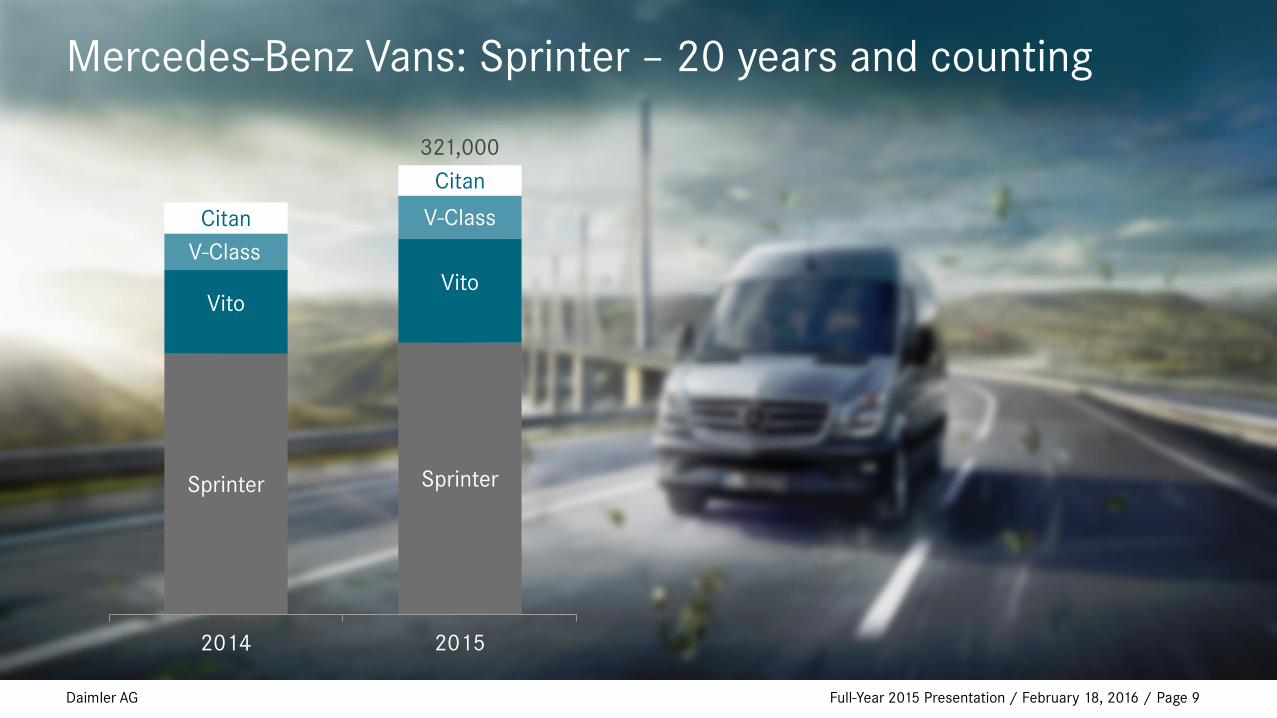
Mercedes-Benz Vans: Sprinter – 20 years and counting
Sprinter Sprinter
Vito Vito
V-Class
V-Class Citan
Citan
2014 2015
321,000

Daimler AG Full-Year 2015 Presentation / February 18, 2016 / Page 10
Daimler Financial Services: Engaging customers for life
2009 2010 2011 2012 2013 2014 2015
Number of DFS customers
3.72 mn
Daimler AG
Contents
Full-Year 2015 Presentation / February 18, 2016 / Page 11
Highlights 2015
Key figures
Divisional information
Group financials
Outlook
Guidance
Daimler AG
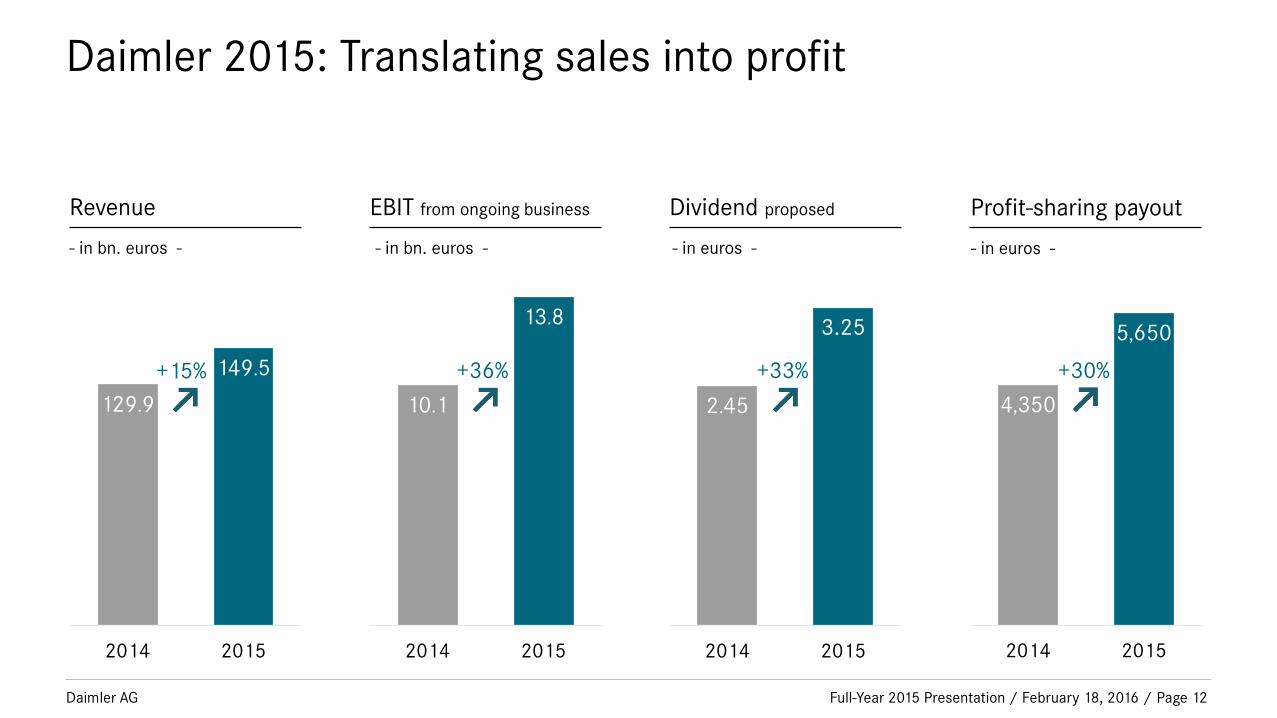
Daimler 2015: Translating sales into profit
129.9
149.5
2014 2015
Revenue
- in bn. euros -
Full-Year 2015 Presentation / February 18, 2016 / Page 12
EBIT from ongoing business
10.1
13.8
2014 2015
- in bn. euros -
Dividend proposed
2.45
3.25
2014 2015
- in euros -
Profit-sharing payout
- in euros -
+15% +36% +33%
4,350
5,650
2014 2015
+30%
Daimler AG
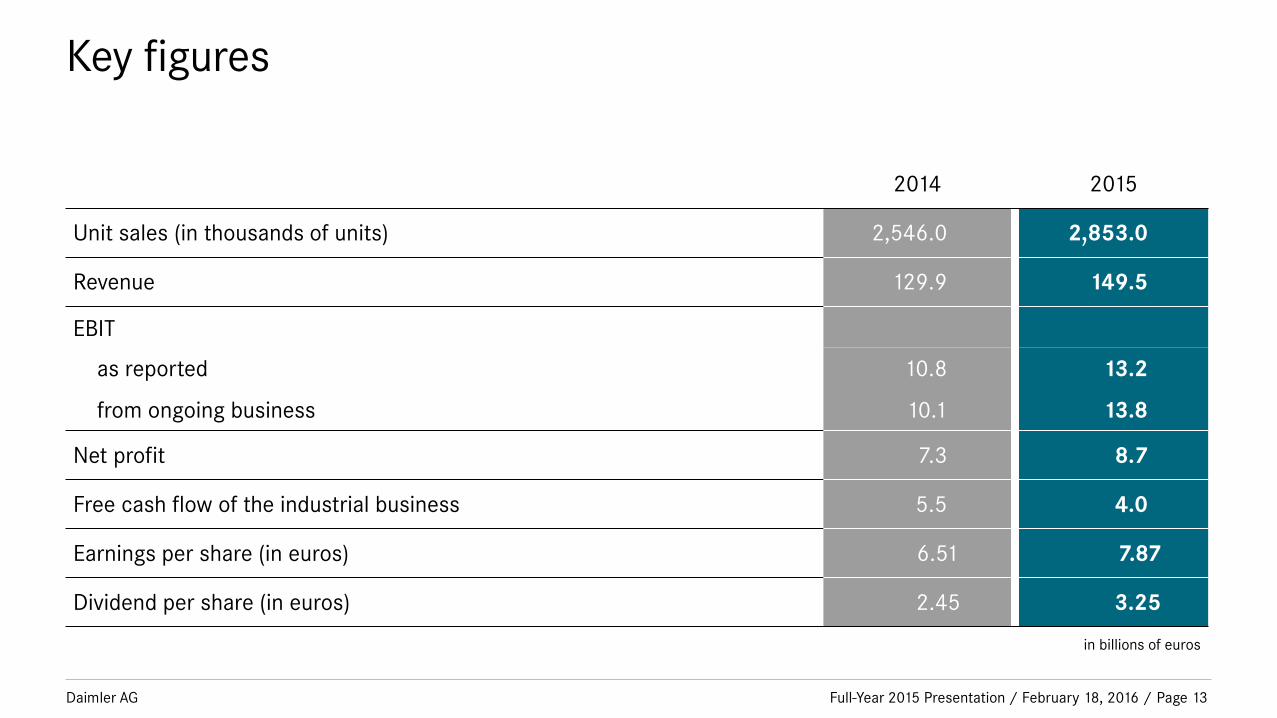
Key figures
Full-Year 2015 Presentation / February 18, 2016 / Page 13
2014 2015
Unit sales (in thousands of units) 2,546.0 2,853.0
Revenue 129.9 149.5
EBIT
as reported 10.8 13.2
from ongoing business 10.1 13.8
Net profit 7.3 8.7
Free cash flow of the industrial business 5.5 4.0
Earnings per share (in euros) 6.51 7.87
Dividend per share (in euros) 2.45 3.25
in billions of euros

Daimler AG
Net industrial liquidity: development in 2015
Full-Year 2015 Presentation / February 18, 2016 /
Free cash flow industrial business
FY 2015: €4.0bn
Net industrial
liquidity
12/31/2014
Earnings and
other cash flow
impact
Working capital
impact
Other (mainly FX effects, capital
increases to DFS and dividend
payments to minority
shareholders)
Net industrial
liquidity
12/31/2015
-2.7
18.6 +0.2
17.0
+8.6
-1.9
Pension/
healthcare; M&A
-2.6
Dividend payment
Daimler AG
- in billions of euros -
Page 14
Daimler AG
Contents
Full-Year 2015 Presentation / February 18, 2016 / Page 15
Highlights 2015
Key figures
Divisional information
Group financials
Outlook
Guidance
Daimler AG
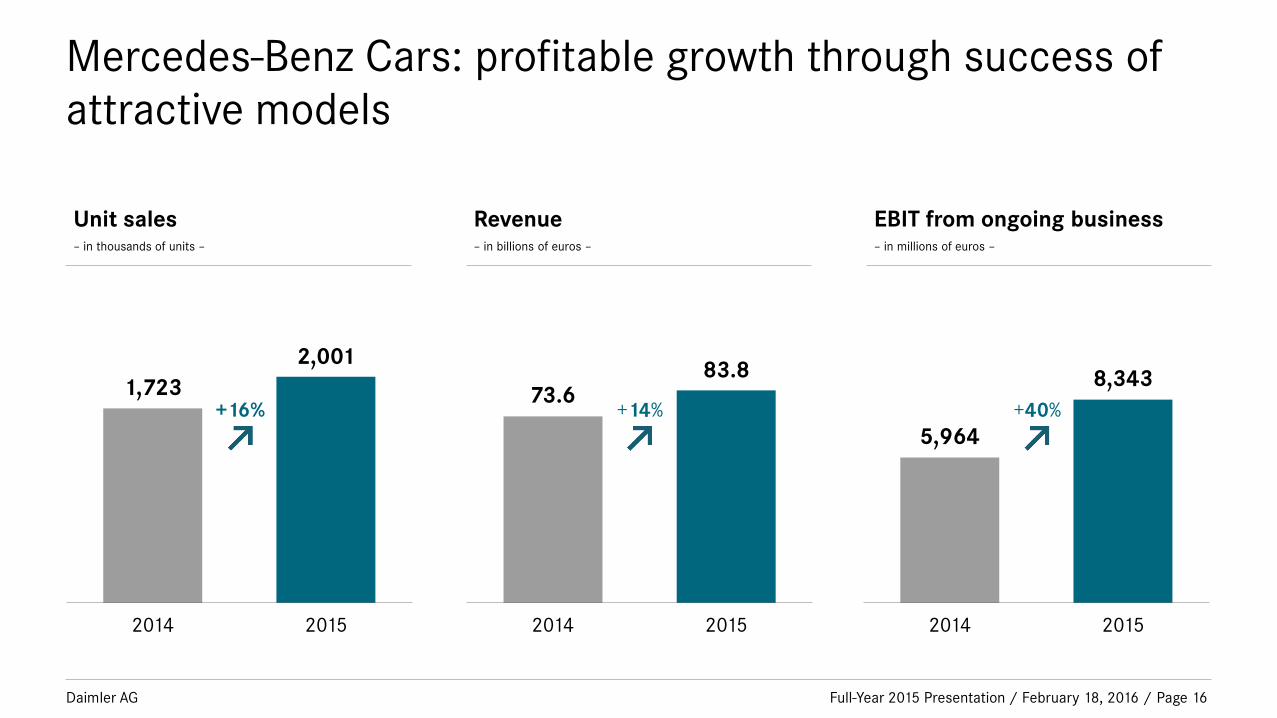
Mercedes-Benz Cars: profitable growth through success of
attractive models
Full-Year 2015 Presentation / February 18, 2016 /
Unit sales – in thousands of units –
2014 2015
Revenue – in billions of euros –
EBIT from ongoing business – in millions of euros –
1,723
2,001
2014 2015
73.6 83.8
2014 2015
5,964
8,343
Page 16
+16% +14% +40%

Daimler AG
Mercedes-Benz Cars: sales volume at new record level
Full-Year 2015 Presentation / February 18, 2016 /
* incl. GLA
- in thousands of units -
2014
1,723
2,001
2015
425
470
306
106
29
387
342
329
115
31
smart
E-Class
C-Class
A-/B-Class
S-Class
Sports Cars 121
92 SUVs*
426
543
Page 17
Daimler AG
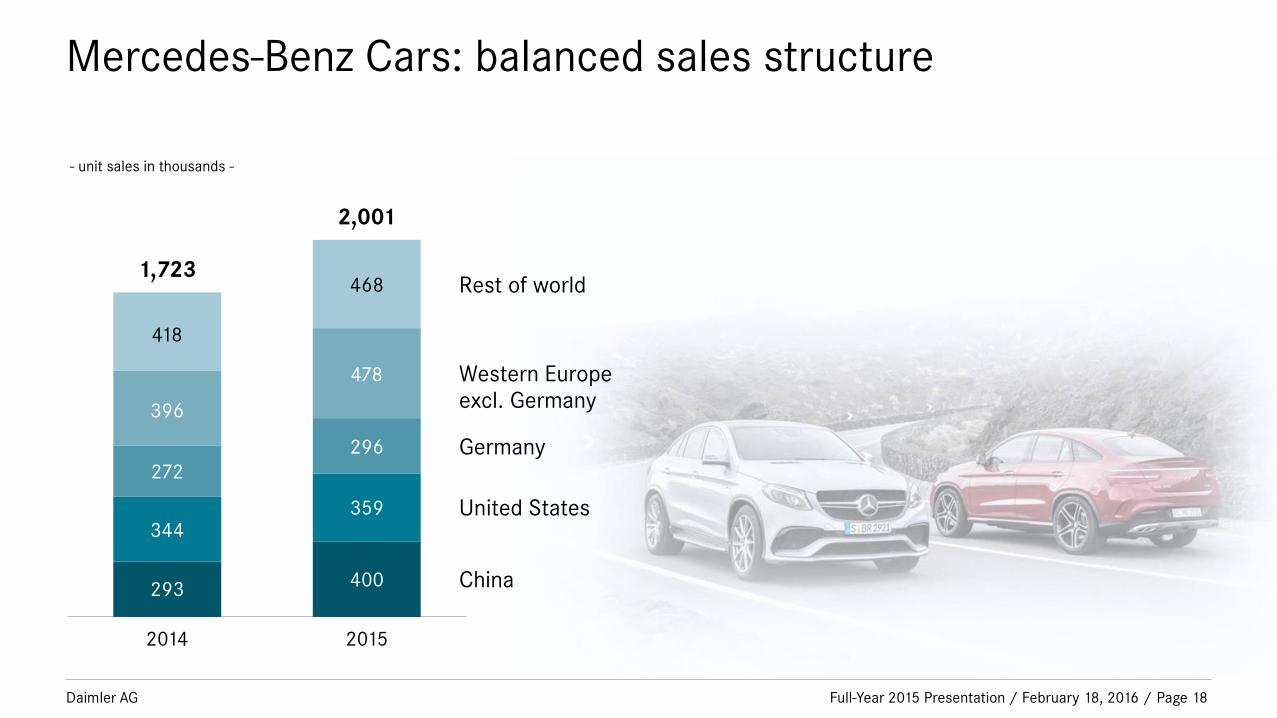
Mercedes-Benz Cars: balanced sales structure
Full-Year 2015 Presentation / February 18, 2016 /
- unit sales in thousands -
2014
1,723
2,001
2015
400
359
296
478
293
344
272
396
Rest of world
Germany
United States
China
Western Europe excl. Germany
418
468
Page 18
Daimler AG
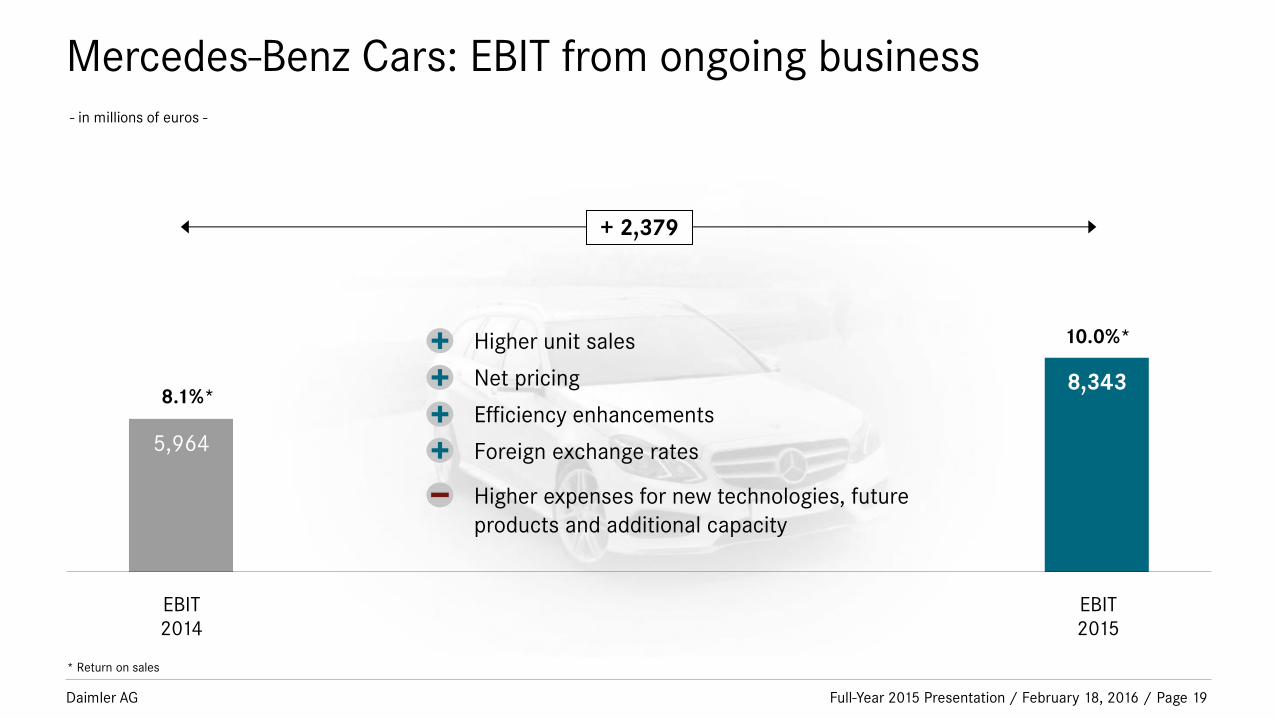
Mercedes-Benz Cars: EBIT from ongoing business
Full-Year 2015 Presentation / February 18, 2016 /
- in millions of euros -
* Return on sales
EBIT
2014
EBIT
2015
5,964
8,343
+ 2,379
8.1%*
10.0%* Higher unit sales
Net pricing
Efficiency enhancements
Foreign exchange rates
Higher expenses for new technologies, future
products and additional capacity
Page 19
Daimler AG
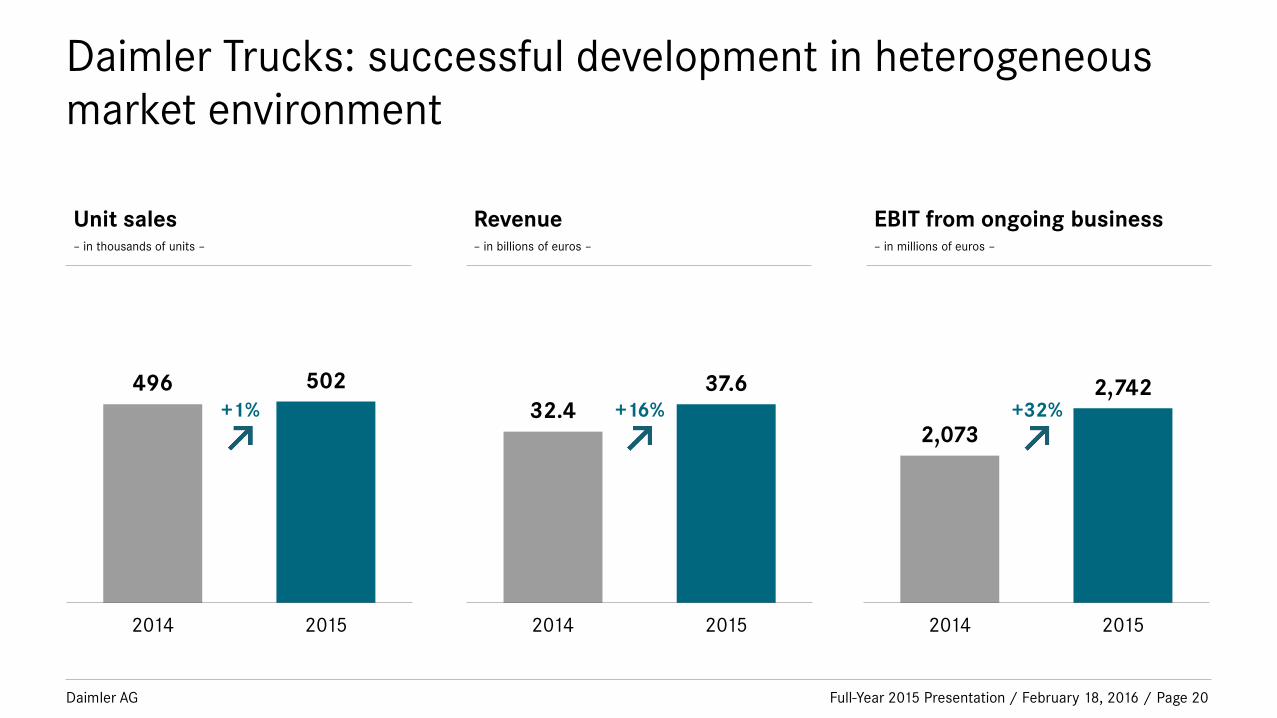
Daimler Trucks: successful development in heterogeneous
market environment
Full-Year 2015 Presentation / February 18, 2016 /
Unit sales – in thousands of units –
2014 2015
Revenue – in billions of euros –
EBIT from ongoing business – in millions of euros –
496 502
2014 2015
32.4
37.6
2014 2015
2,073
2,742
Page 20
+1% +16% +32%
Daimler AG
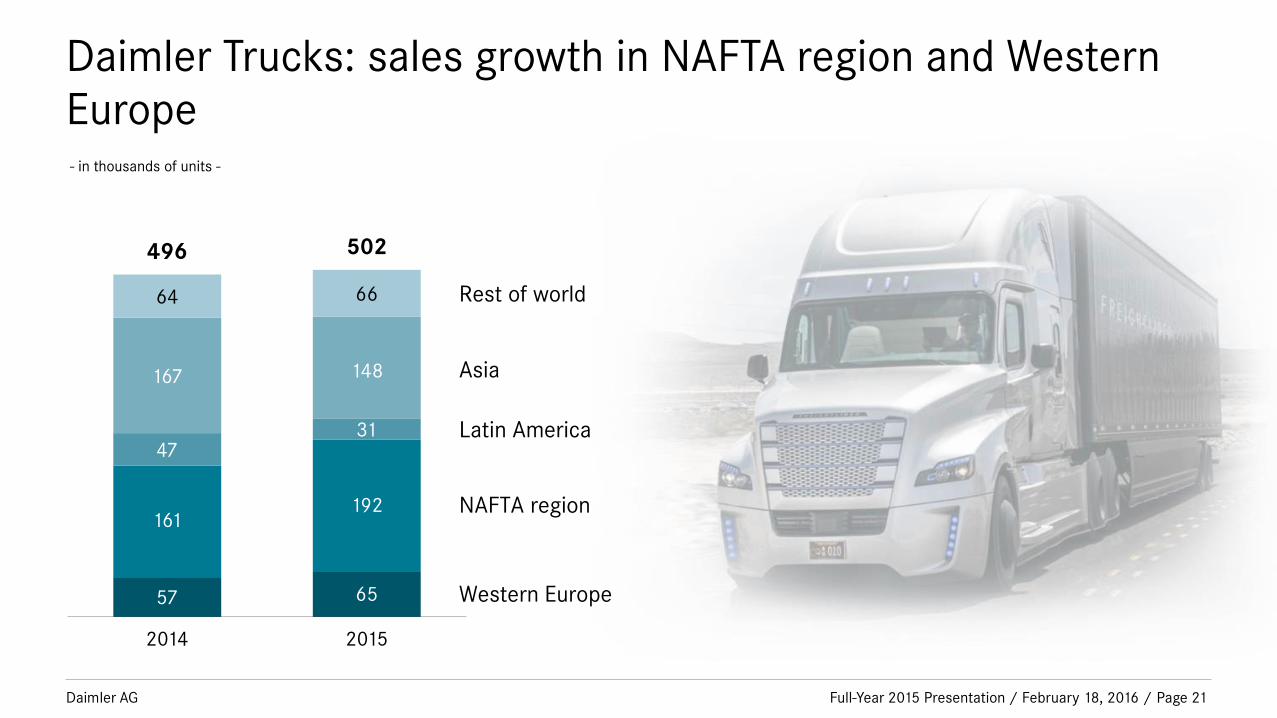
Daimler Trucks: sales growth in NAFTA region and Western
Europe
Full-Year 2015 Presentation / February 18, 2016 /
- in thousands of units -
2014
496 502
2015
65
192
31
148
57
161
47
167
Rest of world
Latin America
NAFTA region
Western Europe
Asia
64 66
Page 21
Daimler AG
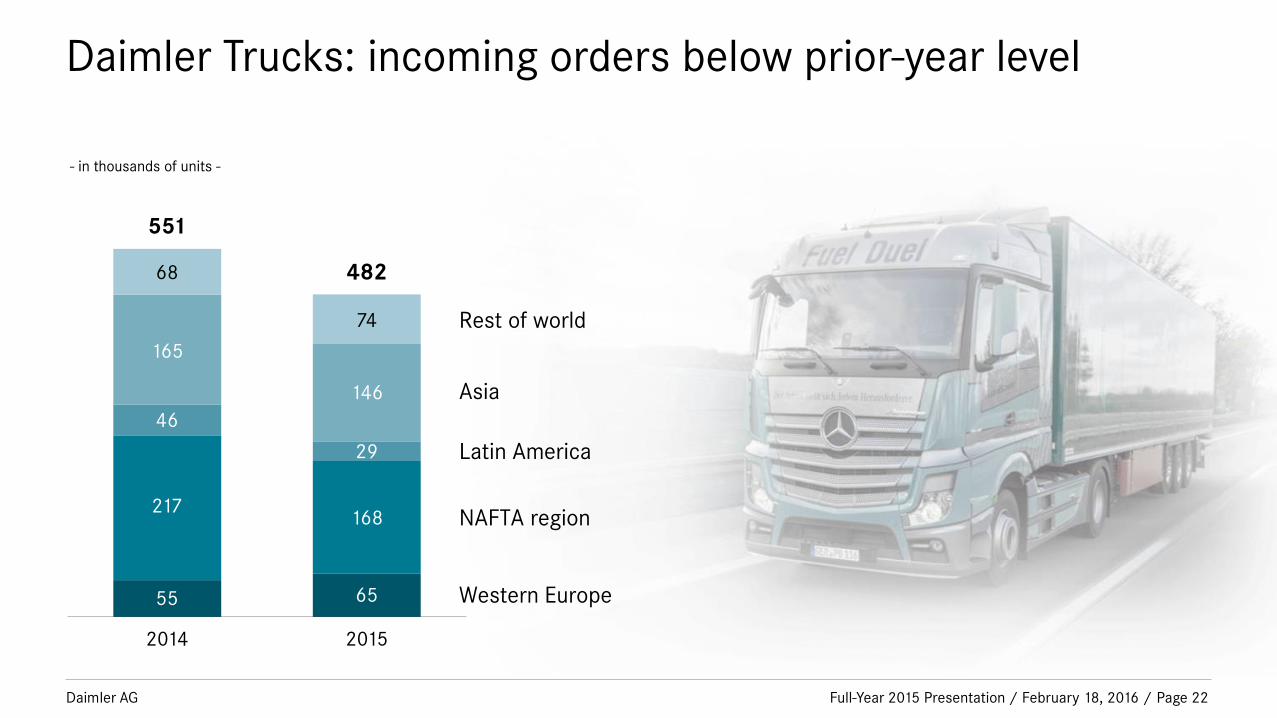
Daimler Trucks: incoming orders below prior-year level
Full-Year 2015 Presentation / February 18, 2016 /
- in thousands of units -
2014
551
482
2015
65
168
29
146
55
217
46
165
Rest of world
Latin America
NAFTA region
Western Europe
Asia
68
74
Page 22

Daimler AG
Daimler Trucks: EBIT from ongoing business
Full-Year 2015 Presentation / February 18, 2016 /
- in millions of euros -
* Return on sales
EBIT
2014
EBIT
2015
2,073
2,742
+ 669
6.4%*
7.3%* Higher unit sales in NAFTA region and Europe
Efficiency enhancements
Foreign exchange rates
Lower unit sales in Latin America and Indonesia
Higher expenses for new technologies, future
products and additional capacity
Warranty and goodwill costs
Page 23

Daimler AG
Mercedes-Benz Vans: success in volatile markets
Full-Year 2015 Presentation / February 18, 2016 /
Unit sales – in thousands of units –
2014 2015
Revenue – in billions of euros –
EBIT from ongoing business – in millions of euros –
295 321
2014 2015
10.0 11.5
2014 2015
638
952
Page 24
+9% +15% +49%
Daimler AG
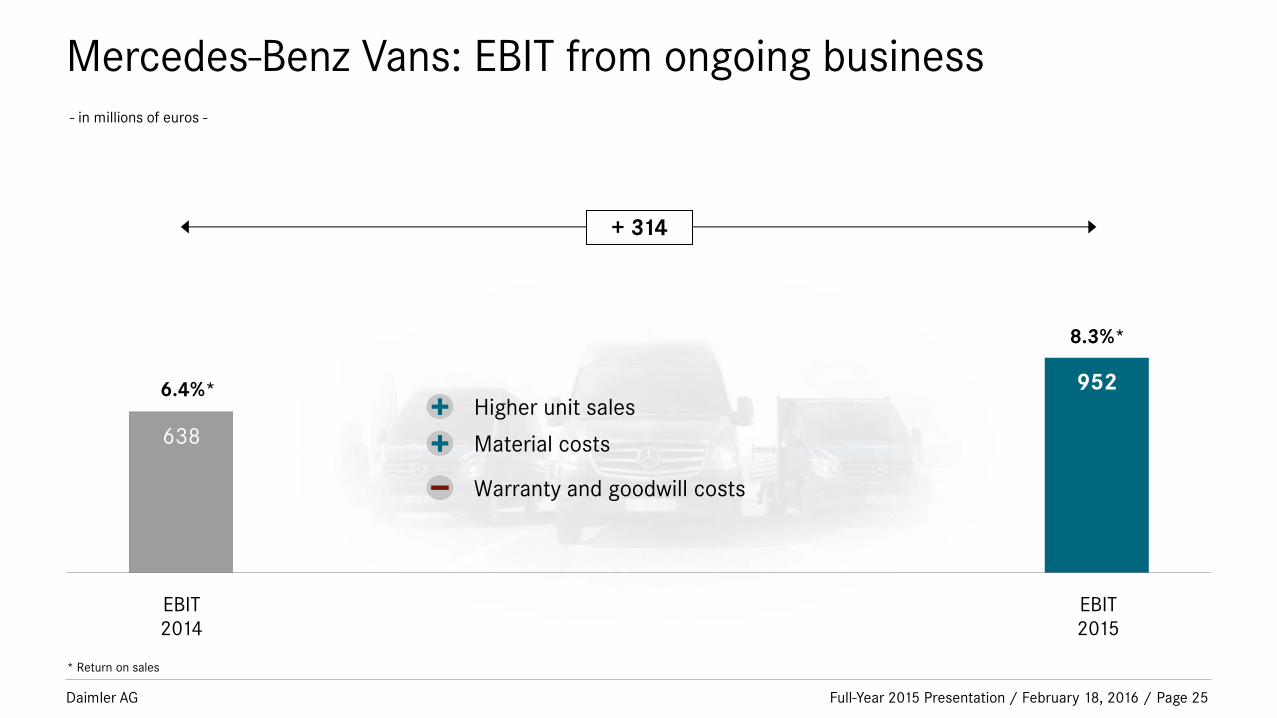
Mercedes-Benz Vans: EBIT from ongoing business
Full-Year 2015 Presentation / February 18, 2016 /
- in millions of euros -
* Return on sales
EBIT
2014
EBIT
2015
638
952
+ 314
6.4%*
8.3%*
Higher unit sales
Material costs
Warranty and goodwill costs
Page 25
Daimler AG
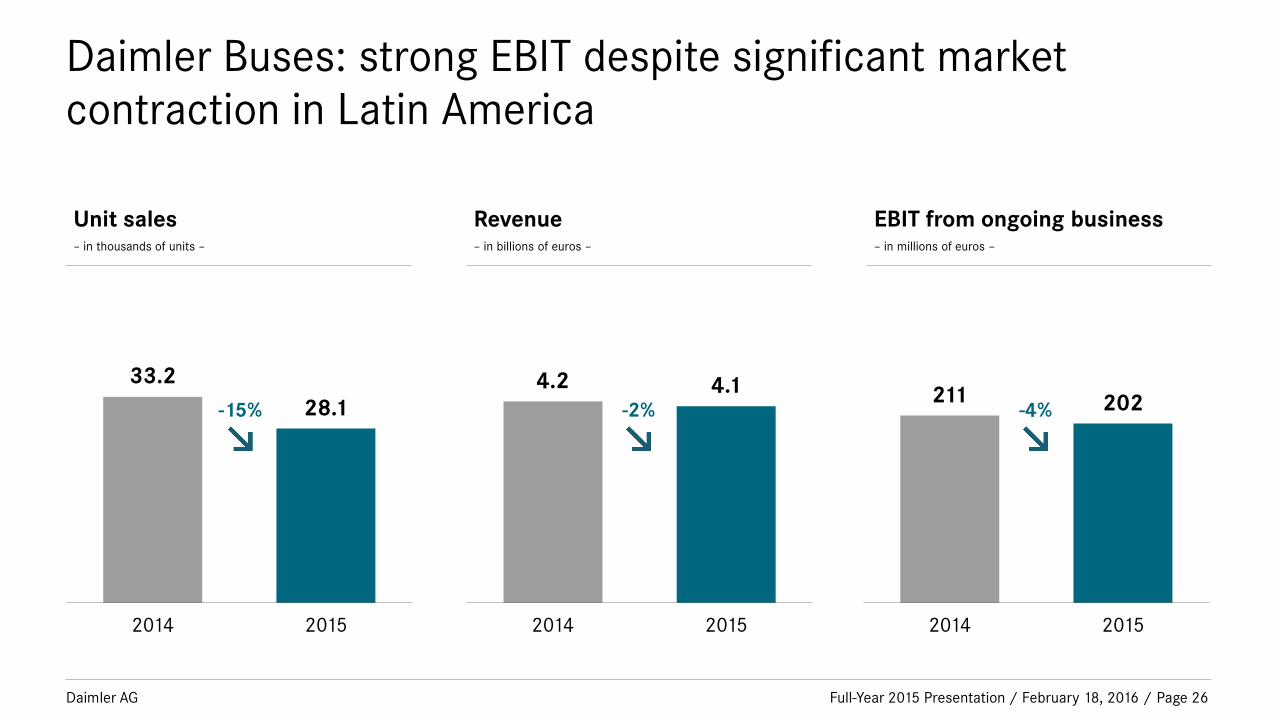
Daimler Buses: strong EBIT despite significant market
contraction in Latin America
Full-Year 2015 Presentation / February 18, 2016 /
Unit sales – in thousands of units –
2014 2015
Revenue – in billions of euros –
EBIT from ongoing business – in millions of euros –
33.2
28.1
2014 2015
4.2 4.1
2014 2015
211 202
Page 26
-15% -2% -4%
Daimler AG
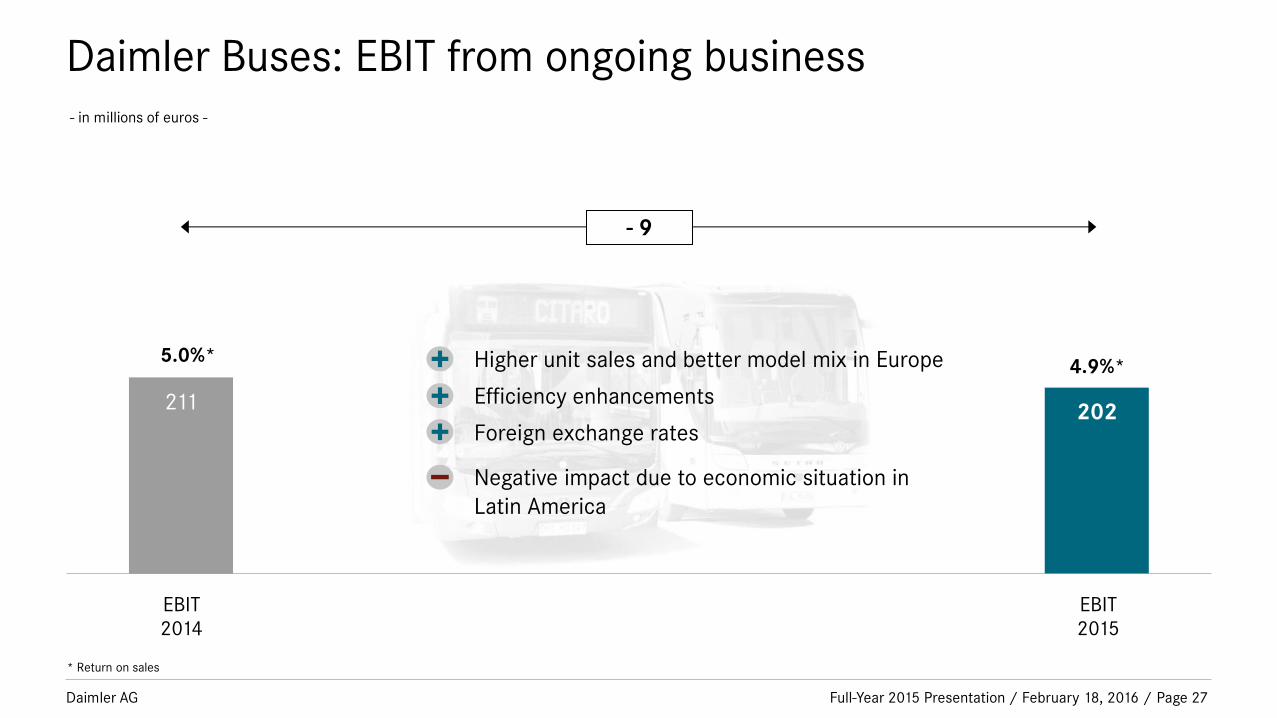
Daimler Buses: EBIT from ongoing business
Full-Year 2015 Presentation / February 18, 2016 /
- in millions of euros -
* Return on sales
EBIT
2014
EBIT
2015
211 202
- 9
5.0%* 4.9%*
Page 27
Higher unit sales and better model mix in Europe
Efficiency enhancements
Foreign exchange rates
Negative impact due to economic situation in
Latin America
Daimler AG
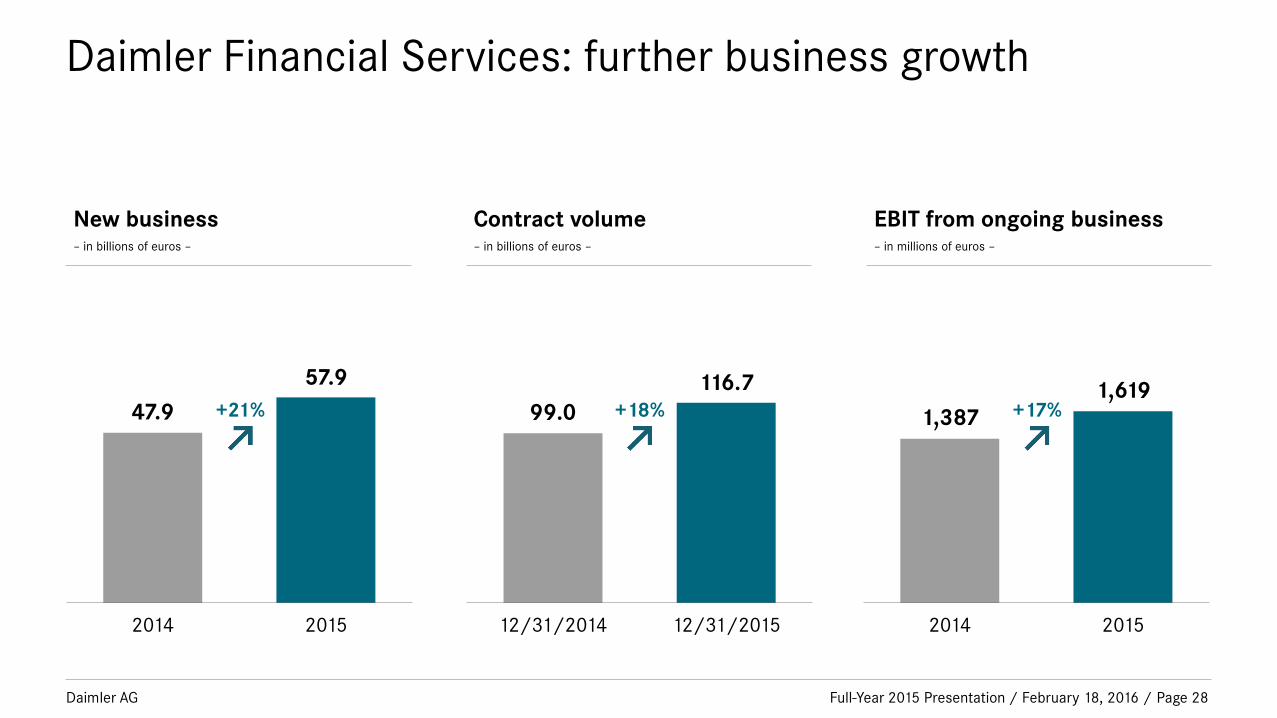
Daimler Financial Services: further business growth
Full-Year 2015 Presentation / February 18, 2016 /
New business – in billions of euros –
2014 2015
Contract volume – in billions of euros –
EBIT from ongoing business – in millions of euros –
47.9
57.9
12/31/2014 12/31/2015
99.0
116.7
2014 2015
1,387
1,619
Page 28
+21% +18% +17%

Daimler AG
Daimler Financial Services: EBIT from ongoing business
Full-Year 2015 Presentation / February 18, 2016 /
- in millions of euros -
* Return on equity
EBIT
2014
EBIT
2015
1,387
1,619
+ 232
19.4%*
18.3%*
Higher contract volume
Foreign exchange rates
Higher expenses due to business growth
Page 29

Daimler AG
Contents
Full-Year 2015 Presentation / February 18, 2016 / Page 30
Highlights 2015
Key figures
Divisional information
Group financials
Outlook
Guidance
Daimler AG
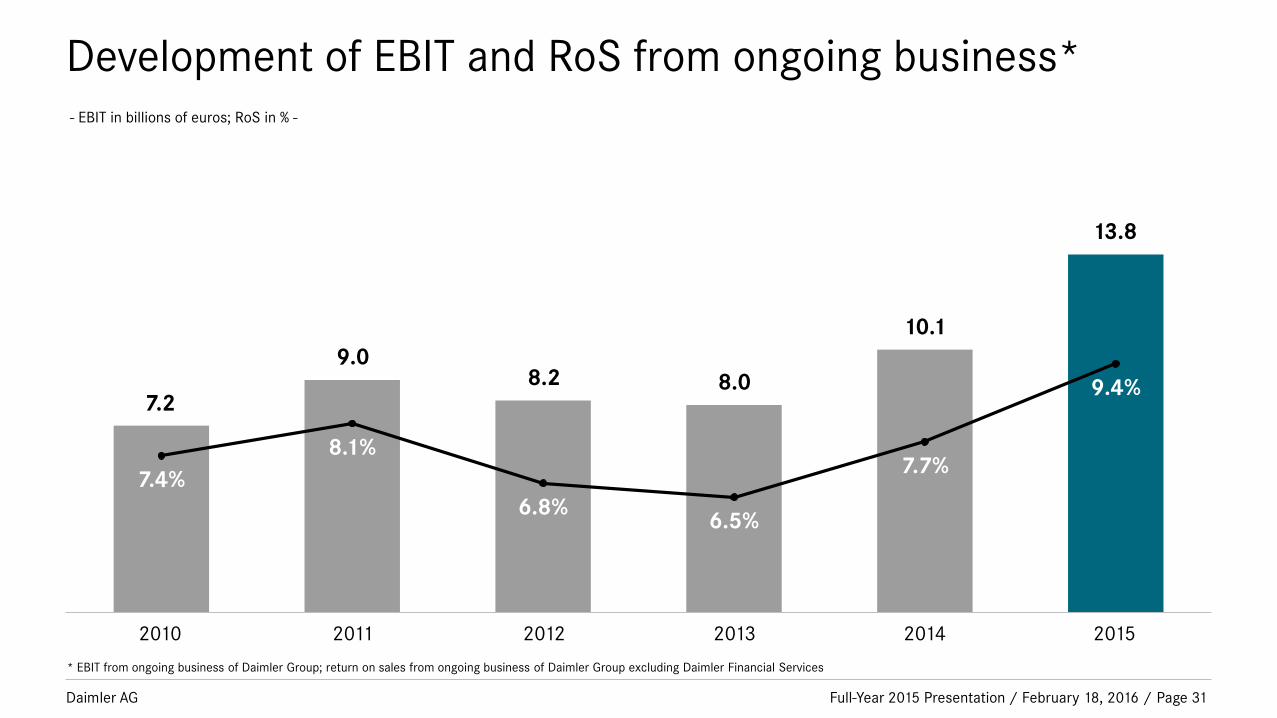
Development of EBIT and RoS from ongoing business*
Full-Year 2015 Presentation / February 18, 2016 / Page 31
7.4%
8.1%
6.8% 6.5%
7.7%
9.4% 8.2
10.1
8.0 7.2
9.0
- EBIT in billions of euros; RoS in % -
13.8
2010 2011 2012 2013 2015 2014
* EBIT from ongoing business of Daimler Group; return on sales from ongoing business of Daimler Group excluding Daimler Financial Services
Daimler AG
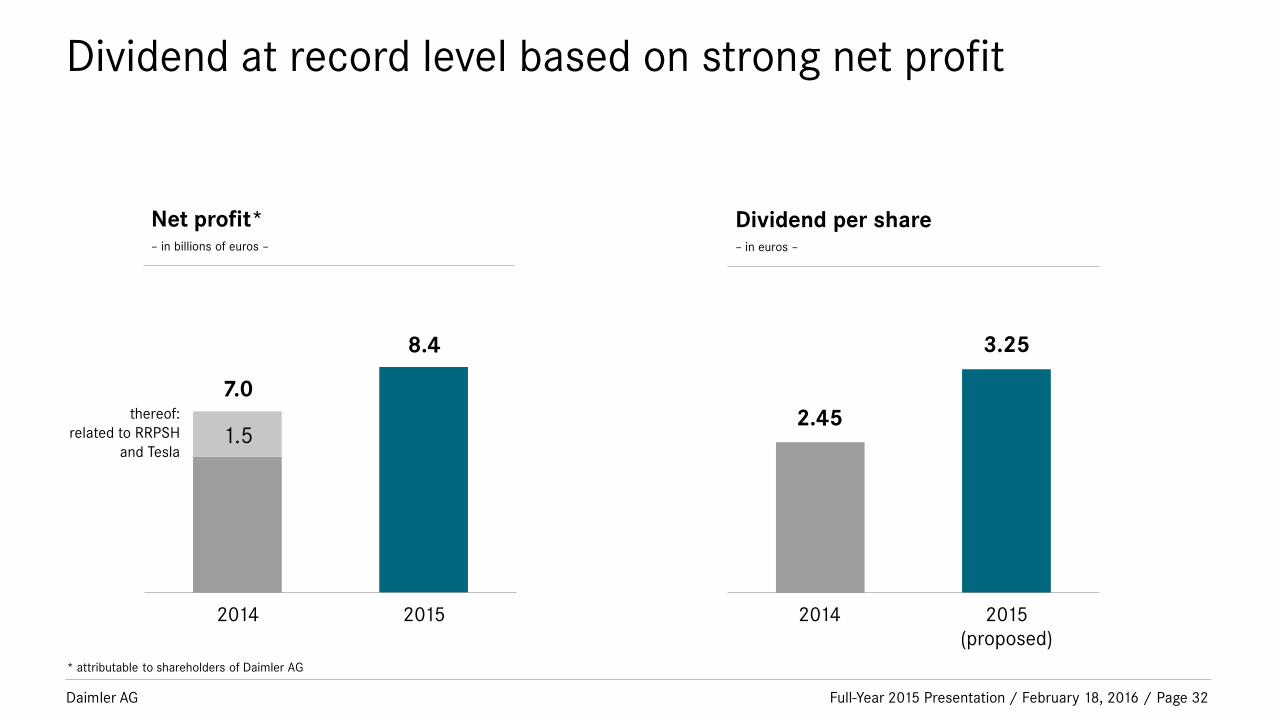
Dividend at record level based on strong net profit
Full-Year 2015 Presentation / February 18, 2016 / Page 32
* attributable to shareholders of Daimler AG
2014 2015
7.0
8.4
2015
(proposed)
2014
1.5 thereof:
related to RRPSH
and Tesla
2.45
3.25
Net profit* – in billions of euros –
Dividend per share – in euros –
Daimler AG
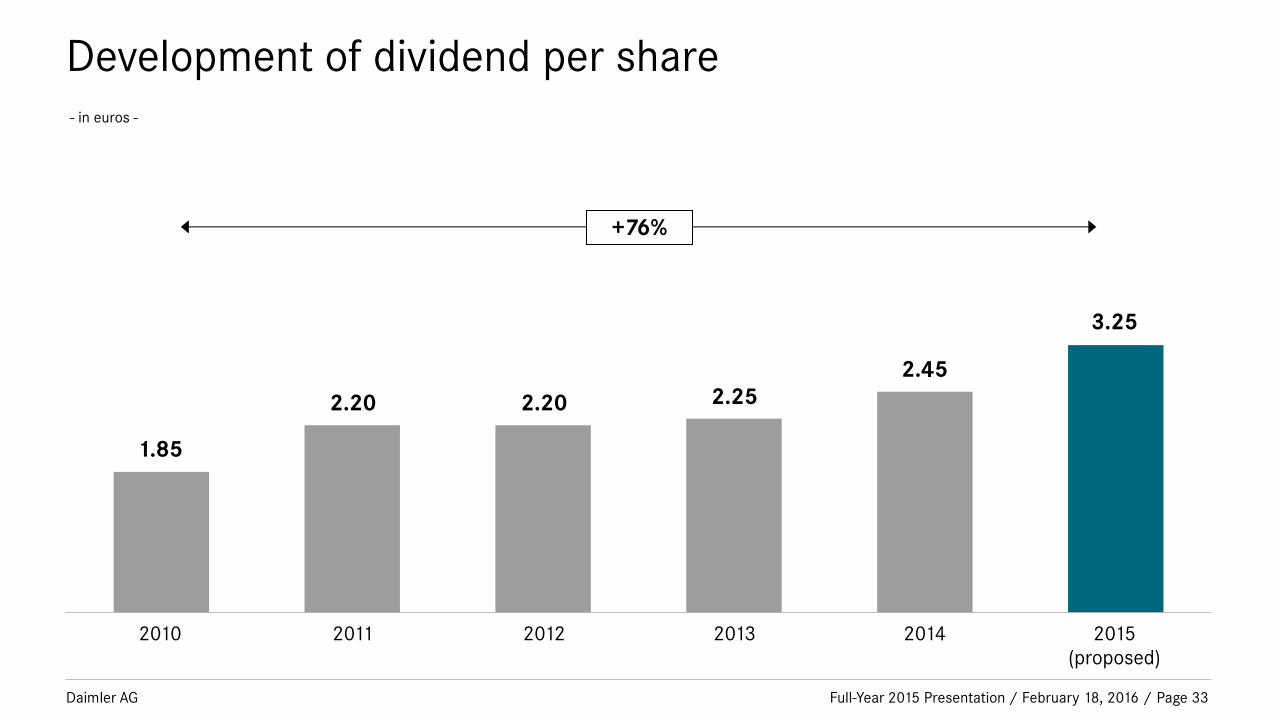
Development of dividend per share
Full-Year 2015 Presentation / February 18, 2016 / Page 33
2.20
2.45
2.25
1.85
2.20
- in euros -
+76%
3.25
2010 2011 2012 2013 2015
(proposed)
2014
Daimler AG
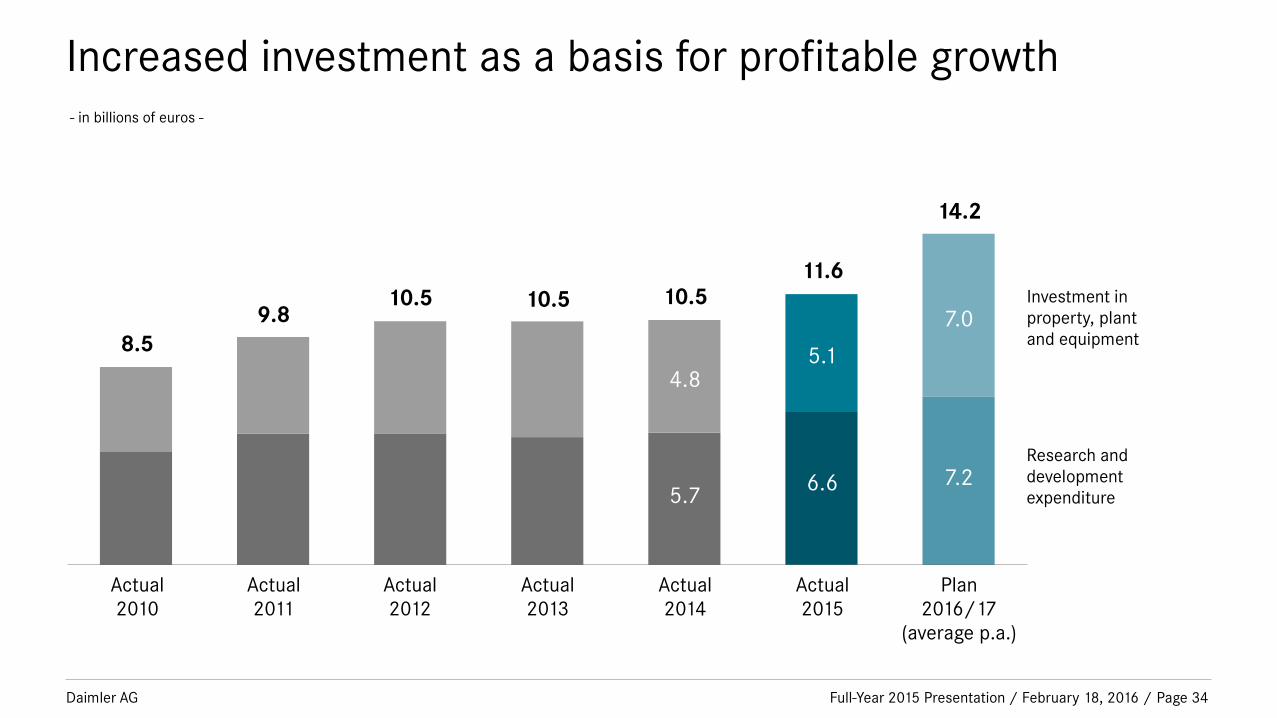
Increased investment as a basis for profitable growth
Full-Year 2015 Presentation / February 18, 2016 / Page 34
10.5 10.5 10.5
8.5
9.8
Actual
2010
Actual
2011
Actual
2012
Actual
2013
Actual
2014
Research and
development
expenditure
Investment in
property, plant
and equipment
Plan
2016/17
(average p.a.)
14.2
- in billions of euros -
11.6
Actual
2015
5.7
4.8
6.6
5.1
7.2
7.0
Daimler AG
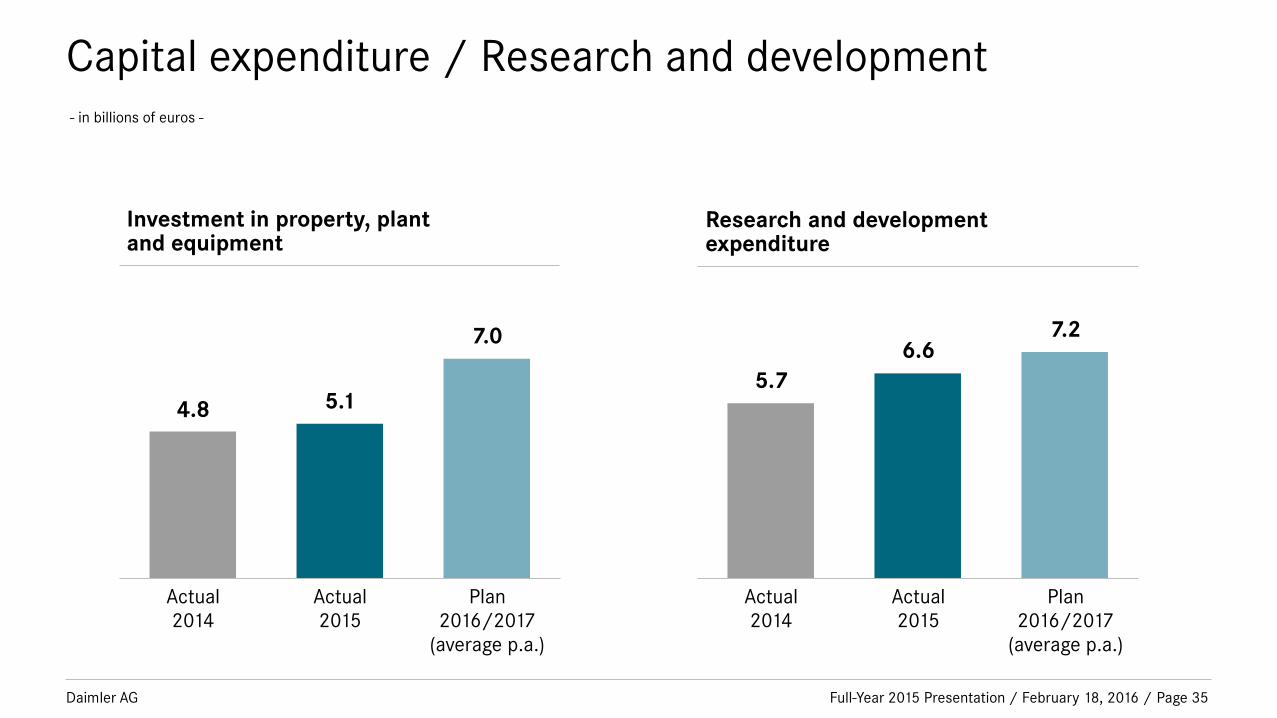
Capital expenditure / Research and development
Full-Year 2015 Presentation / February 18, 2016 / Page 35
Actual
2014
Actual
2015
4.8
Plan
2016/2017
(average p.a.)
5.1
7.0
Actual
2014
Actual
2015
5.7
6.6 7.2
Plan
2016/2017
(average p.a.)
- in billions of euros -
Investment in property, plant and equipment
Research and development expenditure
Daimler AG
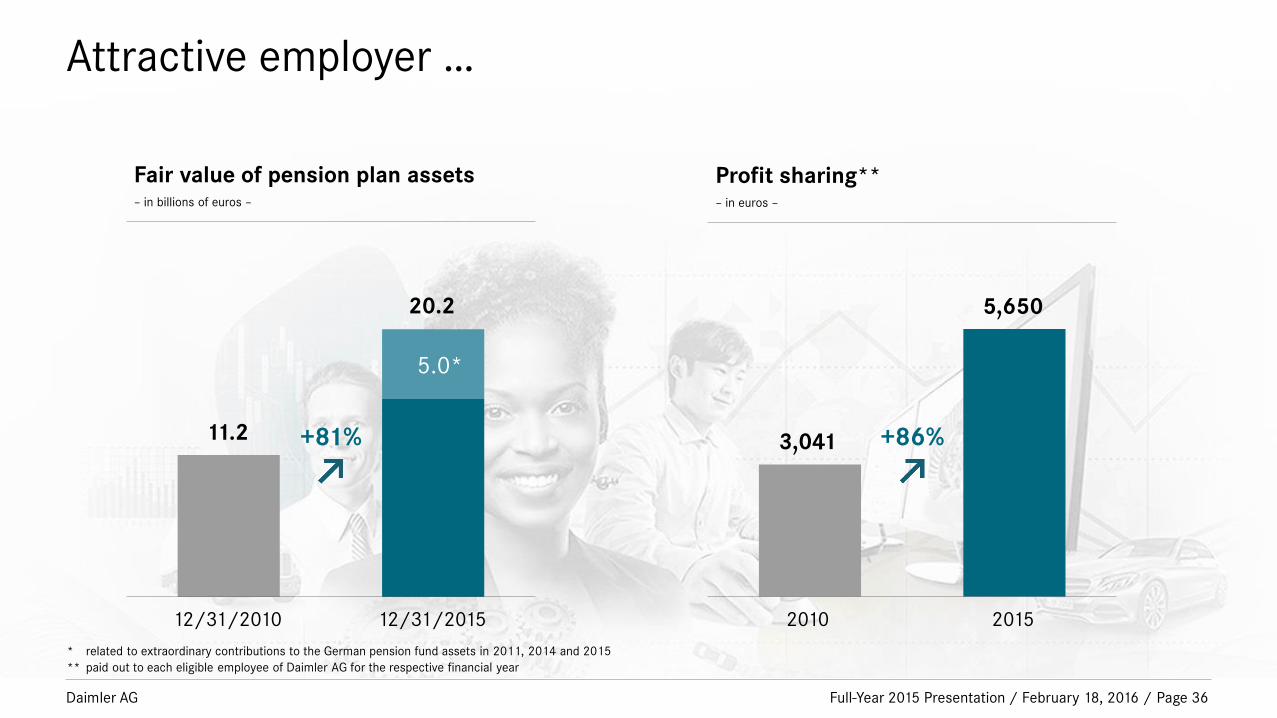
Attractive employer …
Full-Year 2015 Presentation / February 18, 2016 / Page 36
2010
3,041
5,650
2015 12/31/2010
11.2
20.2
12/31/2015
5.0*
* related to extraordinary contributions to the German pension fund assets in 2011, 2014 and 2015
** paid out to each eligible employee of Daimler AG for the respective financial year
Fair value of pension plan assets – in billions of euros –
Profit sharing** – in euros –
+81% +86%
Daimler AG
Contents
Full-Year 2015 Presentation / February 18, 2016 / Page 37
Highlights 2015
Key figures
Divisional information
Group financials
Outlook
Guidance
Daimler AG Full-Year 2015 Presentation / February 18, 2016 / Page 38
2016: The product offensive continues
Daimler AG Full-Year 2015 Presentation / February 18, 2016 / Page 39
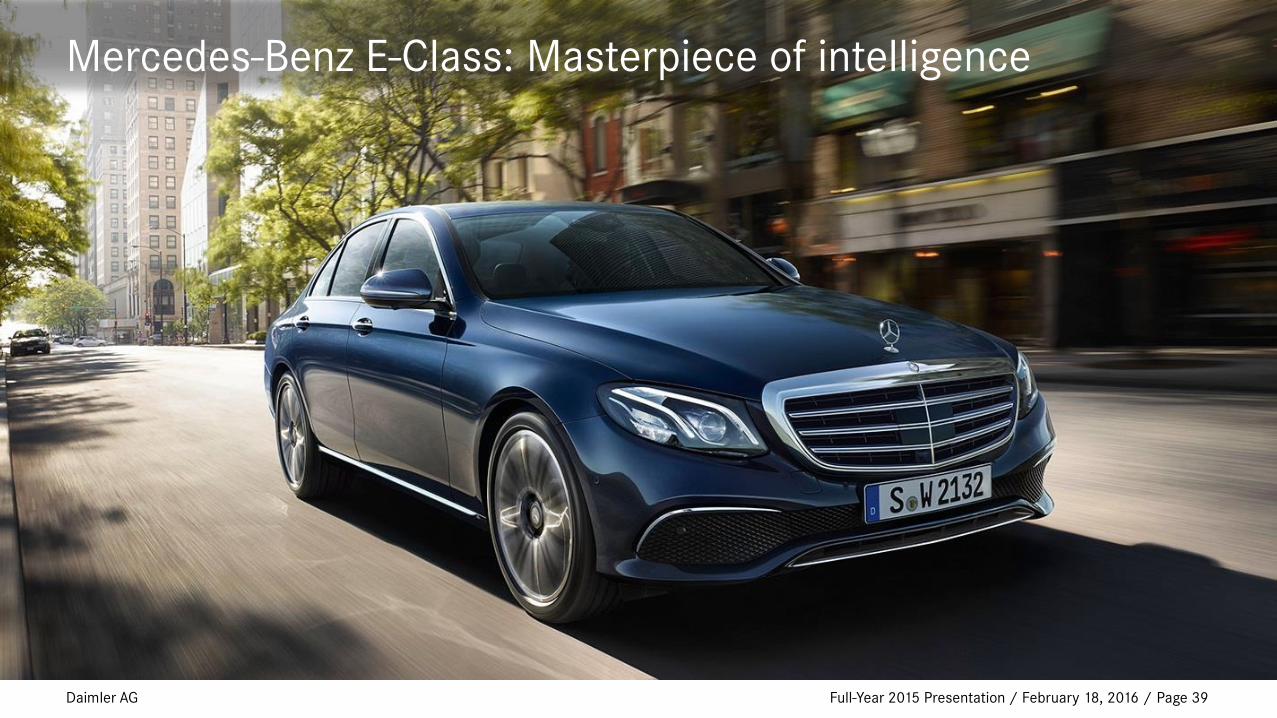
Mercedes-Benz E-Class: Masterpiece of intelligence
Daimler AG Full-Year 2015 Presentation / February 18, 2016 / Page 40
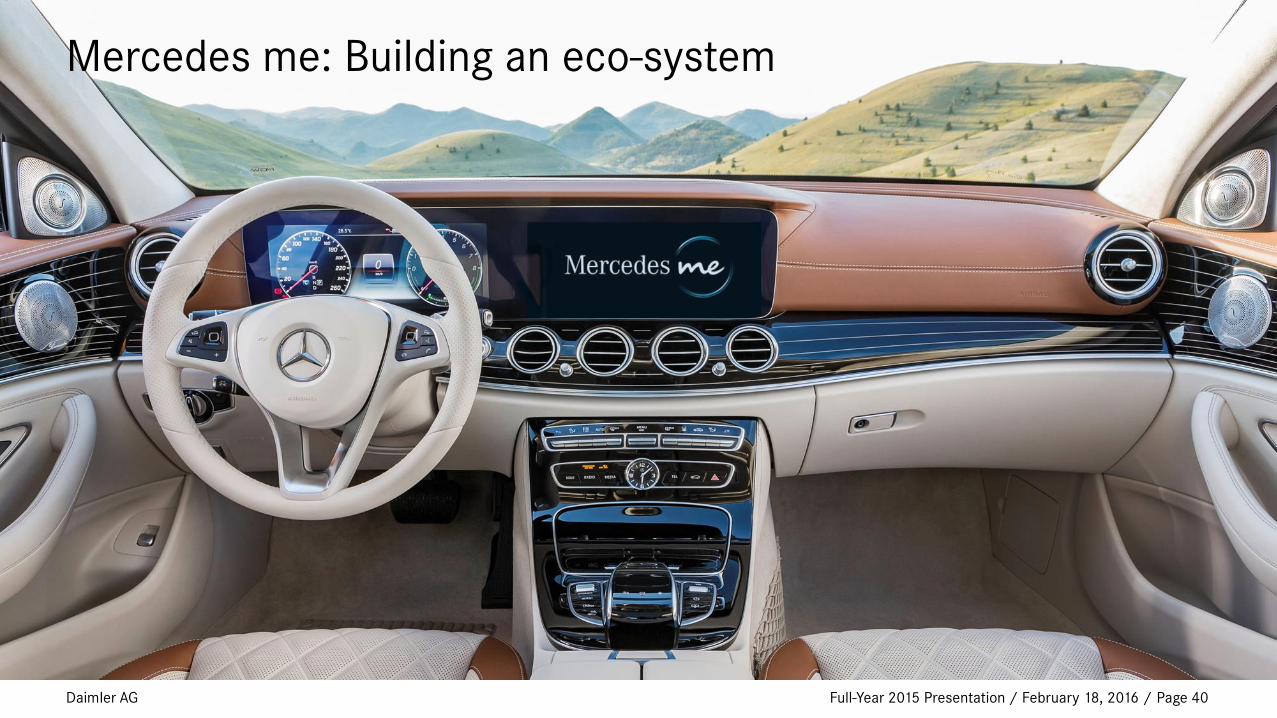
Mercedes me: Building an eco-system

Daimler AG Full-Year 2015 Presentation / February 18, 2016 / Page 41
Identifying new business opportunities
Daimler AG
smart: Summer in the city
Full-Year 2015 Presentation / February 18, 2016 / Page 42

Daimler AG Full-Year 2015 Presentation / February 18, 2016 / Page 43
Bringing e-mobility to everyday life
Daimler AG Full-Year 2015 Presentation / February 18, 2016 / Page 44
Commercial vehicles: Staying the course and accelerating
Daimler AG Full-Year 2015 Presentation / February 18, 2016 / Page 45
Investing in our future growth

Daimler AG Full-Year 2015 Presentation / February 18, 2016 / Page 46
Rethinking Leadership

Daimler AG
Contents
Full-Year 2015 Presentation / February 18, 2016 / Page 47
Highlights 2015
Key figures
Divisional information
Group financials
Outlook
Guidance
Daimler AG
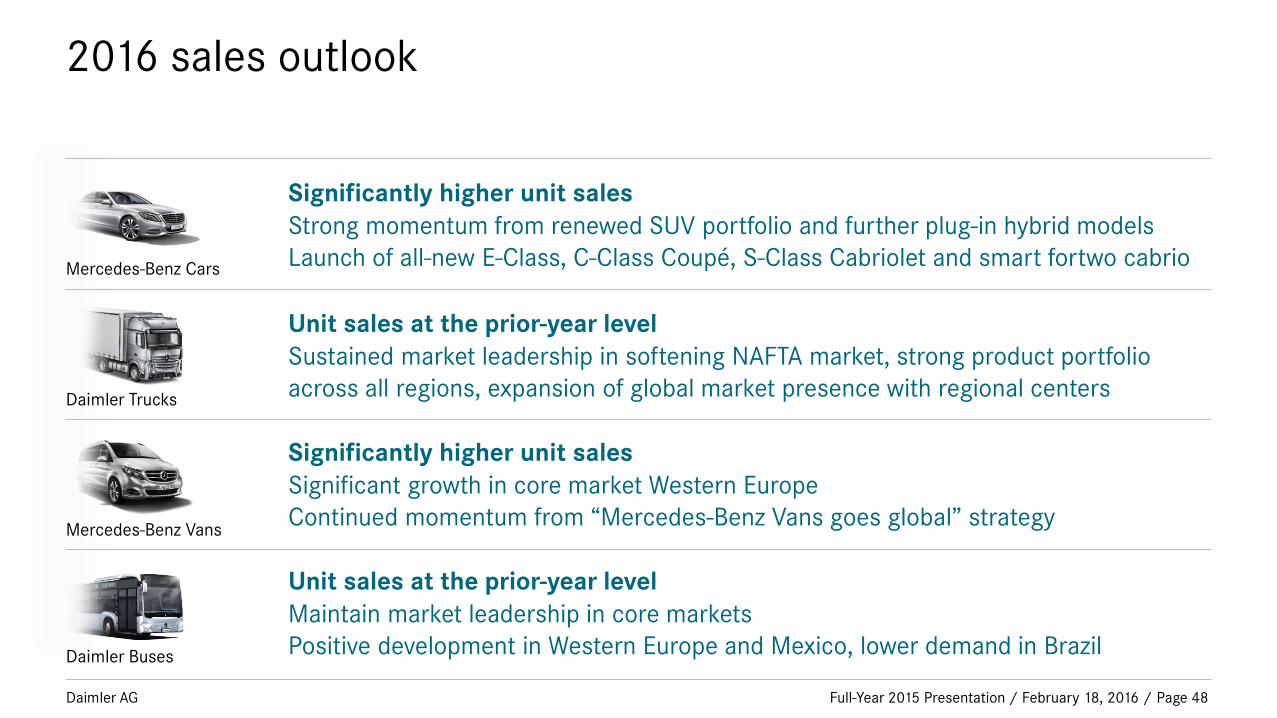
2016 sales outlook
Full-Year 2015 Presentation / February 18, 2016 / Page 48
Significantly higher unit sales
Strong momentum from renewed SUV portfolio and further plug-in hybrid models
Launch of all-new E-Class, C-Class Coupé, S-Class Cabriolet and smart fortwo cabrio Mercedes-Benz Cars
Daimler Trucks
Mercedes-Benz Vans
Daimler Buses
Unit sales at the prior-year level
Sustained market leadership in softening NAFTA market, strong product portfolio
across all regions, expansion of global market presence with regional centers
Significantly higher unit sales
Significant growth in core market Western Europe
Continued momentum from “Mercedes-Benz Vans goes global” strategy
Unit sales at the prior-year level
Maintain market leadership in core markets
Positive development in Western Europe and Mexico, lower demand in Brazil
Daimler AG
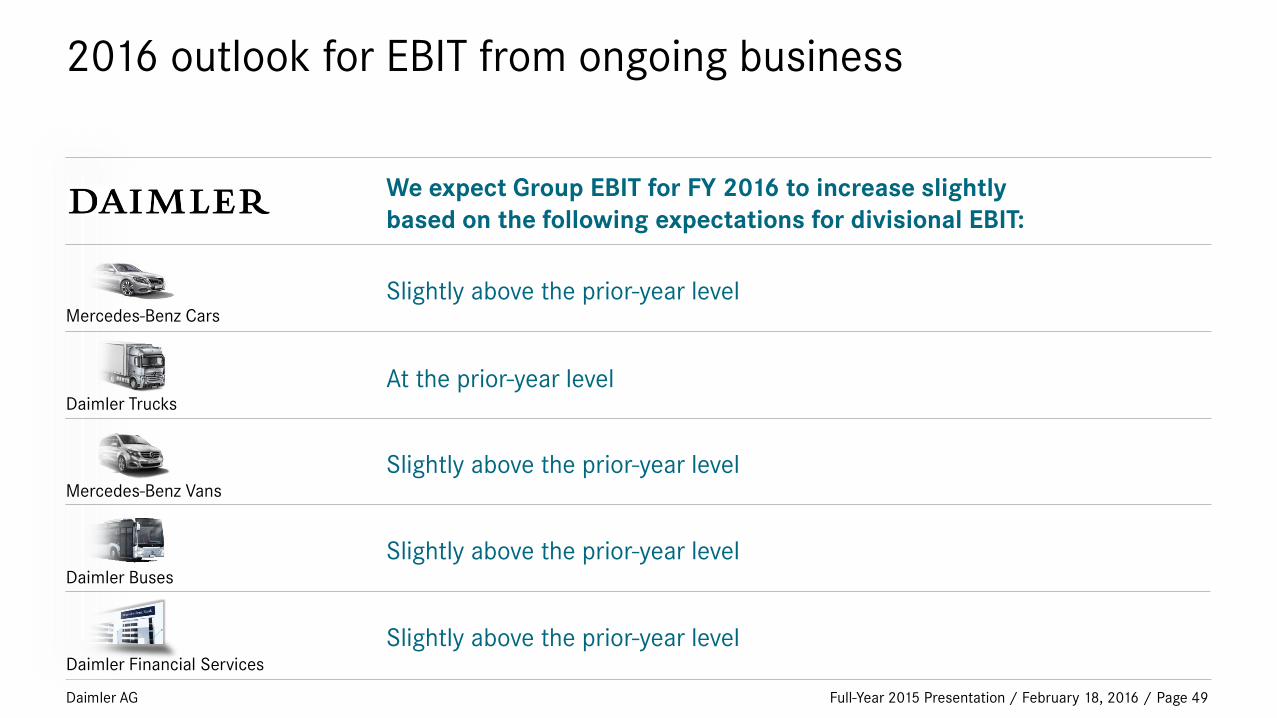
2016 outlook for EBIT from ongoing business
Full-Year 2015 Presentation / February 18, 2016 / Page 49
Slightly above the prior-year level
Slightly above the prior-year level
Slightly above the prior-year level
At the prior-year level
Slightly above the prior-year level
Mercedes-Benz Cars
Daimler Trucks
Mercedes-Benz Vans
Daimler Buses
We expect Group EBIT for FY 2016 to increase slightly
based on the following expectations for divisional EBIT:
Daimler Financial Services

Daimler AG Full-Year 2015 Presentation / February 18, 2016 / Page 50
Appendix
Full-Year 2015 Presentation / February 18, 2016 /
Page 51
Full-Year 2015 Presentation
Daimler AG
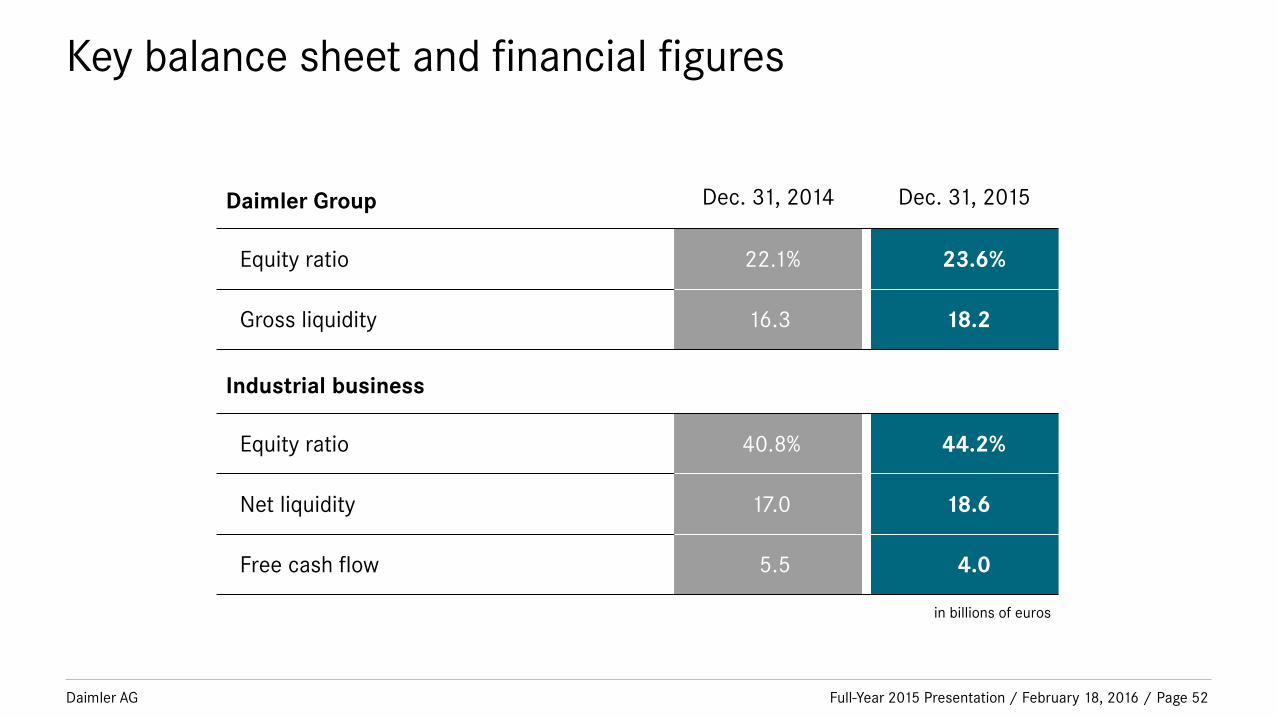
Key balance sheet and financial figures
Full-Year 2015 Presentation / February 18, 2016 /
Daimler Group Dec. 31, 2014 Dec. 31, 2015
Equity ratio 22.1% 23.6%
Gross liquidity 16.3 18.2
Industrial business
Equity ratio 40.8% 44.2%
Net liquidity 17.0 18.6
Free cash flow 5.5 4.0
in billions of euros
Page 52

Daimler AG
Unit sales
Full-Year 2015 Presentation / February 18, 2016 /
2014 2015 % change
Daimler Group 2,546.0 2,853.0 +12
of which
Mercedes-Benz Cars 1,722.6 2,001.4 +16
Daimler Trucks 495.7 502.5 +1
Mercedes-Benz Vans 294.6 321.0 +9
Daimler Buses 33.2 28.1 -15
in thousands of units
Page 53

Daimler AG
Revenue by division
Full-Year 2015 Presentation / February 18, 2016 /
2014 2015 % change
Daimler Group 129.9 149.5 +15
of which
Mercedes-Benz Cars 73.6 83.8 +14
Daimler Trucks 32.4 37.6 +16
Mercedes-Benz Vans 10.0 11.5 +15
Daimler Buses 4.2 4.1 -2
Daimler Financial Services 16.0 19.0 +19
Contract volume of Daimler Financial Services* 99.0 116.7 +18
in billions of euros
* at year-end
Page 54

Daimler AG
Development of unit sales and revenue by divisions since 2010
Full-Year 2015 Presentation / February 18, 2016 / Page 55
2010
1,895
2,853
2015 2010
97.8
149.5
2015
Daimler Financial Services
Daimler Buses
Mercedes-Benz Vans
Daimler Trucks
Mercedes-Benz Cars
Sales – in thousands of units –
Revenue – in billions of euros –
+51% +53%
Daimler AG
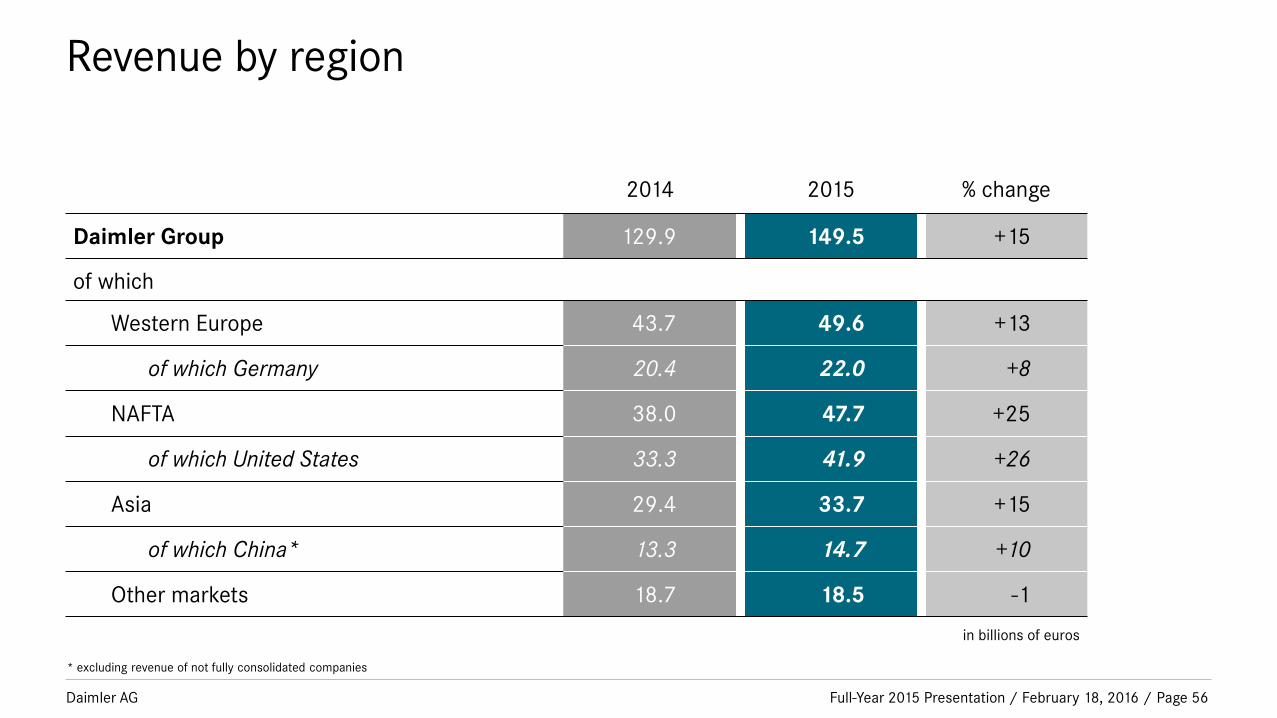
Revenue by region
Full-Year 2015 Presentation / February 18, 2016 /
2014 2015 % change
Daimler Group 129.9 149.5 +15
of which
Western Europe 43.7 49.6 +13
of which Germany 20.4 22.0 +8
NAFTA 38.0 47.7 +25
of which United States 33.3 41.9 +26
Asia 29.4 33.7 +15
of which China* 13.3 14.7 +10
Other markets 18.7 18.5 -1
in billions of euros
* excluding revenue of not fully consolidated companies
Page 56

Daimler AG
EBIT by division
Full-Year 2015 Presentation / February 18, 2016 /
2014 2015
- EBIT in millions of euros; RoS in % - EBIT RoS* EBIT RoS*
Daimler Group 10,752 8.2 13,186 8.9
of which
Mercedes-Benz Cars 5,853 8.0 7,926 9.5
Daimler Trucks 1,878 5.8 2,576 6.9
Mercedes-Benz Vans 682 6.8 880 7.7
Daimler Buses 197 4.7 214 5.2
Daimler Financial Services 1,387 – 1,619 –
Reconciliation 755 – -29 –
* Return on sales; Daimler Group excluding Daimler Financial Services
Page 57
Daimler AG
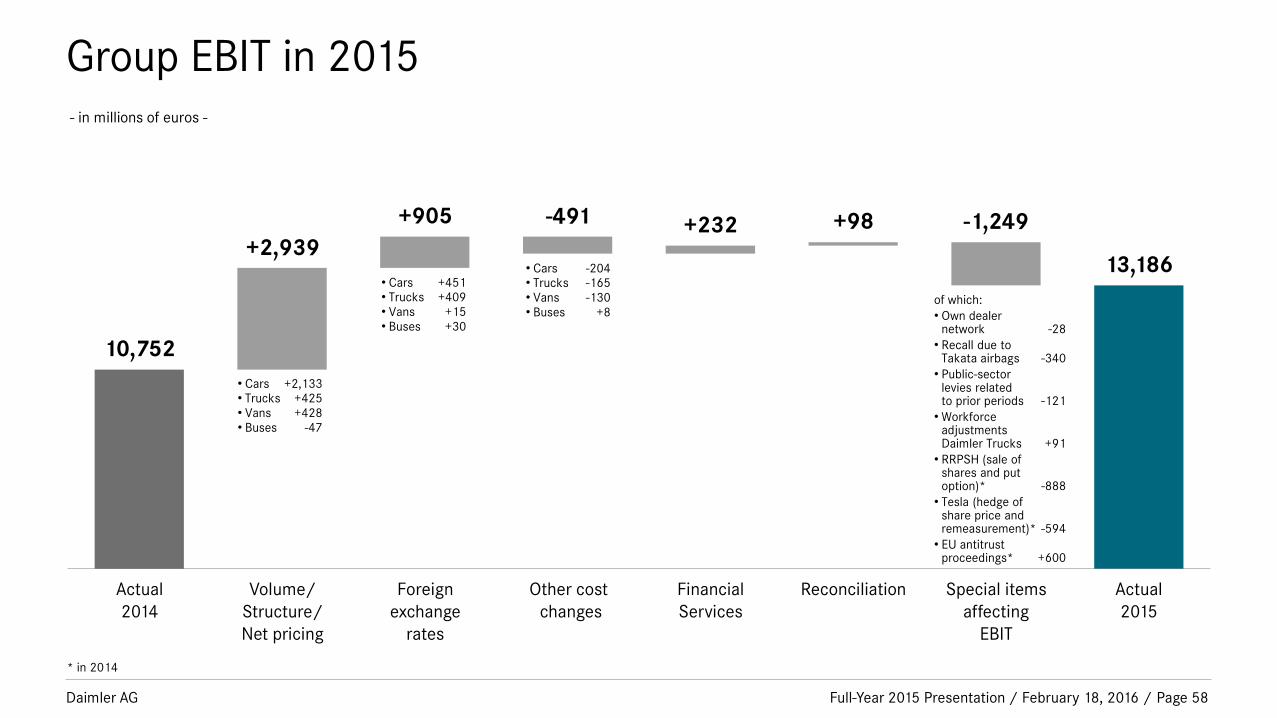
Group EBIT in 2015
Full-Year 2015 Presentation / February 18, 2016 /
- in millions of euros -
* in 2014
-491 -1,249
13,186
+232
10,752
+905
+2,939
• Cars +2,133 • Trucks +425 • Vans +428 • Buses -47
• Cars +451 • Trucks +409 • Vans +15 • Buses +30
• Cars -204 • Trucks -165 • Vans -130 • Buses +8
of which:
• Own dealer network -28
• Recall due to Takata airbags -340
• Public-sector levies related to prior periods -121
• Workforce adjustments Daimler Trucks +91
• RRPSH (sale of shares and put option)* -888
• Tesla (hedge of share price and remeasurement)* -594
• EU antitrust proceedings* +600
+98
Actual
2014
Volume/
Structure/
Net pricing
Foreign
exchange
rates
Other cost
changes
Reconciliation Actual
2015
Financial
Services
Special items
affecting
EBIT
Page 58
Daimler AG
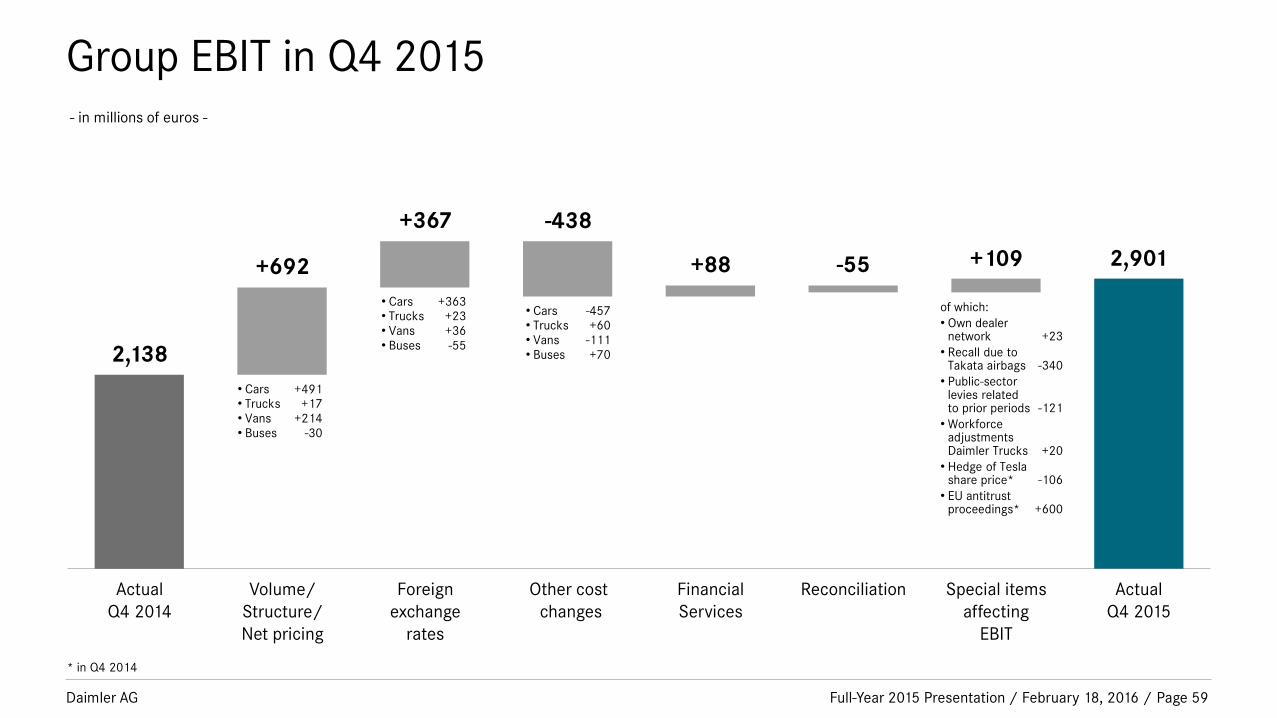
Group EBIT in Q4 2015
Full-Year 2015 Presentation / February 18, 2016 /
- in millions of euros -
* in Q4 2014
-438
+109 2,901 +88
2,138
+367
+692
• Cars +491 • Trucks +17 • Vans +214 • Buses -30
• Cars +363 • Trucks +23 • Vans +36 • Buses -55
• Cars -457 • Trucks +60 • Vans -111 • Buses +70
of which:
• Own dealer network +23
• Recall due to Takata airbags -340
• Public-sector levies related to prior periods -121
• Workforce adjustments Daimler Trucks +20
• Hedge of Tesla share price* -106
• EU antitrust proceedings* +600
-55
Actual
Q4 2014
Volume/
Structure/
Net pricing
Foreign
exchange
rates
Other cost
changes
Reconciliation Actual
Q4 2015
Financial
Services
Special items
affecting
EBIT
Page 59
Daimler AG
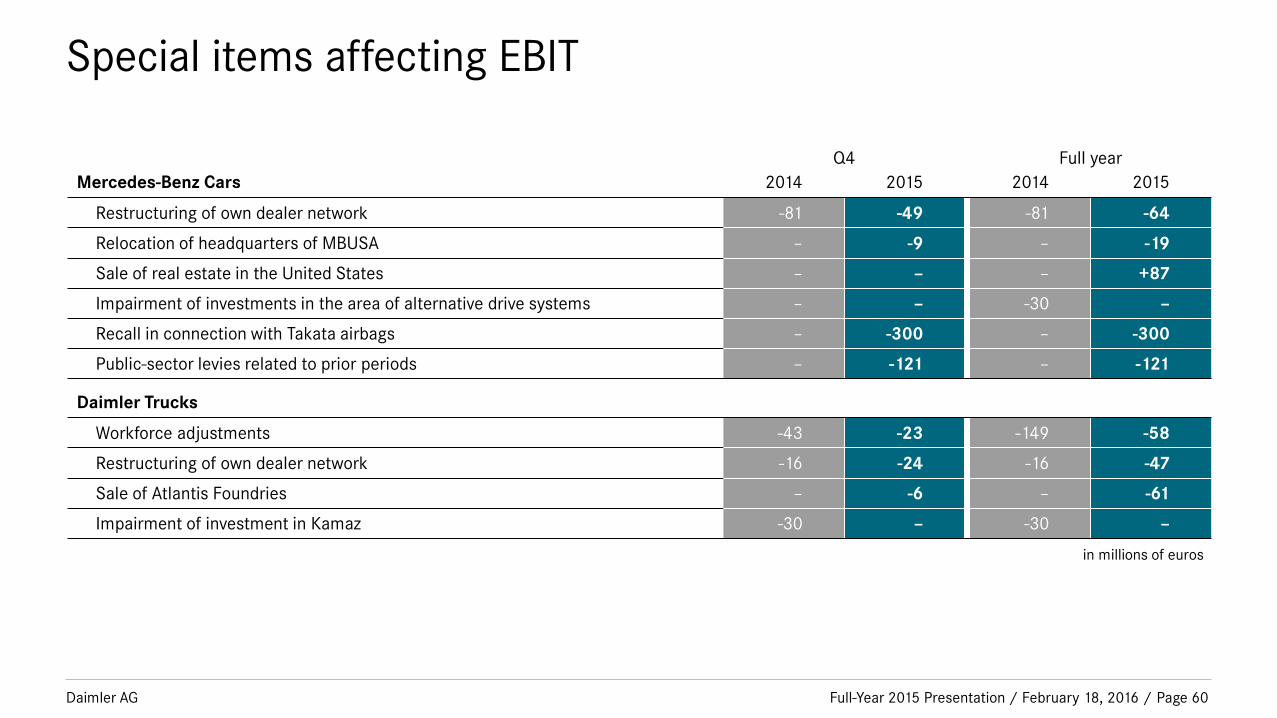
Special items affecting EBIT
Full-Year 2015 Presentation / February 18, 2016 /
Q4 Full year
Mercedes-Benz Cars 2014 2015 2014 2015
Restructuring of own dealer network -81 -49 -81 -64
Relocation of headquarters of MBUSA – -9 – -19
Sale of real estate in the United States – – – +87
Impairment of investments in the area of alternative drive systems – – -30 –
Recall in connection with Takata airbags – -300 – -300
Public-sector levies related to prior periods – -121 – -121
Daimler Trucks
Workforce adjustments -43 -23 -149 -58
Restructuring of own dealer network -16 -24 -16 -47
Sale of Atlantis Foundries – -6 – -61
Impairment of investment in Kamaz -30 – -30 –
in millions of euros
Page 60
Daimler AG
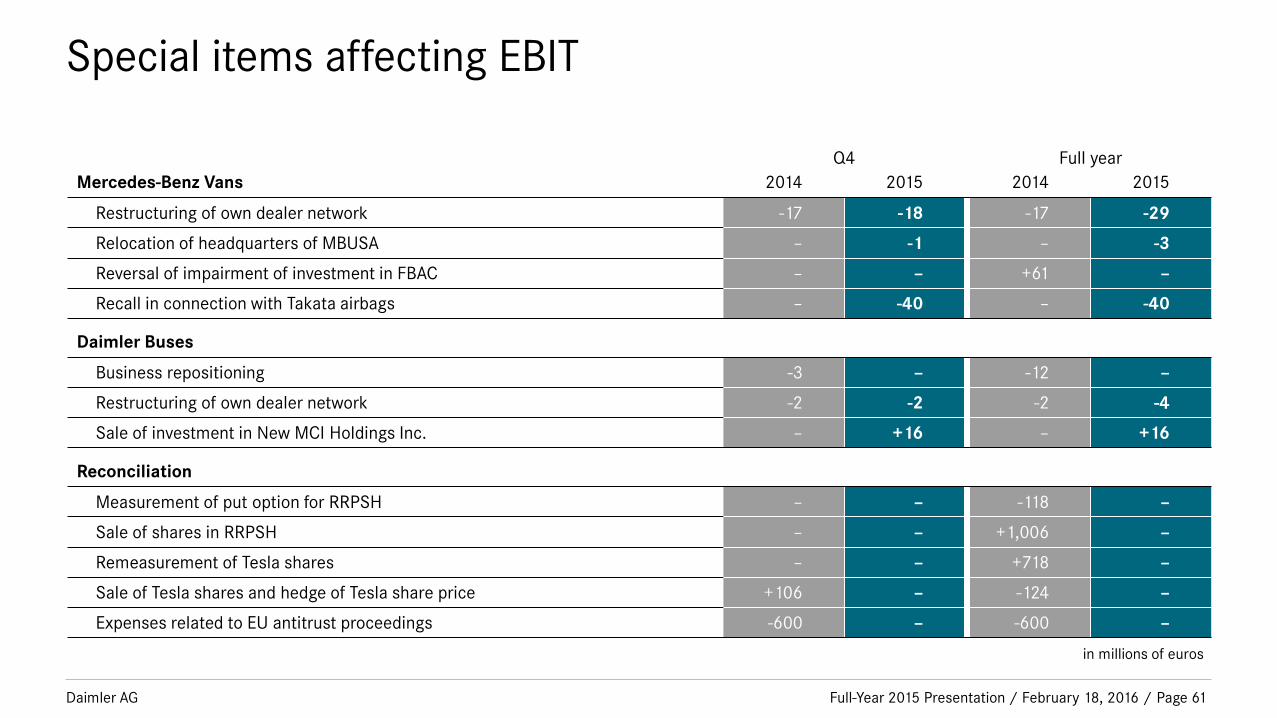
Special items affecting EBIT
Full-Year 2015 Presentation / February 18, 2016 /
Q4 Full year
Mercedes-Benz Vans 2014 2015 2014 2015
Restructuring of own dealer network -17 -18 -17 -29
Relocation of headquarters of MBUSA – -1 – -3
Reversal of impairment of investment in FBAC – – +61 –
Recall in connection with Takata airbags – -40 – -40
Daimler Buses
Business repositioning -3 – -12 –
Restructuring of own dealer network -2 -2 -2 -4
Sale of investment in New MCI Holdings Inc. – +16 – +16
Reconciliation
Measurement of put option for RRPSH – – -118 –
Sale of shares in RRPSH – – +1,006 –
Remeasurement of Tesla shares – – +718 –
Sale of Tesla shares and hedge of Tesla share price +106 – -124 –
Expenses related to EU antitrust proceedings -600 – -600 –
in millions of euros
Page 61
Daimler AG
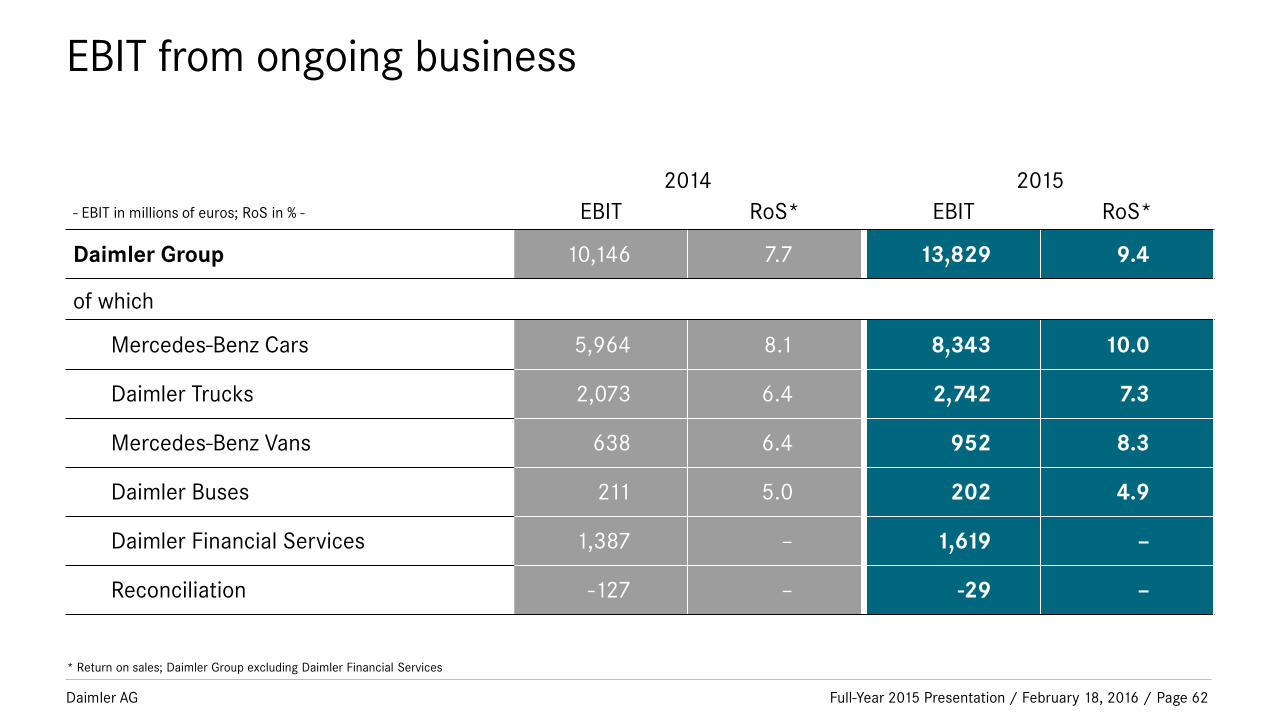
EBIT from ongoing business
Full-Year 2015 Presentation / February 18, 2016 /
2014 2015
- EBIT in millions of euros; RoS in % - EBIT RoS* EBIT RoS*
Daimler Group 10,146 7.7 13,829 9.4
of which
Mercedes-Benz Cars 5,964 8.1 8,343 10.0
Daimler Trucks 2,073 6.4 2,742 7.3
Mercedes-Benz Vans 638 6.4 952 8.3
Daimler Buses 211 5.0 202 4.9
Daimler Financial Services 1,387 – 1,619 –
Reconciliation -127 – -29 –
* Return on sales; Daimler Group excluding Daimler Financial Services
Page 62

Daimler AG
Q4 2015: EBIT from ongoing business
Full-Year 2015 Presentation / February 18, 2016 / Page 63
Q4 2014 Q4 2015
- EBIT in millions of euros; RoS in % - EBIT RoS* EBIT RoS*
Daimler Group 2,824 8.0 3,478 8.7
of which
Mercedes-Benz Cars 1,758 8.7 2,154 9.6
Daimler Trucks 583 6.6 684 6.8
Mercedes-Benz Vans 158 5.8 297 8.5
Daimler Buses 35 2.7 20 1.7
Daimler Financial Services 299 – 387 –
Reconciliation -9 – -64 –
* Return on sales; Daimler Group excluding Daimler Financial Services
Daimler AG
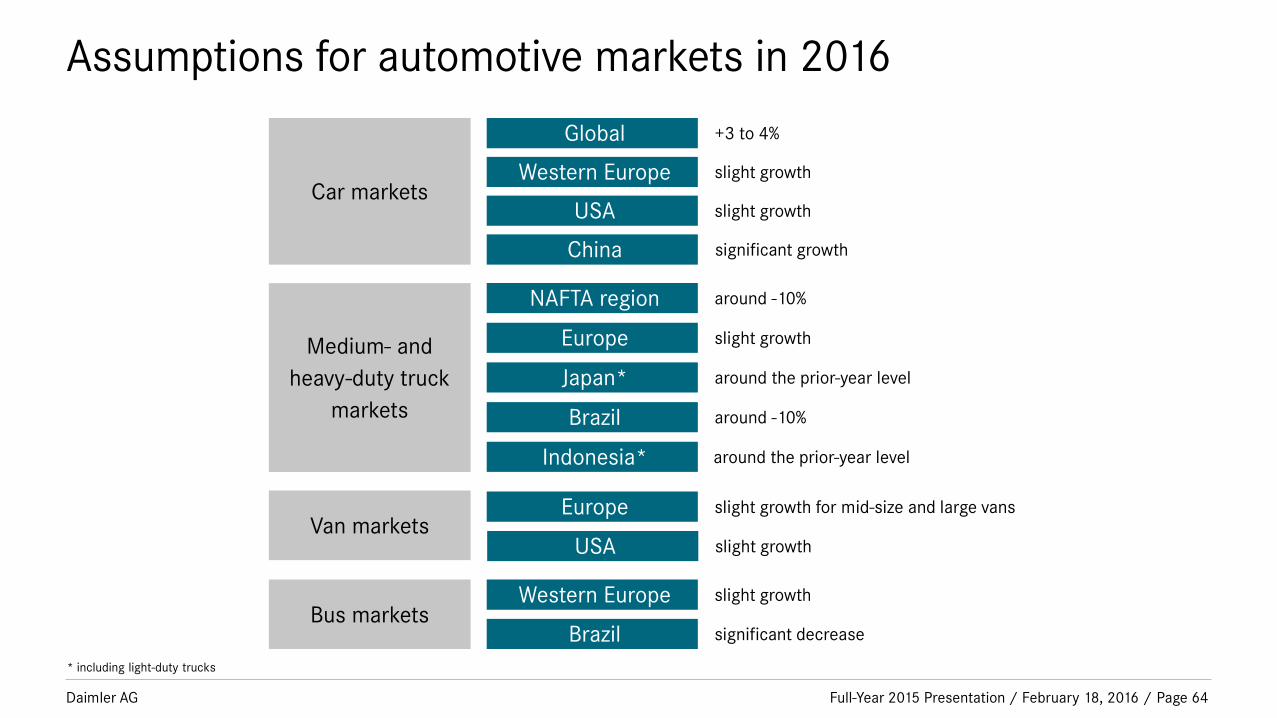
Assumptions for automotive markets in 2016
Full-Year 2015 Presentation / February 18, 2016 /
Car markets
Global
Western Europe
Medium- and
heavy-duty truck
markets
NAFTA region
Europe
Japan*
Brazil
Europe
Bus markets Western Europe
Brazil
+3 to 4%
slight growth
around -10%
slight growth
around the prior-year level
around -10%
slight growth for mid-size and large vans
slight growth
significant decrease
USA slight growth
Van markets
Indonesia* around the prior-year level
China significant growth
* including light-duty trucks
Page 64
USA slight growth

Daimler AG
Capital expenditure / Research and development
Full-Year 2015 Presentation / February 18, 2016 / Page 65
Investment in property, plant and equipment
Research and development expenditure
Actual 2014
Actual 2015
Plan* 2016-2017
Actual 2014
Actual 2015
Plan* 2016-2017
Daimler Group 4.8 5.1 7.0 5.7 6.6 7.2
of which
Mercedes-Benz Cars 3.6 3.6 5.0 4.0 4.7 5.4
Daimler Trucks 0.8 1.1 1.4 1.2 1.3 1.3
Mercedes-Benz Vans 0.3 0.2 0.6 0.3 0.4 0.4
Daimler Buses 0.1 0.1 0.1 0.2 0.2 0.2
Daimler Financial Services 0.02 0.03 0.02 – – –
in billions of euros
* average p.a.
Daimler AG
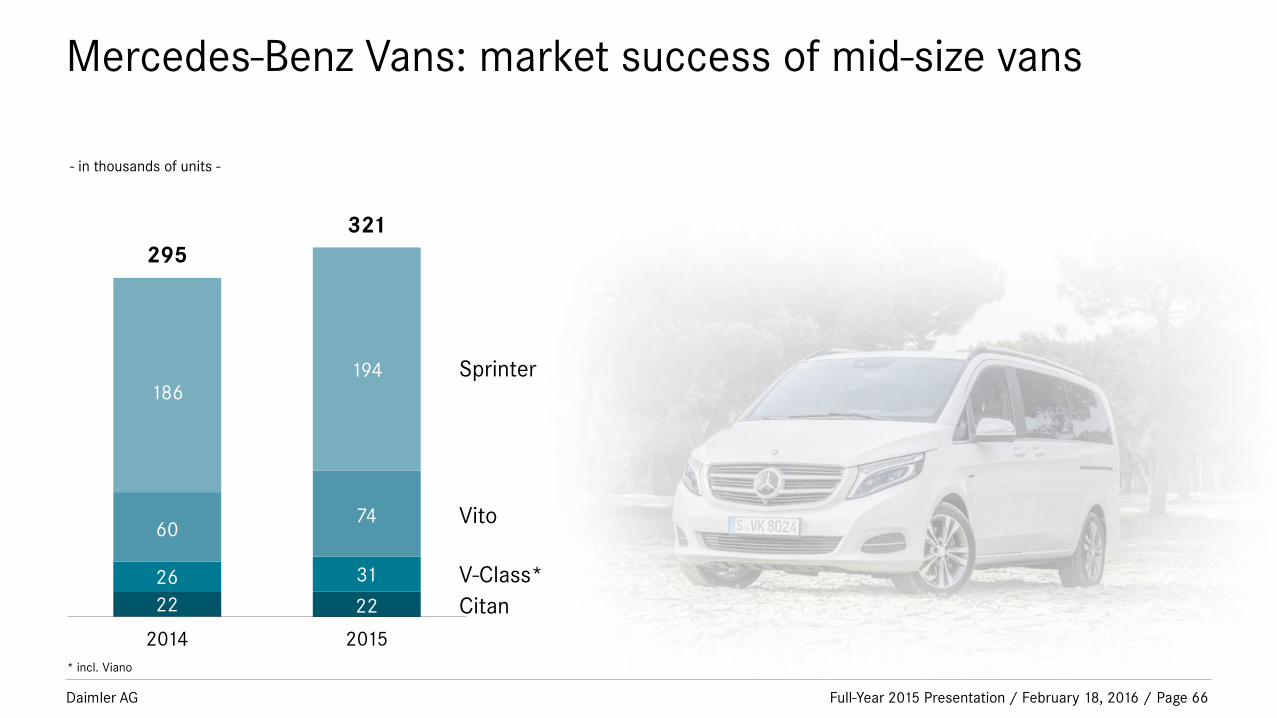
Mercedes-Benz Vans: market success of mid-size vans
Full-Year 2015 Presentation / February 18, 2016 /
- in thousands of units -
2014
295
321
2015
22
31
74
194
22
26
60
186
Vito
V-Class*
Citan
Sprinter
* incl. Viano
Page 66
Daimler AG
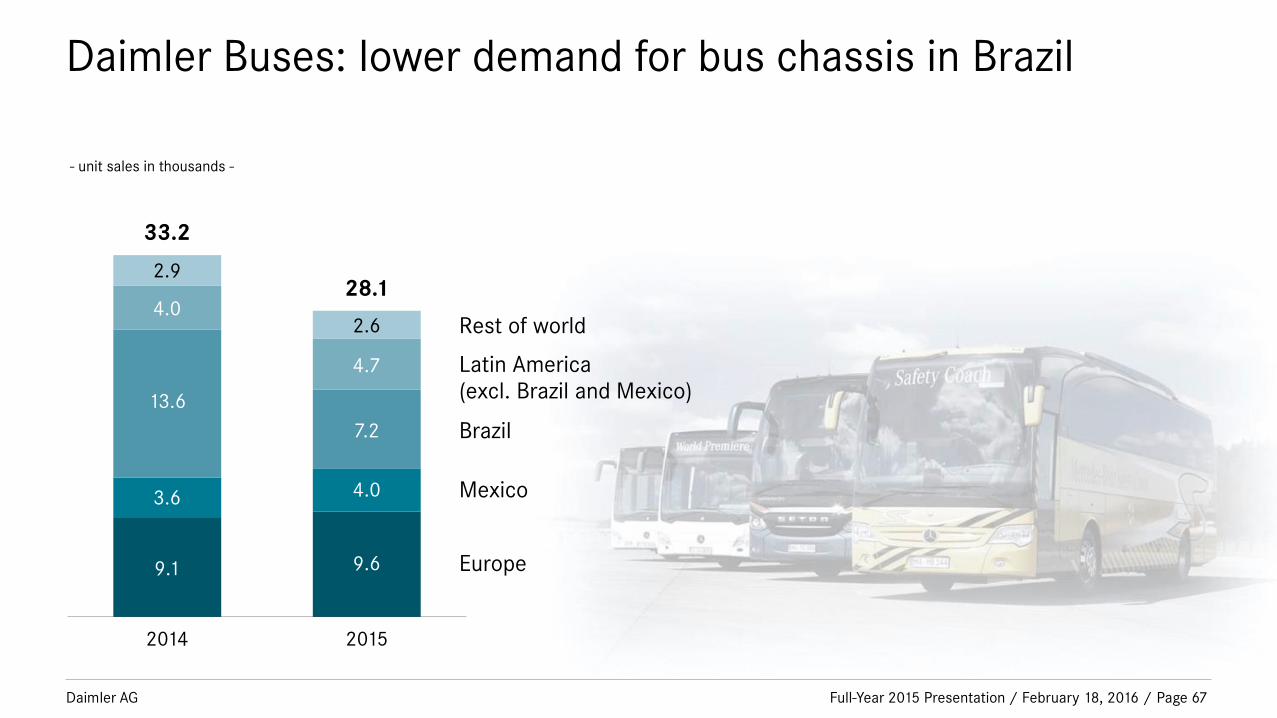
Daimler Buses: lower demand for bus chassis in Brazil
Full-Year 2015 Presentation / February 18, 2016 /
- unit sales in thousands -
2014
33.2
28.1
2015
9.6
4.0
7.2
4.7
9.1
3.6
13.6
4.0 Rest of world
Brazil
Mexico
Europe
Latin America (excl. Brazil and Mexico)
2.9
2.6
Page 67

Daimler AG
Daimler Financial Services: growth in all regions
Full-Year 2015 Presentation / February 18, 2016 /
- contract volume in billions of euros -
12/31/2014
99.0
116.7
12/31/2015
19.8
25.8
50.8
20.2
18.7
21.7
43.1
15.4
Americas
Europe (excl. Germany)
Germany
Africa & Asia-Pacific
Page 68
Daimler AG
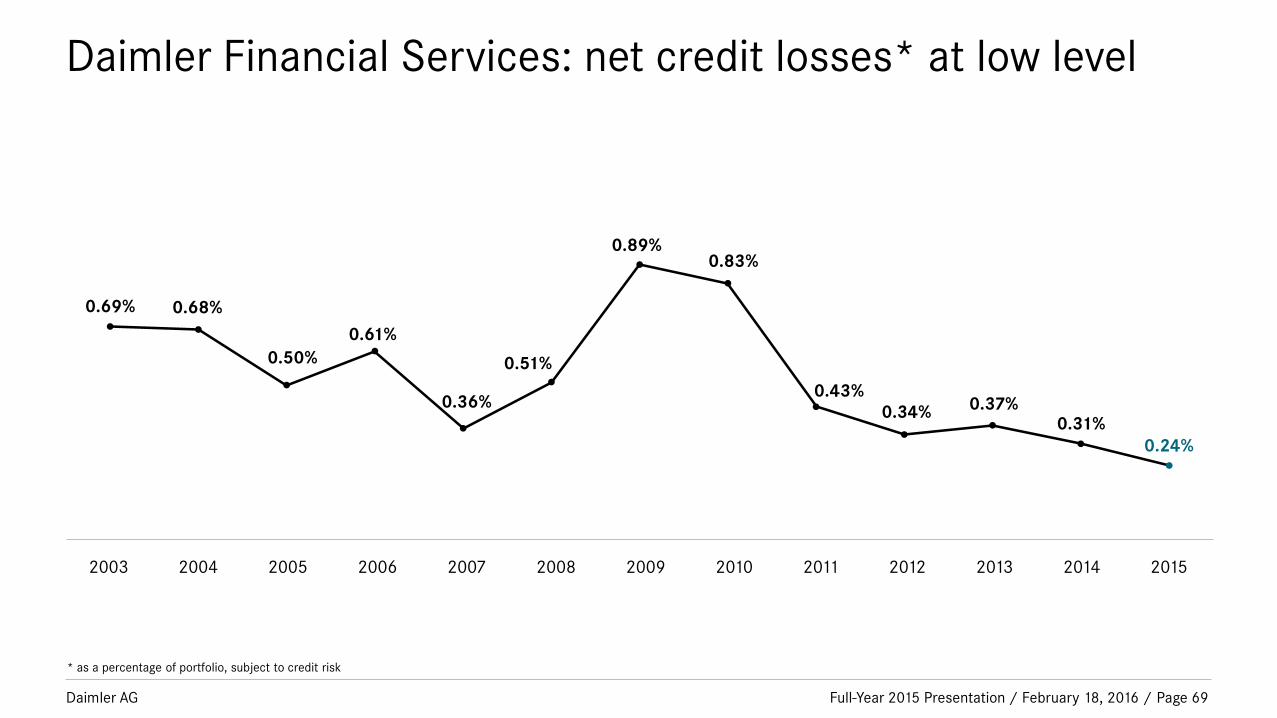
Daimler Financial Services: net credit losses* at low level
Full-Year 2015 Presentation / February 18, 2016 /
* as a percentage of portfolio, subject to credit risk
0.69% 0.68%
0.50%
0.61%
0.36%
0.51%
0.89% 0.83%
0.43%
0.34% 0.37% 0.31%
0.24%
2003 2004 2005 2006 2007 2008 2009 2010 2011 2012 2013 2014 2015
Page 69

Daimler AG
Disclaimer
This document contains forward-looking statements that reflect our current views about future events. The words “anticipate,” “assume,” “believe,”
“estimate,” “expect,” “intend,” “may,” ”can,” “could,” “plan,” “project,” “should” and similar expressions are used to identify forward-looking statements.
These statements are subject to many risks and uncertainties, including an adverse development of global economic conditions, in particular a decline of
demand in our most important markets; a worsening of the sovereign-debt crisis in the euro zone; an increase in political tension in Eastern Europe; a
deterioration of our refinancing possibilities on the credit and financial markets; events of force majeure including natural disasters, acts of terrorism,
political unrest, armed conflicts, industrial accidents and their effects on our sales, purchasing, production or financial services activities; changes in
currency exchange rates; a shift in consumer preferences towards smaller, lower-margin vehicles; a possible lack of acceptance of our products or
services which limits our ability to achieve prices and adequately utilize our production capacities; price increases for fuel or raw materials; disruption of
production due to shortages of materials, labor strikes or supplier insolvencies; a decline in resale prices of used vehicles; the effective implementation
of cost-reduction and efficiency-optimization measures; the business outlook for companies in which we hold a significant equity interest; the successful
implementation of strategic cooperations and joint ventures; changes in laws, regulations and government policies, particularly those relating to vehicle
emissions, fuel economy and safety; the resolution of pending government investigations and the conclusion of pending or threatened future legal
proceedings; and other risks and uncertainties, some of which we describe under the heading “Risk and Opportunity Report” in the current Annual
Report. If any of these risks and uncertainties materializes or if the assumptions underlying any of our forward-looking statements prove to be incorrect,
the actual results may be materially different from those we express or imply by such statements. We do not intend or assume any obligation to update
these forward-looking statements since they are based solely on the circumstances at the date of publication.
Full-Year 2015 Presentation / February 18, 2016 / Page 70