Embed Size (px)
Citation preview
Journal of
Clinical Medicine
Article
Functional Assessment of Outer and Middle MacularLayers in Multiple Sclerosis
Lucia Ziccardi 1 , Lucilla Barbano 1,*, Laura Boffa 2, Maria Albanese 2, Carolina Gabri Nicoletti 3,Doriana Landi 3, Andrzej Grzybowski 4,5 , Benedetto Falsini 6 ,Girolama Alessandra Marfia 3,7, Diego Centonze 3,7 and Vincenzo Parisi 1
1 IRCCS—Fondazione Bietti, Via Livenza 1, 00198 Rome, Italy; [email protected] (L.Z.);[email protected] (V.P.)
2 Unit of Neurology, Fondazione Policlinico Tor Vergata, Via Oxford 81, 00133 Rome, Italy;[email protected] (L.B.); [email protected] (M.A.)
3 Multiple Sclerosis Clinical and Research Unit, Department of Systems Medicine, Tor Vergata University,Via Montpellier 1, 00133 Rome, Italy; [email protected] (C.G.N.); [email protected] (D.L.);[email protected] (G.A.M.); [email protected] (D.C.)
4 Department of Ophthalmology, University of Warmia and Mazury, Michała Oczapowskiego 2,10455 Olsztyn, Poland; [email protected]
5 Institute for Research in Ophthalmology, Foundation for Ophthalmology Development,Collegium Maius Fredry 10, 61701 Poznan, Poland
6 Ophthalmology Department, IRCCS—Fondazione Policlinico Universitario A. Gemelli, Catholic University,Largo F. Vito 1, 00168 Rome, Italy; [email protected]
7 Unit of Neurology and Neurorehabilitation, IRCCS—Neuromed, Via Atinense 18, 86077 Pozzilli (IS), Italy* Correspondence: [email protected]; Tel.: +39-06-8535-6727; Fax: +39-06-8424-2333
Received: 26 October 2020; Accepted: 20 November 2020; Published: 22 November 2020 �����������������
Abstract: The involvement of macular preganglionic elements’ function, during the neurodegenerativeprocess of multiple sclerosis (MS), is controversial. In this case-control observational and retrospectivestudy, we assessed multifocal electroretinogram (mfERG) responses from 41 healthy Controls,41 relapsing-remitting MS patients without optic neuritis (ON) (MS-noON Group) and 47 MS patientswith ON: 27 with full recovery of high-contrast best corrected visual acuity (BCVA) (MS-ON-GGroup) and 20 with poor recovery (between 0.2 and 1 LogMAR) of BCVA, (MS-ON-P Group). In thelatter Group, Sd-OCT macular volumes and thicknesses of whole and inner and outer retina weremeasured. MfERG N1 and P1 implicit times (ITs), and N1-P1 response amplitude densities (RADs),were measured from concentric rings (R) with increasing foveal eccentricity: 0–5◦ (R1), 5–10◦ (R2),10–15◦ (R3), 15–20◦ (R4), 20–25◦ (R5), and from retinal sectors (superior, nasal, inferior and temporal)between 0–15◦ and 0–25◦. In the MS-ON-P Group, mean mfERG RADs detected from R1 (0–5◦) andfrom the central nasal sector (0–15◦) were significantly reduced (p < 0.01) with respect to those ofthe Control, MS-noON and MS-ON-G Groups. No other significant differences between Groups forany mfERG parameters were found. All Sd-OCT measurements, apart from the inner retina macularvolume in the central 1 mm, were significantly reduced in MS-ON-P patients compared to Controls.The functional impairment in the MS-ON-P Group was associated but not correlated with structuralchanges of the outer and inner retinal layers in corresponding retinal Areas and Sectors. Our resultssuggest that in MS, exclusively after ON with poor recovery of BCVA, the neurodegenerative processcan induce dysfunctional mechanisms involving photoreceptors and bipolar cells of the fovea and ofthe more central nasal macular area.
Keywords: multiple sclerosis; preganglionic retinal elements; photoreceptors; bipolar cells; multifocalelectroretinogram; neurodegeneration
J. Clin. Med. 2020, 9, 3766; doi:10.3390/jcm9113766 www.mdpi.com/journal/jcm
J. Clin. Med. 2020, 9, 3766 2 of 25
1. Introduction
Multiple sclerosis (MS) is a neurodegenerative disease, characterized by chronic demyelination ofthe central nervous system, which can result in visual system involvement including retrobulbar opticneuritis (ON) [1].
The ON event is followed by secondary neurodegenerative processes for retrograde trans-synapticdegeneration [2] that involve retinal ganglion cells (RGCs) and their axons [3] forming the innermostretinal layers (IML). In MS patients, an IML dysfunction has been observed by recording abnormalbioelectrical responses with pattern electroretinogram (P-ERG) [4–6] that is a well-known reliableelectrophysiological technique for assessing IML function [7].
At the present, it is a debated topic to understand whether the neurodegenerative mechanismsoccurring in MS, could involve retinal structures beyond the IML towards the preganglionic elements(i.e., photoceptors, bipolar cells) located in the outer and in middle retinal (O-MR) layers.
The function of preganglionic elements can be assessed by electroretinogram (ERG) recordings [8]that, with its variants, allow us to study the bioelectrical activity of photoreceptor and bipolar cellsfrom the whole retina by Full-field ERG (Ff-ERG) [9], from the central retina by focal ERG (F-ERG) [10]and from multiple localized retinal areas by multifocal ERG (mfERG) [11]. In particular, the mfERGtechnique provides a topographical map of objective bioelectric responses derived from localizedretinal areas, which are driven largely by the cone-related preganglionic components. A “kernelanalysis” applied to mfERG responses can be used to assess nonlinear functions of the visual systemmainly originating from selected populations of photoreceptors and bipolar cells [12–14].
In MS patients, the Ff-ERG cone a- and b- waves’ amplitudes have been found reduced [15–18],thus reflecting post-phototransduction impairment of the photopic system of the whole retina [16],and, by recording F-ERG, impaired photoreceptoral and post-photoreceptoral responses have beenfound in the macular area [19].
Regarding the mfERG responses in MS, contrasting data have been reported in the recent literature:in fact, mfERG signals have been found either abnormal [18,20,21] or normal [22], due to differenttypes of MS patients (with or without history of ON), acquisition systems and analysis of recordingsand limited sample size.
All this contrasting electrophysiological evidence led us to consider that there are no conclusivefindings on whether there is or not an O-MR layers dysfunction or functional expression of the extendedneurodegenerative process beyond IML in MS.
Therefore, to add information to the debated topic of preganglionic functional involvement orsparing from neurodegeneration, the aim of our work was to assess the function of preganglionicelements in MS patients with the absence or presence of a history of ON, followed by good or poorrecovery of the best corrected visual acuity (BCVA).
We attempted to determine whether an O-MR dysfunction could be detected in the centralmacular area, or whether it might affect more peripheral retinal regions. In addition, we investigatedwhether the possible O-MR involvement could be observed in specific sectors (Superior (S), Nasal(N), Inferior (I), Temporal (T)) of the central macular region (0 to 15 degrees) and/or in more eccentricretinal areas within the vascular arcades (0 to 25 degrees).
In addition, a morphological involvement of the outer macular layers in MS patients with historyof ON was described [20], but with no clear information whether the morphological changes wererelated or not to the recovery of BCVA after ON. In order to evaluate the macular morphologicalchanges in MS patients with recovery or not of BCVA after an ON, we recently published a work [23]in which a morphological involvement of the outer macular layers was detectable exclusively inthose MS patients with poor recovery of BCVA after ON, whereas when a good recovery after ONwas reached, the morphology the outer macular layers was not statistically different from those ofControls. Thus, we believed that, in MS patients with poor recovery of BCVA, it could be interestingto evaluate whether a possible preganglionic macular dysfunction could be associated or not to theabove-mentioned morphological changes.
J. Clin. Med. 2020, 9, 3766 3 of 25
2. Materials and Methods
2.1. Study Design and Participants
All research procedures described in this work adhered to the tenets of Declaration of Helsinki.The study protocol (CEC/795/14) was approved by the local Ethical Committee (Comitato Etico CentraleIRCCS Lazio, Sezione IFO/Fondazione Bietti, Rome, Italy) and upon recruitment, informed consentafter full explanation of the procedure was obtained from each subject enrolled in the study.
Eighty-eight relapsing remitting (RR) MS patients were enrolled at the Visual Neurophysiologyand Neurophthalmology Research Unit, IRCCS- Fondazione Bietti referred by the Multiple Sclerosiscenter of the Tor Vergata University Hospital in Rome, between September 2016 and 20 October 2020.
In order to obtain homogeneous MS Groups (without ON and with ON followed by good or poorrecovery of BCVA, see below) the MS patients were selected form a large cohort (n = 342) based on thefollowing demographic and clinical characteristics:
1. Age between 28 and 45 years;2. Diagnosis of RR MS according to validated 2010 McDonald criteria [24];3. MS disease duration (MS-DD), estimated as the number of years from onset to the most recent
assessment of disability, ranging from 5 and 15 years;4. Expanded Disability Status Scale (EDSS), as ten-point disease severity derived from nine ratings
for individual neurological domains [25], ranging from 0 to 3; this score was assessed by twotrained [26] neurologists (LaB and MA);
5. Treatment with disease-modifying therapies (DMT) currently approved for preventing MSrelapses. DMT considered in our study were Interferon-β-1a, Interferon-β-1b, Peginterferonbeta-1a, Glatiramer acetate, Natalizumab, Dimethyl fumarate and Teriflunomide [27];
6. Absence of ON, or a single episode of ON without recurrence, that elapsed from the onset of thedisease at least 12 months (ranging from 13 to 20 months) before the inclusion in the study. For MSpatients with ON, this criterion was chosen, since it is known that the retrograde degenerationfollowing ON occurs over a period of 6 months [28]. When an MS patient was affected by ON inboth eyes, we studied the eye affected longer that met the inclusion criteria;
7. Based on the ophthalmological examination, other inclusion criteria were: mean refractive error(when present) between −3.00 and +3.00 spherical equivalent; intraocular pressure less than18 mmHg, absence of glaucoma or other diseases involving cornea, lens (lens opacity classificationsystem, LOCS III, stage < 1), uvea, retina; BCVA between 0.0 and 1.0 LogMAR of the EarlyTreatment of Diabetic Retinopathy (ETDRS) charts; absence of central visual field defects andability to maintain a stable fixation that allowed performing multifocal ERG (see below); absenceof other systemic diseases (i.e., diabetes, systemic hypertension, rheumatologic disorders) thatmay influence the retinal function.
A Group of selected 41 age-matched healthy subjects (mean age: 40.64 ± 4.83 years, 26 females and15 males), providing 41 normal eyes, with BCVA of 0.0 LogMAR (mean 0.0 ± 0.0), served as Controls.
The selected MS patients were divided into two Groups for age, MS-DD, EDSS and for previoushistory of presence or absence of ON.
The 41 MS patients (mean age 41.32 ± 3.72 years, 27 females and 14 males, mean MS-DD8.53 ± 4.19 years, range 5–20 years; mean EDSS score 1.43 ± 1.06, range 0–3) were without historyof unilateral or bilateral clinical signs of ON (i.e., painless reduction of BCVA, contrast sensitivity,color vision and any type of visual field defects) and high-contrast BCVA of 0.0 LogMAR (mean 0.0 ± 0.0).When both eyes met the inclusion criteria, only one eye was randomly chosen for the study. Therefore,we considered 40 eyes from 40 MS patients without ON (MS-noON Group).
J. Clin. Med. 2020, 9, 3766 4 of 25
The 47 MS patients (mean age 40.64 ± 4.96 years, 29 females and 18 males,) were with previoushistory of unilateral or bilateral ON (i.e., painless reduction of BCVA -between 0.2 and 1 LogMAR-,contrast sensitivity, color vision and visual field defects). They were further divided in to two Groupson the basis of the recovery of BCVA after ON:
The 27 MS patients (mean age 39.92 ± 4.86 years; 17 females and 10 males; mean MS-DD9.06 ± 5.58 years, range 5–20 years; mean EDSS score 1.53 ± 1.22, range 0–3) were with previoushistory of a single unilateral or bilateral ON and with “good” recovery of high-contrast BCVA(0.0 LogMAR; mean 0.0 ± 0.0) after ON. Therefore, we considered 27 eyes from 27 MS patients withON (MS-ON-G Group);
The 20 MS patients (mean age 41.08 ± 4.66 years; 12 females and 8 males; mean MS-DD9.96 ± 6.03 years, range 5–20 years; mean EDSS score 1.49 ± 1.18, range 0–3) were with previous historyof a single unilateral or bilateral ON with “poor” recovery of high-contrast BCVA (between 0.2 and1 LogMAR; mean 0.357 ± 0.286) after ON, and reduced P-ERG amplitude with respect to our normativedata collected in healthy subjects [29]. Therefore, we considered 20 eyes from 20 MS patients with ON(MS-ON-P Group).
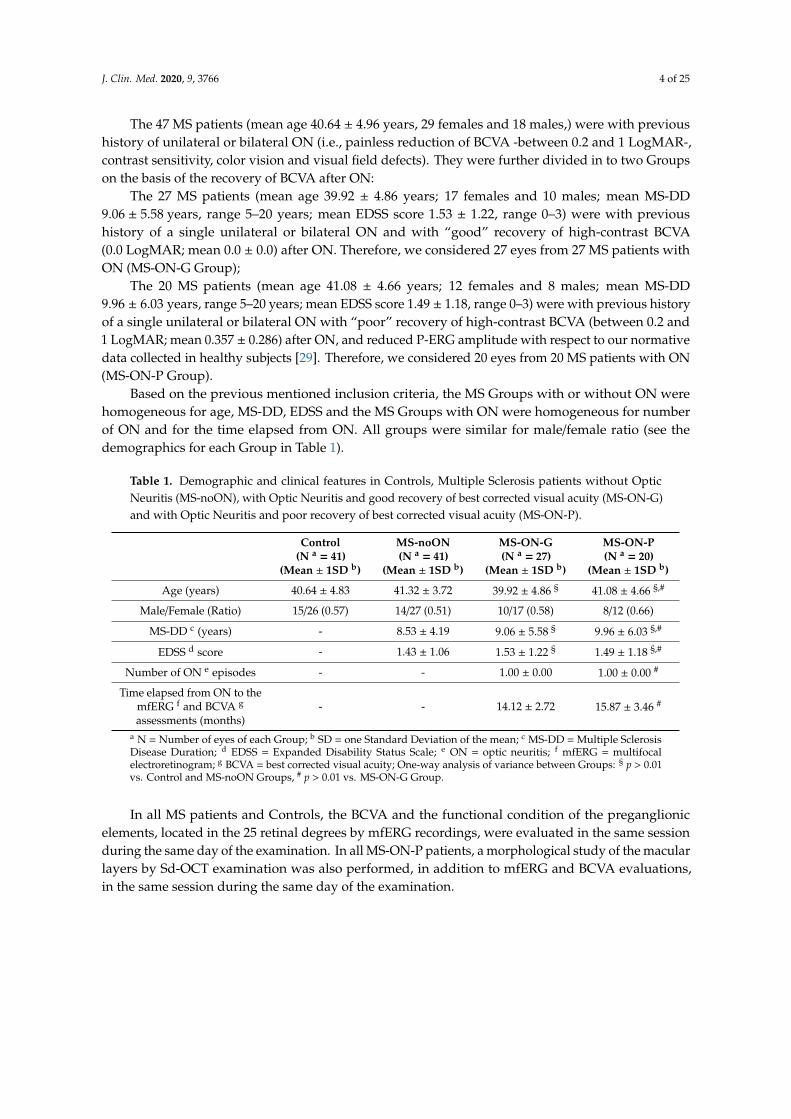
Based on the previous mentioned inclusion criteria, the MS Groups with or without ON werehomogeneous for age, MS-DD, EDSS and the MS Groups with ON were homogeneous for numberof ON and for the time elapsed from ON. All groups were similar for male/female ratio (see thedemographics for each Group in Table 1).
Table 1. Demographic and clinical features in Controls, Multiple Sclerosis patients without OpticNeuritis (MS-noON), with Optic Neuritis and good recovery of best corrected visual acuity (MS-ON-G)and with Optic Neuritis and poor recovery of best corrected visual acuity (MS-ON-P).
Control(N a = 41)
(Mean ± 1SD b)
MS-noON(N a = 41)
(Mean ± 1SD b)
MS-ON-G(N a = 27)
(Mean ± 1SD b)
MS-ON-P(N a = 20)
(Mean ± 1SD b)
Age (years) 40.64 ± 4.83 41.32 ± 3.72 39.92 ± 4.86 § 41.08 ± 4.66 §,#
Male/Female (Ratio) 15/26 (0.57) 14/27 (0.51) 10/17 (0.58) 8/12 (0.66)
MS-DD c (years) - 8.53 ± 4.19 9.06 ± 5.58 § 9.96 ± 6.03 §,#
EDSS d score - 1.43 ± 1.06 1.53 ± 1.22 § 1.49 ± 1.18 §,#
Number of ON e episodes - - 1.00 ± 0.00 1.00 ± 0.00 #
Time elapsed from ON to themfERG f and BCVA g
assessments (months)- - 14.12 ± 2.72 15.87 ± 3.46 #
a N = Number of eyes of each Group; b SD = one Standard Deviation of the mean; c MS-DD = Multiple SclerosisDisease Duration; d EDSS = Expanded Disability Status Scale; e ON = optic neuritis; f mfERG = multifocalelectroretinogram; g BCVA = best corrected visual acuity; One-way analysis of variance between Groups: § p > 0.01vs. Control and MS-noON Groups, # p > 0.01 vs. MS-ON-G Group.
In all MS patients and Controls, the BCVA and the functional condition of the preganglionicelements, located in the 25 retinal degrees by mfERG recordings, were evaluated in the same sessionduring the same day of the examination. In all MS-ON-P patients, a morphological study of the macularlayers by Sd-OCT examination was also performed, in addition to mfERG and BCVA evaluations,in the same session during the same day of the examination.
J. Clin. Med. 2020, 9, 3766 5 of 25
2.2. Multifocal Electroretinogram Recordings
The mfERG was recorded by using a modified version of Espion system (Diagnosys UK,LTD; Histon, Cambridge, UK) according to our previously published method [14,30,31] followingthe 2011 International Society for Clinical Electrophysiology of Vision (ISCEV) standards [11].Briefly, the multifocal stimulus, consisting of 61 scaled hexagons, was displayed on a high-resolution,black-and-white 32” LCD monitor with a frame rate of 75 Hz. The array of hexagons subtended50 degrees of visual field (25◦ radius from the fixation point to edge of display). Each hexagon wasindependently alternated between black (1 cd/m2) and white (200 cd/m2) according to a binary msequence. This resulted in a contrast of 99%. The luminance of the monitor screen and the centralfixation cross (used as target) was 100 cd/m2. The visual stimulation was performed by correctingBCVA for the distance of the visual stimuli. The m-sequence had 213-1 elements, and total recordingtime was approximately 8 min. Total recording time was divided into sixteen segments. Betweensegments, the subject was allowed to rest for a few seconds. Focusing lenses were used when necessary.To maintain a stable fixation, a small red cross target (0.5 degree) was placed in the center of thestimulation field. At every mfERG reported that he/she could clearly perceive the fixation target.The eye’s position was continuously monitored by an in-built video system to track fixation losses.
MfERGs were binocularly recorded in the presence of pupils that were maximallypharmacologically dilated with 1% tropicamide to a diameter of 7–8 mm. Pupil diameter wasmeasured by an observer (LuB) by means of a millimeter ruler and a magnifying lens and stored foreach tested eye. The cornea was anaesthetized with Benoxinate eye drops 0.4%. MfERGs were recordedbetween an active Dawson–Trick–Litzkow (DTL) contact electrode and a reference electrode (Ag/AgClskin electrode placed on the correspondent outer canthi). A small Ag/AgCl skin ground electrode wasplaced at the centre of the forehead. Interelectrode resistance was <3 KOhms. After automatic rejectionof artefacts and post-acquisition processing done by the in-built Espion software, the first-order kernelresponse was examined. MfERG responses with a signal to noise ≥3 were accepted for the analysis.
In the analysis of mfERG responses, we considered, for each obtained averaged response,the implicit times (ITs) of the first negative peak (N1) and the first positive peak (P1) measured inmilliseconds (msec) and the N1-P1 peak-to-peak response amplitude density (RAD) measured innanoVolt/degree2 (ηV/degree2).
We considered three possible retinal topographies to explore the bioelectrical responses derivedfrom specific retinal areas. Data were analyzed as follows:
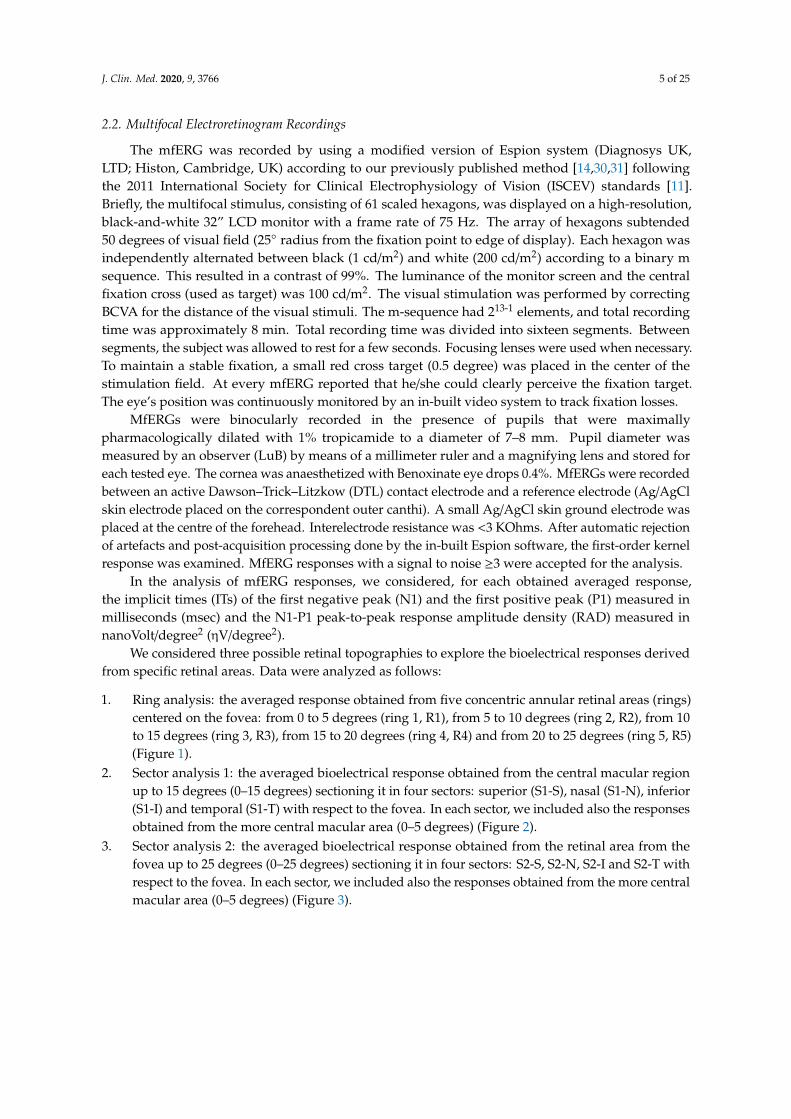
1. Ring analysis: the averaged response obtained from five concentric annular retinal areas (rings)centered on the fovea: from 0 to 5 degrees (ring 1, R1), from 5 to 10 degrees (ring 2, R2), from 10to 15 degrees (ring 3, R3), from 15 to 20 degrees (ring 4, R4) and from 20 to 25 degrees (ring 5, R5)(Figure 1).
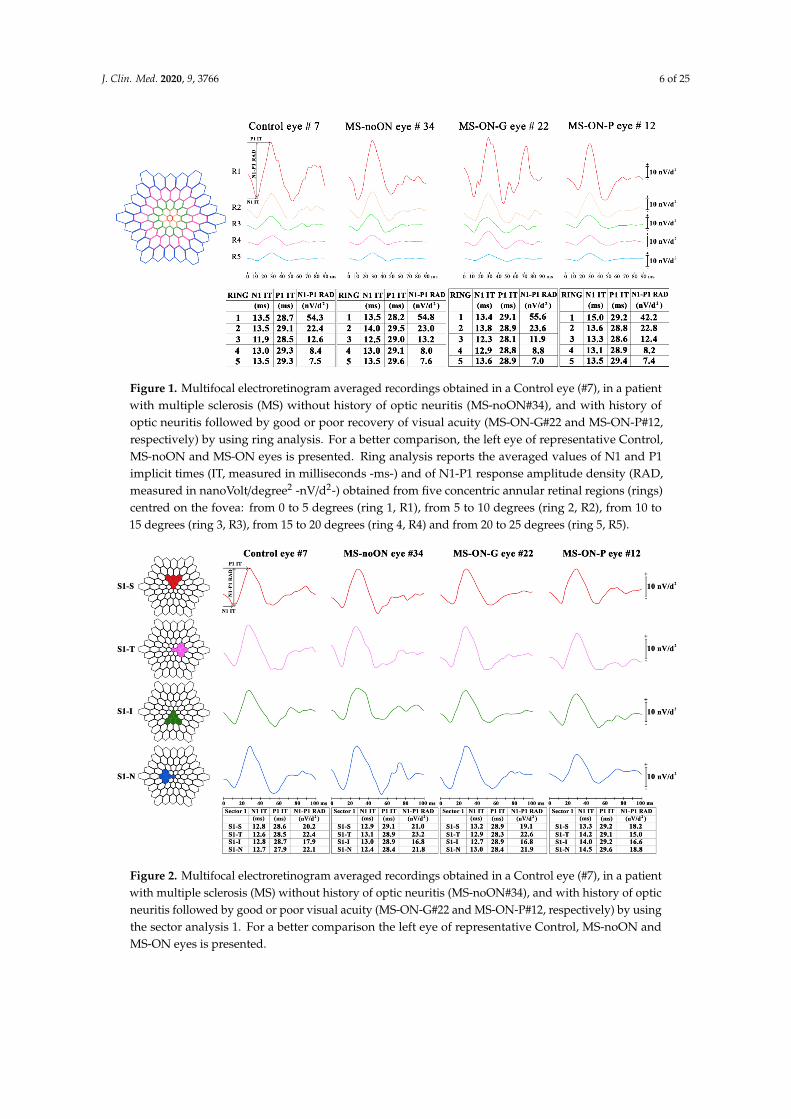
2. Sector analysis 1: the averaged bioelectrical response obtained from the central macular regionup to 15 degrees (0–15 degrees) sectioning it in four sectors: superior (S1-S), nasal (S1-N), inferior(S1-I) and temporal (S1-T) with respect to the fovea. In each sector, we included also the responsesobtained from the more central macular area (0–5 degrees) (Figure 2).
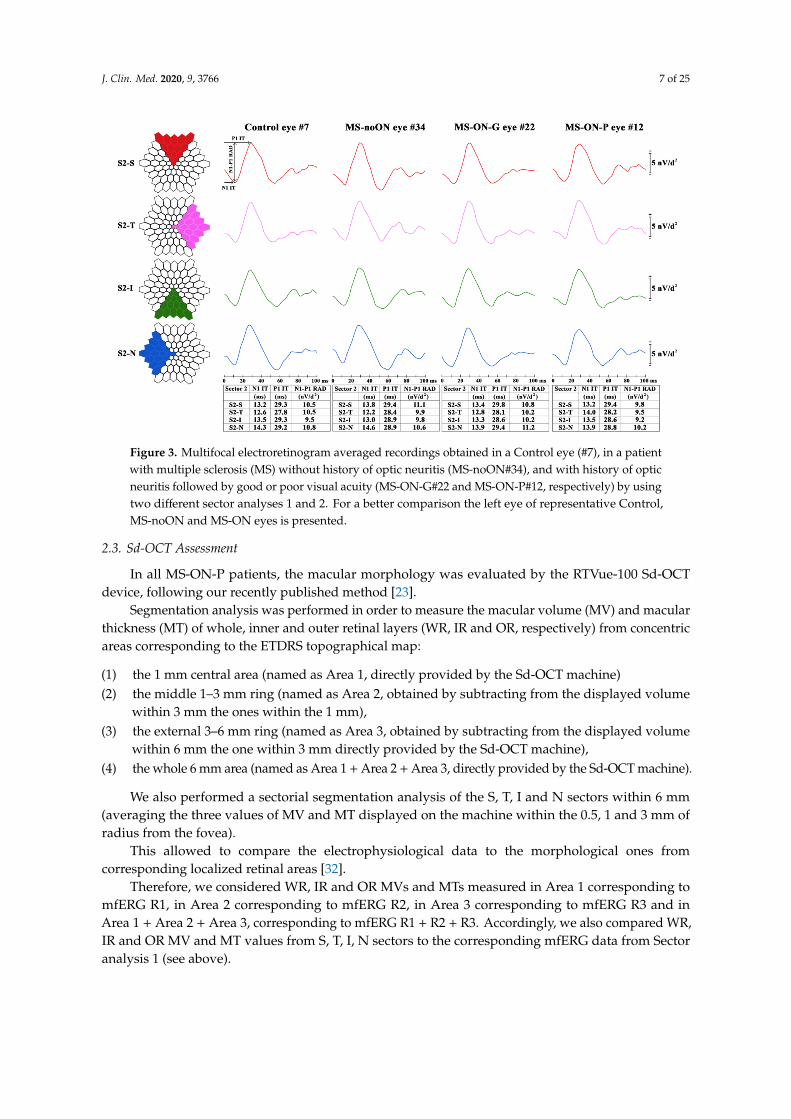
3. Sector analysis 2: the averaged bioelectrical response obtained from the retinal area from thefovea up to 25 degrees (0–25 degrees) sectioning it in four sectors: S2-S, S2-N, S2-I and S2-T withrespect to the fovea. In each sector, we included also the responses obtained from the more centralmacular area (0–5 degrees) (Figure 3).
J. Clin. Med. 2020, 9, 3766 6 of 25
J. Clin. Med. 2020, 9, x FOR PEER REVIEW 5 of 27
1. Ring analysis: the averaged response obtained from five concentric annular retinal areas (rings) centered on the fovea: from 0 to 5 degrees (ring 1, R1), from 5 to 10 degrees (ring 2, R2), from 10 to 15 degrees (ring 3, R3), from 15 to 20 degrees (ring 4, R4) and from 20 to 25 degrees (ring 5, R5) (Figure 1).
2. Sector analysis 1: the averaged bioelectrical response obtained from the central macular region up to 15 degrees (0–15 degrees) sectioning it in four sectors: superior (S1-S), nasal (S1-N), inferior (S1-I) and temporal (S1-T) with respect to the fovea. In each sector, we included also the responses obtained from the more central macular area (0–5 degrees) (Figure 2).
3. Sector analysis 2: the averaged bioelectrical response obtained from the retinal area from the fovea up to 25 degrees (0–25 degrees) sectioning it in four sectors: S2-S, S2-N, S2-I and S2-T with respect to the fovea. In each sector, we included also the responses obtained from the more central macular area (0–5 degrees) (Figure 3).
Figure 1. Multifocal electroretinogram averaged recordings obtained in a Control eye (#7), in a patient with multiple sclerosis (MS) without history of optic neuritis (MS-noON#34), and with history of optic neuritis followed by good or poor recovery of visual acuity (MS-ON-G#22 and MS-ON-P#12, respectively) by using ring analysis. For a better comparison, the left eye of representative Control, MS-noON and MS-ON eyes is presented. Ring analysis reports the averaged values of N1 and P1 implicit times (IT, measured in milliseconds -ms-) and of N1-P1 response amplitude density (RAD, measured in nanoVolt/degree2 -nV/d2-) obtained from five concentric annular retinal regions (rings) centred on the fovea: from 0 to 5 degrees (ring 1, R1), from 5 to 10 degrees (ring 2, R2), from 10 to 15 degrees (ring 3, R3), from 15 to 20 degrees (ring 4, R4) and from 20 to 25 degrees (ring 5, R5).
Figure 1. Multifocal electroretinogram averaged recordings obtained in a Control eye (#7), in a patientwith multiple sclerosis (MS) without history of optic neuritis (MS-noON#34), and with history ofoptic neuritis followed by good or poor recovery of visual acuity (MS-ON-G#22 and MS-ON-P#12,respectively) by using ring analysis. For a better comparison, the left eye of representative Control,MS-noON and MS-ON eyes is presented. Ring analysis reports the averaged values of N1 and P1implicit times (IT, measured in milliseconds -ms-) and of N1-P1 response amplitude density (RAD,measured in nanoVolt/degree2 -nV/d2-) obtained from five concentric annular retinal regions (rings)centred on the fovea: from 0 to 5 degrees (ring 1, R1), from 5 to 10 degrees (ring 2, R2), from 10 to15 degrees (ring 3, R3), from 15 to 20 degrees (ring 4, R4) and from 20 to 25 degrees (ring 5, R5).J. Clin. Med. 2020, 9, x FOR PEER REVIEW 6 of 27
Figure 2. Multifocal electroretinogram averaged recordings obtained in a Control eye (#7), in a patient with multiple sclerosis (MS) without history of optic neuritis (MS-noON#34), and with history of optic neuritis followed by good or poor visual acuity (MS-ON-G#22 and MS-ON-P#12, respectively) by using the sector analysis 1. For a better comparison the left eye of representative Control, MS-noON and MS-ON eyes is presented.
Figure 3. Multifocal electroretinogram averaged recordings obtained in a Control eye (#7), in a patient with multiple sclerosis (MS) without history of optic neuritis (MS-noON#34), and with history of optic neuritis followed by good or poor visual acuity (MS-ON-G#22 and MS-ON-P#12, respectively) by using two different sector analyses 1 and 2. For a better comparison the left eye of representative Control, MS-noON and MS-ON eyes is presented.
Figure 2. Multifocal electroretinogram averaged recordings obtained in a Control eye (#7), in a patientwith multiple sclerosis (MS) without history of optic neuritis (MS-noON#34), and with history of opticneuritis followed by good or poor visual acuity (MS-ON-G#22 and MS-ON-P#12, respectively) by usingthe sector analysis 1. For a better comparison the left eye of representative Control, MS-noON andMS-ON eyes is presented.
J. Clin. Med. 2020, 9, 3766 7 of 25
J. Clin. Med. 2020, 9, x FOR PEER REVIEW 6 of 27
Figure 2. Multifocal electroretinogram averaged recordings obtained in a Control eye (#7), in a patient with multiple sclerosis (MS) without history of optic neuritis (MS-noON#34), and with history of optic neuritis followed by good or poor visual acuity (MS-ON-G#22 and MS-ON-P#12, respectively) by using the sector analysis 1. For a better comparison the left eye of representative Control, MS-noON and MS-ON eyes is presented.
Figure 3. Multifocal electroretinogram averaged recordings obtained in a Control eye (#7), in a patient with multiple sclerosis (MS) without history of optic neuritis (MS-noON#34), and with history of optic neuritis followed by good or poor visual acuity (MS-ON-G#22 and MS-ON-P#12, respectively) by using two different sector analyses 1 and 2. For a better comparison the left eye of representative Control, MS-noON and MS-ON eyes is presented.
Figure 3. Multifocal electroretinogram averaged recordings obtained in a Control eye (#7), in a patientwith multiple sclerosis (MS) without history of optic neuritis (MS-noON#34), and with history of opticneuritis followed by good or poor visual acuity (MS-ON-G#22 and MS-ON-P#12, respectively) by usingtwo different sector analyses 1 and 2. For a better comparison the left eye of representative Control,MS-noON and MS-ON eyes is presented.
2.3. Sd-OCT Assessment
In all MS-ON-P patients, the macular morphology was evaluated by the RTVue-100 Sd-OCTdevice, following our recently published method [23].
Segmentation analysis was performed in order to measure the macular volume (MV) and macularthickness (MT) of whole, inner and outer retinal layers (WR, IR and OR, respectively) from concentricareas corresponding to the ETDRS topographical map:
(1) the 1 mm central area (named as Area 1, directly provided by the Sd-OCT machine)(2) the middle 1–3 mm ring (named as Area 2, obtained by subtracting from the displayed volume
within 3 mm the ones within the 1 mm),(3) the external 3–6 mm ring (named as Area 3, obtained by subtracting from the displayed volume
within 6 mm the one within 3 mm directly provided by the Sd-OCT machine),(4) the whole 6 mm area (named as Area 1 + Area 2 + Area 3, directly provided by the Sd-OCT machine).
We also performed a sectorial segmentation analysis of the S, T, I and N sectors within 6 mm(averaging the three values of MV and MT displayed on the machine within the 0.5, 1 and 3 mm ofradius from the fovea).
This allowed to compare the electrophysiological data to the morphological ones fromcorresponding localized retinal areas [32].
Therefore, we considered WR, IR and OR MVs and MTs measured in Area 1 corresponding tomfERG R1, in Area 2 corresponding to mfERG R2, in Area 3 corresponding to mfERG R3 and inArea 1 + Area 2 + Area 3, corresponding to mfERG R1 + R2 + R3. Accordingly, we also compared WR,IR and OR MV and MT values from S, T, I, N sectors to the corresponding mfERG data from Sectoranalysis 1 (see above).
J. Clin. Med. 2020, 9, 3766 8 of 25
2.4. Statistical Analysis
We assumed a Gaussian distribution of our data. The normal distribution was assessed by usingthe Kolmogorov-Smirnov test.
The differences of age, MS-DD, EDSS between MS-noON, MS-ON-G and MS-ON-P Groups wereevaluated by the one-way analysis of variance (ANOVA). The differences of the number of ON and thetime elapsed from the ON between MS-ON-G and MS-ON-P Groups were evaluated by the ANOVA.
Considering each different mfERG retinal topography (Ring, Sectors 1 and Sectors 2 analyses),the differences of mfERG N1 and P1 IT and N1-P1 RAD mean values between Controls, MS-noON,MS-ON-G and MS-ON-P Groups were evaluated by ANOVA. In addition, mean values of segmentedMV and MT from all Areas and Sectors within 6 mm detected in MS-ON-P Group were compared tothose of Controls by ANOVA. In MS-ON-P Group, Pearson’s test was used to linearly correlate thevalues of BCVA with those of mfERG parameters and to correlate the individual mfERG values withthe segmented MV and MT ones from corresponding retinal Areas and Sectors.
Since for each considered mfERG and OCT parameter, a multiple comparison between Groups(6 comparisons: Control vs. MS-noON Groups, Control vs. MS-ON-G Groups, Control vs. MS-ON-PGroups, MS-noON vs. MS-ON-G Groups, MS-noON vs. MS-ON-P Groups and MS-ON-G vs. MS-ON-PGroups) was performed, the value of statistically significance was calculated by: p = 0.05/number ofcomparison: 0.05/6 = 0.0082. Therefore, we rounded up to a p-value lower than 0.01 to be consideredas statistically significant. Minitab 17 (version 1) software was used for statistical analysis.
3. Results
3.1. Demographic and Clinical Features
In Table 1 are reported the demographic and clinical features observed in Controls, MS-noON,MS-ON-G and MS-ON-P Groups. The descriptive statistics of age, MS-DD and EDSS values were notsignificantly different between MS-noON, MS-ON-G and MS-ON-P Groups. The descriptive statisticsof number of ON and the time elapsed from the ON were not significantly different between MS-ON-Gand MS-ON-P Groups.
3.2. Multifocal Electroretinogram Ring Analysis
Examples of averaged mfERG recordings from five rings (R1, R2, R3, R4 and R5), obtained inrepresentative Control (#7), MS-noON (#34), MS-ON-G (#22) and MS-ON-P (#12) eyes, are presentedin Figure 1.
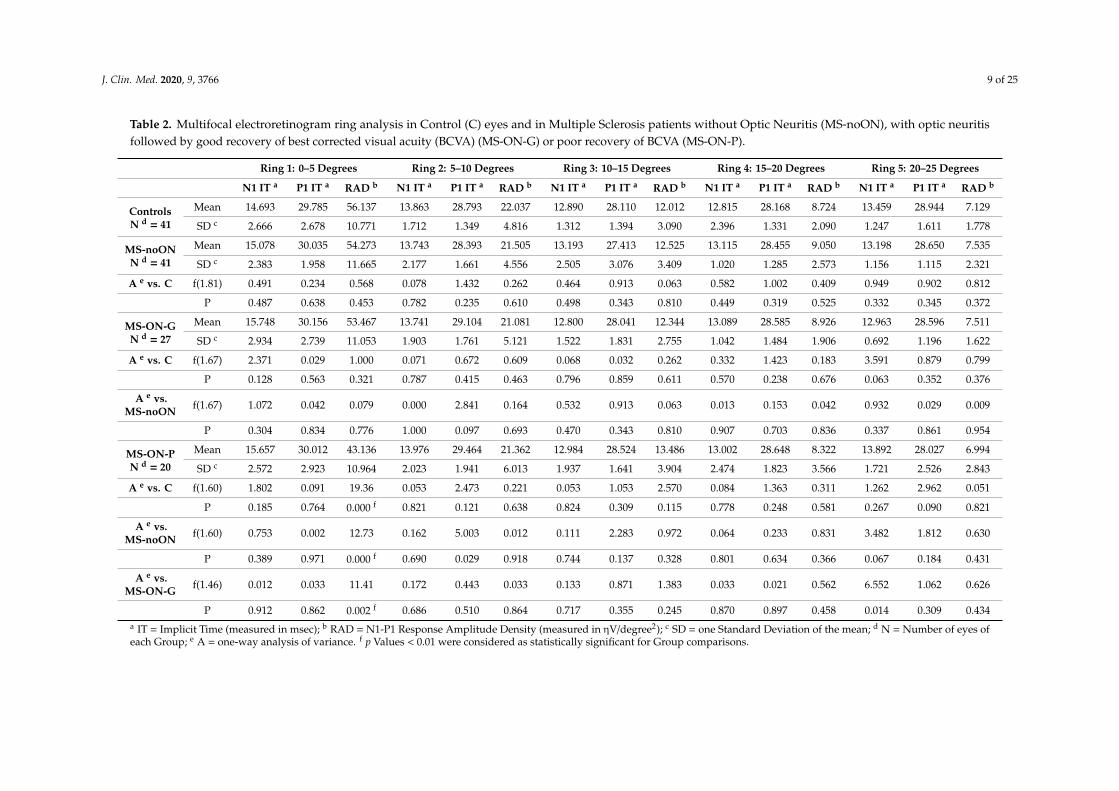
In Table 2 are reported the mean values of N1 and P1 IT and of N1-P1 RAD detected in the fiverings (R1, R2, R3, R4 and R5) in Control, MS-noON, MS-ON-G and MS-ON-P Groups and the relativestatistical analysis between Groups.
On average, when we considered the mean values of N1 and P1 IT obtained in the central retinalareas (R1, R2 and R3, 0 to 15 degrees) and in the more peripheral retinal areas (R4 and R5, 15 to25 degrees), not statistically significant (p > 0.01) differences between all Groups were found.
The mean values of N1-P1 RAD obtained in the most central retinal areas (R1, 0–5 degrees) inMS-noON Group were not statistically (p > 0.01) different with respect to those of Controls. In MS-ON-GGroup, the mean values of N1-P1 RAD were not significantly (p > 0.01) different when compared tothose of Control and MS-noON Groups; by contrast, in MS-ON-P Group, the mean values of N1-P1RAD were significantly (p < 0.01) reduced with respect to the ones from Control, MS-noON andMS-ON-G Groups; the reduction of the individual N1-P1 RADs were not significantly correlated(p > 0.01) with the corresponding values of BCVA.
In MS-noON, MS-ON-G and MS-ON-P Groups, the mean values of N1-P1 RAD obtained inthe other areas (R2, R3, R4 and R5) were not statistically (p > 0.01) different with respect to those ofControls, and not statistically significant (p > 0.01) differences were found between MS Groups.
J. Clin. Med. 2020, 9, 3766 9 of 25
Table 2. Multifocal electroretinogram ring analysis in Control (C) eyes and in Multiple Sclerosis patients without Optic Neuritis (MS-noON), with optic neuritisfollowed by good recovery of best corrected visual acuity (BCVA) (MS-ON-G) or poor recovery of BCVA (MS-ON-P).
Ring 1: 0–5 Degrees Ring 2: 5–10 Degrees Ring 3: 10–15 Degrees Ring 4: 15–20 Degrees Ring 5: 20–25 Degrees
N1 IT a P1 IT a RAD b N1 IT a P1 IT a RAD b N1 IT a P1 IT a RAD b N1 IT a P1 IT a RAD b N1 IT a P1 IT a RAD b
ControlsN d = 41
Mean 14.693 29.785 56.137 13.863 28.793 22.037 12.890 28.110 12.012 12.815 28.168 8.724 13.459 28.944 7.129
SD c 2.666 2.678 10.771 1.712 1.349 4.816 1.312 1.394 3.090 2.396 1.331 2.090 1.247 1.611 1.778
MS-noONN d = 41
Mean 15.078 30.035 54.273 13.743 28.393 21.505 13.193 27.413 12.525 13.115 28.455 9.050 13.198 28.650 7.535
SD c 2.383 1.958 11.665 2.177 1.661 4.556 2.505 3.076 3.409 1.020 1.285 2.573 1.156 1.115 2.321
A e vs. C f(1.81) 0.491 0.234 0.568 0.078 1.432 0.262 0.464 0.913 0.063 0.582 1.002 0.409 0.949 0.902 0.812
P 0.487 0.638 0.453 0.782 0.235 0.610 0.498 0.343 0.810 0.449 0.319 0.525 0.332 0.345 0.372
MS-ON-GN d = 27
Mean 15.748 30.156 53.467 13.741 29.104 21.081 12.800 28.041 12.344 13.089 28.585 8.926 12.963 28.596 7.511
SD c 2.934 2.739 11.053 1.903 1.761 5.121 1.522 1.831 2.755 1.042 1.484 1.906 0.692 1.196 1.622
A e vs. C f(1.67) 2.371 0.029 1.000 0.071 0.672 0.609 0.068 0.032 0.262 0.332 1.423 0.183 3.591 0.879 0.799
P 0.128 0.563 0.321 0.787 0.415 0.463 0.796 0.859 0.611 0.570 0.238 0.676 0.063 0.352 0.376
A e vs.MS-noON f(1.67) 1.072 0.042 0.079 0.000 2.841 0.164 0.532 0.913 0.063 0.013 0.153 0.042 0.932 0.029 0.009
P 0.304 0.834 0.776 1.000 0.097 0.693 0.470 0.343 0.810 0.907 0.703 0.836 0.337 0.861 0.954
MS-ON-PN d = 20
Mean 15.657 30.012 43.136 13.976 29.464 21.362 12.984 28.524 13.486 13.002 28.648 8.322 13.892 28.027 6.994
SD c 2.572 2.923 10.964 2.023 1.941 6.013 1.937 1.641 3.904 2.474 1.823 3.566 1.721 2.526 2.843
A e vs. C f(1.60) 1.802 0.091 19.36 0.053 2.473 0.221 0.053 1.053 2.570 0.084 1.363 0.311 1.262 2.962 0.051
P 0.185 0.764 0.000 f 0.821 0.121 0.638 0.824 0.309 0.115 0.778 0.248 0.581 0.267 0.090 0.821
A e vs.MS-noON f(1.60) 0.753 0.002 12.73 0.162 5.003 0.012 0.111 2.283 0.972 0.064 0.233 0.831 3.482 1.812 0.630
P 0.389 0.971 0.000 f 0.690 0.029 0.918 0.744 0.137 0.328 0.801 0.634 0.366 0.067 0.184 0.431
A e vs.MS-ON-G f(1.46) 0.012 0.033 11.41 0.172 0.443 0.033 0.133 0.871 1.383 0.033 0.021 0.562 6.552 1.062 0.626
P 0.912 0.862 0.002 f 0.686 0.510 0.864 0.717 0.355 0.245 0.870 0.897 0.458 0.014 0.309 0.434a IT = Implicit Time (measured in msec); b RAD = N1-P1 Response Amplitude Density (measured in ηV/degree2); c SD = one Standard Deviation of the mean; d N = Number of eyes ofeach Group; e A = one-way analysis of variance. f p Values < 0.01 were considered as statistically significant for Group comparisons.
J. Clin. Med. 2020, 9, 3766 10 of 25
3.3. Multifocal Electroretinogram Sector Analysis 1 (0–15 Degrees)
Examples of averaged mfERG recordings from four sectors superior (S1-S), temporal (S1-T),inferior (S1-I) and nasal (S1-N) within 15 degrees of foveal eccentricity, obtained in representativeControl (#7), MS-noON (#34), MS-ON-G (#22) and MS-ON-P (#12) eyes, are presented in Figure 2.
Sector analysis 1 reports the averaged values of N1 and P1 IT and of N1-P1 RAD obtained fromfour macular areas enclosed between 0 and 15 degrees with respect to the fovea on the basis of theretinal topography: superior (S1-S), temporal (S1-T), inferior (S1-I), nasal (S1-N). The bioelectricalresponses obtained from the central 0–5 degrees were enclosed in the sector analysis 1.
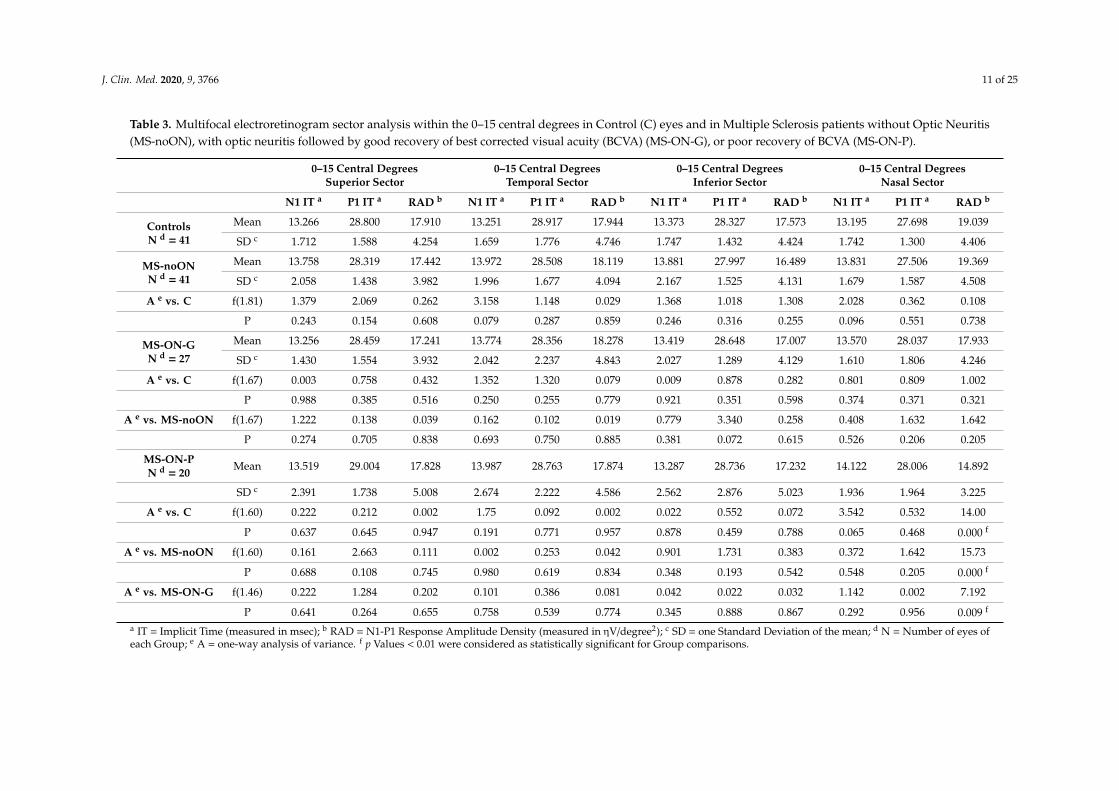
In Table 3 are reported the mean values of N1 and P1 IT and of N1-P1 RAD detected in the fourcentral sectors (S1-S, S1-T, S1-I, S1-N) in Control, MS-noON, MS-ON-G and MS-ON-P Groups and therelative statistical analysis between Groups.
On average, when we considered the mean values of N1 and P1 IT obtained in the central sectors(S1-S, S1-N, S1-I, S1-T) not statistically significant (p > 0.01) differences between all Groups were found.
The mean values of N1-P1 RAD obtained in these sectors in MS-noON Group were not statistically(p > 0.01) different with respect to those of Controls.
In MS-ON-G Group, the mean values of N1-P1 RAD from all four sectors were not significant(p > 0.01) different when compared to those of Control and MS-noON Groups. By contrast, in MS-ON-PGroup, while mean values of N1-P1 RAD detected in S1-I, S1-T and S1-S were not significantly(p > 0.01) reduced with respect to Control, MS-noON and MS-ON-G ones, a significant (p < 0.01)reduction of N1-P1 RADs in the S1-N sector was observed as compared to Controls, MS-noON andMS-ON-G Groups.
The individual reduced N1-P1 RAD values from S1-N sector in MS-ON-P eyes were not significantlycorrelated (p > 0.01) with the corresponding values of BCVA.
J. Clin. Med. 2020, 9, 3766 11 of 25
Table 3. Multifocal electroretinogram sector analysis within the 0–15 central degrees in Control (C) eyes and in Multiple Sclerosis patients without Optic Neuritis(MS-noON), with optic neuritis followed by good recovery of best corrected visual acuity (BCVA) (MS-ON-G), or poor recovery of BCVA (MS-ON-P).
0–15 Central DegreesSuperior Sector
0–15 Central DegreesTemporal Sector
0–15 Central DegreesInferior Sector
0–15 Central DegreesNasal Sector
N1 IT a P1 IT a RAD b N1 IT a P1 IT a RAD b N1 IT a P1 IT a RAD b N1 IT a P1 IT a RAD b
ControlsN d = 41
Mean 13.266 28.800 17.910 13.251 28.917 17.944 13.373 28.327 17.573 13.195 27.698 19.039
SD c 1.712 1.588 4.254 1.659 1.776 4.746 1.747 1.432 4.424 1.742 1.300 4.406
MS-noONN d = 41
Mean 13.758 28.319 17.442 13.972 28.508 18.119 13.881 27.997 16.489 13.831 27.506 19.369
SD c 2.058 1.438 3.982 1.996 1.677 4.094 2.167 1.525 4.131 1.679 1.587 4.508
A e vs. C f(1.81) 1.379 2.069 0.262 3.158 1.148 0.029 1.368 1.018 1.308 2.028 0.362 0.108
P 0.243 0.154 0.608 0.079 0.287 0.859 0.246 0.316 0.255 0.096 0.551 0.738
MS-ON-GN d = 27
Mean 13.256 28.459 17.241 13.774 28.356 18.278 13.419 28.648 17.007 13.570 28.037 17.933
SD c 1.430 1.554 3.932 2.042 2.237 4.843 2.027 1.289 4.129 1.610 1.806 4.246
A e vs. C f(1.67) 0.003 0.758 0.432 1.352 1.320 0.079 0.009 0.878 0.282 0.801 0.809 1.002
P 0.988 0.385 0.516 0.250 0.255 0.779 0.921 0.351 0.598 0.374 0.371 0.321
A e vs. MS-noON f(1.67) 1.222 0.138 0.039 0.162 0.102 0.019 0.779 3.340 0.258 0.408 1.632 1.642
P 0.274 0.705 0.838 0.693 0.750 0.885 0.381 0.072 0.615 0.526 0.206 0.205
MS-ON-PN d = 20 Mean 13.519 29.004 17.828 13.987 28.763 17.874 13.287 28.736 17.232 14.122 28.006 14.892
SD c 2.391 1.738 5.008 2.674 2.222 4.586 2.562 2.876 5.023 1.936 1.964 3.225
A e vs. C f(1.60) 0.222 0.212 0.002 1.75 0.092 0.002 0.022 0.552 0.072 3.542 0.532 14.00
P 0.637 0.645 0.947 0.191 0.771 0.957 0.878 0.459 0.788 0.065 0.468 0.000 f
A e vs. MS-noON f(1.60) 0.161 2.663 0.111 0.002 0.253 0.042 0.901 1.731 0.383 0.372 1.642 15.73
P 0.688 0.108 0.745 0.980 0.619 0.834 0.348 0.193 0.542 0.548 0.205 0.000 f
A e vs. MS-ON-G f(1.46) 0.222 1.284 0.202 0.101 0.386 0.081 0.042 0.022 0.032 1.142 0.002 7.192
P 0.641 0.264 0.655 0.758 0.539 0.774 0.345 0.888 0.867 0.292 0.956 0.009 f
a IT = Implicit Time (measured in msec); b RAD = N1-P1 Response Amplitude Density (measured in ηV/degree2); c SD = one Standard Deviation of the mean; d N = Number of eyes ofeach Group; e A = one-way analysis of variance. f p Values < 0.01 were considered as statistically significant for Group comparisons.
J. Clin. Med. 2020, 9, 3766 12 of 25
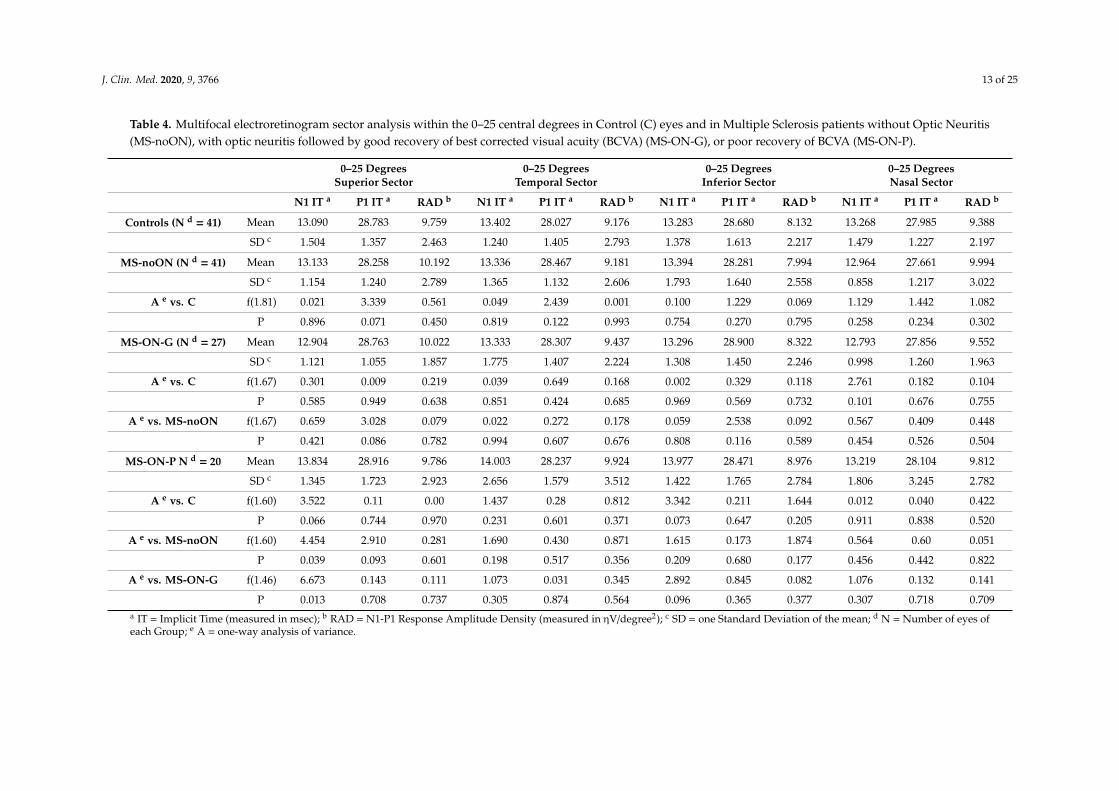
3.4. Multifocal Electroretinogram Sector Analysis 2 (0–25 Degrees)
Examples of averaged mfERG recordings from 4 sectors (S2-S, S2-T, S2-I, S2-N) within 25 degreesof foveal eccentricity in representative Control (#7), MS-noON (#34), MS-ON-G (#22) and MS-ON-P(#12) eyes are presented in Figure 3.
Sector analysis 2 reports the averaged values of N1 and P1 IT and of N1-P1 RAD obtained fromfour retinal areas from 0 to 25 degrees based on the retinal topography: superior (S2-S), temporal(S2-T), inferior (S2-I), nasal (S2-N), with respect to the fovea. The bioelectrical responses obtained fromthe central 0–5 degrees were enclosed in the sector analysis 2.
The mean values of N1 and P1 IT and of N1-P1 RAD detected in the 4 sectors (S2-S, S2-T, S2-I,S2-N) in Control, MS-ON and MS-noON Groups and the relative statistical analysis between Groupsare reported in Table 4.
On average, the mean values of N1 and P1 IT and of N1-P1 RAD detected in all sectors (S2-S, S2-T,S2-I, S2-N) in MS-noON, MS-ON-G and MS-ON-P Groups were not statistically (p > 0.01) differentwhen compared with those of Controls. In MS-ON-G and MS-ON-P Groups the mean values of N1-P1RAD from all four sectors were not significantly (p > 0.01) different when compared to those of Controland MS-noON Groups. Furthermore, not statistically significant differences (p > 0.01) were foundwhen mean N1-P1 RADs were compared between MS-ON-G and MS-ON-P Groups in all sectors.
J. Clin. Med. 2020, 9, 3766 13 of 25
Table 4. Multifocal electroretinogram sector analysis within the 0–25 central degrees in Control (C) eyes and in Multiple Sclerosis patients without Optic Neuritis(MS-noON), with optic neuritis followed by good recovery of best corrected visual acuity (BCVA) (MS-ON-G), or poor recovery of BCVA (MS-ON-P).
0–25 DegreesSuperior Sector
0–25 DegreesTemporal Sector
0–25 DegreesInferior Sector
0–25 DegreesNasal Sector
N1 IT a P1 IT a RAD b N1 IT a P1 IT a RAD b N1 IT a P1 IT a RAD b N1 IT a P1 IT a RAD b
Controls (N d = 41) Mean 13.090 28.783 9.759 13.402 28.027 9.176 13.283 28.680 8.132 13.268 27.985 9.388
SD c 1.504 1.357 2.463 1.240 1.405 2.793 1.378 1.613 2.217 1.479 1.227 2.197
MS-noON (N d = 41) Mean 13.133 28.258 10.192 13.336 28.467 9.181 13.394 28.281 7.994 12.964 27.661 9.994
SD c 1.154 1.240 2.789 1.365 1.132 2.606 1.793 1.640 2.558 0.858 1.217 3.022
A e vs. C f(1.81) 0.021 3.339 0.561 0.049 2.439 0.001 0.100 1.229 0.069 1.129 1.442 1.082
P 0.896 0.071 0.450 0.819 0.122 0.993 0.754 0.270 0.795 0.258 0.234 0.302
MS-ON-G (N d = 27) Mean 12.904 28.763 10.022 13.333 28.307 9.437 13.296 28.900 8.322 12.793 27.856 9.552
SD c 1.121 1.055 1.857 1.775 1.407 2.224 1.308 1.450 2.246 0.998 1.260 1.963
A e vs. C f(1.67) 0.301 0.009 0.219 0.039 0.649 0.168 0.002 0.329 0.118 2.761 0.182 0.104
P 0.585 0.949 0.638 0.851 0.424 0.685 0.969 0.569 0.732 0.101 0.676 0.755
A e vs. MS-noON f(1.67) 0.659 3.028 0.079 0.022 0.272 0.178 0.059 2.538 0.092 0.567 0.409 0.448
P 0.421 0.086 0.782 0.994 0.607 0.676 0.808 0.116 0.589 0.454 0.526 0.504
MS-ON-P N d = 20 Mean 13.834 28.916 9.786 14.003 28.237 9.924 13.977 28.471 8.976 13.219 28.104 9.812
SD c 1.345 1.723 2.923 2.656 1.579 3.512 1.422 1.765 2.784 1.806 3.245 2.782
A e vs. C f(1.60) 3.522 0.11 0.00 1.437 0.28 0.812 3.342 0.211 1.644 0.012 0.040 0.422
P 0.066 0.744 0.970 0.231 0.601 0.371 0.073 0.647 0.205 0.911 0.838 0.520
A e vs. MS-noON f(1.60) 4.454 2.910 0.281 1.690 0.430 0.871 1.615 0.173 1.874 0.564 0.60 0.051
P 0.039 0.093 0.601 0.198 0.517 0.356 0.209 0.680 0.177 0.456 0.442 0.822
A e vs. MS-ON-G f(1.46) 6.673 0.143 0.111 1.073 0.031 0.345 2.892 0.845 0.082 1.076 0.132 0.141
P 0.013 0.708 0.737 0.305 0.874 0.564 0.096 0.365 0.377 0.307 0.718 0.709a IT = Implicit Time (measured in msec); b RAD = N1-P1 Response Amplitude Density (measured in ηV/degree2); c SD = one Standard Deviation of the mean; d N = Number of eyes ofeach Group; e A = one-way analysis of variance.
J. Clin. Med. 2020, 9, 3766 14 of 25
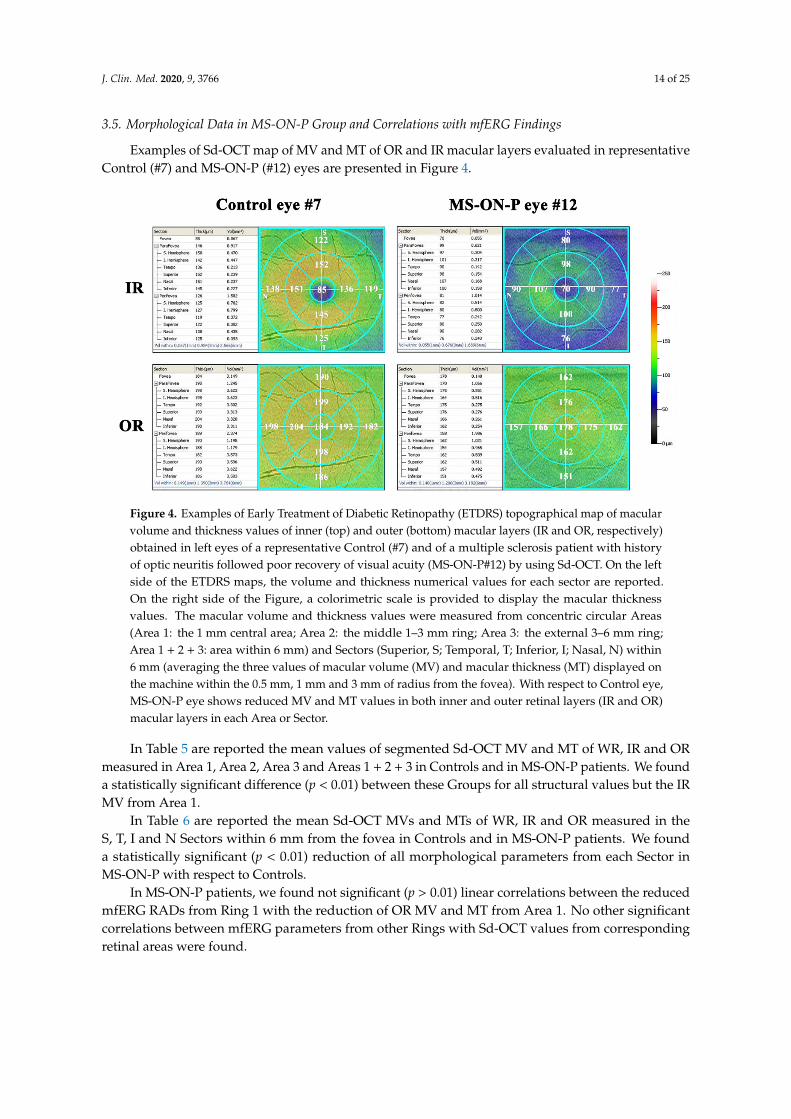
3.5. Morphological Data in MS-ON-P Group and Correlations with mfERG Findings
Examples of Sd-OCT map of MV and MT of OR and IR macular layers evaluated in representativeControl (#7) and MS-ON-P (#12) eyes are presented in Figure 4.
J. Clin. Med. 2020, 9, x FOR PEER REVIEW 14 of 27
On average, the mean values of N1 and P1 IT and of N1-P1 RAD detected in all sectors (S2-S, S2-T, S2-I, S2-N) in MS-noON, MS-ON-G and MS-ON-P Groups were not statistically (p > 0.01) different when compared with those of Controls. In MS-ON-G and MS-ON-P Groups the mean values of N1-P1 RAD from all four sectors were not significantly (p > 0.01) different when compared to those of Control and MS-noON Groups. Furthermore, not statistically significant differences (p > 0.01) were found when mean N1-P1 RADs were compared between MS-ON-G and MS-ON-P Groups in all sectors.
3.5. Morphological Data in MS-ON-P Group and Correlations with mfERG Findings
Examples of Sd-OCT map of MV and MT of OR and IR macular layers evaluated in representative Control (#7) and MS-ON-P (#12) eyes are presented in Figure 4.
Figure 4. Examples of Early Treatment of Diabetic Retinopathy (ETDRS) topographical map of macular volume and thickness values of inner (top) and outer (bottom) macular layers (IR and OR, respectively) obtained in left eyes of a representative Control (#7) and of a multiple sclerosis patient with history of optic neuritis followed poor recovery of visual acuity (MS-ON-P#12) by using Sd-OCT. On the left side of the ETDRS maps, the volume and thickness numerical values for each sector are reported. On the right side of the Figure, a colorimetric scale is provided to display the macular thickness values. The macular volume and thickness values were measured from concentric circular Areas (Area 1: the 1 mm central area; Area 2: the middle 1–3 mm ring; Area 3: the external 3–6 mm ring; Area 1 + 2 + 3: area within 6 mm) and Sectors (Superior, S; Temporal, T; Inferior, I; Nasal, N) within 6 mm (averaging the three values of macular volume (MV) and macular thickness (MT) displayed on the machine within the 0.5 mm, 1 mm and 3 mm of radius from the fovea). With respect to Control eye, MS-ON-P eye shows reduced MV and MT values in both inner and outer retinal layers (IR and OR) macular layers in each Area or Sector.
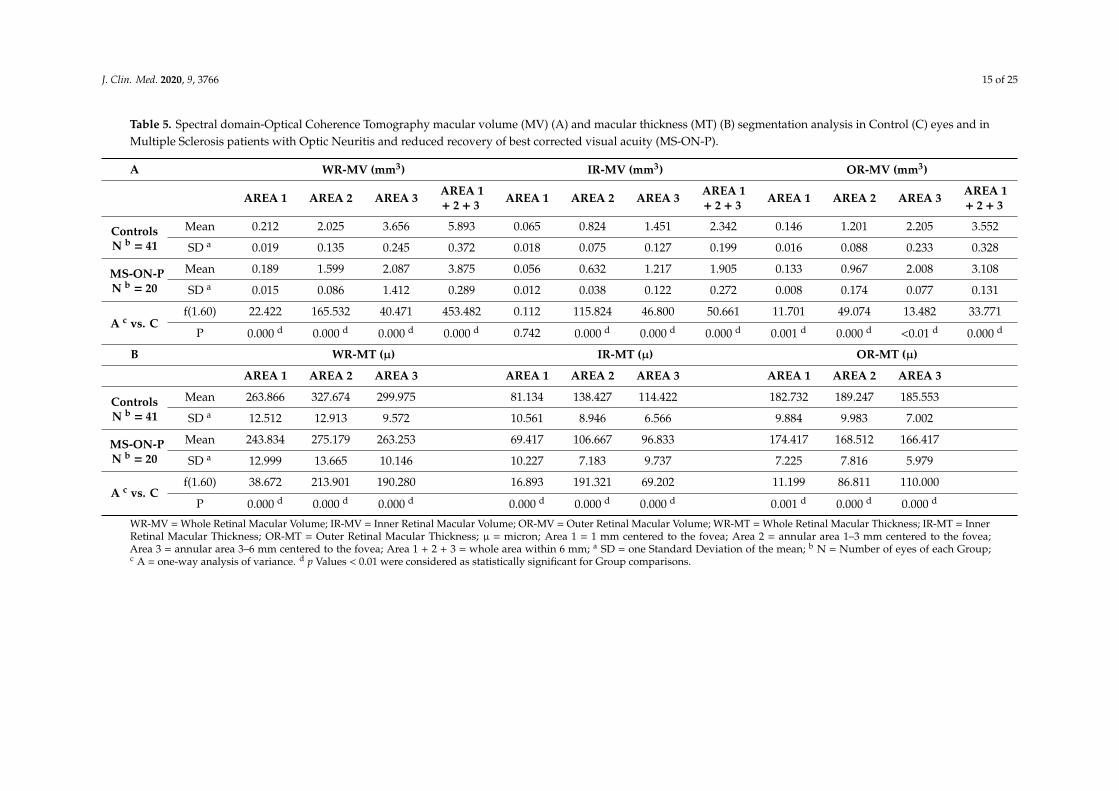
In Table 5 are reported the mean values of segmented Sd-OCT MV and MT of WR, IR and OR measured in Area 1, Area 2, Area 3 and Areas 1 + 2 + 3 in Controls and in MS-ON-P patients. We found a statistically significant difference (p < 0.01) between these Groups for all structural values but the IR MV from Area 1.
Figure 4. Examples of Early Treatment of Diabetic Retinopathy (ETDRS) topographical map of macularvolume and thickness values of inner (top) and outer (bottom) macular layers (IR and OR, respectively)obtained in left eyes of a representative Control (#7) and of a multiple sclerosis patient with historyof optic neuritis followed poor recovery of visual acuity (MS-ON-P#12) by using Sd-OCT. On the leftside of the ETDRS maps, the volume and thickness numerical values for each sector are reported.On the right side of the Figure, a colorimetric scale is provided to display the macular thicknessvalues. The macular volume and thickness values were measured from concentric circular Areas(Area 1: the 1 mm central area; Area 2: the middle 1–3 mm ring; Area 3: the external 3–6 mm ring;Area 1 + 2 + 3: area within 6 mm) and Sectors (Superior, S; Temporal, T; Inferior, I; Nasal, N) within6 mm (averaging the three values of macular volume (MV) and macular thickness (MT) displayed onthe machine within the 0.5 mm, 1 mm and 3 mm of radius from the fovea). With respect to Control eye,MS-ON-P eye shows reduced MV and MT values in both inner and outer retinal layers (IR and OR)macular layers in each Area or Sector.
In Table 5 are reported the mean values of segmented Sd-OCT MV and MT of WR, IR and ORmeasured in Area 1, Area 2, Area 3 and Areas 1 + 2 + 3 in Controls and in MS-ON-P patients. We founda statistically significant difference (p < 0.01) between these Groups for all structural values but the IRMV from Area 1.
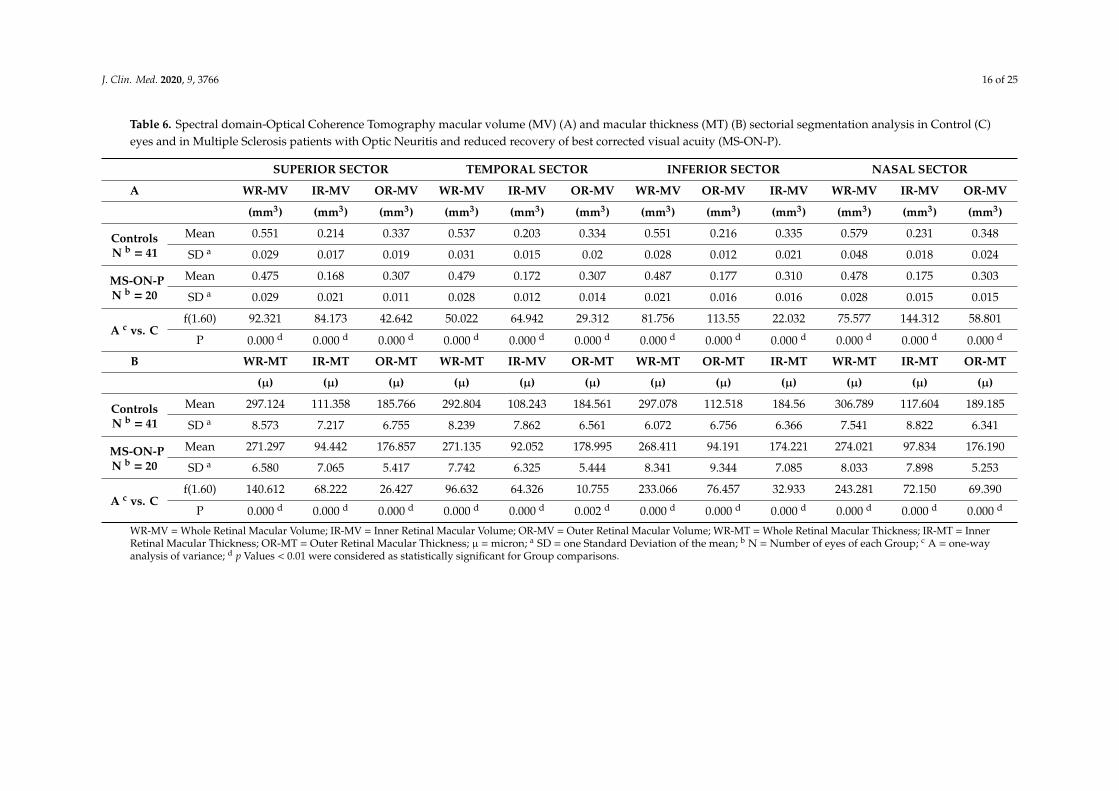
In Table 6 are reported the mean Sd-OCT MVs and MTs of WR, IR and OR measured in theS, T, I and N Sectors within 6 mm from the fovea in Controls and in MS-ON-P patients. We founda statistically significant (p < 0.01) reduction of all morphological parameters from each Sector inMS-ON-P with respect to Controls.
In MS-ON-P patients, we found not significant (p > 0.01) linear correlations between the reducedmfERG RADs from Ring 1 with the reduction of OR MV and MT from Area 1. No other significantcorrelations between mfERG parameters from other Rings with Sd-OCT values from correspondingretinal areas were found.
J. Clin. Med. 2020, 9, 3766 15 of 25
Table 5. Spectral domain-Optical Coherence Tomography macular volume (MV) (A) and macular thickness (MT) (B) segmentation analysis in Control (C) eyes and inMultiple Sclerosis patients with Optic Neuritis and reduced recovery of best corrected visual acuity (MS-ON-P).
A WR-MV (mm3) IR-MV (mm3) OR-MV (mm3)
AREA 1 AREA 2 AREA 3 AREA 1+ 2 + 3 AREA 1 AREA 2 AREA 3 AREA 1
+ 2 + 3 AREA 1 AREA 2 AREA 3 AREA 1+ 2 + 3
ControlsN b = 41
Mean 0.212 2.025 3.656 5.893 0.065 0.824 1.451 2.342 0.146 1.201 2.205 3.552
SD a 0.019 0.135 0.245 0.372 0.018 0.075 0.127 0.199 0.016 0.088 0.233 0.328
MS-ON-PN b = 20
Mean 0.189 1.599 2.087 3.875 0.056 0.632 1.217 1.905 0.133 0.967 2.008 3.108
SD a 0.015 0.086 1.412 0.289 0.012 0.038 0.122 0.272 0.008 0.174 0.077 0.131
A c vs. Cf(1.60) 22.422 165.532 40.471 453.482 0.112 115.824 46.800 50.661 11.701 49.074 13.482 33.771
P 0.000 d 0.000 d 0.000 d 0.000 d 0.742 0.000 d 0.000 d 0.000 d 0.001 d 0.000 d <0.01 d 0.000 d
B WR-MT (µ) IR-MT (µ) OR-MT (µ)
AREA 1 AREA 2 AREA 3 AREA 1 AREA 2 AREA 3 AREA 1 AREA 2 AREA 3
ControlsN b = 41
Mean 263.866 327.674 299.975 81.134 138.427 114.422 182.732 189.247 185.553
SD a 12.512 12.913 9.572 10.561 8.946 6.566 9.884 9.983 7.002
MS-ON-PN b = 20
Mean 243.834 275.179 263.253 69.417 106.667 96.833 174.417 168.512 166.417
SD a 12.999 13.665 10.146 10.227 7.183 9.737 7.225 7.816 5.979
A c vs. Cf(1.60) 38.672 213.901 190.280 16.893 191.321 69.202 11.199 86.811 110.000
P 0.000 d 0.000 d 0.000 d 0.000 d 0.000 d 0.000 d 0.001 d 0.000 d 0.000 d
WR-MV = Whole Retinal Macular Volume; IR-MV = Inner Retinal Macular Volume; OR-MV = Outer Retinal Macular Volume; WR-MT = Whole Retinal Macular Thickness; IR-MT = InnerRetinal Macular Thickness; OR-MT = Outer Retinal Macular Thickness; µ = micron; Area 1 = 1 mm centered to the fovea; Area 2 = annular area 1–3 mm centered to the fovea;Area 3 = annular area 3–6 mm centered to the fovea; Area 1 + 2 + 3 = whole area within 6 mm; a SD = one Standard Deviation of the mean; b N = Number of eyes of each Group;c A = one-way analysis of variance. d p Values < 0.01 were considered as statistically significant for Group comparisons.
J. Clin. Med. 2020, 9, 3766 16 of 25
Table 6. Spectral domain-Optical Coherence Tomography macular volume (MV) (A) and macular thickness (MT) (B) sectorial segmentation analysis in Control (C)eyes and in Multiple Sclerosis patients with Optic Neuritis and reduced recovery of best corrected visual acuity (MS-ON-P).
SUPERIOR SECTOR TEMPORAL SECTOR INFERIOR SECTOR NASAL SECTOR
A WR-MV IR-MV OR-MV WR-MV IR-MV OR-MV WR-MV OR-MV IR-MV WR-MV IR-MV OR-MV
(mm3) (mm3) (mm3) (mm3) (mm3) (mm3) (mm3) (mm3) (mm3) (mm3) (mm3) (mm3)
ControlsN b = 41
Mean 0.551 0.214 0.337 0.537 0.203 0.334 0.551 0.216 0.335 0.579 0.231 0.348
SD a 0.029 0.017 0.019 0.031 0.015 0.02 0.028 0.012 0.021 0.048 0.018 0.024
MS-ON-PN b = 20
Mean 0.475 0.168 0.307 0.479 0.172 0.307 0.487 0.177 0.310 0.478 0.175 0.303
SD a 0.029 0.021 0.011 0.028 0.012 0.014 0.021 0.016 0.016 0.028 0.015 0.015
A c vs. Cf(1.60) 92.321 84.173 42.642 50.022 64.942 29.312 81.756 113.55 22.032 75.577 144.312 58.801
P 0.000 d 0.000 d 0.000 d 0.000 d 0.000 d 0.000 d 0.000 d 0.000 d 0.000 d 0.000 d 0.000 d 0.000 d
B WR-MT IR-MT OR-MT WR-MT IR-MV OR-MT WR-MT OR-MT IR-MT WR-MT IR-MT OR-MT
(µ) (µ) (µ) (µ) (µ) (µ) (µ) (µ) (µ) (µ) (µ) (µ)
ControlsN b = 41
Mean 297.124 111.358 185.766 292.804 108.243 184.561 297.078 112.518 184.56 306.789 117.604 189.185
SD a 8.573 7.217 6.755 8.239 7.862 6.561 6.072 6.756 6.366 7.541 8.822 6.341
MS-ON-PN b = 20
Mean 271.297 94.442 176.857 271.135 92.052 178.995 268.411 94.191 174.221 274.021 97.834 176.190
SD a 6.580 7.065 5.417 7.742 6.325 5.444 8.341 9.344 7.085 8.033 7.898 5.253
A c vs. Cf(1.60) 140.612 68.222 26.427 96.632 64.326 10.755 233.066 76.457 32.933 243.281 72.150 69.390
P 0.000 d 0.000 d 0.000 d 0.000 d 0.000 d 0.002 d 0.000 d 0.000 d 0.000 d 0.000 d 0.000 d 0.000 d
WR-MV = Whole Retinal Macular Volume; IR-MV = Inner Retinal Macular Volume; OR-MV = Outer Retinal Macular Volume; WR-MT = Whole Retinal Macular Thickness; IR-MT = InnerRetinal Macular Thickness; OR-MT = Outer Retinal Macular Thickness; µ = micron; a SD = one Standard Deviation of the mean; b N = Number of eyes of each Group; c A = one-wayanalysis of variance; d p Values < 0.01 were considered as statistically significant for Group comparisons.
J. Clin. Med. 2020, 9, 3766 17 of 25
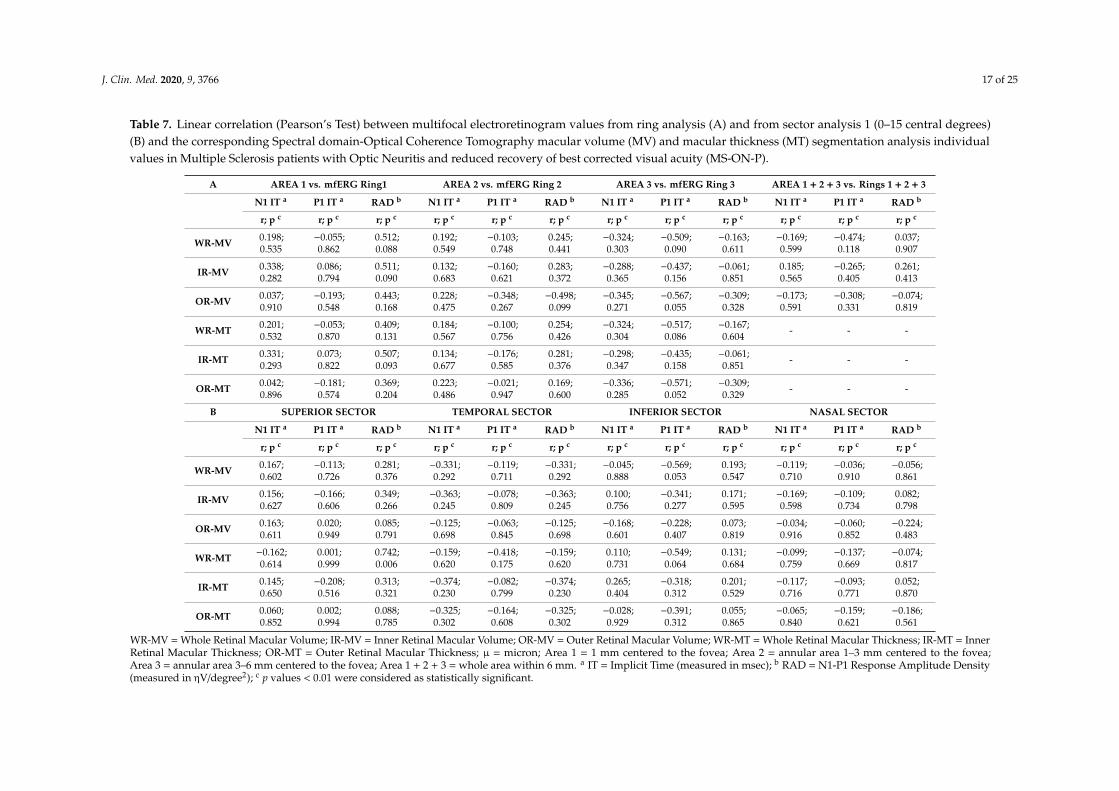
Table 7. Linear correlation (Pearson’s Test) between multifocal electroretinogram values from ring analysis (A) and from sector analysis 1 (0–15 central degrees)(B) and the corresponding Spectral domain-Optical Coherence Tomography macular volume (MV) and macular thickness (MT) segmentation analysis individualvalues in Multiple Sclerosis patients with Optic Neuritis and reduced recovery of best corrected visual acuity (MS-ON-P).
A AREA 1 vs. mfERG Ring1 AREA 2 vs. mfERG Ring 2 AREA 3 vs. mfERG Ring 3 AREA 1 + 2 + 3 vs. Rings 1 + 2 + 3
N1 IT a P1 IT a RAD b N1 IT a P1 IT a RAD b N1 IT a P1 IT a RAD b N1 IT a P1 IT a RAD b
r; p c r; p c r; p c r; p c r; p c r; p c r; p c r; p c r; p c r; p c r; p c r; p c
WR-MV 0.198;0.535
−0.055;0.862
0.512;0.088
0.192;0.549
−0.103;0.748
0.245;0.441
−0.324;0.303
−0.509;0.090
−0.163;0.611
−0.169;0.599
−0.474;0.118
0.037;0.907
IR-MV 0.338;0.282
0.086;0.794
0.511;0.090
0.132;0.683
−0.160;0.621
0.283;0.372
−0.288;0.365
−0.437;0.156
−0.061;0.851
0.185;0.565
−0.265;0.405
0.261;0.413
OR-MV 0.037;0.910
−0.193;0.548
0.443;0.168
0.228;0.475
−0.348;0.267
−0.498;0.099
−0.345;0.271
−0.567;0.055
−0.309;0.328
−0.173;0.591
−0.308;0.331
−0.074;0.819
WR-MT 0.201;0.532
−0.053;0.870
0.409;0.131
0.184;0.567
−0.100;0.756
0.254;0.426
−0.324;0.304
−0.517;0.086
−0.167;0.604 - - -
IR-MT 0.331;0.293
0.073;0.822
0.507;0.093
0.134;0.677
−0.176;0.585
0.281;0.376
−0.298;0.347
−0.435;0.158
−0.061;0.851 - - -
OR-MT 0.042;0.896
−0.181;0.574
0.369;0.204
0.223;0.486
−0.021;0.947
0.169;0.600
−0.336;0.285
−0.571;0.052
−0.309;0.329 - - -
B SUPERIOR SECTOR TEMPORAL SECTOR INFERIOR SECTOR NASAL SECTOR
N1 IT a P1 IT a RAD b N1 IT a P1 IT a RAD b N1 IT a P1 IT a RAD b N1 IT a P1 IT a RAD b
r; p c r; p c r; p c r; p c r; p c r; p c r; p c r; p c r; p c r; p c r; p c r; p c
WR-MV 0.167;0.602
−0.113;0.726
0.281;0.376
−0.331;0.292
−0.119;0.711
−0.331;0.292
−0.045;0.888
−0.569;0.053
0.193;0.547
−0.119;0.710
−0.036;0.910
−0.056;0.861
IR-MV 0.156;0.627
−0.166;0.606
0.349;0.266
−0.363;0.245
−0.078;0.809
−0.363;0.245
0.100;0.756
−0.341;0.277
0.171;0.595
−0.169;0.598
−0.109;0.734
0.082;0.798
OR-MV 0.163;0.611
0.020;0.949
0.085;0.791
−0.125;0.698
−0.063;0.845
−0.125;0.698
−0.168;0.601
−0.228;0.407
0.073;0.819
−0.034;0.916
−0.060;0.852
−0.224;0.483
WR-MT −0.162;0.614
0.001;0.999
0.742;0.006
−0.159;0.620
−0.418;0.175
−0.159;0.620
0.110;0.731
−0.549;0.064
0.131;0.684
−0.099;0.759
−0.137;0.669
−0.074;0.817
IR-MT 0.145;0.650
−0.208;0.516
0.313;0.321
−0.374;0.230
−0.082;0.799
−0.374;0.230
0.265;0.404
−0.318;0.312
0.201;0.529
−0.117;0.716
−0.093;0.771
0.052;0.870
OR-MT 0.060;0.852
0.002;0.994
0.088;0.785
−0.325;0.302
−0.164;0.608
−0.325;0.302
−0.028;0.929
−0.391;0.312
0.055;0.865
−0.065;0.840
−0.159;0.621
−0.186;0.561
WR-MV = Whole Retinal Macular Volume; IR-MV = Inner Retinal Macular Volume; OR-MV = Outer Retinal Macular Volume; WR-MT = Whole Retinal Macular Thickness; IR-MT = InnerRetinal Macular Thickness; OR-MT = Outer Retinal Macular Thickness; µ = micron; Area 1 = 1 mm centered to the fovea; Area 2 = annular area 1–3 mm centered to the fovea;Area 3 = annular area 3–6 mm centered to the fovea; Area 1 + 2 + 3 = whole area within 6 mm. a IT = Implicit Time (measured in msec); b RAD = N1-P1 Response Amplitude Density(measured in ηV/degree2); c p values < 0.01 were considered as statistically significant.
J. Clin. Med. 2020, 9, 3766 18 of 25
When we linearly correlated the mfERG data from Sectors-S1 with the corresponding MV and MTindividual values from S, T, I, N Sectors, we found not significant linear correlations between the S1 ITsand RADs and WR, IR and OR MVs and MTs. The results of these statistical linear correlations arereported in Table 7.
4. Discussion
The purpose of this study was to assess the function of preganglionic elements in MS patients,without and with history of ON, adding information on the debated topic of potential O-MR layersdysfunction, expression of the extension or sparing from neurodegenerative process beyond IMLin MS.
We studied by mfERG the function of O-MR elements located in different areas of the centralmacula (0 to 15 degrees) or more peripheral retina within the arcades (0 to 25 degrees), topographicallydistinguished in rings or sectors. Our results apply to MS Groups with or without ON highlyhomogeneous for age, MS-DD, EDSS, and when present for number of ON and for the time elapsedfrom ON to the BCVA and mfERG assessment, differently from all previous reported studies in theliterature [18,20–22].
In addition, since a morphological impairment of macular OR has been described in MS-ONpatients [20] and in our recent work was confirmed to be detectable exclusively in those MS-ONpatients with poor recovery of BCVA [23], we also evaluated in MS-ON-P patients whether apossible preganglionic macular dysfunction could be associated or not to structural OR changes forcorresponding retinal areas.
Our mfERG findings showed not statistically significant differences of N1 and P1 IT values in allGroups (MS-noON, MS-ON-G and MS-ON-P) in any considered central circular areas (R1, R2, R3) orsectors (S1-S, S1-T, S1-I, S1-N) and more peripheral circular areas (R4, R5) or sectors (S2-S, S2-T, S2-I,S2-N) either when responses were compared to Controls or with MS Groups. As for N1-P1 RAD values,we found statistically significant (p < 0.01) differences in MS-ON-P Group compared to Controls,MS-noON and MS-ON-G only when analyzing responses from Ring 1 (0–5 degrees) and from the S1-Nsector, which covers the 0–15 central degrees area. In all other examined central or peripheral ringsor sectors, we did not find any significant difference in the values of N1-P1 RAD between Groups.Our results indicate that photoreceptors and bipolar cells of the central fovea, as well as of the morecentral nasal macular sector within 15 degrees, are functionally impaired in MS only in occurrence ofON and when full recovery of BCVA is not achieved. These results do not apply either to MS-noONnor MS-ON-G Groups, thus confirming that the preganglionic element dysfunction is independentfrom the event of ON in itself.
As mentioned above, contrasting data are reported in literature about the potential functionalinvolvement of O-MR layers in the MS degenerative process, depending on MS classification, presenceor absence of ON and different mfERG signal analyses. As stated by Hanson et al. [33] “similarities ordifferences between findings in the central and peripheral retina are yet to be definitively elucidated inMS”, and therefore we thought reasonable to study O-MR function in our patients by applying notonly the standard ring analysis, but also the more innovative sector analyses previously used in otherneurodegenerative diseases [30,34].
In MS-noON Group, we found a functional integrity of O-MR elements, in agreement withthe results of a previous mfERG study [22] in which, by using the ring analysis, normal functionof preganglionic elements in eyes without ON and normal high-contrast visual acuity was found.By contrast, our results differ from those by Saidha et al. [20], who found in five MS-noON patientswith an abnormal OCT macular thickness and normal visual acuity, normal mfERG latencies withreduced P1 amplitude. As for the comparison of sector analysis results in MS-noON, Boquete et al. [35]studied, by using a more refined mfERG analysis method, a small cohort of newly diagnosed MSpatients with less than 6 months from their first symptoms and no ON. They found an impairment ofO-MR function exclusively in the supero-temporal quadrant of the macula. In our study, we analyzed
J. Clin. Med. 2020, 9, 3766 19 of 25
the mfERG responses sectioning the central macular region up to 15 degrees (0–15 degrees, sectoranalysis 1) and the whole macular area up to 25 degrees (0–25 degrees, sector analysis 2) in foursectors (superior, temporal, inferior and nasal). By adopting this different way to analyze mfERGsector responses [30,34], we did not find statistically significant differences between Controls andMS-noON. Because the exact protocol used by Boquete e al. [35] could not be replicated in our studysince, as stated by the Authors [35,36], this method is currently only for research purposes and it isnot a commercially available equipment; we could not confirm their data in MS-noON eyes. As forthe “primary retinal pathology” process in MS-noON eyes [20], recalled also by Fairless et al. [37],the presence of neuro-retinitis phenomena could interfere with the results. This point therefore needsto be confirmed by a large study cohort.
In a similar cohort of MS-noON patients, we [23] recently observed an absence of WR and IR MVsreduction, and, differently from Saidha et al. [20], we detected that OR MV and MT values were notsignificantly different from Controls. Taking in account this evidence, our mfERG results may indicatethat in MS-noON patients an absence of outer macular layers’ morphological involvement togetherwith an absence of O-MR dysfunction can be hypothesized.
In the MS-ON-G Group, when measuring mfERG RADs, we also found absence of O-MRdysfunction either by rings or sectors analyses. Our findings diverge from Hanson et al. [18] whoevidenced slight abnormal mfERG responses suggesting inhibitory bipolar cell dysfunction in a mixedcohort of clinically isolated syndrome, primary progressive MS and RR MS eyes, with some cases ofON, and recovery of BCVA. In a very recent study, Filgueiras et al. [21] suggested OR dysfunction basedon the exclusive findings of significant shorter mfERG N1 and P1 implicit times in MS with and withoutON, and concluding that mfERG may help in differentiating MS-ON from “neuro-myelitis optica”spectrum disorder. In agreement with the commentary by Hanson et al. [33], we also considered asquestionable the finding by Filgueiras et al. [21], since “anticipated” N1 and P1 latencies that wereon average 1 msec shorter than Controls, cannot be considered as electrophysiological evidence ofsupernormal bipolar function in MS patients. In addition, in their work, the decision of not includingin the mfERG analysis the R5 areas could have affected latency results. Finally, the Authors [21] didnot correct their p-values for multiple testing, considering the high number of statistical comparisons,thus overestimating the significance of their results.
As for the MS-noON Group, in a similar cohort of MS-ON-G patients, we recently observedsignificantly reduced WR and IR MVs and MTs, with OR values similar to Controls; an extensiveexplanation of these findings was previously discussed [23]. Hence, the presence of mfERG valuessimilar to Controls in this Group, and also considering the previously observed [23] absence of ORmorphological impairment, led us to believe that in MS patients with previous history of ON andgood recovery of BCVA there are structural changes involving IR but not OR, with also normalO-MR function.
In MS-ON-P Group, together with the above-mentioned mfERG changes (reduced R1 and S1-NRADs), we found, in agreement with our previous work [23], a significant reduction of WR, IR and ORMVs and MTs as compared to Controls. The interpretation of these morphological findings was givenelsewhere [23].
These observed reduced R1 RAD values let us consider that when BCVA recovery after ON ispoor, the wiring of retinal circuitry in the fovea, where the cones and the RGCs have the highestdensity [36,38], can be severely impaired. This foveal dysfunction was not significantly correlated withthe reduction of OR MV and MT values in the central Area 1 and this might suggest that the O-MRdysfunction is associated but not linearly correlated to the OR morphological involvement. In addition,since not significant correlations between the reduced R1 RADs and the reduction of IR MV and MTvalues in the central Area 1 were found, it could be hypothesized that the morphological involvementof the inner macular layers does not influence the function of the O-MR layers.
J. Clin. Med. 2020, 9, 3766 20 of 25
All these findings could have different explanations. First, the absence of a perfect anatomicaloverlapping between the stratified measurements by mfERG and Sd-OCT assessments. For instance,when segmenting IR and OR layers, our RTVue-100 device software automatically divides the innerand outer neurosensory retinas at the boundary between the inner nuclear layer (INL) and the outerplexiform layer (OPL). The OR encloses the OPL, the outer nuclear layer, and the photoreceptor layer.The IR examines the retinal nerve fiber layer (RNFL), the ganglion cells/inner plexiform layer (GC/IPL),and the INL. On the other hand, the mfERG system allows us to record the bioelectrical activity drivenmainly by cones and bipolar cells, specifically mfERG response amplitude values are more correlatedwith photoreceptors activity whereas peak timing is more associated with the contribution to thesignal by bipolar cells [39]. Thus, it could be that as the nuclei of the bipolar cells located into theINL (enclosed in our IR segmentation analysis and resulted reduced) and the relative bioelectricalactivity is mainly represented by the mfERG ITs (resulted similar to Controls), there is a not perfectcolocalization between the structural and functional tests of the same elements. This could explainthe absence of correlation between reduced RADs and reduced OR MV and MT values, as well asthe absence of correlation between normal P1 ITs and reduced IR MV and MT values in MS-ON-Ppatients. A second explanation could be related to the sample of MS-ON-P patients enrolled in thepresent study. We enrolled a high homogeneous number of 20 patients with MS-ON and poor recoveryof visual acuity. Eventually, results from a larger cohort of patients may give different results anddifferent correlations between morpho-functional parameters.
By contrast, since in the more peripheral areas (Area 2 and Area 3) we detected normal mfERGresponses (ITs and RADs), but reduced WR, IR and OR MVs and MTs, it should be hypothesized thatthis morphological involvement is not sufficient to induce functional changes, as suggested by the lackof correlation between mfERG and Sd-OCT data, as reported in Table 7.
In these patients, the observed macular functional changes were not significantly related withthe reduced BCVA, as well as we recently reported [23] that the reduced recovery of BCVA is alsoindependent from the morphological condition of the outer macular layers but is correlated with themorphological impairment of the inner macular layers.
Our findings of abnormal mfERG responses specifically in the S1 nasal sector links withBoquete et al. [35] findings (reduced first order kernel RADs in the temporal sectors for their righteyes). The Authors specified that the papillo-macular bundle could be affected earlier in the diseaseprocess also in absence of ON, and that this concurs with early Sd-OCT RNFL reduction in the thickesttemporal sector in MS [40], as also seen in other neurodegenerative disorders like glaucoma [41],Parkinson’s [42] and Alzheimer’s [43] diseases.
Moreover, all sectorial WR, IR and OR MVs and MTs in MS-ON-P eyes were significantly reducedas compared to Controls. To our knowledge, no previous reports described similar investigations onSd-OCT macular sectors. These morphological findings can suggest that in MS-ON-P eyes there is nota prevalent structural involvement of one macular sector with respect to others.
Nevertheless, this morphological impairment cannot influence the functional condition of the S,T and I sectors (that was not significantly different from Controls), as suggested by the lack of correlationbetween mfERG and Sd-OCT data (see Table 7). In addition, although a morphological impairment ofMV and MT and a dysfunction of O-MR layers in the nasal sector were found, the absence of correlation(see Table 7) might suggest that the morphological and functional conditions are independent.
The biological mechanisms underlying the reduction of RADs in our selected group of MS-ON-P,with no previous or present signs of retinal inflammation, can only be hypothesized.
One hypothesis is that in a sub-set of MS-ON patients, a dysfunction of photoreceptors andinhibitory bipolar cells (leading to reduced mfERG RADs) is due to trans-synaptic retrogradedegeneration distal to IML. Indeed, the injury that involves the IML (detectable by reduced P-ERGresponses [4–6]) could extend more deeply, impairing outer retinal function. This hypothesis, however,on one side is not confirmed by animal studies on the retinal changes after optic nerve transection.In fact, Hollander et al. showed that only the IML are impaired at the light and electron microscopy after
J. Clin. Med. 2020, 9, 3766 21 of 25
optic nerve damage [44]. On the other hand, a full body of evidence in humans supports the fact thattrans-synaptic degeneration affects the dorsal lateral geniculate nucleus, but stops at the INL, where thebipolars reside, acting as a potential physiological protective barrier against neurodegeneration [45].This prominent role of INL is also justified by the occurrence of dynamic and transient phenomena,also in absence of ON, as the microcystic inner retina edema often seen in MS [46,47]. At this level,the homoeostasis of the bipolar system becomes crucial for neurodegeneration processes in MS.Our evidence might suggest that when there is a poor recovery of visual acuity after an ON event,an unbalanced function of the bipolar cells system may occur and this can be detected by recording areduction in amplitude of mfERG responses.
A second hypothesis that can explain the reduction of mfERG RADs in MS-ON-P patients is aprocess related to autoimmunity. For instance, in some MS patients with autoantibodies against theretinal protein α-enolase, a reduction of ERG responses has been found [48]. In addition, in validatedMS mouse models of ON, it has been reported early altered synaptic vesicle cycling in ribbon synapses,located between outer and inner retinal layers, which are likely targeted by an auto-reactive immunesystem process [49]. Two adhesion proteins (CASPR1/CNTN1) [50], present at the level of both theparanodal region of myelinated nerves as well as at retinal ribbon synapses [49], could be the specifictargets of the auto-immune response in experimental animal models.
Of course, all previous electrophysiological studies done by recording Ff-ERG or flicker ERG in MSeyes, and almost unanimously finding subnormal cone-driven bipolar cell function [16,22,51], are notcomparable to our mfERG findings. This is based on the knowledge that mfERG responses are derivedfrom cells localized into the central retina (in our study within the 25 central retinal degrees) [51],whereas Ff-ERG or flicker ERG responses are generated by the preganglionic elements of the wholeretina [9].
5. Conclusions
In conclusion, in our study we detected an absence of mfERG abnormalities in MS patientswithout and with ON followed by full recovery of BCVA. Thus, our results suggest that in MS thefunction of preganglionic elements located in the O-MR layers is not modified by the occurrenceof ON itself. By contrast, the MS neurodegenerative processes could induce a dysfunction of thepreganglionic elements of the fovea and the retinal nasal sector after an event of ON followed bypermanent impairment of visual acuity (poor recovery of BCVA after ON). This functional impairmentwas associated, but not correlated, with OR and IR structural changes. In order to better understandthe role of middle retinal elements in this process, further studies on both experimental [37,48] andclinical sides [20,44] are needed.
Author Contributions: Conceptualization, L.Z., V.P. and D.C.; methodology, L.B. (Lucilla Barbano), V.P.; software,V.P.; validation, L.Z., V.P., B.F., A.G. and D.C.; formal analysis, G.A.M., D.L., C.G.N., L.B. (Lucilla Barbano) and V.P.;investigation, L.Z., V.P., L.B. (Lucilla Barbano), L.B. (Laura Boffa) and M.A.; resources, V.P., and D.C.; data curation,L.Z.; writing—original draft preparation, L.Z., V.P. and L.B. (Lucilla Barbano); writing—review and editing, L.Z.,V.P., B.F. and D.C.; visualization, D.C., and A.G.; supervision, V.P.; project administration, V.P.; funding acquisition,none. All authors have read and agreed to the published version of the manuscript.
Funding: This research received no external funding.
Acknowledgments: The contribution of Fondazione Bietti in this paper was supported by the Ministry of Healthand Fondazione Roma. Authors acknowledge Maria Luisa Alessi for technical help in electrophysiologicalrecordings and Federica Petrocchi for executing psychophysical measurements.
Conflicts of Interest: The authors declare no conflict of interest. The funders had no role in the design of thestudy; in the collection, analyses, or interpretation of data; in the writing of the manuscript, or in the decision topublish the results.

J. Clin. Med. 2020, 9, 3766 22 of 25
Abbreviations
MS multiple sclerosisON optic neuritisMS-noON multiple sclerosis patients without optic neuritis
MS-ON-Gmultiple sclerosis patients with optic neuritis followed by good recovery of best correctedvisual acuity
MS-ON-Pmultiple sclerosis patients with optic neuritis followed by poor recovery of best correctedvisual acuity
BCVA best corrected visual acuityMfERG multifocal electroretinogramIT implicit timeRAD response amplitude densityP-ERG pattern electroretinogramFf-ERG Full-field electroretinogramF-ERG focal electroretinogramIML innermost retinal layersO-MR outer and in middle retinalSD one standard deviation of the meanN number of eyes of each groupA one-way analysis of varianceMV macular volumeMT macular thicknessWR whole retinaIR inner retinaOR outer retinaS-S sector-superiorS-T sector-temporalS-I sector-inferiorS-N sector -nasal
References
1. Miller, D.; Barkhof, F.; Montalban, X.; Thompson, A.; Filippi, M. Clinically isolated syndromes suggestive ofmultiple sclerosis, part 2: Non-conventional MRI, recovery processes, and management. Lancet Neurol. 2005,4, 341–348. [CrossRef]
2. Dinkin, M. Trans-synaptic Retrograde Degeneration in the Human Visual System: Slow, Silent, and Real.Curr. Neurol. Neurosci. Rep. 2017, 17, 16. [CrossRef] [PubMed]
3. Britze, J.; Pihl-Jensen, G.; Frederiksen, J.L. Retinal ganglion cell analysis in multiple sclerosis and opticneuritis: A systematic review and meta-analysis. J. Neurol. 2017, 264, 1837–1853. [CrossRef] [PubMed]
4. Janáky, M.; Jánossy, Á.; Horváth, G.; Benedek, G.; Braunitzer, G. VEP and PERG in patients with multiplesclerosis, with and without a history of optic neuritis. Doc. Ophthalmol. 2017, 134, 185–193. [CrossRef]
5. Parisi, V.; Manni, G.; Spadaro, M.; Colacino, G.; Restuccia, R.; Marchi, S.; Bucci, M.G.; Pierelli, F. Correlationbetween morphological and functional retinal impairment in multiple sclerosis patients. Investig. Ophthalmol.Vis. Sci. 1999, 40, 2520–2527.
6. Trip, S.A.; Schlottmann, P.G.; Jones, S.J.; Altmann, D.R.; Garway-Heath, D.F.; Thompson, A.J.; Plant, G.T.;Miller, D.H. Retinal nerve fiber layer axonal loss and visual dysfunction in optic neuritis. Ann. Neurol. 2005,58, 383–391. [CrossRef]
7. Monsalve, P. Decoding PERG: A neuro-ophthalmic retinal ganglion cell function review. Curr. Ophthalmol. Rep.2019, 7, 51–58. [CrossRef]
8. Robson, A.G.; Nilsson, J.; Li, S.; Jalali, S.; Fulton, A.B.; Tormene, A.P.; Holder, G.E.; Brodie, S.E. ISCEV guideto visual electrodiagnostic procedures. Doc. Ophthalmol. 2018, 136, 1–26. [CrossRef]
9. McCulloch, D.L.; Marmor, M.F.; Brigell, M.G.; Hamilton, R.; Holder, G.E.; Tzekov, R.; Bach, M. ISCEVStandard for full-field clinical electroretinography (2015 update). Doc. Ophthalmol. 2015, 130, 1–12. [CrossRef]
J. Clin. Med. 2020, 9, 3766 23 of 25
10. Parisi, V.; Falsini, B. Electrophysiological evaluation of the macular cone system: Focal electroretinographyand visual evoked potentials after photostress. Semin. Ophthalmol. 1998, 13, 178–188. [CrossRef]
11. Hood, D.C.; Bach, M.; Brigell, M.; Keating, D.; Kondo, M.; Lyons, J.S.; Marmor, M.F.; McCulloch, D.F.;Palmowski-Wolfe, A.M. International Society For Clinical Electrophysiology of Vision. ISCEV standard forclinical multifocal electroretinography (mfERG) (2011 edition). Doc. Ophthalmol. 2012, 124, 1–13. [CrossRef][PubMed]
12. Bearse, M.A., Jr.; Sutter, E.E. Imaging localized retinal dysfunction with the multifocal electroretinogram.J. Opt. Soc. Am. A Opt. Image Sci. Vis. 1996, 13, 634–640. [CrossRef] [PubMed]
13. Hood, D.C. Assessing retinal function with the multifocal technique. Prog. Retin. Eye Res. 2000, 19, 607–646.[CrossRef]
14. Parisi, V.; Ziccardi, L.; Stifano, G.; Montrone, L.; Gallinaro, G.; Falsini, B. Impact of regional retinal responseson cortical visually evoked responses: Multifocal ERGs and VEPs in the retinitis pigmentosa model.Clin. Neurophysiol. 2010, 121, 380–385. [CrossRef] [PubMed]
15. Papakostopoulos, D.; Fotiou, F.; Hart, J.C.; Banerji, N.K. The electroretinogram in multiple sclerosis anddemyelinating optic neuritis. Electroencephalogr. Clin. Neurophysiol. 1989, 74, 1–10. [CrossRef]
16. Hamurcu, M.; Orhan, G.; Sarıcaoglu, M.S.; Mungan, S.; Duru, Z. Analysis of multiple sclerosis patients withelectrophysiological and structural tests. Int. Ophthalmol. 2017, 37, 649–653. [CrossRef]
17. Forooghian, F.; Sproule, M.; Westall, C.; Gordon, L.; Jirawuthiworavong, G.; Shimazaki, K.; O’Connor, P.Electroretinographic abnormalities in multiple sclerosis: Possible role for retinal autoantibodies.Doc. Ophthalmol. 2006, 113, 123–132. [CrossRef]
18. Hanson, J.V.M.; Hediger, M.; Manogaran, P.; Landau, K.; Hagenbuch, N.; Schippling, S.; Gerth-Kahlert, C.Outer Retinal Dysfunction in the Absence of Structural Abnormalities in Multiple Sclerosis.Investig. Ophthalmol. Vis. Sci. 2018, 59, 549–560. [CrossRef]
19. Falsini, B.; Bardocci, A.; Porciatti, V.; Bolzani, R.; Piccardi, M. Macular dysfunction in multiple sclerosisrevealed by steady-state flicker and pattern ERGs. Electroencephalogr. Clin. Neurophysiol. 1992, 82, 53–59.[CrossRef]
20. Saidha, S.; Syc, S.B.; Ibrahim, M.A.; Eckstein, C.; Warner, C.V.; Farrell, S.K.; Oakley, J.D.; Durbin, M.K.;Meyer, S.A.; Balcer, L.J.; et al. Primary retinal pathology in multiple sclerosis as detected by optical coherencetomography. Brain 2011, 134, 518–533. [CrossRef]
21. Filgueiras, T.G.; Oyamada, M.K.; Preti, R.C.; Apóstolos-Pereira, S.L.; Callegaro, D.; Monteiro, M.L.R.Outer Retinal Dysfunction on Multifocal Electroretinography May Help Differentiating Multiple SclerosisFrom Neuromyelitis Optica Spectrum Disorder. Front. Neurol. 2019, 10, 928. [CrossRef] [PubMed]
22. Gundogan, F.C.; Demirkaya, S.; Sobaci, G. Is optical coherence tomography really a new biomarker candidatein multiple sclerosis?-A structural and functional evaluation. Investig. Ophthalmol. Vis. Sci. 2007, 48,5773–5781. [CrossRef] [PubMed]
23. ZiccardI, L.; Barbano, L.; Boffa, L.; Albanese, M.; Grzybowski, A.; Centonze, D.; Parisi, V. MorphologicalOuter Retina Findings in Multiple Sclerosis Patients With or Without Optic Neuritis. Front. Neurol. 2020,11, 858. [CrossRef] [PubMed]
24. Polman, C.H.; Reingold, S.C.; Banwell, B.; Clanet, M.; Cohen, J.A.; Filippi, M.; Fujihara, K.; Havrdova, E.;Hutchinson, M.; Kappos, L.; et al. Diagnostic criteria for multiple sclerosis: 2010 revisions to the McDonaldcriteria. Ann. Neurol. 2011, 69, 292–302. [CrossRef] [PubMed]
25. Kurtzke, J.F. Rating neurologic impairment in multiple sclerosis: An Expanded Disability Status Scale (EDSS).Neurology 1983, 33, 1444–1452. [CrossRef] [PubMed]
26. Neurostatus.net. Available online: http://www.neurostatus.net/index.php?file=start (accessed on 6 July 2020).27. Williams, U.E.; Oparah, S.K.; Philip-Ephraim, E.E. Disease Modifying Therapy in Multiple Sclerosis. Int. Sch.
Res. Not. 2014, 2014, 307064. [CrossRef]28. Huang-Link, Y.M.; Al-Hawasi, A.; Lindehammar, H. Acute optic neuritis: Retinal ganglion cell loss precedes
retinal nerve fiber thinning. Neurol. Sci. 2015, 36, 617–620. [CrossRef]29. Parisi, V.; Ziccardi, L.; Sadun, F.; De Negri, A.M.; La Morgia, C.; Barbano, L.; Carelli, V.; Barboni, P. Functional
Changes of Retinal Ganglion Cells and Visual Pathways in Patients with Chronic Leber’s Hereditary OpticNeuropathy during One Year of Follow-up. Ophthalmology 2019, 126, 1033–1044. [CrossRef]
J. Clin. Med. 2020, 9, 3766 24 of 25
30. Cascavilla, M.L.; Parisi, V.; Triolo, G.; Ziccardi, L.; Borrelli, E.; Di Renzo, A.; Balducci, N.; Lamperti, C.;Bianchi Marzoli, S.; Darvizeh, F.; et al. Retinal dysfunction characterizes subtypes of dominant optic atrophy.Acta Ophthalmol. 2018, 96, e156–e163. [CrossRef]
31. Parisi, V.; Ziccardi, L.; Centofanti, M.; Tanga, L.; Gallinaro, G.; Falsini, B.; Bucci, M.G. Macular function ineyes with open-angle glaucoma evaluated by multifocal electroretinogram. Investig. Ophthalmol. Vis. Sci.2012, 53, 6973–6980. [CrossRef]
32. Curcio, C.A.; Sloan, K.R.; Kalina, R.E.; Hendrickson, A.E. Human photoreceptor topography. J. Comp. Neurol.1990, 292, 497–523. [CrossRef] [PubMed]
33. Hanson, J.V.M.; Schippling, S.; Gerth-Kahlert, C. Commentary: Outer retinal dysfunction on multifocalelectroretinography may help differentiating multiple sclerosis from neuromyelitis optica spectrum disorder.Front. Neurol. 2020, 11, 282. [CrossRef] [PubMed]
34. Ziccardi, L.; Parisi, V.; Picconi, F.; Di Renzo, A.; Lombardo, M.; Frontoni, S.; Parravano, M. Early andlocalized retinal dysfunction in patients with type 1 diabetes mellitus studied by multifocal electroretinogram.Acta Diabetol. 2018, 55, 1191–1200. [CrossRef] [PubMed]
35. Boquete, L.; López-Guillén, E.; Vilades, E.; Miguel-Jiménez, J.M.; Pablo, L.E.; De Santiago, L.;Ortiz Del Castillo, M.; Alonso-Rodríguez, M.C.; Sánchez Morla, E.M.; López-Dorado, A.; et al. Diagnosticability of multifocal electroretinogram in early multiple sclerosis using a new signal analysis method.PLoS ONE 2019, 14, e0224500. [CrossRef] [PubMed]
36. Verdon, W.A.; Haegerstrom-Portnoy, G. Topography of the multifocal electroretinogram. Doc. Ophthalmol.1998, 95, 73–90. [CrossRef] [PubMed]
37. Fairless, R.; Williams, S.K.; Hoffmann, D.B.; Stojic, A.; Hochmeister, S.; Schmitz, F.; Storch, M.K.; Diem, R.Preclinical retinal neurodegeneration in a model of multiple sclerosis. J. Neurosci. 2012, 32, 5585–5597.[CrossRef]
38. McGregor, J.E.; Yin, L.; Yang, Q.; Godat, T.; Huynh, K.T.; Zhang, G.; Williams, D.G.; Merigan, W.H. Functionalarchitecture of the foveola revealed in the living primate. PLoS ONE 2018, 13, e0207102. [CrossRef]
39. Hood, D.C.; Frishman, L.J.; Saszik, S.; Viswanathan, S. Retinal origins of the primate multifocal ERG:Implications for the human response. Investig. Ophthalmol. Vis. Sci. 2002, 43, 1673–1685.
40. Garcia-Martin, E.; Pueyo, V.; Almarcegui, C.; Martin, J.; Ara, J.R.; Sancho, E.; Pablo, L.E.; Dolz, I.; Fernandez, J.Risk factors for progressive axonal degeneration of the retinal nerve fibre layer in multiple sclerosis patients.Br. J. Ophthalmol. 2011, 95, 1577–1582. [CrossRef]
41. Mousa, M.F.; Cubbidge, R.P.; Al-Mansouri, F.; Bener, A. Evaluation of hemifield sector analysis protocol inmultifocal visual evoked potential objective perimetry for the diagnosis and early detection of glaucomatousfield defects. Korean J. Ophthalmol. 2014, 28, 49–65. [CrossRef]
42. Satue, M.; Obis, J.; Alarcia, R.; Orduna, E.; Rodrigo, M.J.; Vilades, E.; Gracia, H.; Otin, S.; Fuertes, M.I.;Polo, V.; et al. Retinal and Choroidal Changes in Patients with Parkinson’s Disease Detected by Swept-SourceOptical Coherence Tomography. Curr. Eye Res. 2018, 43, 109–115. [CrossRef] [PubMed]
43. Polo, V.; Garcia-Martin, E.; Bambo, M.P.; Pinilla, J.; Larrosa, J.M.; Satue, M.; Otin, S.; Pablo, L.E. Reliability andvalidity of Cirrus and Spectralis optical coherence tomography for detecting retinal atrophy in Alzheimer’sdisease. Eye (Lond.) 2014, 28, 680–690. [CrossRef] [PubMed]
44. Hollander, H.; Bisti, S.; Maffei, L.; Hebel, R. Electroretinographic responses and retrograde changes of retinalmorphology after intracranial optic nerve section. Exp. Brian Res. 1984, 55, 483–494.
45. Petzold, A.; Balcer, L.J.; Calabresi, P.A.; Costello, F.; Frohman, T.C.; Frohman, E.M.; Martinez-Lapiscina, E.H.;Green, A.J.; Kardon, R.; Outteryck, O.; et al. Retinal layer segmentation in multiple sclerosis: A systematicreview and meta-analysis. Lancet Neurol. 2017, 16, 797–812. [CrossRef]
46. Saidha, S.; Sotirchos, E.S.; Ibrahim, M.A.; Crainiceanu, C.M.; Gelfand, J.M.; Sepah, Y.J.; Ratchford, J.N.; Oh, J.;Seigo, M.A.; Newsome, S.D.; et al. Microcystic macular oedema, thickness of the inner nuclear layer ofthe retina, and disease characteristics in multiple sclerosis: A retrospective study. Lancet Neurol. 2012, 11,963–972. [CrossRef]
47. Gelfand, J.M.; Nolan, R.; Schwartz, D.M.; Graves, J.; Green, A.J. Microcystic macular oedema in multiplesclerosis is associated with disease severity. Brain 2012, 135, 1786–1793. [CrossRef]
48. Gorczyca, W.A.; Ejma, M.; Witkowska, D.; Misiuk-Hojło, M.; Kuropatwa, M.; Mulak, M.; Szymaniec, S. Retinalantigens are recognized by antibodies present in sera of patients with multiple sclerosis. Ophthalmic Res.2004, 36, 120–123. [CrossRef]

J. Clin. Med. 2020, 9, 3766 25 of 25
49. Dembla, M.; Kesharwani, A.; Natarajan, S.; Fecher-Trost, C.; Fairless, R.; Williams, S.K.; Flockerzi, V.; Diem, R.;Schwarz, K.; Schmitz, F. Early auto-immune targeting of photoreceptor ribbon synapses in mouse models ofmultiple sclerosis. EMBO Mol. Med. 2018, 10, e8926. [CrossRef]
50. Stathopoulos, P.; Alexopoulos, H.; Dalakas, M.C. Autoimmune antigenic targets at the node of Ranvier indemyelinating disorders. Nat. Rev. Neurol. 2015, 11, 143–156. [CrossRef]
51. Hood, D.C.; Seiple, W.; Holopigian, K.; Greenstein, V. A comparison of the components of the multifocal andfull-field ERGs. Vis. Neurosci. 1997, 14, 533–544. [CrossRef]
Publisher’s Note: MDPI stays neutral with regard to jurisdictional claims in published maps and institutionalaffiliations.
© 2020 by the authors. Licensee MDPI, Basel, Switzerland. This article is an open accessarticle distributed under the terms and conditions of the Creative Commons Attribution(CC BY) license (http://creativecommons.org/licenses/by/4.0/).