Embed Size (px)
Citation preview

FUNDFACT SHEETSEPTEMBER 2018
Invest inDHFL PramericaLong Term Equity Fund(An Open Ended Equity Linked Savings Scheme with a statutory lock-in of 3 years and tax benefit)
• Save tax upto Rs.46,350#
• Grow wealth
• Live your dreams
Mutual Fund investments are subject to market risks, read all scheme related documents carefully. #As per the present tax laws, eligible investors (individual/ HUF) are entitled to deduction from their gross total income, of the amount invested in equity linked saving scheme (ELSS) upto Rs. 1,50,000/- (along with other prescribed investments) under Section 80C of the Income Tax Act, 1961. Tax savings of Rs. 46,350/- shown above is calculated for the highest income tax slab. Long term capital gain and dividend distribution tax as applicable. Tax benefits are subject to the provisions of the Income Tax Act, 1961 and are subject to amendments, from time to time. Pramerica is a trade name used by Prudential Financial, Inc., (PFI) a company incorporated and with its principal place of business in the United States, and by its affiliated companies in select countries outside the United States. None of these companies are affiliated in any manner with Prudential plc, a company incorporated in the United Kingdom.
Income tax nahin,income from tax.
Moderately High – Investors understand that their principal will be at moderately high risk
This product is suitable for investors who are seeking*:
• Long-term capital appreciation
• To generate long-term capital appreciation by predominantly investing in equity & equity related instruments and to enable eligible investors to avail deduction from total income, as permitted under the Income Tax Act, 1961 as amended from time to time.
• Degree of risk – MODERATELY HIGH
*Investors should consult their financial advisers if in doubt about whether the product is suitable for them.

IndexPage No.
From the CEO’s desk 3Market Review 4Snapshot of Equity Funds Reckoner 5DHFL Pramerica Large Cap Fund (Large Cap Fund - An open ended equity scheme predominantly investing in large cap stocks)
7
DHFL Pramerica Diversified Equity Fund (Multi Cap Fund - An open ended equity scheme investing across large cap, mid cap, small cap stocks)
8
DHFL Pramerica Midcap Opportunities Fund (Mid Cap Fund- An open ended equity scheme predominantly investing in mid cap stocks)
9
DHFL Pramerica Long Term Equity Fund (An Open Ended Equity Linked Savings Scheme with a statutory lock-in of 3 years and tax benefit)
10
DHFL Pramerica Hybrid Equity Fund (Formerly known as DHFL Pramerica Balanced Advantage Fund) (An open ended hybrid scheme investing predominantly in equity and equity related instruments)
11
DHFL Pramerica Euro Equity Fund (An open ended fund of fund scheme investing in UBI SICAV Euro Equity)
12
DHFL Pramerica Global Agribusiness Offshore Fund (An open ended fund of fund scheme investing in Deutsche Invest I Global Agribusiness)
13
DHFL Pramerica Arbitrage Fund (An open ended scheme investing in arbitrage opportunities)
14
DHFL Pramerica Equity Savings Fund (Formerly known as DHFL Pramerica Equity Income Fund)(An Open Ended Scheme investing in equity, arbitrage and debt)
15
Snapshot of Debt Funds Reckoner 16DHFL Pramerica Hybrid Debt Fund (Formerly known as DHFL Pramerica Income Advantage Fund)(An Open Ended Hybrid Scheme investing predominantly in debt instruments)
18
DHFL Pramerica Insta Cash Fund (Formerly known as Insta Cash Plus Fund)(An Open Ended Liquid Scheme)
19
DHFL Pramerica Ultra Short Term Fund (An open ended ultra-short term debt scheme investing in instruments such that the Macaulay duration of the portfolio is between 3 months to 6 months)
20
DHFL Pramerica Low Duration Fund (An open ended low duration debt scheme investing in instruments such that the Macaulay duration of the portfolio is between 6 months to 12 months)
21
DHFL Pramerica Floating Rate Fund (Formerly known as DHFL Pramerica Short Term Floating Rate Fund) (An open ended debt scheme predominantly investing in floating rate instruments (including fixed rate instruments converted to floating rate exposures using swaps/ derivatives))
22
DHFL Pramerica Short Maturity Fund (An open ended short term debt scheme investing in instruments such that the Macaulay duration of the portfolio is between 1 year to 3 years)
23
DHFL Pramerica Banking and PSU Debt Fund (An open ended debt scheme predominantly investing in Debt instruments of banks, Public Sector Undertakings, Public Financial Institutions and Municipal Bonds)
24
DHFL Pramerica Credit Risk Fund (Formerly known as DHFL Pramerica Credit Opportunities Fund)(An open ended debt scheme predominantly investing in AA and below rated corporate bonds (excluding AA+ rated corporate bonds))
25
DHFL Pramerica Dynamic Bond Fund (An open ended dynamic debt scheme investing across duration)
26
DHFL Pramerica Medium Term Fund (Formerly known as DHFL Pramerica Medium Term Income Fund)(An open ended medium term debt scheme investing in instruments such that the Macaulay duration of the portfolio is between 3 years to 4 years)
27
DHFL Pramerica Premier Bond Fund (An open ended debt scheme predominantly investing in AA+ and above rated corporate bonds)
28
DHFL Pramerica Gilt Fund (An open ended debt scheme investing in government securities across maturities)
29
DHFL Pramerica Strategic Debt Fund (Formerly known as DHFL Pramerica Inflation Indexed Bond Fund) (An open ended medium term debt scheme investing in instruments such that the Macaulay duration of the portfolio is between 4 years to 7 years)
30
Performance of Other Funds 31SIP Performance 32How to read the Factsheet 33

3
NBFC/HFCs a segment that was the darling of this bull run witnessed large scale selling in the month of September. People are buying cars/ electronic goods/ two wheelers and houses on EMI, so what has changed for the Non Banking Finance Companies (NBFCs) and Housing Finance Companies (HFCs)? Over the years a business case was built for NBFCs/HFCs on the back of low penetration of banking. The segment saw good growth leading to them commanding good valuations with assumptions of high growth built in. Rising rates have changed some assumptions of the equation. So what does it look like for the NBFC/HFC segment going forward ?
Business fundamentals :
The worsening macro situation and rising oil prices have steadily pushed up interest rates by ~150 basis points over the last 1 year. The NBFC/ HFC segment relies on wholesale funding that is short term in nature. Lending on the other hand is longer term in nature in most cases. Borrowing rates have gone up, while there is limitation on raising lending rates owing to:
1. Competition from the banks. Having suffered on corporate lending side banks have shifted focus to retail lending. Today, SBI is a market leader in auto loans and home loans.
2. Competition from a large number of players in the segment. For e.g home loan market today has 95 HFCs vying for market share.
This is likely to put pressure on profitability. The other factors that can create headwinds will be 1. Defaults on the lending book 2. Lower levels of liquidity for the segment, challenging the fundamental assumptions.
Most of the players in the segment have witnessed anywhere between 35-55% correction from their 52 week high. In our understanding the pain would last longer and it may not be the most appropriate time to catch falling knives. In our assessment they may not lead the next round of the rally. Investors are likely to favour banks, some select non PCA PSU banks and especially corporate lenders with retail liability books and ability to raise rates. In our equity portfolios we have been extremely underweight on NBFCs/HFCs across MF schemes and PMS offerings. Our exposures have been in the range of 0-6% on MF side and zero on the PMS side.
On the fixed income side our NBFC/HFC exposure is concentrated with large players and we remain comfortable with their credit profile.
So is it all gloom and doom ? No. NBFCs and HFCs will have a role to play and hence stronger players will continue to exist even through the cycle. Bond yields or the borrowing cost in the short term is influenced like most other market instruments by demand-supply and liquidity factors. In the long run, fundamentals of the issuer will however be more important and determine the credit spreads incorporating multiple aspects such as rating, tenor, supply risk, market holding and so on. Relatively higher rated corporates in the financial services space including HFCs and NBFCs in our view may have to offer some additional rates on borrowings in the coming days given the liquidity tightening scenario. However in our view, they will see through the rough cycle.
HFCs in particular are relatively superior business models given the granular nature of their assets in contrast to infra companies which give out wholesale and bulky loans. Besides, given the EMI nature of bulk of the loans given out by HFCs, there is natural liquidity for such companies by way of regular loan repayments on a monthly basis. In addition, a large part of the loan portfolio for most HFCs qualify for priority sector. Hence such loans can be readily monetised by way of sell-downs at very attractive rates to banks who need priority sector assets.
From the broader equity market perspective, there are enough opportunities even today for wealth creation with high ROEs, low debt to equity and quality managements. Investors should stick to asset allocation with quality portfolios though the ride could be volatile. PLEASE DO NOT STOP SIPs.
Fixed income call, continues to be to stay invested at the short end from a risk reward perspective.
Is it all gloom and doom for NBFCs and HFCs?
Rajesh IyerChief Executive Officer
From the CEO’s desk

4
Source: RBI & Bloomberg
The views of the Fund Manager should not be construed as an advice and investors must make their own investment decisions regarding investment/disinvestment in securities market and/or suitability of the funds based on their specific investment objectives and financial positions and using such independent advisors as they believe necessary. None of the information contained in this document shall be constituted as a recommendation to buy or sell any particular security. Mutual Fund investments are subject to market risks, read all scheme related documents carefully.
Equity Market
Debt Market
Market Review Details as on September 28, 2018
The market that wasIndian equities saw a weak month in September (-6%) against the backdrop of worries around liquidity tightness in the credit markets, negative news flow in the financials space, construction ban early in the month, continued macro pressures and rupee depreciation. The fall was even more precipitous in mid-caps and small caps with their representative indices falling 14% and 20% respectively
during the month. In terms of stock performance, most of the sectors were in the red with the exception of IT services.
On the macro front, July IIP grew at 6.6% vs 7% in June. Aug CPI inflation moderated to 10-mth low of 3.7% (but core inflation was still high at 5.9%). IMD had forecasted normal monsoon at start of the year which has fallen short by 9% with uneven geographical distribution. Crude in dollar terms was up 6.6% in September, INR depreciated 2.1% while India's 10 year yields closed above 8% at September end.
Current account deficit came at a 5-year high of 2.4% vs 1.9% in Mar’18. By the end of the financial year, it is expected to touch 2.8%.
FII were net sellers in Sep with outflows of $1.3bn with YTD total of $2bn outflows. DIIs buying picked up after 3 months of declines with $1.7bn inflows led primarily by mutual
E.A. SundaramCIO - Equity
Macro ReviewContinuing from the previous month, CPI moderated further to 3.7% for the month of August (4.17% in July) on the back of benign food inflation. Core inflation also moderated a bit but remains on the higher side at 5.9% (as against 6.29% in July). Even as Crude oil prices have started moving higher, the pass through effect on fuel inflation has remained contained so far.
Sequentially food inflation is moving up recording 1.43 % month over month momentum as against 0.94% in June.
Nevertheless, the momentum is lower than should be expected at this time of the year, given seasonality arising from monsoon and weather conditions. Veggies moved higher for the third straight month while Pulses also inched higher, though for the first time since September last year.
Fuel inflation also moved higher largely led by revisions to LPG and Kerosene, even as Petrol and Diesel saw some downward price revisions on the back of softening in global crude levels.
Liquidity and RatesThe month started on a slightly positive note on liquidity. However with the second instalment of advance tax payments mid month and GST outflows towards the third week, the system slipped into a negative position. For the month the daily average was approximately negative by 45,000 crores. Keeping in view the persistence of the deficit and the advent of the festive and busy season starting October, the RBI released an OMO schedule for October which envisages buy back of Govt bonds aggregating INR 36,000 crores.
The sovereign yield curve showed an upward bias through the month. This stemmed from a continued upward movement in crude prices which in turn caused both bond yields and currency to move higher. The benchmark 10 year G-sec rose higher through the month to close at 8.02% as against 7.95% at the end of the previous month.
OutlookPost the back to back rate hikes in June and August, market yields were range bound for a while before moving up again in September. Markets await the policy meeting in early October. Given the imperatives at this juncture, the expectation is for a 25 bps rate hike. Besides, given the uncertainty arising from macro which has weakened from the time of the previous policy, it appears that further rate tightening could be required in the months to come. As such we also expect the Central bank to signal a change in policy stance and move from ‘neutral to tightening’.
Macro negatives at this juncture stem from a rising crude which is leading to a worsening of the Current account deficit and likely inflation pressures. Along with weakening capital flows, there is increased pressure on the INR, which in turn is further adding pressure to the CAD.
Kumaresh RamakrishnanHead – Fixed Income
funds, taking the YTD total to ~$12.2bn. Mutual Funds were net buyers of $1.1bn in Sep while Insurers were buyers with net inflows of $630mn
Rising current account deficit coupled with FII outflows is putting pressure on Balance of Payment (BoP). The BoP deficit for Jun’18 quarter came in at 7-year high of USD 11.3bn. Expanding deficit in BoP coupled with Import cover at 4-year low of 8.9 months, has been exerting pressure on rupee.
Going ForwardThe troika of higher crude prices, depreciating rupee and rising interest rates paint a grim picture of the macro situation for the time being. Further, with a few state elections and general elections coming up, markets are likely to take direction from all of the above. GST collections are also running below the required run rate and hence the task for the rest half of the financial year is tall, assuming targets are to be met.
While earnings made a smart recovery in Q1FY19, the continuity of the same should provide some support to fundamentals in times of volatility. Valuations for the broader market, which were well above long term mean have started to correct and some sectors which saw a meteoric rise in the near past are now normalising. In our portfolios, we are overweight on IT, Pharma and private sector banks (both retail and corporate). We are underweight on Energy, Materials, Utilities, Telecom.
Strong first quarter GDP growth also strengthens the case for a rate tightening as RBI’s observations on the closure of the output gap seems to be getting validated. Consolidation of domestic demand conditions and any fillip to exports from a close to 10% depreciation of the INR this calendar year should lead to faster filling up of manufacturing capacities.
Recommended ProductsGiven that we continue to remain in a rate hiking cycle locally, we continue to recommend shorter duration products in the average maturity range of 1-3 years. These products will limit the volatility for investors at a time when the yield environment is exhibiting an upward bias.
The rise in yields this financial year continue to offer an attractive entry point to investors. We recommend the DHFL Pramerica Short Maturity Fund in this category. Investors with a preference for AAA exposure at the shorter end of the Curve can also consider the DHFL Pramerica Banking and PSU Debt Fund and DHFL Pramerica Premier Bond Fund.
The DHFL Pramerica Credit Risk Fund in the ’accrual category’ is recommended for investors seeking a higher carry and having a slightly higher risk appetite.
Fixed Income MarketAugust 2018 September 2018 Change
(in bps)
Overnight rate (NSE MIBOR) 6.50% 6.60% 10
1 yr CD 8.15% 8.40% 25
10 yr GOI yield 7.95% 8.02% 7
USD/INR 70.99 72.49 150*
IIP (Monthly with 2 month lag) 6.8% 6.60% -20
CPI (Monthly with 1 month lag)
4.17% 3.69% -48
5 Yr AAA PSU spread (bps) 46 53 7
5 Yr OIS 7.42% 7.67% 25
US 10 Yr yield 2.86% 3.06% 20
CRR 4.00% 4.00% —
REVERSE REPO 6.25% 6.25% —
REPO 6.50% 6.50% —
Source: RBI Weekly Statistical Supplement & Bloomberg *Change in Paisa

5
EQU
ITY
FU
ND
S R
ECK
ON
ER
Sche
me N
ame
DHFL
Pra
mer
ica L
arge
Cap
Fun
dDH
FL P
ram
erica
Dive
rsifi
ed E
quity
Fun
dDH
FL P
ram
erica
Mid
cap
Oppo
rtuni
ties F
und
DHFL
Pra
mer
ica L
ong
Term
Equ
ity F
und
Idea
l Inve
stm
ent H
orizo
n $
3 Yea
rs+3 Y
ears+
4 Yea
rs+3 Y
ears+
Ince
ptio
n Da
teRe
gular
Plan
: 21/0
1/200
3; Di
rect
Plan
: 01/0
1/201
3Re
gular
Plan
: 04/0
3/201
5; Di
rect
Plan
: 04/0
3/201
5Re
gular
Plan
: 02/1
2/201
3; Di
rect
Plan
: 02/1
2/201
3Re
gular
Plan
: 11/1
2/201
5; Di
rect
Plan
: 11/1
2/201
5
Fund
Man
ager
Alok
Aga
rwal
is ma
nagin
g sinc
e July
27, 2
017
Aniru
ddha
Nah
a is m
anag
ing si
nce A
pril 0
5, 20
18An
irudd
ha N
aha i
s man
aging
sinc
e Apr
il 05,
2018
Avina
sh A
garw
al is
mana
ging s
ince J
uly 27
, 201
7
Benc
hmar
kNi
fty 50
TR
Index
S&P
BSE
200 T
R Ind
exNi
fty M
idcap
100 T
R Ind
exS&
P BS
E 20
0 TR
Index
Fund
Det
ails a
s on
28 S
epte
mbe
r, 20
18
Mont
h En
d AU
M (in
Cro
res)
387.6
199
.3310
0.46
304.8
4
Portf
olio
Tur
nove
r2.0
12.9
92.0
31.4
7
Stan
dard
Dev
iatio
n of
Fun
d (A
nnua
l)13
.76%
12.89
%15
.16%
—
Stan
dard
Dev
iatio
n of
Ben
chm
ark (
Annu
al)14
.05%
12.24
%16
.72%
—
Beta
0.96
1.01
0.86
—
Shar
pe R
atio
**0.5
10.1
00.0
4—
Portf
olio
Clas
sifica
tion
By M
arke
t Cap
ital (
%) a
s on
28 S
epte
mbe
r, 20
18 #
Larg
e Cap
(%) (
1st-1
00th
stoc
k)86
.756
.71.5
69.2
Mid
Cap
(%) (
101s
t-250
th st
ock)
4.213
.267
.58.6
Small
Cap
(%) (
251s
t sto
ck o
nwar
ds)
0.619
.225
.011
.6
Cash
(%)
8.69.6
5.19.4
Not C
lassifi
ed (%
)—
1.30.9
1.2
Portf
olio
Clas
sifica
tion
By In
dust
ry A
lloca
tion
(%) a
s on
28 S
epte
mbe
r, 20
18
Portf
olio
Clas
sifica
tion
By In
dust
ry A
lloca
tion
(%)
(Top
10)
Indu
stry
% to
Net
As
sets
Softw
are
23.98
Bank
s22
.38
Phar
mace
utica
ls11
.96
Petro
leum
Prod
ucts
9.74
Cons
umer
Non
Dur
ables
6.84
Finan
ce5.4
7
Auto
3.95
Cons
tructi
on P
rojec
t3.4
8
Gas
2.16
Non -
Fer
rous
Meta
ls2.1
0
Indu
stry
% to
Net
As
sets
Bank
s18
.38
Phar
mace
utica
ls12
.99
Softw
are
11.70
Cons
umer
Non
Dur
ables
9.31
Petro
leum
Prod
ucts
6.45
Auto
Ancil
laries
3.92
Indus
trial P
rodu
cts3.9
2
Ceme
nt3.5
8
Auto
3.20
Cons
umer
Dur
ables
2.82
Indu
stry
% to
Net
As
sets
Phar
mace
utica
ls15
.18
Softw
are
9.42
Auto
Ancil
laries
8.46
Cons
umer
Non
Dur
ables
7.84
Texti
le Pr
oduc
ts7.4
1
Bank
s6.9
1
Finan
ce4.8
7
Cons
tructi
on P
rojec
t4.3
6
Indus
trial P
rodu
cts4.0
0
Ceme
nt3.9
2
Indu
stry
% to
Net
As
sets
Bank
s17
.63
Softw
are
16.02
Phar
mace
utica
ls11
.14
Cons
umer
Non
Dur
ables
8.13
Petro
leum
Prod
ucts
6.27
Indus
trial P
rodu
cts6.1
2
Finan
ce5.1
8
Cons
tructi
on P
rojec
t3.5
1
Auto
3.13
Auto
Ancil
laries
2.83
Othe
r Det
ails
Exit
Load
(Loa
d ch
ange
d w.
e.f. A
ugus
t 27,
2018
)Re
fer pa
ge no
. 7Re
fer pa
ge no
. 8Re
fer pa
ge no
. 9Ni
l
Sour
ce: B
loomb
erg.
# The
abov
e rati
os ar
e calc
ulated
only
on eq
uity p
ortio
n.**
Risk
free
rate
assu
med t
o be 6
.43%
(bas
ed on
MIB
OR as
on 28
/09/20
18).
$ Inv
estor
s sho
uld co
nsult
their
finan
cial a
dviso
r for
tax i
mplic
ation
s on t
heir i
nves
tmen
ts.

6
Sche
me N
ame
DHFL
Pra
mer
ica H
ybrid
Equ
ity F
und
DHFL
Pra
mer
ica E
uro
Equi
ty F
und
DHFL
Pra
mer
ica G
loba
l Agr
ibus
ines
s Of
fsho
re F
und
DHFL
Pra
mer
ica A
rbitr
age F
und
DHFL
Pra
mer
ica E
quity
Sav
ings
Fun
d
Idea
l Inve
stm
ent H
orizo
n $
2 Yea
rs+3 Y
ears+
3 Yea
rs+3 M
onths
+2 Y
ears+
Ince
ptio
n Da
teRe
gular
Plan
: 29/0
1/200
4; Di
rect
Plan
: 01/0
1/201
3Re
gular
Plan
: 11/0
9/200
7; Di
rect
Plan
: 01/0
1/201
3Re
gular
Plan
: 14/0
5/201
0; Di
rect
Plan
: 01/0
1/201
3Re
gular
Plan
: 27/0
8/201
4; Di
rect
Plan
: 27/0
8/201
4Re
gular
Plan
: 29/0
1/200
4; Di
rect
Plan
: 01/0
1/201
3
Fund
Man
ager
Alok
Aga
rwal
(Equ
ity po
rtion)
is m
anag
ing si
nce
June
2016
and
Kuma
resh
Ram
akris
hnan
(Deb
t por
tion)
is
mana
ging s
ince A
pril 0
5, 20
18
Alok
Aga
rwal
is ma
nagin
g sinc
e July
27, 2
017
Alok
Aga
rwal
is ma
nagin
g sinc
e July
27, 2
017
Utka
rsh K
atkor
ia is
mana
ging s
ince M
arch
2016
an
d Hita
sh D
ang (
Equit
y Mar
ket)
is ma
nagin
g sin
ce M
ay 20
17 an
d Kum
ares
h Ram
akris
hnan
(D
ebt M
arke
t) is
mana
ging s
ince A
ugus
t 201
4
Alok
Aga
rwal
(Equ
ity P
ortio
n) is
man
aging
sinc
e Au
gust
2016
and K
umar
esh R
amak
rishn
an
(Deb
t Por
tion)
is m
anag
ing si
nce A
pril 0
5, 20
18
Benc
hmar
kCR
ISIL
Hybr
id 35
+65 -
Agg
resiv
e Ind
exMS
CI E
MU In
dex
MSCI
Wor
ld Ind
exNi
fty 50
Arb
itrage
TR
Index
70%
of th
e NIF
TY 50
Arb
itrage
TR
Index
and
30%
of th
e NIF
TY 50
TR
Index
Fund
Det
ails a
s on
28 S
epte
mbe
r, 20
18Mo
nth
End
AUM
(in C
rore
s)21
4.04
4.46
7.49
582.8
930
.28
Portf
olio
Tur
nove
r1.9
6 (Fo
r Equ
ity)
——
3.46
0.53 (
For E
quity
)
Stan
dard
Dev
iatio
n of
Fun
d (A
nnua
l)1 y
ear:
7.18%
; 6 ye
ars:
12.41
%—
—1.0
8%3.8
8%
Stan
dard
Dev
iatio
n of
Ben
chm
ark (
Annu
al)1 y
ear:
7.35%
; 6 ye
ars:
9.35
%—
—1.4
5%17
.74%
Beta
1 yea
r: 0.9
2; 6 y
ears
: 1.26
——
0.39
0.10
Shar
pe R
atio
**1 y
ear:
-0.40
; 6 ye
ars:
0.37
——
-0.34
0.57
Portf
olio
Clas
sifica
tion
By M
arke
t Cap
ital (
%) a
s on
28 S
epte
mbe
r, 20
18 #
Larg
e Cap
(%) (
1st-1
00th
stoc
k)90
.5—
——
—
Mid
Cap
(%) (
101s
t-250
th st
ock)
6.4—
——
—
Small
Cap
(%) (
251s
t sto
ck o
nwar
ds)
3.2—
——
—
Cash
(%)
0.0—
——
—
Not C
lassifi
ed (%
)—
——
——
Portf
olio
Clas
sifica
tion
By In
dust
ry A
lloca
tion
(%) a
s on
28 S
epte
mbe
r, 20
18Po
rtfol
io C
lassifi
catio
n By
Indu
stry
Al
loca
tion
(%) (
Top
10)
Indu
stry
% to
Net
As
sets
Bank
s17
.97
Softw
are
17.63
Phar
mace
utica
ls11
.90
Cons
umer
Non
Dur
ables
4.59
Petro
leum
Prod
ucts
4.47
Finan
ce3.6
6
Cons
tructi
on P
rojec
t2.7
9
Gas
2.06
Auto
1.39
Cons
umer
Dur
ables
1.39
Indu
stry
% to
Net
As
sets
Finan
ce19
.63
Cons
umer
Disc
retio
nary
12.07
Indus
trials
11.52
Cons
umer
Stap
les11
.51
Powe
r10
.73
Healt
h9.4
2
Mater
ials
6.71
IT6.5
9
Telec
om4.6
9
Publi
c Utili
ties
3.54
Indu
stry
% to
Net
As
sets
Fertil
izers
& Ag
ricult
ural
Chem
22.8
Pack
aged
Foo
ds &
Mea
t15
.8
Agric
ultur
al Pr
oduc
ts13
.3
Inter
net S
oftwa
re &
Ser
v.9.1
Dive
rsifie
d Che
mica
ls5.9
Spec
iality
Che
mica
ls5.7
Agric
ultur
al &
Farm
Mac
hiner
y4.2
Railro
ads
3.1
Perso
nal P
rodu
cts2.8
Food
Reta
il2.5
Indu
stry
% to
Net
As
sets
Finan
ce17
.57
Bank
s5.2
6
Cons
umer
Non
Dur
ables
5.21
Auto
4.98
Powe
r4.0
7
Phar
mace
utica
ls3.6
9
Softw
are
3.52
Ferro
us M
etals
2.94
Ceme
nt2.8
3
Petro
leum
Prod
ucts
2.79
Indu
stry
% to
Net
As
sets
Phar
mace
utica
ls15
.56
Bank
s13
.98
Ferro
us M
etals
8.32
Ceme
nt6.5
7
Softw
are
6.35
Cons
umer
Non
Dur
ables
3.64
Petro
leum
Prod
ucts
3.32
Cons
tructi
on P
rojec
t2.1
2
Media
& E
nterta
inmen
t2.0
3
Finan
ce1.2
9
Othe
r Det
ails
Exit
Load
(Loa
d ch
ange
d w.
e.f. A
ugus
t 27
, 201
8)Re
fer pa
ge no
. 11
withi
n 1 ye
ar -
1%wi
thin 1
year
- 1%
withi
n 30 d
ays -
0.50
%Re
fer pa
ge no
. 15
Sour
ce: B
loomb
erg.
# The
abov
e rati
os ar
e calc
ulated
only
on eq
uity p
ortio
n.**
Risk
free
rate
assu
med t
o be 6
.43%
(bas
ed on
MIB
OR as
on 28
/09/20
18).
$ Inv
estor
s sho
uld co
nsult
their
finan
cial a
dviso
r for
tax i
mplic
ation
s on t
heir i
nves
tmen
ts.
EQU
ITY
FU
ND
S R
ECK
ON
ER

7
Performance (CAGR)Fund Nifty 50 TR Index^ SENSEX TR Index #
Period Returns (%) Value (INR)* Returns (%) Value (INR)* Returns (%) Value (INR)*Regular Plan - Growth Option
Last 1 Year 6.11 10,611.25 13.43 11,342.51 17.13 11,713.11 Last 3 Years 9.95 13,290.98 13.41 14,585.11 13.73 14,710.68 Last 5 Years 15.50 20,561.83 14.79 19,941.43 14.48 19,671.39 Since Inception 19.37 1,60,398.11 17.89 1,31,833.75 18.52 1,43,321.81 Direct Plan - Growth Option
Last 1 Year 7.81 10,780.54 13.43 11,342.51 17.13 11,713.11 Last 3 Years 11.67 13,925.01 13.41 14,585.11 13.73 14,710.68 Last 5 Years 17.02 21,954.67 14.79 19,941.43 14.48 19,671.39 Since Inception 14.52 21,788.14 12.59 19,754.85 12.92 20,092.44
Date of Inception: Regular Plan: January 21, 2003; Direct Plan: January 01, 2013. CAGR – Compounded Annual Growth Rate^ Scheme Benchmark. # Standard Benchmark. *Based on standard investment of ̀ 10,000 made at the beginning of the relevant period. Past performance may or may not be sustained in future and should not be used as a basis for comparison with other investments.Different plans have a different expense structure. For Total Expense Ratio as on September 28, 2018 refer page no. 30Alok Agarwal is managing this fund since July 27, 2017. For performance of schemes managed by Alok Agarwal refer page no. 7, 11, 12, 13, 15, 18, 31For SIP Performance, please refer page no. 32
DHFL Pramerica Large Cap Fund
(DPLCF)(Large Cap Fund - An open ended equity scheme predominantly investing in large cap stocks)
Details as on September 28, 2018
Regular Plan and Direct Plan are available for subscription as per the below details
Inception Date: Regular Plan: 21/01/2003, Direct Plan: 01/01/2013. Application Amount: ̀ 5000/- and in multiples of ̀ 1/- thereafter. Additional Purchase Amount: ̀ 1000/- and in multiples of ̀ 1/-thereafter or 100 units. Repurchase / Redemption Amount: Minimum of ̀ 100/- and in multiples of ̀ 1/- thereafter or 0.1 unit or account balance whichever is lower. SIP/STP/SWP: Available. Investment Amount for SIP/STP/SWP: SIP/STP: Monthly: 10 installments of ` 500/- each and in multiples of ` 100/- thereafter. Quarterly: 5 installments of ` 1000/- each and in multiples of ` 100/- thereafter. STP Daily: 60 installments of ` 100/- and in multiples of ` 100/- thereafter from DHFL Pramerica Insta Cash Fund. SWP (Monthly and Quarterly): 2 (two) installments of ` 100/-.
Fund Details
Investment Style Box:
Investment Objective: To generate long term capital growth from a diversified portfolio of equity and equity related securities of predominantly large cap companies.Fund Manager: Mr. Alok Agarwal (Over 15 years of experience in equity market & Finance).Benchmark: Nifty 50 TR IndexOption: Dividend (Payout/Reinvestment) and Growth.Quarterly (Jul-Sept 2018) Average AUM (` in Cr): 407.51Monthly Average AUM (` in Cr): 401.31AUM as on 28/09/2018 (` in Cr.): 387.61Portfolio Turnover: 2.01Volatility Measures (6 Years):Standard Deviation of Fund (Annual): 13.76%Standard Deviation of Benchmark (Annual): 14.05%Beta: 0.96 Sharpe Ratio***: 0.51 Tracking Error: 2.50%*** Risk Free Rate assumed to be 6.43% (based on MIBOR as on 28/09/2018)Fund Manager's Report: During the month the fund increased weightage in Pharmaceuticals and Software; decreased weightage in Banks and Consumer Non Durables.NAV: Regular Plan Direct PlanGrowth ` 161.10 ` 173.06Dividend ` 17.17 ` 20.24Bonus ` 21.70 ` 23.04
Load Structure$: Entry Load: NA. Exit Load: 10% of the units allotted may be redeemed without any exit load on or before 12 months from the date of allotment; Any redemptions / switch outs in excess of the above mentioned limit would be subject to an exit load of 1%, if the units are redeemed /switched out on or before completion of 12 months from the date of allotment of units; Nil - If the units are redeemed / switched out after completion of 12 months from the date of allotment of units.$No exit load will be charged for switches and STP between equity schemes. No exit load will be charged for switches and STP from equity schemes to DHFL Pramerica Hybrid Debt Fund/ DHFL Pramerica Credit Risk Fund/ DHFL Pramerica Short Maturity Fund.
PortfolioIssuer % to Net AssetsAuto 3.95Maruti Suzuki India Ltd. 2.09Mahindra & Mahindra Ltd. 1.87Banks 22.38HDFC Bank Ltd. 10.25ICICI Bank Ltd. 5.05Kotak Mahindra Bank Ltd. 3.36Axis Bank Ltd. 2.03Indusind Bank Ltd. 1.70Cement 0.89Ultratech Cement Ltd. 0.68Shree Cements Ltd. 0.21Construction Project 3.48Larsen & Toubro Ltd. 3.48Consumer Durables 1.53Whirlpool Of India Ltd. 1.53Consumer Non Durables 6.84ITC Ltd. 6.84Finance 5.47Housing Development Finance Corporation Ltd. 4.03HDFC Standard Life Insurance Co Ltd. 1.44Gas 2.16Gail (India) Ltd. 1.17Petronet LNG Ltd. 0.99
Issuer % to Net AssetsNon - Ferrous Metals 2.10Vedanta Ltd. 2.10Petroleum Products 9.74Reliance Industries Ltd. 9.74Pharmaceuticals 11.96Cipla Ltd. 3.04Sun Pharmaceutical Ind Ltd. 2.89Dr. Reddy's Laboratories Ltd. 2.29Lupin Ltd. 1.60Cadila Healthcare Ltd. 1.15Aurobindo Pharma Ltd. 1.00Software 23.98Tata Consultancy Services Ltd. 8.07Infosys Ltd. 7.35Larsen & Toubro Infotech Ltd. 2.77HCL Technologies Ltd. 1.82Tech Mahindra Ltd. 1.50Wipro Ltd. 0.96Oracle Financial Services Software Ltd. 0.86Tata ELXSI Ltd. 0.65Cash & Current Assets 5.52Total 100.00
This product is suitable for investors who are seeking*• Capital growth over the long term• Investment predominantly in equity and equity
related securities of Large Cap companies.• Degree of risk – MODERATELY HIGH* Investors should consult their financial advisers if in doubt about whether the product is suitable for them.
Moderate
Moderately
Low
Low
ModeratelyHigh
High
LOW HIGH
Moderately High — investors understand that their principal will be at moderately high risk.
Dividend HistoryRegular Plan Direct Plan
Record Date
Dividend/unit (`)#
NAV (`) Dividend/unit (`)#
NAV (`)
27-Jun-16 0.50 18.37 0.18 19.4629-Sep-16 0.50 19.18 0.50 20.7729-Dec-16 0.50 17.40 0.45 18.9424-Mar-17 1.00 19.12 0.22 21.0129-Jun-17 0.50 19.01 0.50 21.9128-Sep-17 0.50 18.92 0.60 21.9628-Dec-17 0.50 19.58 0.60 22.8123-Mar-18 1.29 17.91 1.56 20.9302-Jul-18 0.44 17.40 0.44 20.3628-Sep-18 0.44 17.17 0.44 20.24
# On face value of ` 10. Post Dividend per unit NAV will fall to the extent of the payout and applicable tax/surcharges/cess/other statutory levies. Dividend distribution is subject to availability of distributable surplus. Past Performance may or may not be sustained in future.
8
Regular Plan and Direct Plan are available for subscription as per the below detailsInception Date: Regular Plan: 04/03/2015, Direct Plan: 04/03/2015. Application Amount: ` 100/- and in multiples of ` 1/- thereafter. Additional Purchase Amount: ` 100/- and in multiples of ` 1/- thereafter or 100 units. Repurchase / Redemption Amount: Minimum of ̀ 100/- and in multiples of ̀ 1/- thereafter or 0.1 unit or account balance whichever is lower. SIP/STP/SWP: Available. Investment Amount for SIP/STP/SWP: SIP/STP: Monthly: 60 installments of ` 100/- each and in multiples of ` 100/- thereafter. Quarterly: 20 installments of ` 300/- each and in multiples of ` 100/- thereafter. STP Daily: 60 installments of ` 100/- and in multiples of ` 100/- thereafter from DHFL Pramerica Insta Cash Fund. SWP (Monthly and Quarterly): 2 (two) installments of ` 100/-
Portfolio
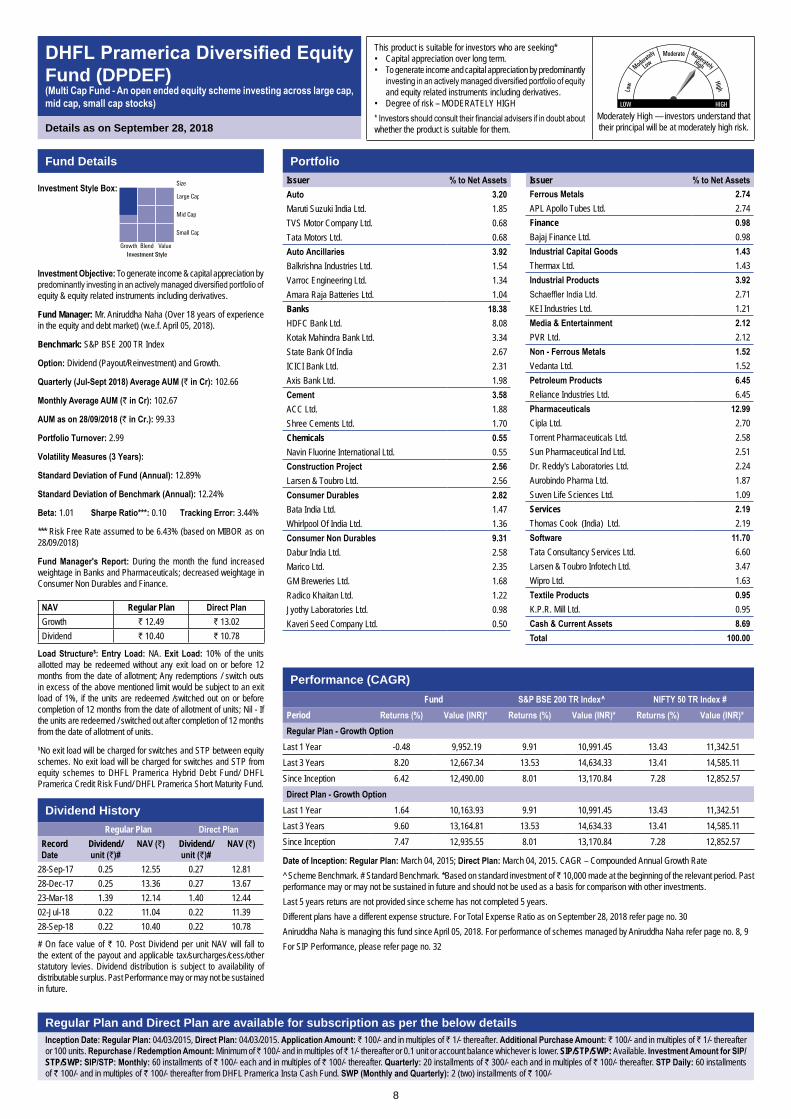
DHFL Pramerica Diversified Equity Fund (DPDEF)(Multi Cap Fund - An open ended equity scheme investing across large cap, mid cap, small cap stocks)
Details as on September 28, 2018
Fund Details
Investment Style Box:
Investment Objective: To generate income & capital appreciation by predominantly investing in an actively managed diversified portfolio of equity & equity related instruments including derivatives.
Fund Manager: Mr. Aniruddha Naha (Over 18 years of experience in the equity and debt market) (w.e.f. April 05, 2018).
Benchmark: S&P BSE 200 TR Index
Option: Dividend (Payout/Reinvestment) and Growth.
Quarterly (Jul-Sept 2018) Average AUM (` in Cr): 102.66
Monthly Average AUM (` in Cr): 102.67
AUM as on 28/09/2018 (` in Cr.): 99.33
Portfolio Turnover: 2.99
Volatility Measures (3 Years):
Standard Deviation of Fund (Annual): 12.89%
Standard Deviation of Benchmark (Annual): 12.24%
Beta: 1.01 Sharpe Ratio***: 0.10 Tracking Error: 3.44%
*** Risk Free Rate assumed to be 6.43% (based on MIBOR as on 28/09/2018)
Fund Manager's Report: During the month the fund increased weightage in Banks and Pharmaceuticals; decreased weightage in Consumer Non Durables and Finance.
NAV Regular Plan Direct PlanGrowth ` 12.49 ` 13.02Dividend ` 10.40 ` 10.78
Load Structure$: Entry Load: NA. Exit Load: 10% of the units allotted may be redeemed without any exit load on or before 12 months from the date of allotment; Any redemptions / switch outs in excess of the above mentioned limit would be subject to an exit load of 1%, if the units are redeemed /switched out on or before completion of 12 months from the date of allotment of units; Nil - If the units are redeemed / switched out after completion of 12 months from the date of allotment of units.$No exit load will be charged for switches and STP between equity schemes. No exit load will be charged for switches and STP from equity schemes to DHFL Pramerica Hybrid Debt Fund/ DHFL Pramerica Credit Risk Fund/ DHFL Pramerica Short Maturity Fund.
Issuer % to Net AssetsAuto 3.20Maruti Suzuki India Ltd. 1.85TVS Motor Company Ltd. 0.68Tata Motors Ltd. 0.68Auto Ancillaries 3.92Balkrishna Industries Ltd. 1.54Varroc Engineering Ltd. 1.34Amara Raja Batteries Ltd. 1.04Banks 18.38HDFC Bank Ltd. 8.08Kotak Mahindra Bank Ltd. 3.34State Bank Of India 2.67ICICI Bank Ltd. 2.31Axis Bank Ltd. 1.98Cement 3.58ACC Ltd. 1.88Shree Cements Ltd. 1.70Chemicals 0.55Navin Fluorine International Ltd. 0.55Construction Project 2.56Larsen & Toubro Ltd. 2.56Consumer Durables 2.82Bata India Ltd. 1.47Whirlpool Of India Ltd. 1.36Consumer Non Durables 9.31Dabur India Ltd. 2.58Marico Ltd. 2.35GM Breweries Ltd. 1.68Radico Khaitan Ltd. 1.22Jyothy Laboratories Ltd. 0.98Kaveri Seed Company Ltd. 0.50
This product is suitable for investors who are seeking*• Capital appreciation over long term.• To generate income and capital appreciation by predominantly
investing in an actively managed diversified portfolio of equity and equity related instruments including derivatives.
• Degree of risk – MODERATELY HIGH* Investors should consult their financial advisers if in doubt about whether the product is suitable for them.
Moderate
Moderately
Low
Low
ModeratelyHigh
High
LOW HIGH
Moderately High — investors understand that their principal will be at moderately high risk.
Performance (CAGR)Fund S&P BSE 200 TR Index^ NIFTY 50 TR Index #
Period Returns (%) Value (INR)* Returns (%) Value (INR)* Returns (%) Value (INR)*Regular Plan - Growth Option
Last 1 Year -0.48 9,952.19 9.91 10,991.45 13.43 11,342.51 Last 3 Years 8.20 12,667.34 13.53 14,634.33 13.41 14,585.11 Since Inception 6.42 12,490.00 8.01 13,170.84 7.28 12,852.57 Direct Plan - Growth Option
Last 1 Year 1.64 10,163.93 9.91 10,991.45 13.43 11,342.51 Last 3 Years 9.60 13,164.81 13.53 14,634.33 13.41 14,585.11 Since Inception 7.47 12,935.55 8.01 13,170.84 7.28 12,852.57
Date of Inception: Regular Plan: March 04, 2015; Direct Plan: March 04, 2015. CAGR – Compounded Annual Growth Rate^ Scheme Benchmark. # Standard Benchmark. *Based on standard investment of ̀ 10,000 made at the beginning of the relevant period. Past performance may or may not be sustained in future and should not be used as a basis for comparison with other investments.Last 5 years retuns are not provided since scheme has not completed 5 years.Different plans have a different expense structure. For Total Expense Ratio as on September 28, 2018 refer page no. 30Aniruddha Naha is managing this fund since April 05, 2018. For performance of schemes managed by Aniruddha Naha refer page no. 8, 9For SIP Performance, please refer page no. 32
Issuer % to Net AssetsFerrous Metals 2.74APL Apollo Tubes Ltd. 2.74Finance 0.98Bajaj Finance Ltd. 0.98Industrial Capital Goods 1.43Thermax Ltd. 1.43Industrial Products 3.92Schaeffler India Ltd. 2.71KEI Industries Ltd. 1.21Media & Entertainment 2.12PVR Ltd. 2.12Non - Ferrous Metals 1.52Vedanta Ltd. 1.52Petroleum Products 6.45Reliance Industries Ltd. 6.45Pharmaceuticals 12.99Cipla Ltd. 2.70Torrent Pharmaceuticals Ltd. 2.58Sun Pharmaceutical Ind Ltd. 2.51Dr. Reddy's Laboratories Ltd. 2.24Aurobindo Pharma Ltd. 1.87Suven Life Sciences Ltd. 1.09Services 2.19Thomas Cook (India) Ltd. 2.19Software 11.70Tata Consultancy Services Ltd. 6.60Larsen & Toubro Infotech Ltd. 3.47Wipro Ltd. 1.63Textile Products 0.95K.P.R. Mill Ltd. 0.95Cash & Current Assets 8.69Total 100.00
Dividend HistoryRegular Plan Direct Plan
Record Date
Dividend/unit (`)#
NAV (`) Dividend/unit (`)#
NAV (`)
28-Sep-17 0.25 12.55 0.27 12.8128-Dec-17 0.25 13.36 0.27 13.6723-Mar-18 1.39 12.14 1.40 12.4402-Jul-18 0.22 11.04 0.22 11.3928-Sep-18 0.22 10.40 0.22 10.78
# On face value of ` 10. Post Dividend per unit NAV will fall to the extent of the payout and applicable tax/surcharges/cess/other statutory levies. Dividend distribution is subject to availability of distributable surplus. Past Performance may or may not be sustained in future.

9
DHFL Pramerica Midcap Opportunities Fund (DPMOF) (Mid Cap Fund- An open ended equity scheme predominantly investing in mid cap stocks)
Details as on September 28, 2018
This product is suitable for investors who are seeking*• Capital appreciation over long run.• To achieve long term capital appreciation by
predominantly investing in equity and equity related instruments of mid cap companies.
• Degree of risk – MODERATELY HIGH* Investors should consult their financial advisers if in doubt about whether the product is suitable for them.
Moderate
Moderately
Low
Low
ModeratelyHigh
High
LOW HIGH
Moderately High — investors understand that their principal will be at moderately high risk.
Fund Details
Investment Style Box:
Investment Objective: The primary objective of the Scheme is to achieve long-term capital appreciation by predominantly investing in equity & equity related instruments of mid cap companies.
Fund Manager: Mr. Aniruddha Naha (Over 18 years of experience in the equity and debt market) (w.e.f. April 05, 2018).
Benchmark: Nifty Midcap 100 TR Index
Option: Dividend (Payout / Reinvestment) and Growth.
Quarterly (Jul-Sept 2018) Average AUM (` in Cr): 109.87
Monthly Average AUM (` in Cr): 108.65
AUM as on 28/09/2018 (` in Cr): 100.46
Portfolio Turnover: 2.03
Volatility Measures (4 Years):
Standard Deviation of Fund (Annual): 15.16%
Standard Deviation of Benchmark (Annual): 16.72%
Beta: 0.86 Sharpe Ratio***: 0.04 Tracking Error: 5.42%
*** Risk Free Rate assumed to be 6.43% (based on MIBOR as on 28/09/2018)
Fund Manager's Report: During the month the fund increased weightage in Pharmaceuticals and Software; decreased weightage in Banks and Finance.NAV: Regular Plan Direct PlanGrowth ` 17.46 ` 18.22Dividend ` 11.77 ` 15.83
Load Structure$: Entry Load: NA. Exit Load: 10% of the units allotted may be redeemed without any exit load on or before 12 months from the date of allotment; Any redemptions / switch outs in excess of the above mentioned limit would be subject to an exit load of 1%, if the units are redeemed /switched out on or before completion of 12 months from the date of allotment of units; Nil - If the units are redeemed / switched out after completion of 12 months from the date of allotment of units.$No exit load will be charged for switches and STP between equity schemes. No exit load will be charged for switches and STP from equity schemes to DHFL Pramerica Hybrid Debt Fund/ DHFL Pramerica Credit Risk Fund/ DHFL Pramerica Short Maturity Fund.
Issuer % to Net AssetsAuto Ancillaries 8.46Exide Industries Ltd. 3.96Balkrishna Industries Ltd. 2.13Apollo Tyres Ltd. 1.48Varroc Engineering Ltd. 0.89Banks 6.91RBL Bank Ltd. 5.15City Union Bank Ltd. 1.77Cement 3.92The Ramco Cements Ltd. 2.04Dalmia Bharat Ltd. 1.89Chemicals 2.07Tata Chemicals Ltd. 2.07Commercial Services 2.12Quess Corp Ltd. 2.12Construction 1.14PNC Infratech Ltd. 0.68KNR Constructions Ltd 0.45Construction Project 4.36Voltas Ltd. 1.85KEC International Ltd. 1.33Engineers India Ltd. 1.18Consumer Durables 2.82Whirlpool Of India Ltd. 2.82Consumer Non Durables 7.84Radico Khaitan Ltd. 2.07GM Breweries Ltd. 1.72Gujarat Ambuja Exports Ltd. 1.68Godfrey Phillips India Ltd. 1.50Avanti Feeds Ltd. 0.87Ferrous Metals 3.00APL Apollo Tubes Ltd. 2.02Jindal Steel & Power Ltd. 0.98Fertilisers 1.34Coromandel International Ltd. 1.34
Portfolio
Regular Plan and Direct Plan are available for subscription as per the below detailsInception Date: Regular Plan: 02/12/2013, Direct Plan: 02/12/2013. Application Amount: ` 5000/- and in multiples of ̀ 1/- thereafter. Additional Purchase Amount: ̀ 1000/- and in multiples of ̀ 1/- thereafter or 100 units. Repurchase / Redemption Amount: Minimum of ̀ 100/- and in multiples of ̀ 1/- thereafter or 0.1 unit or account balance whichever is lower. SIP/STP/SWP: Available. Investment Amount for SIP/STP/SWP: SIP/STP: Monthly: 10 installments of ` 500/- each and in multiples of ` 100/- thereafter. Quarterly: 5 installments of ` 1000/- each and in multiples of ` 100/- thereafter. STP Daily: 60 installments of ` 100/- and in multiples of ` 100/- thereafter from DHFL Pramerica Insta Cash Fund. SWP (Monthly and Quarterly): 2 (two) installments of ` 100/-
Performance (CAGR)Fund Nifty Midcap 100 TR Index^ NIFTY 50 TR Index #
Period Returns (%) Value (INR)* Returns (%) Value (INR)* Returns (%) Value (INR)*Regular Plan - Growth Option
Last 1 Year -4.80 9,520.17 -3.43 9,657.19 13.43 11,342.51 Last 3 Years 4.87 11,532.36 11.73 13,948.34 13.41 14,585.11 Since Inception 12.25 17,460.00 19.34 23,464.61 13.83 18,683.32 Direct Plan - Growth Option
Last 1 Year -3.09 9,691.49 -3.43 9,657.19 13.43 11,342.51 Last 3 Years 6.06 11,931.89 11.73 13,948.34 13.41 14,585.11 Since Inception 12.89 17,952.46 19.34 23,464.61 13.83 18,683.32 Date of Inception: Regular Plan: December 02, 2013; Direct Plan: December 02, 2013. CAGR – Compounded Annual Growth Rate^ Scheme Benchmark. # Standard Benchmark. *Based on standard investment of ̀ 10,000 made at the beginning of the relevant period. Past performance may or may not be sustained in future and should not be used as a basis for comparison with other investments.Last 5 years returns are not provided since the scheme has not completed 5 years. Different plans have a different expense structure. For Total Expense Ratio as on September 28, 2018 refer page no. 30W.e.f. April 02, 2018, the benchmark has been renamed from Nifty Free Float Midcap 100 Index to Nifty Midcap 100 TR IndexAniruddha Naha is managing this fund since April 05, 2018. For performance of schemes managed by Aniruddha Naha refer page no. 8, 9. For SIP Performance, please refer page no. 32
Dividend HistoryRegular Plan Direct Plan
Record Date
Dividend/unit (`)#
NAV (`) Dividend/unit (`)#
NAV (`)
28-Mar-16 0.25 12.49 0.25 12.6329-Sep-16 0.30 14.44 — —29-Dec-16 0.30 12.84 — —24-Mar-17 0.30 14.55 — —29-Jun-17 0.30 14.99 — —28-Sep-17 0.30 14.50 — —28-Dec-17 0.30 16.18 — —23-Mar-18 1.33 14.31 — —02-Jul-18 0.27 13.18 — —28-Sep-18 0.27 11.77 — —
# On face value of ` 10. Post Dividend per unit NAV will fall to the extent of the payout and applicable tax/surcharges/cess/other statutory levies. Dividend distribution is subject to availability of distributable surplus. Past Performance may or may not be sustained in future.
Issuer % to Net AssetsFinance 4.87Crisil Ltd. 2.10Max Financial Services Ltd. 1.63ICICI Lombard General Insurance Co. Ltd. 1.14Industrial Capital Goods 1.96ABB India Ltd. 1.96Industrial Products 4.00Mahindra CIE Automotive Ltd. 2.11KEI Industries Ltd. 1.89Media & Entertainment 1.88Inox Leisure Ltd. 1.88Pesticides 2.48P I Industries Limited 2.48Pharmaceuticals 15.18Abbott India Ltd. 4.45Torrent Pharmaceuticals Ltd. 3.47Sanofi India Ltd. 3.03IPCA Laboratories Ltd. 1.69Strides Pharma Science Ltd. 1.52Sun Pharma Advanced Research Co. Ltd. 1.02Services 1.67Thomas Cook (India) Ltd. 1.67Software 9.42L&T Technology Services Ltd. 3.11Larsen & Toubro Infotech Ltd. 2.86Hexaware Technologies Ltd. 2.45Mphasis Ltd. 0.99Telecom - Equipment & Accessories 2.19Sterlite Technologies Ltd. 2.19Textile Products 7.41SRF Ltd. 2.55Arvind Ltd. 2.45K.P.R. Mill Ltd. 2.41Cash & Current Assets 4.95Total 100.00

10
Fund Details
Investment Style Box:
Investment Objective: The primary objective of the Scheme is to generate long-term capital appreciation by predominantly investing in equity & equity related instruments and to enable eligible investors to avail deduction from total income, as permitted under the Income Tax Act, 1961 as amended from time to time.
Fund Manager: Mr. Avinash Agarwal (Over 11 years of experience in equity markets).
Benchmark: S&P BSE 200 TR Index
Option: Dividend (Payout) and Growth.
Quarterly (Jul- Sept 2018) Average AUM (` in Cr): 293.14
Monthly Average AUM (` in Cr): 305.61
AUM as on 28/09/2018 (` in Cr): 304.84
Portfolio Turnover: 1.47
Fund Manager's Report: During the month the fund increased weightage in Pharmaceuticals, Power and Software; decreased weightage in Banks, Consumer Non Durables and Finance.
NAV: Regular Plan Direct Plan
Growth ` 13.75 ` 14.26
Dividend ` 11.20 ` 11.12
Load Structure$: Entry Load: NA. Exit Load: Nil$No exit load will be charged for switches and STP from any scheme to the equity schemes of DPMF (except DHFL Pramerica Arbitrage Fund).
PortfolioIssuer % to Net AssetsAuto 3.13Mahindra & Mahindra Ltd. 1.81Maruti Suzuki India Ltd. 1.33Auto Ancillaries 2.83Exide Industries Ltd. 1.20Varroc Engineering Ltd. 1.19Amara Raja Batteries Ltd. 0.44Banks 17.63HDFC Bank Ltd. 8.98Kotak Mahindra Bank Ltd. 3.67ICICI Bank Ltd. 2.90Axis Bank Ltd. 2.09Cement 0.12Shree Cements Ltd. 0.12Chemicals 0.01Aarti Industries Ltd. 0.01Construction 0.57Somany Ceramics Ltd. 0.57Construction Project 3.51Larsen & Toubro Ltd. 3.51Consumer Durables 1.83Bajaj Electricals Ltd. 0.99Bata India Ltd. 0.84Consumer Non Durables 8.13ITC Ltd. 4.74Dabur India Ltd. 1.82Marico Ltd. 1.57Ferrous Metals 1.75Tata Steel Ltd. 0.95Tata Metaliks Ltd. 0.80Finance 5.18Housing Development Finance Corp. Ltd. 2.42HDFC Standard Life Insurance Co Ltd. 1.16Bharat Financial Inclusion Ltd. 1.12ICICI Lombard General Insurance Co. Ltd. 0.48Gas 0.99Gail (India) Ltd. 0.99
Regular Plan and Direct Plan are available for subscription as per the below detailsInception Date: Regular Plan: 11/12/2015, Direct Plan: 11/12/2015. Application Amount: Minimum of ` 500/- and in multiples of ` 500/- thereafter. Additional Purchase Amount: Minimum of ` 500/- and in multiples of ̀ 500/- thereafter. Repurchase / Redemption Amount: Minimum of ̀ 100/- and in multiples of ̀ 1/- thereafter or 0.1 unit or account balance whichever is lower. SIP/STP/SWP: Available. Investment Amount for SIP/STP/SWP: SIP: Monthly: 10 installments of ` 500/- each and in multiples of ` 500/- thereafter. Quarterly: 5 installments of ` 1000/- each and in multiples of ` 500/- thereafter. STP: Daily: 30 installments of ` 500/- and in multiples of ` 500/- thereafter from DHFL Pramerica Insta Cash Fund. Monthly: 10 installments of ` 500/- each and in multiples of ` 100/- thereafter. Quarterly: 5 installments of ` 1000/- each and in multiples of ` 100/- thereafter. SWP (Monthly and Quarterly): 2 (two) installments of ` 100/-.
DHFL Pramerica Long Term Equity Fund (DPLTEF)(Formerly known as DHFL Pramerica Tax Savings Fund)(An Open Ended Equity Linked Savings Scheme with a statutory lock-in of 3 years and tax benefit)
Details as on September 28, 2018
This product is suitable for investors who are seeking*• Long-term capital appreciation• To generate long-term capital appreciation by predominantly
investing in equity & equity related instruments and to enable eligible investors to avail deduction from total income, as permitted under the Income Tax Act, 1961 as amended from time to time.
• Degree of risk – MODERATELY HIGH* Investors should consult their financial advisers if in doubt about whether the product is suitable for them.
Moderate
Moderately
Low
Low
ModeratelyHigh
High
LOW HIGH
Moderately High — investors understand that their principal will be at moderately
high risk.
Performance (CAGR)Fund S&P BSE 200 TR Index^ NIFTY 50 TR Index #
Period Returns (%) Value (INR)* Returns (%) Value (INR)* Returns (%) Value (INR)*Regular Plan - Growth Option
Last 1 Year 4.88 10,488.18 9.91 10,991.45 13.43 11,342.51 Since Inception 12.05 13,750.00 15.27 14,887.69 15.37 14,922.22 Direct Plan - Growth Option
Last 1 Year 6.98 10,697.67 9.91 10,991.45 13.43 11,342.51 Since Inception 13.16 14,135.77 15.27 14,887.69 15.37 14,922.22 Date of Inception: Regular Plan: December 11, 2015; Direct Plan: December 11, 2015. CAGR – Compounded Annual Growth Rate^ Scheme Benchmark. # Standard Benchmark. *Based on standard investment of ̀ 10,000 made at the beginning of the relevant period. Past performance may or may not be sustained in future and should not be used as a basis for comparison with other investments.Last 3 years and 5 years returns are not provided since the scheme has not completed 3 years. Different plans have a different expense structure. For Total Expense Ratio as on September 28, 2018 refer page no. 30Avinash Agarwal is managing this fund since July 27, 2017. For performance of schemes managed by Avinash Agarwal refer page no. 10, 31For SIP Performance, please refer page no. 32
Issuer % to Net AssetsHotels, Resorts And Other Recreational Activities
0.97
The Indian Hotels Company Ltd. 0.97Industrial Capital Goods 0.34Skipper Ltd. 0.34Industrial Products 6.12Mahindra CIE Automotive Ltd. 1.88KEI Industries Ltd. 1.84Schaeffler India Ltd. 1.31NRB Bearing Ltd. 1.09Non - Ferrous Metals 1.25Vedanta Ltd. 1.25Pesticides 0.78UPL Ltd. 0.78Petroleum Products 6.27Reliance Industries Ltd. 6.27Pharmaceuticals 11.14Sun Pharmaceutical Ind Ltd. 2.49Dr. Reddy's Laboratories Ltd. 2.49Lupin Ltd. 2.13Cipla Ltd. 2.02Cadila Healthcare Ltd. 1.04Aurobindo Pharma Ltd. 0.98Power 0.81CESC Ltd. 0.81Services 1.15Thomas Cook (India) Ltd. 1.15Software 16.02Tata Consultancy Services Ltd. 4.87Infosys Ltd. 4.52Larsen & Toubro Infotech Ltd. 3.27Tech Mahindra Ltd. 1.61Hexaware Technologies Ltd. 0.87Oracle Financial Services Software Ltd. 0.69Tata ELXSI Ltd. 0.17Textiles - Cotton 0.73Vardhman Textiles Ltd. 0.73Cash & Current Assets 8.74Total 100.00
Dividend HistoryRegular Plan Direct Plan
Record Date
Dividend/unit (`)#
NAV (`) Dividend/unit (`)#
NAV (`)
29-Jun-17 0.24 12.15 0.24 12.32
28-Sep-17 0.24 12.15 0.25 12.36
28-Dec-17 0.24 13.06 0.25 13.32
23-Mar-18 0.80 11.86 1.12 12.03
02-Jul-18 0.21 11.49 0.21 11.38
28-Sep-18 0.18 11.20 0.21 11.12
# On face value of ` 10. Post Dividend per unit NAV will fall to the extent of the payout and applicable tax/surcharges/cess/other statutory levies. Dividend distribution is subject to availability of distributable surplus. Past Performance may or may not be sustained in future.

11
Fund Details
Investment Style Box:
Investment Objective: The investment objective of the scheme is to seek to generate long term capital appreciation and income from a portfolio of equity and equity related securities as well as fixed income securities.Fund Manager: Mr. Alok Agarwal (Equity portion) (Over 15 years of experience in equity market & Finance) and Mr. Kumaresh Ramakrishnan (Debt portion) (Over 20 years of experience in Fixed Income markets as Fund Manager and Analyst).Benchmark: CRISIL Hybrid 35+65 - Aggresive IndexOption: Dividend, Monthly Dividend, Half Yearly Dividend, Quarterly Dividend and Annual Dividend - (Payout/Reinvestment) and Growth.Quarterly (Jul-Sept 2018) Average AUM (` in Cr): 227.51Monthly Average AUM (` in Cr): 219.95AUM as on 28/09/2018 (` in Cr.): 214.04Portfolio Turnover: 1.96 (For Equity)For Debt part of the Portfolio:Average Maturity: 1.47 yrs Modified Duration: 1.64 yrsPortfolio Yield: 8.93%
Volatility Measures 1 Year## 6 YearsStandard Deviation of Fund (Annual) 7.18% 12.41%Standard Deviation of Benchmark (Annual)
7.35% 9.35%
Beta 0.92 1.26Sharpe Ratio*** -0.40 0.37Tracking Error 2.53% 4.68%
*** Risk Free Rate assumed to be 6.43% (based on MIBOR as on 28/09/2018)Fund Manager's Report: During the month the fund increased weightage in Pharmaceuticals and Software; decreased weightage in Banks and Consumer Non Durables.NAV: Regular Plan Direct PlanGrowth ` 66.27 ` 71.00Dividend ` 13.69 ` 21.96Monthly Dividend ` 21.76 ` 22.33Quarterly Dividend ` 16.84 ` 16.83Annual Dividend — ` 10.19
Load Structure$: Entry Load: NA Exit Load: 10% of the units allotted may be redeemed without any exit load on or before 12 months from the date of allotment; Any redemptions / switch outs in excess of the above mentioned limit would be subject to an exit load of 1%, if the units are redeemed /switched out on or before completion of 12 months from the date of allotment of units; Nil - If the units are redeemed / switched out after completion of 12 months from the date of allotment of units.$No exit load will be charged for switches and STP between equity schemes. No exit load will be charged for switches and STP from equity schemes to DHFL Pramerica Hybrid Debt Fund/ DHFL Pramerica Credit Risk Fund/ DHFL Pramerica Short Maturity Fund.
PortfolioIssuer % to Net
AssetsRating
Auto 1.39Mahindra & Mahindra Ltd. 1.39Banks 17.97HDFC Bank Ltd. 9.87ICICI Bank Ltd. 4.00Kotak Mahindra Bank Ltd. 1.71Axis Bank Ltd. 1.29Indusind Bank Ltd. 1.11Cement 0.19Shree Cements Ltd. 0.19Construction Project 2.79Larsen & Toubro Ltd. 2.79Consumer Durables 1.39Whirlpool Of India Ltd. 1.39Consumer Non Durables 4.59ITC Ltd. 4.59Finance 3.66Housing Development Finance Corporation Ltd.
2.38
HDFC Standard Life Insurance Co Ltd.
1.28
Gas 2.06Gail (India) Ltd. 1.06Petronet LNG Ltd. 1.00Non - Ferrous Metals 1.09Vedanta Ltd. 1.09Petroleum Products 4.47Reliance Industries Ltd. 4.47Pharmaceuticals 11.90Cipla Ltd. 3.06Sun Pharmaceutical Ind Ltd. 2.77Dr. Reddy's Laboratories Ltd. 1.95Lupin Ltd. 1.64Aurobindo Pharma Ltd. 0.97Cadila Healthcare Ltd. 0.90Torrent Pharmaceuticals Ltd. 0.61Software 17.63Tata Consultancy Services Ltd. 5.95Infosys Ltd. 4.26
DHFL Pramerica Hybrid Equity Fund (DPHEF)(Formerly known as DHFL Pramerica Balanced Advantage Fund)(An open ended hybrid scheme investing predominantly in equity and equity related instruments)Details as on September 28, 2018
This product is suitable for investors who are seeking*• Capital growth over the long term• Investing predominantly in equity and equity
related securities.• Degree of risk – MODERATELY HIGH* Investors should consult their financial advisers if in doubt about whether the product is suitable for them.
Moderate
Moderately
Low
Low
ModeratelyHigh
High
LOW HIGH
Moderately High — investors understand that their principal will be at moderately high risk.
Regular Plan and Direct Plan are available for subscription as per the below detailsInception Date: Regular Plan: 29/01/2004, Direct Plan: 01/01/2013. Application Amount: ` 5000/- and in multiples of ̀ 1/- thereafter. Additional Purchase Amount: ̀ 1000/- and in multiples of ̀ 1/- thereafter or 100 units. Repurchase / Redemption Amount: Minimum of ̀ 100/- and in multiples of ̀ 1/- thereafter or 0.1 unit or account balance whichever is lower. SIP/STP/SWP: Available. Investment Amount for SIP/STP/SWP: SIP/STP: Monthly: 10 installments of ` 500/- each and in multiples of ` 100/- thereafter. Quarterly: 5 installments of ` 1000/- each and in multiples of ` 100/- thereafter. STP Daily: 60 installments of ` 100/- and in multiples of ` 100/- thereafter from DHFL Pramerica Insta Cash Fund. SWP (Monthly and Quarterly): 2 (two) installments of ` 100/-
Performance (CAGR)Fund CRISIL Hybrid 35+65 - Aggresive Index^ Nifty 50 TR Index #
Period Returns (%) Value (INR)* Returns (%) Value (INR)* Returns (%) Value (INR)*Regular Plan - Growth Option
Last 1 Year 4.15 10,414.90 6.78 10,677.68 13.43 11,342.51 Last 3 Years 6.61 12,117.39 11.38 13,817.70 13.41 14,585.11 Last 5 Years 12.55 18,063.07 13.91 19,185.31 14.79 19,941.43 Since Inception 13.76 66,106.41 12.22 54,172.38 14.58 73,490.62 Direct Plan - Growth Option
Last 1 Year 5.67 10,567.05 6.78 10,677.68 13.43 11,342.51 Last 3 Years 8.11 12,635.70 11.38 13,817.70 13.41 14,585.11 Last 5 Years 13.97 19,237.66 13.91 19,185.31 14.79 19,941.43 Since Inception 11.77 18,948.20 11.62 18,796.92 12.59 19,754.85 Date of Inception: Regular Plan: January 29, 2004; Direct Plan: January 01, 2013. CAGR – Compounded Annual Growth Rate^ Scheme Benchmark. # Standard Benchmark. *Based on standard investment of ̀ 10,000 made at the beginning of the relevant period. Past performance may or may not be sustained in future and should not be used as a basis for comparison with other investments.## The benchmark of the scheme has been changed from BSE 200 Index to CRISIL Balanced Fund - Aggresive Index w.e.f. close of business hours on March 04, 2016, pursuant to change in fundamental attributes of the scheme. Hence, 1 year data of qualitative/volatility measures has also been shown to reflect the correct risk attribute of the scheme. Further, the name of the benchmark has been changed from CRISIL Balanced Fund - Aggresive Index to CRISIL Hybrid 35+65 - Aggresive Index w.e.f. January 31, 2018.The debt component of the benchmark is TRI since inception. For equity component of the benchmark, i.e. S&P BSE 200 PRI value is used till 31st July 2006 and TRI is used since 1st Aug 2006.Different plans have a different expense structure. For Total Expense Ratio as on September 28, 2018 refer page no. 30.Alok Agarwal (Equity Portion) is managing this scheme since June 2016 and Kumaresh Ramakrishnan (Debt Portion) is managing this scheme since April 05, 2018. For performance of schemes managed by Kumaresh Ramakrishnan refer page no. 11, 14-15, 18-21, 23, 25. For performance of schemes managed by Alok Agarwal refer page no. 7, 11, 12, 13, 15, 18, 31For SIP Performance, please refer page no. 32
Dividend HistoryRegular Plan Direct Plan
Record Date
Dividend/unit (`)#
NAV (`) Dividend/unit (`)#
NAV (`)
DIVIDEND23-Mar-18 0.84 14.56 1.33 23.2602-Jul-18 0.30 13.99 0.48 22.4428-Sep-18 0.30 13.69 0.48 21.96MONTHLY DIVIDEND17-Jul-18 0.17 22.72 0.18 23.2717-Aug-18 0.17 23.12 0.18 23.7017-Sep-18 0.17 22.38 0.18 22.97QUARTERLY DIVIDEND28-Dec-17 — — 0.17 17.0928-Jun-18 — — 0.0010 16.6528-Sep-18 — — 0.0885 16.83
# On face value of ` 10. Post Dividend per unit NAV will fall to the extent of the payout and applicable tax/surcharges/cess/other statutory levies. Dividend distribution is subject to availability of distributable surplus. Past Performance may or may not be sustained in future.
Issuer % to Net Assets
Rating
Larsen & Toubro Infotech Ltd. 2.51Tech Mahindra Ltd. 1.53HCL Technologies Ltd. 1.02Wipro Ltd. 0.91Oracle Financial Services Software Ltd.
0.82
Tata ELXSI Ltd. 0.64Textile Products 0.79K.P.R. Mill Ltd. 0.79Textiles - Cotton 0.80Vardhman Textiles Ltd. 0.80Equity Holdings 70.71Corporate Debt 19.15Non-Convertible DebenturesSBI Cards & Payment Services Pvt. Ltd.
8.13 CRISIL AAA
India Infradebt Ltd. 2.30 ICRA AAAShriram Transport Finance Co. Ltd. 2.27 FITCH AA+Dewan Housing Finance Corp. Ltd. 2.20 CARE AAAMahanagar Telephone Nigam Ltd. 0.59 CRISIL AAA(SO)IOT Utkal Energy Services Ltd. 0.38 CRISIL AAA(SO)IOT Utkal Energy Services Ltd. 0.35 CRISIL AAA(SO)Indiabulls Housing Finance Ltd. 0.23 BRICKWORK AAALIC Housing Finance Ltd. 0.14 CRISIL AAAIOT Utkal Energy Services Ltd. 0.10 CRISIL AAA(SO)Zero Coupon BondEdelweiss Financial Services Ltd. 1.73 ICRA AAJM Financial Products Ltd. 0.74 ICRA AAGovernment Bond And Treasury Bill
0.00
State Government Of Andhra Pradesh
0.00 SOVEREIGN
Fixed Deposits 0.93HDFC Bank Ltd. 0.93Cash & Current Assets 9.20Total 100.00

12
Fund Details
Investment Objective: The primary investment objective of the scheme is to generate long-term capital growth from a diversified portfolio of units of overseas mutual funds.
Fund Manager: Mr. Alok Agarwal (Over 15 years of experience in equity market & Finance).
Underlying Fund: UBI SICAV Euro Equity
Benchmark: MSCI EMU Index
Option: Dividend (Payout/Reinvestment) and Growth.
Quarterly (Jul-Sept 2018) Average AUM (` in Cr): 4.38
Monthly Average AUM (` in Cr): 4.39
AUM as on 28/09/2018 (` in Cr): 4.46
NAV: Regular Plan Direct Plan
Growth ` 15.00 ` 15.87
Dividend ` 13.79 ` 12.14
The investors will be bearing the recurring expenses of the scheme, in addition to the expenses of the underlying scheme.
Load Structure$: Entry Load: NA. Exit Load: 1% if redeemed/switched out within 12 months of allotment.$No exit load will be charged for switches and STP from any scheme to the equity schemes of DPMF (except DHFL Pramerica Arbitrage Fund).
Portfolio of DHFL Pramerica Euro Equity Fund as of September 28, 2018
Issuer % to Net Assets
UBI SICAV Euro Equity E Cap 100.35
Cash & Current Assets -0.35
Total 100.00
DHFL Pramerica Euro Equity Fund (DPEEF)(Formerly known as DHFL Pramerica Top Eurland Offshore Fund)(An open ended fund of fund scheme investing in UBI SICAV Euro Equity)
Details as on September 28, 2018
This product is suitable for investors who are seeking*• Capital growth over the long term• Investment in units of overseas mutual funds
having diversified portfolio.• Degree of risk – HIGH* Investors should consult their financial advisers if in doubt about whether the product is suitable for them.
Moderate
Moderately
Low
Low
ModeratelyHigh
High
LOW HIGH
High — investors understand that their principal will be at high risk.
Regular Plan and Direct Plan are available for subscription as per the below details
Inception Date: Regular Plan: 11/09/2007, Direct Plan: 01/01/2013. Application Amount: ` 5000/- and in multiples of ̀ 1/- thereafter. Additional Purchase Amount: ̀ 1000/- and in multiples of ̀ 1/- thereafter or 100 units. Repurchase / Redemption Amount: Minimum of ` 100/- and in multiples of ` 1/- thereafter or 0.1 unit or account balance whichever is lower. SIP/STP/SWP: Available. Investment Amount for SIP/STP/SWP: SIP/STP: Monthly: 10 installments of ` 500/- each and in multiples of ` 100/- thereafter. Quarterly: 5 installments of ` 1000/- each and in multiples of ` 100/- thereafter. SWP (Monthly and Quarterly): 2 (two) installments of ` 100/-
Performance (CAGR)Fund MSCI EMU Index^ Nifty 50 TR Index #
Period Returns (%) Value (INR)* Returns (%) Value (INR)* Returns (%) Value (INR)*
Regular Plan - Growth Option
Last 1 Year 10.78 11,078.29 9.44 10,943.94 13.43 11,342.51
Last 3 Years 7.87 12,552.30 12.98 14,420.55 13.41 14,585.11
Last 5 Years 4.02 12,176.64 7.31 14,235.24 14.79 19,941.43
Since Inception 3.74 15,000.00 5.68 18,414.11 9.65 27,694.91
Direct Plan - Growth Option
Last 1 Year 12.55 11,255.32 9.44 10,943.94 13.43 11,342.51
Last 3 Years 9.10 12,986.91 12.98 14,420.55 13.41 14,585.11
Last 5 Years 5.06 12,800.12 7.31 14,235.24 14.79 19,941.43
Since Inception (CAGR) 8.29 15,798.17 12.19 19,357.98 12.59 19,754.85
Date of Inception: Regular Plan: September 11, 2007; Direct Plan: January 01, 2013. CAGR – Compounded Annual Growth Rate
^ Scheme Benchmark. # Standard Benchmark. *Based on standard investment of ̀ 10,000 made at the beginning of the relevant period. Past performance may or may not be sustained in future and should not be used as a basis for comparison with other investments.
W.e.f. October 30, 2017 the underlying fund of the scheme has been changed.
Alok Agarwal is managing this fund since July 27, 2017.
For performance of schemes managed by Alok Agarwal refer page no. 7, 11, 12, 13, 15, 18, 31
Different plans have a different expense structure. For Total Expense Ratio as on September 28, 2018 refer page no. 30
Dividend History - Regular PlanRecord Date Dividend per unit (`)# NAV (`)
26-Sept-14 1.00 12.21
# On face value of ` 10. Post Dividend per unit NAV will fall to the extent of the payout and applicable tax/surcharges/cess/other statutory levies. Dividend distribution is subject to availability of distributable surplus. Past Performance may or may not be sustained in future.
DHFL Pramerica Top Euroland Offshore Fund has undergone change in its fundamental attributes. In addition to changing its name to DHFL Pramerica Euro Equity Fund, the fund has also changed its underlying fund from Deutsche Invest I Top Euroland to UBI SICAV Euro Equity effective from October 30, 2017.
Top Ten Holdings of UBI SICAV Euro Equity (Underlying Fund) as of August 31, 2018
Sector Ending Weight (% of equity)
Total SA 5.20
Sampo OYJ-A SHS 5.02
Prysmiam SPA 4.15
Siemens AG-REG 3.91
Anheuser Bursch Inbev SA/NV 3.30
Nokia OYJ 3.27
SAP 3.25
Deutsche Telekom AG-REG 3.24
Unicredit SPA 2.85
Nordea Bank AB-FDR 2.61
Geographic Distribution of UBI SICAV Euro Equity (Underlying Fund) as of August 31, 2018
Country %
Italy 23.06
Germany 22.78
France 17.21
Finland 8.42
Holland 4.57
Spain 4.55
Belgium 3.34
Great Britain 3.22
USA 3.03
Others 6.33

13
Fund Details
Investment Objective: The primary investment objective of the scheme is to generate long-term capital growth by investing predominantly in units of overseas mutual funds, focusing on agriculture and/or would be direct and indirect beneficiaries of the anticipated growth in the agriculture and/or affiliated/allied sectors.
Fund Manager: Mr. Alok Agarwal (Over 15 years of experience in equity market & Finance).
Underlying Fund: Deutsche Invest I Global Agribusiness
Benchmark: MSCI World Index
Option: Dividend (Payout/Reinvestment) and Growth.
Quarterly (Jul-Sept 2018) Average AUM (` in Cr): 7.32
Monthly Average AUM (` in Cr): 7.53
AUM as on 28/09/2018 (` in Cr): 7.49
NAV Regular Plan Direct Plan
Growth ` 17.83 ` 18.83
Dividend ` 16.71 ` 18.83
The investors will be bearing the recurring expenses of the scheme, in addition to the expenses of the underlying scheme.
Load Structure$: Entry Load: NA. Exit Load: 1% if redeemed/switched out within 12 months of allotment.$No exit load will be charged for switches and STP from any scheme to the equity schemes of DPMF (except DHFL Pramerica Arbitrage Fund).
Portfolio of DHFL Pramerica Global Agribusiness Offshore Fund as of September 28, 2018
Issuer % to Net Assets
Deutsche Invest I Global Agribusiness 97.75
Net Cash & Current Assets 2.25
Total 100.00
Top Ten Holdings of Deutsche Invest I Global Agribusiness (Underlying Fund) as of August 31, 2018
Security Ending Weight (% of equity)
CF Industries Holdings Inc 5.4
Nutrien Ltd 4.6
DowDuPont Inc 4.0
FMC Corp 3.7
Yara International ASA 3.7
Hormel Foods Corp 3.6
Archer-Daniels-Midland Co 3.5
Koninklijke DSM NV 3.1
Canadian Pacific Railway Ltd 3.1
Unilever NV 2.8
Top Ten Geographic Distribution of Deutsche Invest I Global Agribusiness (Underlying Fund) as of August 31, 2018
Country %
United States 38.4
Netherlands 12.8
Germany 10.8
Canada 9.5
Norway 4.5
Brazil 4.3
Japan 3.5
France 3.1
Great Britain 2.3
Finland 2.1
DHFL Pramerica Global Agribusiness Offshore Fund (DPGAOF)(An open ended fund of fund scheme investing in Deutsche Invest I Global Agribusiness)
Details as on September 28, 2018
This product is suitable for investors who are seeking*• Capital growth over the long term• Investment in units of overseas mutual funds that
invest in equity securities of companies in Agriculture and related businesses.
• Degree of risk – HIGH* Investors should consult their financial advisers if in doubt about whether the product is suitable for them.
Moderate
Moderately
Low
Low
ModeratelyHigh
High
LOW HIGH
High — investors understand that their principal will be at high risk.
Regular Plan and Direct Plan are available for subscription as per the below details
Inception Date: Regular Plan: 14/05/2010, Direct Plan: 01/01/2013. Application Amount: ` 5000/- and in multiples of ̀ 1/- thereafter. Additional Purchase Amount: ̀ 1000/- and in multiples of ̀ 1/- thereafter or 100 units. Repurchase / Redemption Amount: Minimum of ` 100/- and in multiples of ` 1/- thereafter or 0.1 unit or account balance whichever is lower. SIP/STP/SWP: Available. Investment Amount for SIP/STP/SWP: SIP/STP: Monthly: 10 installments of ` 500/- each and in multiples of ` 100/- thereafter. Quarterly: 5 installments of ` 1000/- each and in multiples of ` 100/- thereafter. SWP (Monthly and Quarterly): 2 (two) installments of ` 100/-
Dividend HistoryRegular Plan Direct Plan
Record Date
Dividend/unit (`)#
NAV (`) Dividend/unit (`)#
NAV (`)
18-Mar-14 1.00 15.94 — —
# On face value of ` 10. Post Dividend per unit NAV will fall to the extent of the payout and applicable tax/surcharges/cess/other statutory levies. Dividend distribution is subject to availability of distributable surplus. Past Performance may or may not be sustained in future.
Performance (CAGR)Fund MSCI World Index^ Nifty 50 TR Index #
Period Returns (%) Value (INR)* Returns (%) Value (INR)* Returns (%) Value (INR)*
Regular Plan - Growth Option
Last 1 Year 18.24 11,823.61 23.84 12,383.59 13.43 11,342.51
Last 3 Years 8.97 12,939.04 17.58 16,254.32 13.41 14,585.11
Last 5 Years 2.80 11,481.87 12.27 17,841.47 14.79 19,941.43
Since Inception 7.14 17,833.37 16.88 36,982.98 10.71 23,464.88
Direct Plan - Growth Option
Last 1 Year 20.17 12,016.59 23.84 12,383.59 13.43 11,342.51
Last 3 Years 10.20 13,383.08 17.58 16,254.32 13.41 14,585.11
Last 5 Years 3.77 12,033.17 12.27 17,841.47 14.79 19,941.43
Since Inception 4.97 13,213.99 16.68 24,254.01 12.59 19,754.85
Date of Inception: Regular Plan: May 14, 2010; Direct Plan: January 01, 2013. CAGR – Compounded Annual Growth Rate^ Scheme Benchmark. # Standard Benchmark. *Based on standard investment of ̀ 10,000 made at the beginning of the relevant period. Past performance may or may not be sustained in future and should not be used as a basis for comparison with other investments.Alok Agarwal is managing this fund since July 27, 2017.For performance of schemes managed by Alok Agarwal refer page no. 7, 11, 12, 13, 15, 18, 31Different plans have a different expense structure. For Total Expense Ratio as on September 28, 2018 refer page no. 30
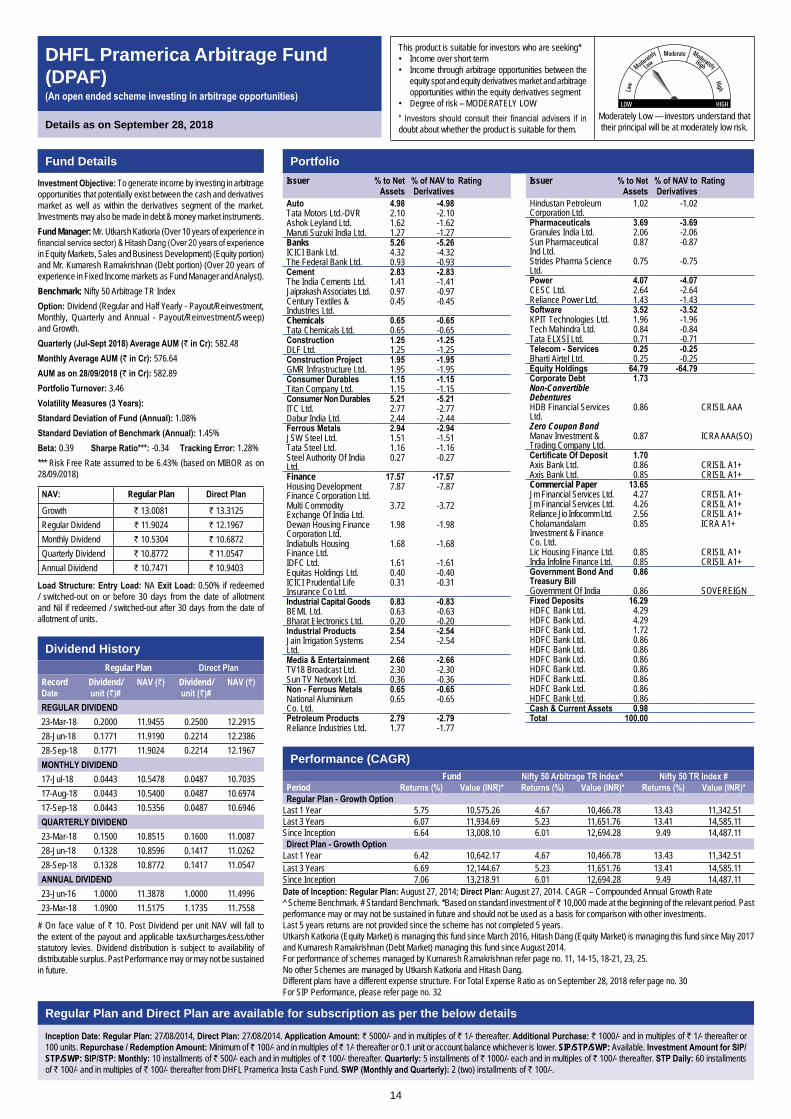
14
Fund Details
Investment Objective: To generate income by investing in arbitrage opportunities that potentially exist between the cash and derivatives market as well as within the derivatives segment of the market. Investments may also be made in debt & money market instruments.Fund Manager: Mr. Utkarsh Katkoria (Over 10 years of experience in financial service sector) & Hitash Dang (Over 20 years of experience in Equity Markets, Sales and Business Development) (Equity portion) and Mr. Kumaresh Ramakrishnan (Debt portion) (Over 20 years of experience in Fixed Income markets as Fund Manager and Analyst).Benchmark: Nifty 50 Arbitrage TR IndexOption: Dividend (Regular and Half Yearly - Payout/Reinvestment, Monthly, Quarterly and Annual - Payout/Reinvestment/Sweep) and Growth.Quarterly (Jul-Sept 2018) Average AUM (` in Cr): 582.48Monthly Average AUM (` in Cr): 576.64AUM as on 28/09/2018 (` in Cr): 582.89Portfolio Turnover: 3.46Volatility Measures (3 Years):Standard Deviation of Fund (Annual): 1.08%Standard Deviation of Benchmark (Annual): 1.45%Beta: 0.39 Sharpe Ratio***: -0.34 Tracking Error: 1.28%*** Risk Free Rate assumed to be 6.43% (based on MIBOR as on 28/09/2018)
NAV: Regular Plan Direct Plan
Growth ` 13.0081 ` 13.3125Regular Dividend ` 11.9024 ` 12.1967Monthly Dividend ` 10.5304 ` 10.6872Quarterly Dividend ` 10.8772 ` 11.0547Annual Dividend ` 10.7471 ` 10.9403
Load Structure: Entry Load: NA Exit Load: 0.50% if redeemed / switched-out on or before 30 days from the date of allotment and Nil if redeemed / switched-out after 30 days from the date of allotment of units.
Portfolio
DHFL Pramerica Arbitrage Fund (DPAF)(An open ended scheme investing in arbitrage opportunities)
Details as on September 28, 2018
This product is suitable for investors who are seeking*• Income over short term• Income through arbitrage opportunities between the
equity spot and equity derivatives market and arbitrage opportunities within the equity derivatives segment
• Degree of risk – MODERATELY LOW* Investors should consult their financial advisers if in doubt about whether the product is suitable for them.
Moderate
Moderately
Low
Low
ModeratelyHigh
High
LOW HIGH
Moderately Low — investors understand that their principal will be at moderately low risk.
Regular Plan and Direct Plan are available for subscription as per the below details
Inception Date: Regular Plan: 27/08/2014, Direct Plan: 27/08/2014. Application Amount: ` 5000/- and in multiples of ` 1/- thereafter. Additional Purchase: ` 1000/- and in multiples of ` 1/- thereafter or 100 units. Repurchase / Redemption Amount: Minimum of ` 100/- and in multiples of ` 1/- thereafter or 0.1 unit or account balance whichever is lower. SIP/STP/SWP: Available. Investment Amount for SIP/STP/SWP: SIP/STP: Monthly: 10 installments of ` 500/- each and in multiples of ` 100/- thereafter. Quarterly: 5 installments of ` 1000/- each and in multiples of ` 100/- thereafter. STP Daily: 60 installments of ` 100/- and in multiples of ` 100/- thereafter from DHFL Pramerica Insta Cash Fund. SWP (Monthly and Quarterly): 2 (two) installments of ` 100/-.
Performance (CAGR)Fund Nifty 50 Arbitrage TR Index^ Nifty 50 TR Index #
Period Returns (%) Value (INR)* Returns (%) Value (INR)* Returns (%) Value (INR)*Regular Plan - Growth Option
Last 1 Year 5.75 10,575.26 4.67 10,466.78 13.43 11,342.51 Last 3 Years 6.07 11,934.69 5.23 11,651.76 13.41 14,585.11 Since Inception 6.64 13,008.10 6.01 12,694.28 9.49 14,487.11 Direct Plan - Growth Option
Last 1 Year 6.42 10,642.17 4.67 10,466.78 13.43 11,342.51 Last 3 Years 6.69 12,144.67 5.23 11,651.76 13.41 14,585.11 Since Inception 7.06 13,218.91 6.01 12,694.28 9.49 14,487.11 Date of Inception: Regular Plan: August 27, 2014; Direct Plan: August 27, 2014. CAGR – Compounded Annual Growth Rate^ Scheme Benchmark. # Standard Benchmark. *Based on standard investment of ̀ 10,000 made at the beginning of the relevant period. Past performance may or may not be sustained in future and should not be used as a basis for comparison with other investments.Last 5 years returns are not provided since the scheme has not completed 5 years.Utkarsh Katkoria (Equity Market) is managing this fund since March 2016, Hitash Dang (Equity Market) is managing this fund since May 2017 and Kumaresh Ramakrishnan (Debt Market) managing this fund since August 2014.For performance of schemes managed by Kumaresh Ramakrishnan refer page no. 11, 14-15, 18-21, 23, 25. No other Schemes are managed by Utkarsh Katkoria and Hitash Dang.Different plans have a different expense structure. For Total Expense Ratio as on September 28, 2018 refer page no. 30For SIP Performance, please refer page no. 32
Dividend HistoryRegular Plan Direct Plan
Record Date
Dividend/unit (`)#
NAV (`) Dividend/unit (`)#
NAV (`)
REGULAR DIVIDEND23-Mar-18 0.2000 11.9455 0.2500 12.291528-Jun-18 0.1771 11.9190 0.2214 12.238628-Sep-18 0.1771 11.9024 0.2214 12.1967MONTHLY DIVIDEND17-Jul-18 0.0443 10.5478 0.0487 10.703517-Aug-18 0.0443 10.5400 0.0487 10.697417-Sep-18 0.0443 10.5356 0.0487 10.6946QUARTERLY DIVIDEND23-Mar-18 0.1500 10.8515 0.1600 11.008728-Jun-18 0.1328 10.8596 0.1417 11.026228-Sep-18 0.1328 10.8772 0.1417 11.0547ANNUAL DIVIDEND23-Jun-16 1.0000 11.3878 1.0000 11.499623-Mar-18 1.0900 11.5175 1.1735 11.7558
# On face value of ` 10. Post Dividend per unit NAV will fall to the extent of the payout and applicable tax/surcharges/cess/other statutory levies. Dividend distribution is subject to availability of distributable surplus. Past Performance may or may not be sustained in future.
Issuer % to Net Assets
% of NAV to Derivatives
Rating
Auto 4.98 -4.98Tata Motors Ltd.-DVR 2.10 -2.10Ashok Leyland Ltd. 1.62 -1.62Maruti Suzuki India Ltd. 1.27 -1.27Banks 5.26 -5.26ICICI Bank Ltd. 4.32 -4.32The Federal Bank Ltd. 0.93 -0.93Cement 2.83 -2.83The India Cements Ltd. 1.41 -1.41Jaiprakash Associates Ltd. 0.97 -0.97Century Textiles & Industries Ltd.
0.45 -0.45
Chemicals 0.65 -0.65Tata Chemicals Ltd. 0.65 -0.65Construction 1.25 -1.25DLF Ltd. 1.25 -1.25Construction Project 1.95 -1.95GMR Infrastructure Ltd. 1.95 -1.95Consumer Durables 1.15 -1.15Titan Company Ltd. 1.15 -1.15Consumer Non Durables 5.21 -5.21ITC Ltd. 2.77 -2.77Dabur India Ltd. 2.44 -2.44Ferrous Metals 2.94 -2.94JSW Steel Ltd. 1.51 -1.51Tata Steel Ltd. 1.16 -1.16Steel Authority Of India Ltd.
0.27 -0.27
Finance 17.57 -17.57Housing Development Finance Corporation Ltd.
7.87 -7.87
Multi Commodity Exchange Of India Ltd.
3.72 -3.72
Dewan Housing Finance Corporation Ltd.
1.98 -1.98
Indiabulls Housing Finance Ltd.
1.68 -1.68
IDFC Ltd. 1.61 -1.61Equitas Holdings Ltd. 0.40 -0.40ICICI Prudential Life Insurance Co Ltd.
0.31 -0.31
Industrial Capital Goods 0.83 -0.83BEML Ltd. 0.63 -0.63Bharat Electronics Ltd. 0.20 -0.20Industrial Products 2.54 -2.54Jain Irrigation Systems Ltd.
2.54 -2.54
Media & Entertainment 2.66 -2.66TV18 Broadcast Ltd. 2.30 -2.30Sun TV Network Ltd. 0.36 -0.36Non - Ferrous Metals 0.65 -0.65National Aluminium Co. Ltd.
0.65 -0.65
Petroleum Products 2.79 -2.79Reliance Industries Ltd. 1.77 -1.77
Issuer % to Net Assets
% of NAV to Derivatives
Rating
Hindustan Petroleum Corporation Ltd.
1.02 -1.02
Pharmaceuticals 3.69 -3.69Granules India Ltd. 2.06 -2.06Sun Pharmaceutical Ind Ltd.
0.87 -0.87
Strides Pharma Science Ltd.
0.75 -0.75
Power 4.07 -4.07CESC Ltd. 2.64 -2.64Reliance Power Ltd. 1.43 -1.43Software 3.52 -3.52KPIT Technologies Ltd. 1.96 -1.96Tech Mahindra Ltd. 0.84 -0.84Tata ELXSI Ltd. 0.71 -0.71Telecom - Services 0.25 -0.25Bharti Airtel Ltd. 0.25 -0.25Equity Holdings 64.79 -64.79Corporate Debt 1.73Non-Convertible DebenturesHDB Financial Services Ltd.
0.86 CRISIL AAA
Zero Coupon BondManav Investment & Trading Company Ltd.
0.87 ICRA AAA(SO)
Certificate Of Deposit 1.70Axis Bank Ltd. 0.86 CRISIL A1+Axis Bank Ltd. 0.85 CRISIL A1+Commercial Paper 13.65Jm Financial Services Ltd. 4.27 CRISIL A1+Jm Financial Services Ltd. 4.26 CRISIL A1+Reliance Jio Infocomm Ltd. 2.56 CRISIL A1+Cholamandalam Investment & Finance Co. Ltd.
0.85 ICRA A1+
Lic Housing Finance Ltd. 0.85 CRISIL A1+India Infoline Finance Ltd. 0.85 CRISIL A1+Government Bond And Treasury Bill
0.86
Government Of India 0.86 SOVEREIGNFixed Deposits 16.29HDFC Bank Ltd. 4.29HDFC Bank Ltd. 4.29HDFC Bank Ltd. 1.72HDFC Bank Ltd. 0.86HDFC Bank Ltd. 0.86HDFC Bank Ltd. 0.86HDFC Bank Ltd. 0.86HDFC Bank Ltd. 0.86HDFC Bank Ltd. 0.86HDFC Bank Ltd. 0.86Cash & Current Assets 0.98Total 100.00

15
Fund Details
Investment Objective: The investment objective of the scheme is to provide capital appreciation and income distribution to the investors by using equity and equity related instruments, arbitrage opportunities and investments in debt and money market instruments.Fund Manager: Mr. Alok Agarwal (Equity portion) (Over 15 years of experience in equity market & Finance) and Mr. Kumaresh Ramakrishnan (Debt portion) (Over 20 years of experience in Fixed Income Market as a Fund Manager and Analyst)Benchmark: 70% of the NIFTY 50 Arbitrage TR Index and 30% of the NIFTY 50 TR IndexOption: Dividend (Regular, Monthly, Quarterly, Half Yearly and Annual - Payout/Reinvestment) and Growth.Quarterly (Jul-Sept 2018) Average AUM (` in Cr): 28.93Monthly Average AUM (` in Cr): 30.14AUM as on 28/09/2018 (` in Cr): 30.28Portfolio Turnover: 0.53 (For Equity)For Debt part of the Portfolio:Average Maturity: 0.66 yrs Modified Duration: 0.82 yrsPortfolio Yield: 8.23%
Volatility Measures (6 Years):Standard Deviation of Fund (Annual): 3.88%Standard Deviation of Benchmark (Annual): 17.74%Beta: 0.10 Sharpe Ratio***: 0.57 Tracking Error: 16.30%*** Risk Free Rate assumed to be 6.43% (based on MIBOR as on 28/09/2018)NAV Regular Plan Direct PlanGrowth ` 30.5129 ` 32.3862Monthly Dividend ` 11.2990 ` 11.7785Quarterly Dividend ` 11.1856 ` 11.8822Annual Dividend ` 14.7966 ` 14.9509
Load Structure$: Entry Load: NA Exit Load: 10% of the units allotted may be redeemed without any exit load on or before 12 months from the date of allotment; Any redemptions / switch outs in excess of the above mentioned limit would be subject to an exit load of 1%, if the units are redeemed /switched out on or before completion of 12 months from the date of allotment of units; Nil - If the units are redeemed / switched out after completion of 12 months from the date of allotment of units.$ No exit load will be charged for switches and STP between equity schemes. No exit load will be charged for switches and STP from equity schemes to DHFL Pramerica Hybrid Debt Fund/ DHFL Pramerica Credit Risk Fund/ DHFL Pramerica Short Maturity Fund.
PortfolioIssuer % to Net
Assets% of NAV to Derivatives
Rating
Banks 13.98 -1.41HDFC Bank Ltd. 8.61ICICI Bank Ltd. 2.72 -1.41Kotak Mahindra Bank Ltd. 2.64Cement 6.57 -6.57Century Textiles & Industries Ltd.
6.57 -6.57
Construction Project 2.12 -1.29Larsen & Toubro Ltd. 2.12 -1.29Consumer Non Durables 3.64ITC Ltd. 3.64Ferrous Metals 8.32 -8.32JSW Steel Ltd. 8.32 -8.32Finance 1.29HDFC Standard Life Insurance Co Ltd.
1.20
HDFC Asset Management Company Ltd.
0.09
Industrial Capital Goods 1.01 -1.01BEML Ltd. 1.01 -1.01Industrial Products 0.47Swaraj Engines Ltd. 0.47Media & Entertainment 2.03 -2.03Sun TV Network Ltd. 2.03 -2.03Petroleum Products 3.32Reliance Industries Ltd. 3.32Pharmaceuticals 15.56 -7.07Sun Pharmaceutical Ind Ltd.
9.08 -7.07
DHFL Pramerica Equity Savings Fund (DPESF)(Formerly known as DHFL Pramerica Equity Income Fund)(An Open Ended Scheme investing in equity, arbitrage and debt)
Details as on September 28, 2018
This product is suitable for investors who are seeking*• Capital appreciation and Income distribution over the
medium term• Investment primarily in equity and equity related
securities and a small allocation to debt securities• Degree of risk – MODERATELY HIGH* Investors should consult their financial advisers if in doubt about whether the product is suitable for them.
Moderate
Moderately
Low
Low
ModeratelyHigh
High
LOW HIGH
Moderately High — investors understand that their principal will be at moderately high risk.
Regular Plan and Direct Plan are available for subscription as per the below details
Inception Date: Regular Plan: 29/01/2004, Direct Plan: 01/01/2013. Application Amount: Minimum of ` 5000/- and in multiples of ` 1/- thereafter. Additional Purchase: Minimum of ` 1000/- and in multiples of ̀ 1/- thereafter or 100 units. Repurchase / Redemption Amount: Minimum of ̀ 100/- and in multiples of ̀ 1/- thereafter or 0.1 unit or account balance whichever is lower. SIP/STP/SWP: Available. Investment Amount for SIP/STP: SIP/STP: Monthly: 10 installments of ` 500/- each and in multiples of ` 100/- thereafter. Quarterly: 5 installments of ` 1000/- each and in multiples of ` 100/- thereafter. STP Daily: 60 installments of ` 100/- and in multiples of ` 100/- thereafter from DHFL Pramerica Insta Cash Fund. SWP (Monthly and Quarterly): 2 (two) installments of ` 100/-.
Dividend HistoryRegular Plan Direct Plan
Record Date
Dividend/unit (`)#
NAV (`) Dividend/unit (`)#
NAV (`)
MONTHLY DIVIDEND17-Jul-18 0.0708 11.5983 0.0753 12.074417-Aug-18 0.0708 11.6852 0.0753 12.172217-Sep-18 0.0708 11.5127 0.0753 11.9998QUARTERLY DIVIDEND23-Mar-18 0.3821 11.3122 0.3884 11.934202-Jul-18 0.1948 11.2748 0.1948 11.938428-Sep-18 0.1948 11.1856 0.1948 11.8822ANNUAL DIVIDEND28-Mar-14 0.4800 12.0200 — —26-Sept-14 0.9000 12.2533 — —23-Mar-18 1.4233 15.6000 1.4300 15.6900
# On face value of ` 10. Post Dividend per unit NAV will fall to the extent of the payout and applicable tax/surcharges/cess/other statutory levies. Dividend distribution is subject to availability of distributable surplus. Past Performance may or may not be sustained in future.
Performance (CAGR)Fund 70% of the NIFTY 50 Arbitrage TR Index
and 30% of the NIFTY 50 TR Index ^Nifty 50 TR Index #
Period Returns (%) Value (INR)* Returns (%) Value (INR)* Returns (%) Value (INR)*Regular Plan - Growth Option
Last 1 Year 7.24 10,724.15 6.83 10,683.35 13.43 11,342.51 Last 3 Years 7.06 12,272.41 7.68 12,484.56 13.41 14,585.11 Last 5 Years 9.81 15,968.40 9.06 15,431.99 14.79 19,941.43 Since Inception 7.90 30,468.45 NA NA 14.58 73,490.62 Direct Plan - Growth Option
Last 1 Year 8.62 10,862.49 6.83 10,683.35 13.43 11,342.51 Last 3 Years 8.23 12,677.90 7.68 12,484.56 13.41 14,585.11 Last 5 Years 10.96 16,824.86 9.06 15,431.99 14.79 19,941.43 Since Inception 9.58 16,907.06 8.49 15,969.74 12.59 19,754.85
Date of Inception: Regular Plan: January 29, 2004; Direct Plan: January 01, 2013. CAGR – Compounded Annual Growth Rate^ Scheme Benchmark. # Standard Benchmark. *Based on standard investment of ̀ 10,000 made at the beginning of the relevant period. Past performance may or may not be sustained in future and should not be used as a basis for comparison with other investments.The benchmark of the scheme has been changed from 75% of CRISIL Liquid Fund Index and 25% in Nifty 50 to 70% of the NIFTY 50 Arbitrage Index and 30% of the NIFTY 50 Index w.e.f. September 13, 2017, pursuant to change in fundamental attributes of the scheme.Alok Agarwal (Equity Portion) is managing this fund since August 2016 and Kumaresh Ramakrishnan (Debt Portion) is managing this fund since April 05, 2018.For performance of schemes managed by Alok Agarwal refer page no. 7, 11, 12, 13, 15, 18, 31For performance of schemes managed by Kumaresh Ramakrishnan refer page no. 11, 14-15, 18-21, 23, 25Different plans have a different expense structure. For Total Expense Ratio as on September 28, 2018 refer page no. 30NA - Not AvailableFor SIP Performance, please refer page no. 32
Issuer % to Net Assets
% of NAV to Derivatives
Rating
Lupin Ltd. 2.23Cipla Ltd. 2.16Dr. Reddy's Laboratories Ltd.
2.09
Software 6.35HCL Technologies Ltd. 2.51Infosys Ltd. 1.93Tata Elxsi Ltd. 1.91Equity Holdings 64.64 -27.70Corporate Debt 14.24Non-Convertible DebenturesSBI Cards & Payment Services Pvt. Ltd.
6.39 CRISIL AAA
HDB Financial Services Ltd.
4.91 CRISIL AAA
Bajaj Finance Ltd. 1.31 FITCH AAAVedanta Ltd. 0.64 CRISIL AAZero Coupon BondEdelweiss Commodities Services Ltd.
0.99 ICRA AA
Fixed Deposits 9.88HDFC Bank Ltd. 6.61HDFC Bank Ltd. 3.27Cash & Current Assets 11.24Total 100.00

16
Sche
me N
ame
DHFL
Pra
mer
ica H
ybrid
Deb
t Fun
dDH
FL P
ram
erica
Inst
a Cas
h Fu
ndDH
FL P
ram
erica
Ultr
a Sho
rt Te
rm
Fund
DHFL
Pra
mer
ica L
ow D
urat
ion
Fund
DHFL
Pra
mer
ica F
loat
ing
Rate
Fun
dDH
FL P
ram
erica
Sho
rt Ma
turit
y Fun
d
Idea
l Inve
stm
ent H
orizo
n $
2 Yea
rs+1 D
ay3 M
onths
+6 M
onths
+3 M
onths
+1 Y
ear+
Ince
ptio
n Da
teRe
gular
Plan
: 02/1
1/200
7;
Dire
ct P
lan: 0
1/01/2
013
Regu
lar P
lan: 0
5/09/2
007;
Dire
ct P
lan: 0
1/01/2
013
Regu
lar P
lan: 1
8/11/2
008;
Dire
ct P
lan: 0
1/01/2
013
Regu
lar P
lan: 2
2/06/2
007;
Dire
ct P
lan: 0
1/01/2
013
Regu
lar P
lan: 0
9/10/2
009;
Dire
ct P
lan: 0
1/01/2
013
Regu
lar P
lan: 2
1/01/2
003;
Dire
ct P
lan: 0
1/01/2
013
Fund
Man
ager
Alok
Ag
arwa
l (E
quity
Po
rtion)
is
mana
ging
sinch
Au
gust
2016
an
d Ku
mare
sh R
amak
rishn
an (D
ebt P
ortio
n)
is ma
nagin
g sinc
e Apr
il 05,
2018
.
Kurm
ares
h Ra
makri
shna
n is
mana
ging
since
Jan
uary
2011
and
Kun
al Ja
in is
Mana
ging s
ince J
anua
ry 20
18
Kuma
resh
Ram
akris
hnan
is m
anag
ing
since
Jan
uary
2011
and
Kun
al Ja
in is
mana
ging s
ince J
anua
ry 20
18
Kuma
resh
Ram
akris
hnan
is m
anag
ing
since
Aug
ust 2
008.
Rake
sh S
uri is
man
aging
sinc
e Ja
nuar
y 20
17 a
nd P
unee
t Pal
is ma
nagin
g sin
ce
Dece
mber
2017
Pune
et Pa
l is m
anag
ing si
nce D
ecem
ber
2017
and
Kum
ares
h Ra
makri
shna
n is
mana
ging s
ince D
ecem
ber 2
017
Benc
hmar
kCR
ISIL
Hybr
id 85
+ 15
Con
serva
tive
Index
CRIS
IL Liq
uid F
und I
ndex
CRIS
IL Liq
uid F
und I
ndex
CRIS
IL Lo
w Du
ratio
n Deb
t Inde
xCR
ISIL
Low
Dura
tion D
ebt In
dex
CRIS
IL Sh
ort T
erm
Bond
Fun
d Ind
ex
Fund
Det
ails a
s on
28 S
epte
mbe
r, 20
18Mo
nth
End
AUM
(in C
rore
s)20
.395,4
23.61
*1,4
23.29
669.1
239
3.35
1,124
.20Ma
caul
ay D
urat
ion
(mon
ths)
——
3.71
8.18
—13
.58Mo
difie
d Du
ratio
n (y
ears
)1.1
40.1
00.3
00.6
30.4
71.0
6Av
erag
e Mat
urity
(yea
rs)
0.46
0.11
0.32
0.70
0.27
1.23
Portf
olio
Yiel
d7.8
0%7.4
1%8.0
1%10
.15%
8.62%
9.93%
Com
posit
ion
by A
sset
s (%
) as o
n 28
Sep
tem
ber,
2018
Com
mer
cial P
aper
—70
.8335
.307.1
6—
6.60
Certi
ficat
e of D
epos
it—
11.95
6.16
—6.1
10.9
5PS
U Bo
nds
12.75
1.16
4.23
0.89
8.90
11.84
Bank
Fixe
d De
posit
—12
.395.9
73.7
4—
—Bi
ll Red
iscou
ntin
g—
——
——
—Tr
easu
ry B
ills—
18.80
——
——
Corp
orat
e Deb
t11
.510.1
530
.8884
.8333
.7774
.41Ca
sh &
Cur
rent
Ass
ets
54.11
-15.2
817
.363.3
851
.226.2
0CB
LO0.1
1—
0.10
——
—GO
I Sec
uriti
es—
——
——
—Re
vers
e Rep
o—
——
——
—Ba
nk B
onds
——
——
——
Equi
ties
21.52
——
——
—Co
mpo
sitio
n by
Rat
ings
(%) a
s on
28 S
epte
mbe
r, 20
18AA
A/A1
+/Sov
ereig
n &
equi
valen
ts73
.5910
0.00
92.02
34.54
100.0
052
.46AA
+4.8
9—
3.43
13.08
—19
.53AA
**—
—4.5
534
.36—
28.01
Othe
rs—
——
18.02
——
Equi
ty21
.52—
——
——
Othe
r Det
ails
Exit
Load
10%
of
the
units
all
otted
ma
y be
re
deem
ed w
ithou
t any
exit
load
with
in 1
year
from
the
date
of all
otmen
t; An
y re
demp
tions
/ s
witch
outs
in
exce
ss
of the
abo
ve m
entio
ned
limit
would
be
sub
ject t
o an
exit
load
of 1
.5%, i
f the
unit
s ar
e re
deem
ed /
switc
hed
out
withi
n 1
year
from
the
date
of all
otmen
t of
units
; Nil -
If th
e un
its a
re re
deem
ed /
switc
hed o
ut aft
er 1
year
from
the d
ate of
all
otmen
t of u
nits.
Nil
Nil
Nil
Nil
withi
n 6 m
onths
- 0.5
%
** AA
inclu
de se
curiti
es ra
ted as
AA
and A
A-. $
Inve
stors
shou
ld co
nsult
their
finan
cial a
dviso
r for
tax i
mplic
ation
s on t
heir i
nves
tmen
ts.* M
onth
End A
UM fo
r DHF
L Pra
meric
a Ins
ta Ca
sh F
und i
s as o
n 30th
Sep
tembe
r, 201
8.
DEB
T F
UN
DS
REC
KO
NER

17
Sche
me N
ame
DHFL
Pra
mer
ica B
ankin
g an
d PS
U De
bt F
und
DHFL
Pra
mer
ica C
redi
t Risk
Fu
ndDH
FL P
ram
erica
Dyn
amic
Bond
Fu
ndDH
FL P
ram
erica
Med
ium
Ter
m
Fund
DHFL
Pra
mer
ica P
rem
ier B
ond
DHFL
Pra
mer
ica G
ilt F
und
DHFL
Pra
mer
ica S
trate
gic
Debt
Fun
dId
eal In
vest
men
t Hor
izon
$1 Y
ear+
1 Yea
r+3 Y
ears+
2 Yea
rs+1 Y
ear+
3 Yea
rs+3 Y
ears+
Ince
ptio
n Da
teRe
gular
Plan
: 11/0
3/201
3;Di
rect
Plan
: 11/0
3/201
3Re
gular
Plan
: 29/0
9/201
4;Di
rect
Plan
: 29/0
9/201
4Re
gular
Plan
: 12/0
1/201
2;Di
rect
Plan
: 01/0
1/201
3Re
gular
Plan
: 06/0
3/201
4;Di
rect
Plan
: 06/0
3/201
4Re
gular
Plan
: 30/0
1/200
3;Di
rect
Plan
: 01/0
1/201
3Re
gular
Plan
: 27/1
0/200
8;Di
rect
Plan
: 01/0
1/201
3Re
gular
Plan
: 28/0
1/201
4;Di
rect
Plan
: 28/0
1/201
4Fu
nd M
anag
erPu
neet
Pal
is ma
nagin
g sin
ce
Dece
mber
2017
Kuma
resh
Ra
makri
shna
n is
mana
ging s
ince M
arch
2016
Pune
et Pa
l is
mana
ging
since
De
cemb
er 20
17Pu
neet
Pal
is ma
nagin
g sin
ce
Dece
mber
2017
Rake
sh S
uri i
s ma
nagin
g sin
ce
March
201
6 an
d Pu
neet
Pal i
s ma
nagin
g sinc
e Dec
embe
r 201
7
Pune
et Pa
l is
mana
ging
since
De
cemb
er 20
17Pu
neet
Pal
is ma
nagin
g sin
ce
Dece
mber
2017
Benc
hmar
kCR
ISIL
Shor
t Ter
m Bo
nd In
dex
CRIS
IL Co
mpos
ite A
A Sh
ort
Term
Bon
d Ind
exCR
ISIL
Comp
osite
Bon
d Fun
d Ind
exCR
ISIL
Comp
osite
Bon
d Fun
d Ind
exCR
ISIL
Comp
osite
Bon
d Fun
d Ind
exI-S
ec M
i-Bex
CRIS
IL Co
mpos
ite B
ond F
und
Index
Fund
Det
ails a
s on
28 S
epte
mbe
r, 20
18Mo
nth
End
AUM
(in C
rore
s)14
0.01
1,027
.0682
.2737
5.32
163.4
910
3.81
5.61
Maca
ulay
Dur
atio
n (m
onth
s)—
——
20.59
——
16.36
Modi
fied
Dura
tion
(yea
rs)
1.20
1.64
2.67
1.65
0.74
2.11
1.98
Aver
age M
atur
ity (y
ears
)1.3
72.0
92.2
42.0
00.8
32.0
11.7
1Po
rtfol
io Y
ield
8.72%
10.19
%8.6
3%9.1
7%8.5
5%8.4
1%8.2
4%Co
mpo
sitio
n by
Ass
ets (
%) a
s on
28 S
epte
mbe
r, 20
18Co
mm
ercia
l Pap
er2.6
12.3
5—
5.61
——
—Ce
rtific
ate o
f Dep
osit
9.67
3.49
—6.4
429
.21—
—PS
U Bo
nds
66.67
22.11
—25
.9718
.06—
—Ba
nk F
ixed
Depo
sit—
——
——
——
Bill R
edisc
ount
ing
——
——
——
—Tr
easu
ry B
ills—
——
——
32.31
—Co
rpor
ate D
ebt
16.58
63.90
22.57
50.43
23.72
—8.6
0Ca
sh &
Cur
rent
Ass
ets
3.63
8.15
53.58
6.47
26.90
17.62
46.34
CBLO
0.08
—0.0
40.0
12.1
10.0
30.4
0GO
I Sec
uriti
es—
—23
.815.0
7—
50.04
44.66
Reve
rse R
epo
——
——
——
—Ba
nk B
onds
0.76
——
——
——
Equi
ties
——
——
——
—Co
mpo
sitio
n by
Rat
ings
(%) a
s on
28 S
epte
mbe
r, 20
18AA
A/A1
+/Sov
ereig
n &
equi
valen
ts85
.0921
.8789
.8694
.3110
0.00
100.0
010
0.00
AA+
—12
.0410
.141.6
5—
——
AA**
14.91
51.81
—4.0
4—
——
Othe
rs—
14.28
——
——
—Eq
uity
——
——
——
—Ot
her D
etail
sEx
it Lo
adNi
l10
% o
f the
unit
s all
otted
may
be
red
eeme
d wi
thout
any
exit
load
withi
n 1
year
from
the
date
of all
otmen
t; An
y re
demp
tions
/
switc
h ou
ts in
exce
ss o
f the
ab
ove
menti
oned
limi
t wou
ld be
su
bject
to an
exit
load
of 1
%, i
f the
unit
s are
rede
emed
/ sw
itche
d ou
t with
in 1
year
from
the
date
of all
otmen
t of u
nits;
Nil -
If th
e un
its
are
rede
emed
/ sw
itche
d ou
t afte
r 1
year
from
the
date
of all
otmen
t of
units
.
withi
n 30 d
ays -
1%wi
thin 1
mon
th - 1
%Ni
lNi
lNi
l
** AA
inclu
de se
curiti
es ra
ted as
AA
and A
A-.
$ Inv
estor
s sho
uld co
nsult
their
finan
cial a
dviso
r for
tax i
mplic
ation
s on t
heir i
nves
tmen
ts.
DEB
T F
UN
DS
REC
KO
NER

18
Regular Plan and Direct Plan are available for subscription as per the below details
Inception Date: Regular Plan: 2/11/2007, Direct Plan: 01/01/2013. Application Amount: ̀ 5000/- and in multiples of ̀ 1/- thereafter. Additional Purchase Amount: ̀ 1000/- and in multiples of ̀ 1/- thereafter or 100 units. Repurchase / Redemption Amount: ` 100/- and in multiples of ` 1/- thereafter or 0.1 unit or account balance, whichever is lower. SIP/STP/SWP: Available. Investment Amount for SIP/STP/SWP: SIP/STP: Monthly: 10 installments of ` 500/- each and in multiples of ` 100/- thereafter. Quarterly: 5 installments of ` 1000/- each and in multiples of ` 100/- thereafter. SWP (Monthly/Quarterly): 2 (two) installments of ` 100/-.
DHFL Pramerica Hybrid Debt Fund (DPHDF)
(Formerly known as DHFL Pramerica Income Advantage Fund) (An Open Ended Hybrid Scheme investing predominantly in debt instruments)
Details as on September 28, 2018
This product is suitable for investors who are seeking*• Regular income and capital appreciation over the
medium term• Investment primarily in debt securities and a small
allocation to equity and equity related securities• Degree of risk – MODERATELY HIGH* Investors should consult their financial advisers if in doubt about whether the product is suitable for them.
Moderate
Moderately
Low
Low
ModeratelyHigh
High
LOW HIGH
Moderately High — investors understand that their principal will be at moderately high risk.
Fund Details
Investment Style Box:Debt Equity
Investment Objective: The objective of Scheme is to seek to generate returns through investment primarily in Debt and Money Market Instruments and to generate capital appreciation by investing in equity and equity related instruments.
Fund Manager: Mr. Kumaresh Ramakrishnan (Debt portion) (Over 20 years of experience in Fixed Income Market as a Fund Manager and Analyst) and Mr. Alok Agarwal (Equity portion) (Over 15 years of experience in equity market & Finance)
Benchmark: CRISIL Hybrid 85 + 15 Conservative Index##
Option: Dividend (Payout & Reinvestment) and Growth.
Quarterly (Jul-Sept 2018) Average AUM (` in Cr): 18.70
Monthly Average AUM (` in Cr): 20.45
AUM as on 28/09/2018 (` in Cr): 20.39
Portfolio Turnover: 0.90 (For Equity) Average Maturity: 0.46 yrs
Modified Duration: 1.14 yrs Portfolio Yield: 7.80%
Fund Manager’s Report: The exposure to debt securities will help to generate steady returns. The exposure to equity shares will help to capture growth.
NAV Regular Plan Direct PlanGrowth ` 21.6907 ` 23.2168Dividend ` 10.3757 —Monthly Dividend — ` 10.4100
Load Structure$: Entry Load: NA. Exit Load: 10% of the units allotted may be redeemed without any exit load within 1 year from the date of allotment; Any redemptions / switch outs in excess of the above mentioned limit would be subject to an exit load of 1.5%, if the units are redeemed / switched out within 1 year from the date of allotment of units; Nil - If the units are redeemed / switched out after 1 year from the date of allotment of units.$No exit load will be charged for switches and STP from any scheme to the equity schemes of DPMF (except DHFL Pramerica Arbitrage Fund). Further, exit load as per prevailing structure will be charged for switches and STP from one debt scheme to another debt scheme of DPMF.
Portfolio
Asset Allocation (%) Credit Quality Profile (%)
Issuer % to Net Assets
Rating
PSU Bonds 12.75Power Finance Corporation Ltd. 2.44 CRISIL AAAState Bank Of India 4.89 CARE AA+Rural Electrification Corporation Ltd. 2.01 CARE AAAExim Bank 1.97 CRISIL AAAIndian Railway Finance Corporation Ltd 1.44 CRISIL AAACorporate Debt 11.51LIC Housing Finance Ltd. 4.91 CRISIL AAASBI Cards And Payment Services 4.74 CRISIL AAABajaj Finance Ltd 0.95 CRISIL AAAKotak Mahindra Prime Ltd 0.91 CRISIL AAA
Issuer % to Net Assets
Rating
Equities 21.52HDFC Bank Ltd. 8.36Reliance Industries Ltd. 4.32Lupin Ltd. 2.25I T C Ltd. 2.03Infosys Limited 1.49HDFC Standard Life Insurance Co. Ltd 1.19Kotak Mahindra Bank Ltd. 0.95HCL Technologies Ltd. 0.85HDFC Asset Management Company Ltd 0.08CBLO 0.11Cash & Current Assets 54.11Total 100.00
Performance (CAGR)Fund CRISIL Hybrid 85 + 15
Conservative Index^CRISIL 10 Year
Gilt Index#Period Returns (%) Value (INR)* Returns (%) Value (INR)* Returns (%) Value (INR)*Regular Plan - Growth Option
Last 1 Year 6.68 10,668.31 2.00 10,200.15 -3.12 9,687.66 Last 3 Years 7.91 12,565.65 7.96 12,583.63 5.25 11,659.54 Last 5 Years 7.80 14,562.76 9.99 16,101.75 6.89 13,955.65 Since Inception 7.35 21,690.70 7.67 22,400.21 6.17 19,222.87 Direct Plan - Growth Option
Last 1 Year 8.99 10,898.68 2.00 10,200.15 -3.12 9,687.66 Last 3 Years 9.47 13,119.36 7.96 12,583.63 5.25 11,659.54 Last 5 Years 9.12 15,477.75 9.99 16,101.75 6.89 13,955.65 Since Inception 8.23 15,747.48 8.73 16,170.71 5.90 13,899.90 Date of Inception: Regular Plan: November 02, 2007; Direct Plan: January 01, 2013. CAGR – Compounded Annual Growth Rate^ Scheme Benchmark. # Standard Benchmark. *Based on standard investment of ̀ 10,000 made at the beginning of the relevant period. Past performance may or may not be sustained in future and should not be used as a basis for comparison with other investments.##The name of the benchmark has been changed from CRISIL MIP Blended Fund Index to CRISIL Hybrid 85 + 15 Conservative Index w.e.f. January 31, 2018.The debt component of the benchmark is TRI since inception. For equity component of the benchmark, i.e. S&P BSE 200 PRI vlaue is used till 31st July 2006 and TRI is used since 1st Aug 2006.Alok Agarwal (Equity Portion) is managing this fund sinch August 2016 and Kumaresh Ramakrishnan (Debt Portion) is managing this fund since April 05, 2018. For performance of schemes managed by Alok Agarwal refer page no. 7, 11, 12, 13, 15, 18, 31. For performance of schemes managed by Kumaresh Ramakrishnan refer page no. 11, 14-15, 18-21, 23, 25.Different plans have a different expense structure. For Total Expense Ratio as on September 28, 2018 refer page no. 30
Dividend HistoryRegular Plan Direct Plan
Record Date
Dividend/unit (`)#
NAV (`) Dividend/unit (`)#
NAV (`)
MONTHLY DIVIDEND27-Jul-18 0.0400 10.5852 0.0013 10.485631-Aug-18 0.0400 10.5342 — —28-Sep-18 0.0400 10.3757 — —
# On face value of ` 10. Post Dividend per unit NAV will fall to the extent of the payout and applicable tax/surcharges/cess/other statutory levies. Dividend distribution is subject to availability of distributable surplus. Past Performance may or may not be sustained in future.
0.11
11.51
12.75
21.52
54.11
CBLO
Corporate Debt
PSU Bonds
Equities
Cash & Current Assets
21.52
4.89
73.59
EQUITY
AA+
AAA / A1+
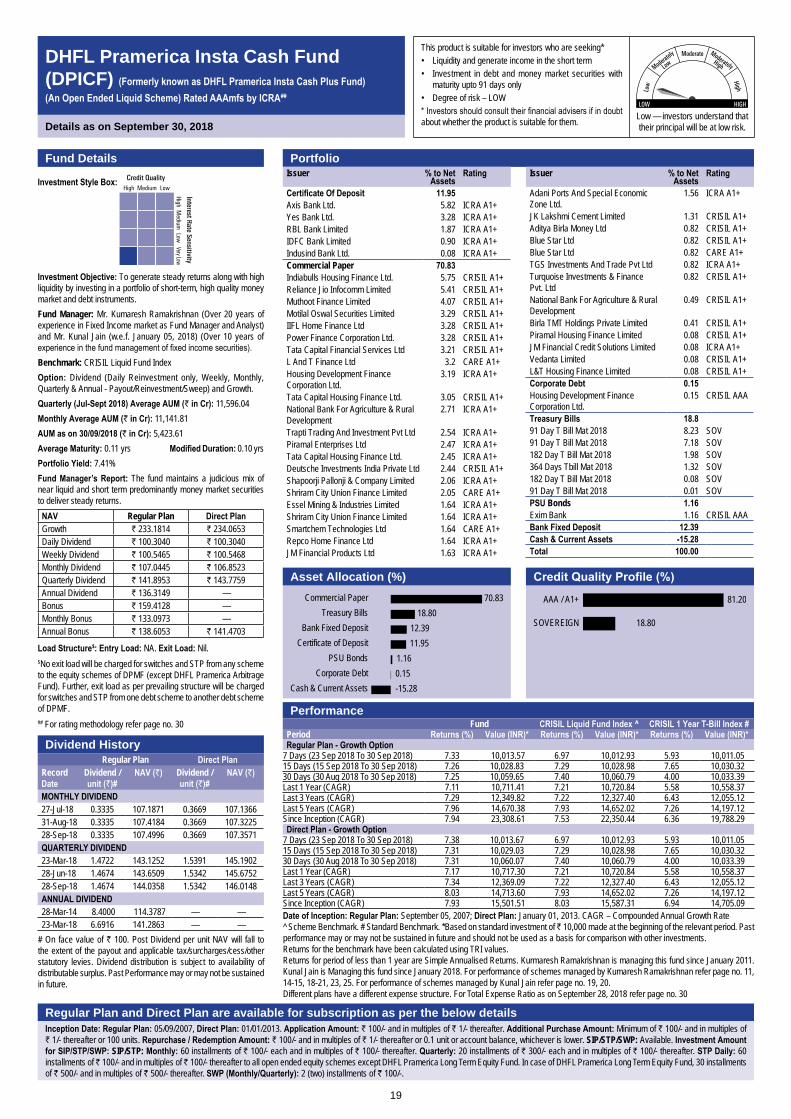
19
Fund Details
Investment Style Box:
Investment Objective: To generate steady returns along with high liquidity by investing in a portfolio of short-term, high quality money market and debt instruments.Fund Manager: Mr. Kumaresh Ramakrishnan (Over 20 years of experience in Fixed Income market as Fund Manager and Analyst) and Mr. Kunal Jain (w.e.f. January 05, 2018) (Over 10 years of experience in the fund management of fixed income securities).Benchmark: CRISIL Liquid Fund IndexOption: Dividend (Daily Reinvestment only, Weekly, Monthly, Quarterly & Annual - Payout/Reinvestment/Sweep) and Growth.Quarterly (Jul-Sept 2018) Average AUM (` in Cr): 11,596.04Monthly Average AUM (` in Cr): 11,141.81AUM as on 30/09/2018 (` in Cr): 5,423.61Average Maturity: 0.11 yrs Modified Duration: 0.10 yrsPortfolio Yield: 7.41%Fund Manager’s Report: The fund maintains a judicious mix of near liquid and short term predominantly money market securities to deliver steady returns.NAV Regular Plan Direct PlanGrowth ` 233.1814 ` 234.0653Daily Dividend ` 100.3040 ` 100.3040Weekly Dividend ` 100.5465 ` 100.5468Monthly Dividend ` 107.0445 ` 106.8523Quarterly Dividend ` 141.8953 ` 143.7759Annual Dividend ` 136.3149 —Bonus ` 159.4128 —Monthly Bonus ` 133.0973 —Annual Bonus ` 138.6053 ` 141.4703
Load Structure$: Entry Load: NA. Exit Load: Nil.$No exit load will be charged for switches and STP from any scheme to the equity schemes of DPMF (except DHFL Pramerica Arbitrage Fund). Further, exit load as per prevailing structure will be charged for switches and STP from one debt scheme to another debt scheme of DPMF.## For rating methodology refer page no. 30
Portfolio
Asset Allocation (%) Credit Quality Profile (%)
Issuer % to Net Assets
Rating
Certificate Of Deposit 11.95Axis Bank Ltd. 5.82 ICRA A1+Yes Bank Ltd. 3.28 ICRA A1+RBL Bank Limited 1.87 ICRA A1+IDFC Bank Limited 0.90 ICRA A1+Indusind Bank Ltd. 0.08 ICRA A1+Commercial Paper 70.83Indiabulls Housing Finance Ltd. 5.75 CRISIL A1+Reliance Jio Infocomm Limited 5.41 CRISIL A1+Muthoot Finance Limited 4.07 CRISIL A1+Motilal Oswal Securities Limited 3.29 CRISIL A1+IIFL Home Finance Ltd 3.28 CRISIL A1+Power Finance Corporation Ltd. 3.28 CRISIL A1+Tata Capital Financial Services Ltd 3.21 CRISIL A1+L And T Finance Ltd 3.2 CARE A1+Housing Development Finance Corporation Ltd.
3.19 ICRA A1+
Tata Capital Housing Finance Ltd. 3.05 CRISIL A1+National Bank For Agriculture & Rural Development
2.71 ICRA A1+
Trapti Trading And Investment Pvt Ltd 2.54 ICRA A1+Piramal Enterprises Ltd 2.47 ICRA A1+Tata Capital Housing Finance Ltd. 2.45 ICRA A1+Deutsche Investments India Private Ltd 2.44 CRISIL A1+Shapoorji Pallonji & Company Limited 2.06 ICRA A1+Shriram City Union Finance Limited 2.05 CARE A1+Essel Mining & Industries Limited 1.64 ICRA A1+Shriram City Union Finance Limited 1.64 ICRA A1+Smartchem Technologies Ltd 1.64 CARE A1+Repco Home Finance Ltd 1.64 ICRA A1+JM Financial Products Ltd 1.63 ICRA A1+
DHFL Pramerica Insta Cash Fund (DPICF) (Formerly known as DHFL Pramerica Insta Cash Plus Fund)(An Open Ended Liquid Scheme) Rated AAAmfs by ICRA##
Details as on September 30, 2018
This product is suitable for investors who are seeking*• Liquidity and generate income in the short term• Investment in debt and money market securities with
maturity upto 91 days only• Degree of risk – LOW* Investors should consult their financial advisers if in doubt about whether the product is suitable for them.
Moderate
Moderately
Low
Low
ModeratelyHigh
High
LOW HIGH
Low — investors understand that their principal will be at low risk.
Regular Plan and Direct Plan are available for subscription as per the below detailsInception Date: Regular Plan: 05/09/2007, Direct Plan: 01/01/2013. Application Amount: ` 100/- and in multiples of ` 1/- thereafter. Additional Purchase Amount: Minimum of ` 100/- and in multiples of ` 1/- thereafter or 100 units. Repurchase / Redemption Amount: ` 100/- and in multiples of ` 1/- thereafter or 0.1 unit or account balance, whichever is lower. SIP/STP/SWP: Available. Investment Amount for SIP/STP/SWP: SIP/STP: Monthly: 60 installments of ` 100/- each and in multiples of ` 100/- thereafter. Quarterly: 20 installments of ` 300/- each and in multiples of ` 100/- thereafter. STP Daily: 60 installments of ` 100/- and in multiples of ` 100/- thereafter to all open ended equity schemes except DHFL Pramerica Long Term Equity Fund. In case of DHFL Pramerica Long Term Equity Fund, 30 installments of ` 500/- and in multiples of ` 500/- thereafter. SWP (Monthly/Quarterly): 2 (two) installments of ` 100/-.
Dividend HistoryRegular Plan Direct Plan
Record Date
Dividend / unit (`)#
NAV (`) Dividend / unit (`)#
NAV (`)
MONTHLY DIVIDEND27-Jul-18 0.3335 107.1871 0.3669 107.136631-Aug-18 0.3335 107.4184 0.3669 107.322528-Sep-18 0.3335 107.4996 0.3669 107.3571QUARTERLY DIVIDEND23-Mar-18 1.4722 143.1252 1.5391 145.190228-Jun-18 1.4674 143.6509 1.5342 145.675228-Sep-18 1.4674 144.0358 1.5342 146.0148ANNUAL DIVIDEND28-Mar-14 8.4000 114.3787 — —23-Mar-18 6.6916 141.2863 — —
# On face value of ` 100. Post Dividend per unit NAV will fall to the extent of the payout and applicable tax/surcharges/cess/other statutory levies. Dividend distribution is subject to availability of distributable surplus. Past Performance may or may not be sustained in future.
PerformanceFund CRISIL Liquid Fund Index ^ CRISIL 1 Year T-Bill Index #
Period Returns (%) Value (INR)* Returns (%) Value (INR)* Returns (%) Value (INR)*Regular Plan - Growth Option
7 Days (23 Sep 2018 To 30 Sep 2018) 7.33 10,013.57 6.97 10,012.93 5.93 10,011.05 15 Days (15 Sep 2018 To 30 Sep 2018) 7.26 10,028.83 7.29 10,028.98 7.65 10,030.32 30 Days (30 Aug 2018 To 30 Sep 2018) 7.25 10,059.65 7.40 10,060.79 4.00 10,033.39 Last 1 Year (CAGR) 7.11 10,711.41 7.21 10,720.84 5.58 10,558.37 Last 3 Years (CAGR) 7.29 12,349.82 7.22 12,327.40 6.43 12,055.12 Last 5 Years (CAGR) 7.96 14,670.38 7.93 14,652.02 7.26 14,197.12 Since Inception (CAGR) 7.94 23,308.61 7.53 22,350.44 6.36 19,788.29 Direct Plan - Growth Option
7 Days (23 Sep 2018 To 30 Sep 2018) 7.38 10,013.67 6.97 10,012.93 5.93 10,011.05 15 Days (15 Sep 2018 To 30 Sep 2018) 7.31 10,029.03 7.29 10,028.98 7.65 10,030.32 30 Days (30 Aug 2018 To 30 Sep 2018) 7.31 10,060.07 7.40 10,060.79 4.00 10,033.39 Last 1 Year (CAGR) 7.17 10,717.30 7.21 10,720.84 5.58 10,558.37 Last 3 Years (CAGR) 7.34 12,369.09 7.22 12,327.40 6.43 12,055.12 Last 5 Years (CAGR) 8.03 14,713.60 7.93 14,652.02 7.26 14,197.12 Since Inception (CAGR) 7.93 15,501.51 8.03 15,587.31 6.94 14,705.09 Date of Inception: Regular Plan: September 05, 2007; Direct Plan: January 01, 2013. CAGR – Compounded Annual Growth Rate^ Scheme Benchmark. # Standard Benchmark. *Based on standard investment of ̀ 10,000 made at the beginning of the relevant period. Past performance may or may not be sustained in future and should not be used as a basis for comparison with other investments.Returns for the benchmark have been calculated using TRI values.Returns for period of less than 1 year are Simple Annualised Returns. Kurmaresh Ramakrishnan is managing this fund since January 2011. Kunal Jain is Managing this fund since January 2018. For performance of schemes managed by Kumaresh Ramakrishnan refer page no. 11, 14-15, 18-21, 23, 25. For performance of schemes managed by Kunal Jain refer page no. 19, 20.Different plans have a different expense structure. For Total Expense Ratio as on September 28, 2018 refer page no. 30
Issuer % to Net Assets
Rating
Adani Ports And Special Economic Zone Ltd.
1.56 ICRA A1+
JK Lakshmi Cement Limited 1.31 CRISIL A1+Aditya Birla Money Ltd 0.82 CRISIL A1+Blue Star Ltd 0.82 CRISIL A1+Blue Star Ltd 0.82 CARE A1+TGS Investments And Trade Pvt Ltd 0.82 ICRA A1+Turquoise Investments & Finance Pvt. Ltd
0.82 CRISIL A1+
National Bank For Agriculture & Rural Development
0.49 CRISIL A1+
Birla TMT Holdings Private Limited 0.41 CRISIL A1+Piramal Housing Finance Limited 0.08 CRISIL A1+JM Financial Credit Solutions Limited 0.08 ICRA A1+Vedanta Limited 0.08 CRISIL A1+L&T Housing Finance Limited 0.08 CRISIL A1+Corporate Debt 0.15Housing Development Finance Corporation Ltd.
0.15 CRISIL AAA
Treasury Bills 18.891 Day T Bill Mat 2018 8.23 SOV91 Day T Bill Mat 2018 7.18 SOV182 Day T Bill Mat 2018 1.98 SOV364 Days Tbill Mat 2018 1.32 SOV182 Day T Bill Mat 2018 0.08 SOV91 Day T Bill Mat 2018 0.01 SOVPSU Bonds 1.16Exim Bank 1.16 CRISIL AAABank Fixed Deposit 12.39Cash & Current Assets -15.28Total 100.00
-15.280.151.16
11.9512.39
18.8070.83
Cash & Current AssetsCorporate Debt
PSU BondsCertificate of Deposit
Bank Fixed DepositTreasury Bills
Commercial Paper
18.80
81.20
SOVEREIGN
AAA / A1+

20
Regular Plan and Direct Plan are available for subscription as per the below detailsInception Date: Regular Plan: 18/11/2008, Direct Plan: 01/01/2013. Application Amount: ` 5000/- and in multiples of ` 1/- thereafter. Additional Purchase Amount: Minimum of ` 1000/- and in multiples of ` 1/- thereafter or 100 units. Repurchase / Redemption Amount: Minimum of ` 100/- and in multiples of ` 1/- thereafter or 0.1 unit or account balance, whichever is lower. SIP/STP/SWP: Available. Investment Amount for SIP/STP/SWP: SIP/STP: Monthly: 10 installments of ` 500/- each and in multiples of ` 100/- thereafter. Quarterly: 5 installments of ` 1000/- each and in multiples of ` 100/- thereafter. SWP (Monthly/Quarterly): 2 (two) installments of ` 100/-.
Fund Details
Investment Style Box:
Investment Objective: To provide liquidity and seek to generate returns by investing in a mix of short term debt and money market instruments.Fund Manager: Mr. Kumaresh Ramakrishnan (Over 20 years of experience in Fixed Income market as Fund Manager and Analyst) and Mr. Kunal Jain (w.e.f. January 05, 2018) (Over 10 years of experience in the fund management of fixed income securities)Benchmark: CRISIL Liquid Fund IndexOption: Dividend (Daily Reinvestment only, Weekly, Monthly, Quarterly & Annual - Reinvestment/Payout/Sweep) and Growth.Quarterly (Jul-Sept 2018) Average AUM (` in Cr): 1,833.81Monthly Average AUM (` in Cr): 1,762.96AUM as on 28/09/2018 (` in Cr): 1,423.29Average Maturity: 0.32 yrs Modified Duration: 0.30 yrsMacaulay Duration: 3.71 months Portfolio Yield: 8.01%Fund Manager’s Report: The fund has been maintaining a judicious mix of near liquid and short term securities to deliver consistent market related returns with lower volatility.NAV Regular Plan Direct PlanGrowth ` 21.7663 ` 22.0510Daily Dividend ` 10.0203 ` 10.0179Weekly Dividend ` 10.0842 ` 10.2724Monthly Dividend ` 11.0635 ` 11.0497Quarterly Dividend ` 11.2501 ` 10.9786Annual Dividend ` 10.0553 —Dividend ` 14.7015 ` 14.2055Bonus — ` 16.5237Monthly Bonus ` 13.3498 —Annual Bonus — ` 14.6632
Load Structure$: Entry Load: NA. Exit Load: Nil.$No exit load will be charged for switches and STP from any scheme to the equity schemes of DPMF (except DHFL Pramerica Arbitrage Fund). Further, exit load as per prevailing structure will be charged for switches and STP from one debt scheme to another debt scheme of DPMF.## For rating methodology refer page no. 30
PortfolioIssuer % to Net
AssetsRating
PSU Bonds 4.23Power Finance Corporation Ltd. 3.53 CRISIL AAANational Bank For Agriculture & Rural Development
0.70 CRISIL AAA
Certificate Of Deposit 6.16Axis Bank Ltd. 4.50 ICRA A1+Small Industries Development Bank Of India
1.66 CARE A1+
Commercial Paper 35.30Piramal Housing Finance Limited 10.37 ICRA A1+JM Financial Products Ltd 6.77 ICRA A1+Shapoorji Pallonji & Company Ltd 3.42 ICRA A1+Deutsche Investments India Pvt Ltd 3.39 CRISIL A1+Shapoorji Pallonji Infrastructure Capital Company Limited
3.36 CARE A1+
Reliance Jio Infocomm Limited 2.45 CARE A1+Kotak Commodity Service Limited 1.75 ICRA A1+Housing Development Finance Corporation Ltd.
1.73 CRISIL A1+
Housing & Urban Development Corporation Ltd
1.71 ICRA A1+
Hero Fincorp Limited 0.35 ICRA A1+
Asset Allocation (%) Credit Quality Profile (%)
Issuer % to Net Assets
Rating
Corporate Debt 30.88Dewan Housing Finance Corporation Limited
10.21 CARE AAA
Indiabulls Housing Finance Ltd. 7.01 CRISIL AAABusiness Broadcast News Holdings Limited 1
3.43 CARE AA+(SO)
Piramal Enterprises Ltd 2.79 ICRA AAECL Finance Ltd 1.76 ICRA AAHousing Development Finance Corporation Ltd.
1.75 CRISIL AAA
Mandava Holdings Pvt Ltd 2 1.74 ICRA AAA(SO)Sikka Port Terminal Limited 1.41 CRISIL AAAManav Investment & Trading Company Ltd
0.72 ICRA AAA(SO)
IOT Utkal Energy Services Limited 0.06 IND AAA(SO)CBLO 0.10Bank Fixed Deposit 5.97Cash & Current Assets 17.36Total 100.00
* AA include securities rated as AA and AA-
DHFL Pramerica Ultra Short Term Fund (DPUSTF) (An open ended ultra-short term debt scheme investing in instruments such that the Macaulay duration of the portfolio is between 3 months to 6 months) Rated AAAmfs by ICRA##
Details as on September 28, 2018
This product is suitable for investors who are seeking*• Income over the short term• Investment in short term debt and money market
instruments• Degree of risk – MODERATELY LOW* Investors should consult their financial advisers if in doubt about whether the product is suitable for them.
Moderate
Moderately
Low
Low
ModeratelyHigh
High
LOW HIGH
Moderately Low — investors understand that their principal will be at moderately low risk.
Performance (CAGR)Fund CRISIL Liquid Fund Index^ CRISIL 1 Year T-Bill Index#
Period Returns (%) Value (INR)* Returns (%) Value (INR)* Returns (%) Value (INR)*Regular Plan - Growth Option
Last 1 Year 6.77 10,676.82 7.21 10,720.84 5.58 10,558.37 Last 3 Years 7.57 12,447.06 7.22 12,327.40 6.43 12,055.12 Last 5 Years 8.33 14,921.40 7.93 14,652.02 7.26 14,197.12 Since Inception 7.89 21,772.15 7.57 21,104.12 6.52 19,092.84 Direct Plan - Growth Option
Last 1 Year 7.05 10,705.25 7.21 10,720.84 5.58 10,558.37 Last 3 Years 7.83 12,538.81 7.22 12,327.40 6.43 12,055.12 Last 5 Years 8.58 15,092.77 7.93 14,652.02 7.26 14,197.12 Since Inception 8.52 15,992.77 8.03 15,584.37 6.94 14,698.74 Date of Inception: Regular Plan: November 18, 2008; Direct Plan: January 01, 2013. CAGR – Compounded Annual Growth Rate^ Scheme Benchmark. # Standard Benchmark. *Based on standard investment of ̀ 10,000 made at the beginning of the relevant period. Past performance may or may not be sustained in future and should not be used as a basis for comparison with other investments.Returns for the benchmark have been calculated using TRI values.Kumaresh Ramakrishnan is managing this fund since January 2011. Kunal Jain is managing this fund since January 2018.For performance of schemes managed by Kumaresh Ramakrishnan refer page no. 11, 14-15, 18-21, 23, 25. For performance of schemes managed by Kunal Jain refer page no. 19, 20.Different plans have a different expense structure. For Total Expense Ratio as on September 28, 2018 refer page no. 30
Dividend HistoryRegular Plan Direct Plan
Record Date
Dividend/unit (`)#
NAV (`) Dividend/unit (`)#
NAV (`)
MONTHLY DIVIDEND27-Jul-18 0.0334 11.0477 0.0434 11.058931-Aug-18 0.0334 11.0745 0.0434 11.073628-Sep-18 — — 0.0434 11.0497QUARTERLY DIVIDEND23-Mar-18 0.1271 11.2300 0.1271 10.967228-Jun-18 0.1267 11.2409 0.1267 10.980728-Sep-18 0.1267 11.2501 0.1267 10.9786ANNUAL DIVIDEND26-Sept-14 — — 1.0000 12.0182
# On face value of ` 10. Post Dividend per unit NAV will fall to the extent of the payout and applicable tax/surcharges/cess/other statutory levies. Dividend distribution is subject to availability of distributable surplus. Past Performance may or may not be sustained in future.
1 Guaranteed by Reliance Capital Ltd.2 Unconditional guarantee from Axis Capital
0.10
4.23
5.97
6.16
17.36
30.88
35.30
CBLO
PSU Bonds
Bank Fixed Deposit
Certificate of Deposit
Cash & Current Assets
Corporate Debt
Commercial Paper
4.55
3.43
92.02
AA*
AA+
AAA / A1+

21
DHFL Pramerica Low Duration Fund (DPLDF) (An open ended low duration debt scheme investing in instruments such that the Macaulay duration of the portfolio is between 6 months to 12 months)
Details as on September 28, 2018
This product is suitable for investors who are seeking*• Income over the short term• Investment in low duration debt and money market
instruments• Degree of risk – MODERATE* Investors should consult their financial advisers if in doubt about whether the product is suitable for them.
Moderate
Moderately
Low
Low
ModeratelyHigh
High
LOW HIGH
Moderate — investors understand that their principal will be at moderate risk.
Fund Details
Investment Style Box:
Investment Objective: The objective of the Scheme is to seek to generate income through investment primarily in low duration debt & money market securities.There is no assurance or guarantee that the investment objective of the scheme will be achieved.Fund Manager: Mr. Kumaresh Ramakrishnan (Over 20 years of experience in Fixed Income markets as Fund Manager and Analyst) Benchmark: CRISIL Low Duration Debt Index (w.e.f. May 01, 2018)Option: Dividend (Daily Reinvestment only, Regular - Payout/Reinvestment, Weekly, Monthly, Quarterly & Annual - Reinvestment/Payout/Sweep) and Growth.Quarterly (Jul-Sept 2018) Average AUM (` in Cr): 969.33Monthly Average AUM (` in Cr): 899.93AUM as on 28/09/2018 (` in Cr): 669.12Average Maturity: 0.70 yrs Modified Duration: 0.63 yrsMacaulay Duration: 8.18 months Portfolio Yield: 10.15%Fund Manager’s Report: The fund identifies and invests in short term credit opportunities and / or mispriced securities to generate 'alpha'. There was no change in positioning during the month. Average maturity has been increased to take advantage of rise in short term yields.NAV Regular Plan Direct PlanGrowth ` 24.4301 ` 25.2289Daily Dividend ` 10.0271 ` 10.0271Regular Dividend — ` 11.6011Weekly Dividend ` 10.1083 ` 10.2228Monthly Dividend ` 11.2613 ` 11.1301Quarterly Dividend ` 10.2662 ` 10.3165Annual Dividend ` 11.4776 ` 12.5503Bonus ` 18.9024 —Monthly Bonus ` 13.4903 —Annual Bonus ` 14.5121 —
Load Structure$: Entry Load: NA. Exit Load: Nil.$No exit load will be charged for switches and STP from any scheme to the equity schemes of DPMF (except DHFL Pramerica Arbitrage Fund). Further, exit load as per prevailing structure will be charged for switches and STP from one debt scheme to another debt scheme of DPMF.
Portfolio
Asset Allocation (%) Credit Quality Profile (%)
Issuer % to Net Assets
Rating
PSU Bonds 0.89Steel Authority Of India Ltd. 0.89 CARE AACommercial Paper 7.16Shapoorji Pallonji Infrastructure Capital Company Limited 8
7.16 CARE A1+
Corporate Debt 84.83Indiabulls Housing Finance Ltd. 10.88 CRISIL AAAEmami Agrotech Ltd 2 10.04 BRICK AA- (SO)Dewan Housing Finance Corporation Limited
9.38 CARE AAA
AU Housing Finance Limited 7.48 IND A+Reliance Big Entertainment Pvt Ltd 3 7.38 BRICK AA+ (SO)Vodafone India Ltd 7.34 CRISIL AA-Magma Fincorp Limited 6.68 ICRA AABusiness Broadcast News Holdings Limited 4
5.70 CARE AA+(SO)
ARM Infra & Utilities Pvt Ltd 5 4.29 BRICK A+ (SO)Northern Arc Capital Ltd 1 4.01 ICRA A+ECL Finance Ltd 3.67 ICRA AAHansdeep Industries & Trading Company Ltd 6
3.03 CARE AA(SO)
Issuer % to Net Assets
Rating
Aspire Home Finance Corporation Ltd 7
2.24 CRISIL A+
Nuvuco Vistas Ltd 0.76 CRISIL AAPiramal Enterprises Ltd 0.75 ICRA AAEdelweiss Commodities Services Limited
0.68 ICRA AA
Dalmia Cement (Bharat) Ltd. 0.52 ICRA AABank Fixed Deposit 3.74Cash & Current Assets 3.38Total 100.00
* AA include securities rated as AA, AA-
Regular Plan and Direct Plan are available for subscription as per the below detailsInception Date: Regular Plan: 22/06/2007, Direct Plan: 01/01/2013. Application Amount: ` 5000/- and in multiples of ` 1/- thereafter. Additional Purchase Amount: Minimum of ` 1000/- and in multiples of ` 1/- thereafter or 100 units. Repurchase / Redemption Amount: Minimum of ` 100/- and in multiples of ` 1/- thereafter or 0.1 unit or account balance, whichever is lower. SIP/STP/SWP: Available. Investment Amount for SIP/STP/SWP: SIP/STP: Monthly: 10 installments of ` 500/- each and in multiples of ` 100/- thereafter. Quarterly: 5 installments of ` 1000/- each and in multiples of ` 100/- thereafter. SWP (Monthly/Quarterly): 2 (two) installments of ` 100/-.
Dividend HistoryRegular Plan Direct Plan
Record Date
Dividend/unit (`)#
NAV (`) Dividend/unit (`)#
NAV (`)
REGULAR DIVIDEND28-Dec-17 0.1405 11.3151 0.1472 11.659423-Mar-18 0.1405 11.2798 0.1472 11.6394MONTHLY DIVIDEND27-Jul-18 0.0434 11.2799 0.0467 11.150631-Aug-18 0.0434 11.2941 0.0467 11.164128-Sep-18 0.0434 11.2613 0.0467 11.1301QUARTERLY DIVIDEND23-Mar-18 0.1271 10.3214 0.1338 10.359128-Jun-18 0.1267 10.2936 0.1334 10.338928-Sep-18 0.1267 10.2662 0.1334 10.3165ANNUAL DIVIDEND28-Mar-16 0.8000 11.2357 — —24-Mar-17 — — 0.0535 12.289423-Mar-18 0.6692 12.1180 0.6692 13.1195
# On face value of ` 10. Post Dividend per unit NAV will fall to the extent of the payout and applicable tax/surcharges/cess/other statutory levies. Dividend distribution is subject to availability of distributable surplus. Past Performance may or may not be sustained in future.
Performance (CAGR)Fund CRISIL Low Duration Debt Index^ CRISIL 1 Year T-Bill Index#
Period Returns (%) Value (INR)* Returns (%) Value (INR)* Returns (%) Value (INR)*Regular Plan - Growth Option
Last 1 Year 6.28 10,627.65 6.52 10,651.87 5.58 10,558.37 Last 3 Years 7.81 12,529.28 7.72 12,497.67 6.43 12,055.12 Last 5 Years 8.44 14,995.44 8.51 15,049.25 7.26 14,197.12 Since Inception 8.24 24,430.10 7.65 22,971.13 6.34 20,004.29 Direct Plan - Growth Option
Last 1 Year 6.96 10,696.24 6.52 10,651.87 5.58 10,558.37 Last 3 Years 8.45 12,756.43 7.72 12,497.67 6.43 12,055.12 Last 5 Years 9.07 15,436.83 8.51 15,049.25 7.26 14,197.12 Since Inception 8.85 16,273.47 8.49 15,968.85 6.94 14,698.74 Date of Inception: Regular Plan: June 22, 2007; Direct Plan: January 01, 2013. CAGR – Compounded Annual Growth Rate^ Scheme Benchmark. # Standard Benchmark. *Based on standard investment of ̀ 10,000 made at the beginning of the relevant period. Past performance may or may not be sustained in future and should not be used as a basis for comparison with other investments.W.e.f. May 01, 2018, the benchmark of the scheme has been changed from CRISIL Liquid Fund Index to CRISIL Low Duration Debt Index.Returns for the benchmark have been calculated using TRI values.Kumaresh Ramakrishnan is managing this fund since August 2008.For performance of schemes managed by Kumaresh Ramakrishnan refer page no. 11, 14-15, 18-21, 23, 25Different plans have a different expense structure. For Total Expense Ratio as on September 28, 2018 refer page no. 30
1 Erstwhile IFMR Capital2 Loan against shares with collateral of equity shares of Emami Ltd.3 Loan against shares with collateral of equity share of Reliance Capital Ltd.4 Guaranteed by Reliance Capital Ltd.5 Zee (Essel) group - Loan against shares (mainly Zee Entertainment Ltd.)6 Wholly owned by J.K. Lakshmi Cement Ltd.7 Motilal Oswal Group8 Unconditional standby letter of Credit (SBLC) by RBL Bank
0.89
3.38
3.74
7.16
84.83
PSU Bonds
Cash & Current Assets
Bank Fixed Deposit
Commercial Paper
Corporate Debt
18.02
34.36
13.08
34.54
OTHERS
AA*
AA+
AAA / A1+
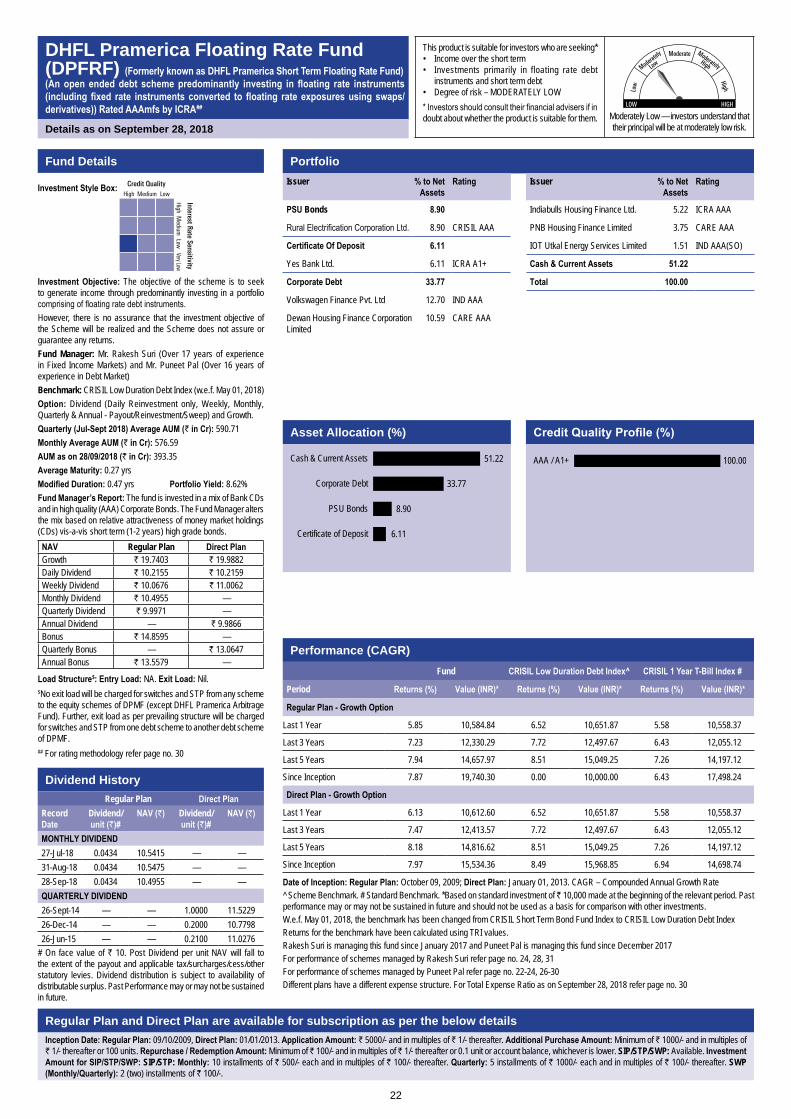
22
Fund Details
Investment Style Box:
Investment Objective: The objective of the scheme is to seek to generate income through predominantly investing in a portfolio comprising of floating rate debt instruments.However, there is no assurance that the investment objective of the Scheme will be realized and the Scheme does not assure or guarantee any returns.Fund Manager: Mr. Rakesh Suri (Over 17 years of experience in Fixed Income Markets) and Mr. Puneet Pal (Over 16 years of experience in Debt Market)Benchmark: CRISIL Low Duration Debt Index (w.e.f. May 01, 2018)Option: Dividend (Daily Reinvestment only, Weekly, Monthly, Quarterly & Annual - Payout/Reinvestment/Sweep) and Growth.Quarterly (Jul-Sept 2018) Average AUM (` in Cr): 590.71Monthly Average AUM (` in Cr): 576.59AUM as on 28/09/2018 (` in Cr): 393.35Average Maturity: 0.27 yrsModified Duration: 0.47 yrs Portfolio Yield: 8.62%Fund Manager’s Report: The fund is invested in a mix of Bank CDs and in high quality (AAA) Corporate Bonds. The Fund Manager alters the mix based on relative attractiveness of money market holdings (CDs) vis-a-vis short term (1-2 years) high grade bonds.NAV Regular Plan Direct PlanGrowth ` 19.7403 ` 19.9882Daily Dividend ` 10.2155 ` 10.2159Weekly Dividend ` 10.0676 ` 11.0062Monthly Dividend ` 10.4955 —Quarterly Dividend ` 9.9971 —Annual Dividend — ` 9.9866Bonus ` 14.8595 —Quarterly Bonus — ` 13.0647Annual Bonus ` 13.5579 —
Load Structure$: Entry Load: NA. Exit Load: Nil.$No exit load will be charged for switches and STP from any scheme to the equity schemes of DPMF (except DHFL Pramerica Arbitrage Fund). Further, exit load as per prevailing structure will be charged for switches and STP from one debt scheme to another debt scheme of DPMF.## For rating methodology refer page no. 30
PortfolioIssuer % to Net
AssetsRating
PSU Bonds 8.90
Rural Electrification Corporation Ltd. 8.90 CRISIL AAA
Certificate Of Deposit 6.11
Yes Bank Ltd. 6.11 ICRA A1+
Corporate Debt 33.77
Volkswagen Finance Pvt. Ltd 12.70 IND AAA
Dewan Housing Finance Corporation Limited
10.59 CARE AAA
Regular Plan and Direct Plan are available for subscription as per the below detailsInception Date: Regular Plan: 09/10/2009, Direct Plan: 01/01/2013. Application Amount: ` 5000/- and in multiples of ` 1/- thereafter. Additional Purchase Amount: Minimum of ` 1000/- and in multiples of ` 1/- thereafter or 100 units. Repurchase / Redemption Amount: Minimum of ` 100/- and in multiples of ` 1/- thereafter or 0.1 unit or account balance, whichever is lower. SIP/STP/SWP: Available. Investment Amount for SIP/STP/SWP: SIP/STP: Monthly: 10 installments of ` 500/- each and in multiples of ` 100/- thereafter. Quarterly: 5 installments of ` 1000/- each and in multiples of ` 100/- thereafter. SWP (Monthly/Quarterly): 2 (two) installments of ` 100/-.
DHFL Pramerica Floating Rate Fund (DPFRF) (Formerly known as DHFL Pramerica Short Term Floating Rate Fund)(An open ended debt scheme predominantly investing in floating rate instruments (including fixed rate instruments converted to floating rate exposures using swaps/ derivatives)) Rated AAAmfs by ICRA##
Details as on September 28, 2018
This product is suitable for investors who are seeking*• Income over the short term• Investments primarily in floating rate debt
instruments and short term debt• Degree of risk – MODERATELY LOW* Investors should consult their financial advisers if in doubt about whether the product is suitable for them.
Moderate
Moderately
Low
Low
ModeratelyHigh
High
LOW HIGH
Moderately Low — investors understand that their principal will be at moderately low risk.
Asset Allocation (%) Credit Quality Profile (%)
Performance (CAGR)Fund CRISIL Low Duration Debt Index^ CRISIL 1 Year T-Bill Index #
Period Returns (%) Value (INR)* Returns (%) Value (INR)* Returns (%) Value (INR)*
Regular Plan - Growth Option
Last 1 Year 5.85 10,584.84 6.52 10,651.87 5.58 10,558.37
Last 3 Years 7.23 12,330.29 7.72 12,497.67 6.43 12,055.12
Last 5 Years 7.94 14,657.97 8.51 15,049.25 7.26 14,197.12
Since Inception 7.87 19,740.30 0.00 10,000.00 6.43 17,498.24
Direct Plan - Growth Option
Last 1 Year 6.13 10,612.60 6.52 10,651.87 5.58 10,558.37
Last 3 Years 7.47 12,413.57 7.72 12,497.67 6.43 12,055.12
Last 5 Years 8.18 14,816.62 8.51 15,049.25 7.26 14,197.12
Since Inception 7.97 15,534.36 8.49 15,968.85 6.94 14,698.74
Date of Inception: Regular Plan: October 09, 2009; Direct Plan: January 01, 2013. CAGR – Compounded Annual Growth Rate^ Scheme Benchmark. # Standard Benchmark. *Based on standard investment of ̀ 10,000 made at the beginning of the relevant period. Past performance may or may not be sustained in future and should not be used as a basis for comparison with other investments.W.e.f. May 01, 2018, the benchmark has been changed from CRISIL Short Term Bond Fund Index to CRISIL Low Duration Debt IndexReturns for the benchmark have been calculated using TRI values.Rakesh Suri is managing this fund since January 2017 and Puneet Pal is managing this fund since December 2017For performance of schemes managed by Rakesh Suri refer page no. 24, 28, 31For performance of schemes managed by Puneet Pal refer page no. 22-24, 26-30Different plans have a different expense structure. For Total Expense Ratio as on September 28, 2018 refer page no. 30
Dividend HistoryRegular Plan Direct Plan
Record Date
Dividend/unit (`)#
NAV (`) Dividend/unit (`)#
NAV (`)
MONTHLY DIVIDEND27-Jul-18 0.0434 10.5415 — —31-Aug-18 0.0434 10.5475 — —28-Sep-18 0.0434 10.4955 — —QUARTERLY DIVIDEND26-Sept-14 — — 1.0000 11.522926-Dec-14 — — 0.2000 10.779826-Jun-15 — — 0.2100 11.0276
# On face value of ` 10. Post Dividend per unit NAV will fall to the extent of the payout and applicable tax/surcharges/cess/other statutory levies. Dividend distribution is subject to availability of distributable surplus. Past Performance may or may not be sustained in future.
Issuer % to Net Assets
Rating
Indiabulls Housing Finance Ltd. 5.22 ICRA AAA
PNB Housing Finance Limited 3.75 CARE AAA
IOT Utkal Energy Services Limited 1.51 IND AAA(SO)
Cash & Current Assets 51.22
Total 100.00
6.11
8.90
33.77
51.22
Certificate of Deposit
PSU Bonds
Corporate Debt
Cash & Current Assets 100.00AAA / A1+

23
DHFL Pramerica Short Maturity Fund (DPSMF) (An open ended short term debt scheme investing in instruments such that the Macaulay duration of the portfolio is between 1 year to 3 years)Rated AA+mfs by ICRA##
Details as on September 28, 2018
This product is suitable for investors who are seeking*• Income over the short term• Investment in short term debt and money market
instruments• Degree of risk – MODERATE* Investors should consult their financial advisers if in doubt about whether the product is suitable for them.
Moderate
Moderately
Low
Low
ModeratelyHigh
High
LOW HIGH
Moderate — investors understand that their principal will be at moderate risk.
Fund Details
Investment Style Box:
Investment Objective: The investment objective of the Scheme is to seek to generate returns with low to medium market risk for investors by investing in a portfolio of short -medium term debt and money market securities.Fund Manager: Mr. Puneet Pal (Over 16 years of experience in Debt Market) and Mr. Kumaresh Ramakrishnan (Over 20 years of experience in Fixed Income markets as Fund Manager and Analyst)Benchmark: CRISIL Short Term Bond Fund IndexOption: Dividend (Weekly, Monthly, Quarterly & Annual - Payout/Reinvestment/Sweep) and Growth.Quarterly (Jul-Sept 2018) Average AUM (` in Cr): 1,509.18Monthly Average AUM (` in Cr): 1,435.96AUM as on 28/09/2018 (` in Cr): 1,124.20Average Maturity: 1.23 yrs Modified Duration: 1.06 yrsMacaulay Duration: 13.58 months Portfolio Yield: 9.93%Fund Manager’s Report: The fund maintained average maturity at 1.2 years. The fund is invested in a mix of short term securities (Money Market) which offer liquidity and medium term corprate bonds. We will continue with the same positioning, & look to maintain average maturity around 1.2 years.NAV Regular Plan Direct PlanGrowth ` 32.2850 ` 33.9119Weekly Dividend ` 10.2168 ` 10.4473Monthly Dividend ` 12.7978 ` 13.3645Quarterly Dividend ` 10.3974 ` 10.9019Annual Dividend ` 10.2819 —Bonus ` 18.5840 —Half Yearly Bonus ` 13.0448 —Annual Bonus ` 21.5232 ` 22.6077
Load Structure$: Entry Load: NA. Exit Load: w.e.f. February 01, 2018: 0.50% If redeemed / switched-out on or before 6 months from the date of allotment and Nil If redeemed / switched-out after 6 months from the date of allotment.$No exit load will be charged for switches and STP from any scheme to the equity schemes of DPMF (except DHFL Pramerica Arbitrage Fund). Further, exit load as per prevailing structure will be charged for switches and STP from one debt scheme to another debt scheme of DPMF.## For rating methodology refer page no. 30
Issuer % to Net Assets
Rating
PSU Bonds 11.84Power Finance Corporation Ltd. 3.13 CRISIL AAASmall Industries Development Bank Of India
2.21 CARE AAA
UP Power Corporation Limited 2.20 AA(IND)(SO)Union Bank Of India 4.30 IND AACertificate Of Deposit 0.95HDFC Bank Ltd. 0.95 CRISIL A1+Commercial Paper 6.60Power Grid Corporation Of India Ltd.
6.60 CRISIL A1+
Corporate Debt 74.41Dewan Housing Finance Corporation Limited
8.28 CARE AAA
Yes Bank Ltd. 2.63 ICRA AAICICI Bank Ltd. 1.21 ICRA AA+Indusind Bank Ltd. 0.24 CRISIL AAHousing Development Finance Corporation Ltd.
7.54 CRISIL AAA
Business Broadcast News Holdings Limited 1
7.39 CARE AA+(SO)
ECL Finance Ltd 6.67 ICRA AA
Portfolio
Asset Allocation (%) Credit Quality Profile (%)
* AA include securities rated as AA and AA-
Regular Plan and Direct Plan are available for subscription as per the below detailsInception Date: Regular Plan: 21/01/2003, Direct Plan: 01/01/2013. Application Amount: ` 5000/- and in multiples of ` 1/- thereafter. Additional Purchase Amount: Minimum of ` 1000/- and in multiples of ` 1/- thereafter or 100 units. Repurchase / Redemption Amount: Minimum of ` 100/- and in multiples of ` 1/- thereafter or 0.1 unit or account balance, whichever is lower. SIP/STP/SWP: Available. Investment Amount for SIP/STP/SWP: SIP/STP: Monthly: 10 installments of ` 500/- each and in multiples of ` 100/- thereafter. Quarterly: 5 installments of ` 1000/- each and in multiples of ` 100/- thereafter. SWP (Monthly/Quarterly): 2 (two) installments of ` 100/-.
Dividend HistoryRegular Plan Direct Plan
Record Date
Dividend/unit (`)#
NAV (`) Dividend/unit (`)#
NAV (`)
MONTHLY DIVIDEND27-Jul-18 0.0534 12.8929 0.0600 13.453331-Aug-18 0.0534 12.8906 0.0600 13.457428-Sep-18 0.0534 12.7978 0.0600 13.3645QUARTERLY DIVIDEND23-Mar-18 0.1338 10.6036 0.1405 11.061428-Jun-18 0.1334 10.4689 0.1401 10.949328-Sep-18 0.1334 10.3974 0.1401 10.9019ANNUAL DIVIDEND28-Mar-16 0.8000 10.9407 — —24-Mar-17 0.5353 11.1047 — —23-Mar-18 0.6022 10.9914 — —
# On face value of ` 10. Post Dividend per unit NAV will fall to the extent of the payout and applicable tax/surcharges/cess/other statutory levies. Dividend distribution is subject to availability of distributable surplus. Past Performance may or may not be sustained in future.
Peformance (CAGR)Fund CRISIL Short Term
Bond Fund Index^CRISIL 1 Year T-Bill Index#
Period Returns (%) Value (INR)* Returns (%) Value (INR)* Returns (%) Value (INR)*Regular Plan - Growth Option
Last 1 Year 4.05 10,404.72 4.25 10,424.68 5.58 10,558.37 Last 3 Years 7.36 10,736.49 7.16 12,305.25 6.43 12,055.12 Last 5 Years 8.28 14,890.25 8.22 14,849.60 7.26 14,197.12 Since Inception 7.75 32,245.40 7.03 29,022.32 5.92 24,634.03 Direct Plan - Growth Option
Last 1 Year 5.01 10,500.70 4.25 10,424.68 5.58 10,558.37 Last 3 Years 8.31 12,706.65 7.16 12,305.25 6.43 12,055.12 Last 5 Years 9.22 15,545.41 8.22 14,849.60 7.26 14,197.12 Since Inception 8.86 16,286.43 8.13 15,663.47 6.94 14,698.74 Date of Inception: Regular Plan: January 21, 2003; Direct Plan: January 01, 2013. CAGR – Compounded Annual Growth Rate^ Scheme Benchmark. # Standard Benchmark. *Based on standard investment of ̀ 10,000 made at the beginning of the relevant period. Past performance may or may not be sustained in future and should not be used as a basis for comparison with other investments.Returns for the benchmark have been calculated using TRI values.Puneet Pal is managing this fund since December 2017 and Kumaresh Ramakrishnan is managing this fund since December 2017For performance of schemes managed by Puneet Pal refer page no. 22-24, 26-30For performance of schemes managed by Kumaresh Ramakrishnan refer page no. 11, 14-15, 18-21, 23, 25Different plans have a different expense structure. For Total Expense Ratio as on September 28, 2018 refer page no. 30
1 Guaranteed by Reliance Capital Ltd.2 Loan against shares with collateral of equity shares of Reliance Capital Ltd.3 Wholly owned by J.K. Lakshmi Cement Ltd.4 NHAI annuity road project
Issuer % to Net Assets
Rating
Indiabulls Housing Finance Ltd. 6.62 ICRA AAAReliance Big Entertainment Private Limited 2
6.59 BRICK AA+ (SO)
Edelweiss Commodities Services Limited
6.55 ICRA AA
Hansdeep Industries & Trading Company Ltd 3
5.42 CARE AA(SO)
BMW India Financial Services Pvt Ltd
4.37 CRISIL AAA
Reliance Commercial Finance Pvt. Ltd.
4.34 CARE AA+(SO)
SBI Cards And Payment Services 4.22 CRISIL AAAOriental Nagpur Betul Highway Limited 4
2.21 CRISIL AAA (SO)
IOT Utkal Energy Services Limited 0.13 IND AAA(SO)Cash & Current Assets 6.20Total 100.00
0.95
6.20
6.60
11.84
74.41
Certificate of Deposit
Cash & Current Assets
Commercial Paper
PSU Bonds
Corporate Debt
28.01
19.53
52.46
AA*
AA+
AAA / A1+

24
Fund Details
Investment Style Box:
Investment Objective: The primary objective of the Scheme is to seek to generate income and capital appreciation by investing predominantly in debt instruments issued by banks, Public Sector Undertakings, Public Financial institutions and Municipal Bonds.Fund Manager: Mr. Puneet Pal (Over 16 years of experience in Debt Market)Benchmark: CRISIL Short Term Bond Fund IndexOption: Dividend (Regular - Payout/Reinvestment, Weekly, Monthly, Quarterly and Annual - Payout/Reinvestment/Sweep) and Growth.Quarterly (Jul-Sept 2018) Average AUM (` in Cr): 394.66Monthly Average AUM (` in Cr): 213.55AUM as on 28/09/2018 (` in Cr): 140.01Average Maturity: 1.37 yrsModified Duration: 1.20 yrs Portfolio Yield: 8.72%Fund Manager’s Report: The fund is invested in shorter tenor high quality bonds. We will keep the maturity around 1 year.
NAV Regular Plan Direct PlanGrowth ` 15.1968 ` 15.6083Monthly Dividend ` 10.0177 ` 10.3010Weekly Dividend ` 10.2745 ` 10.2295Quarterly Dividend ` 10.2979 —Annual Dividend — ` 10.2905Bonus — —
Load Structure$: Entry Load: NA. Exit Load: Nil.$No exit load will be charged for switches and STP from any scheme to the equity schemes of DPMF (except DHFL Pramerica Arbitrage Fund). Further, exit load as per prevailing structure will be charged for switches and STP from one debt scheme to another debt scheme of DPMF.## For rating methodology refer page no. 30
Issuer % to Net Assets
Rating
PSU Bonds 66.67
Small Industries Development Bank Of India
16.99 CARE AAA
Housing & Urban Development Corporation Ltd
16.87 CARE AAA
UP Power Corporation Limited 14.15 AA(IND)(SO)
National Bank For Agriculture & Rural Development
9.27 CRISIL AAA
National Housing Bank 9.25 CRISIL AAA
Bharat Petroleum Corporation Ltd. 0.14 CRISIL AAA
Certificate Of Deposit 9.67
HDFC Bank Ltd. 9.67 CRISIL A1+
Portfolio
Regular Plan and Direct Plan are available for subscription as per the below details
Inception Date: Regular Plan: 11/03/2013, Direct Plan: 11/03/2013 Application Amount: ` 5000/- and in multiples of ` 1/- thereafter. Additional Purchase Amount: Minimum of ` 1000/- and in multiples of ` 1/- thereafter or 100 units. Repurchase / Redemption Amount: ` 100/- and in multiples of ` 1/- thereafter or 0.1 units or account balance, whichever is lower. SIP/STP/SWP: Available. Investment Amount for SIP/STP/SWP: SIP/STP: Monthly: 10 installments of ` 500/- each and in multiples of ` 100/- thereafter. Quarterly: 5 installments of ` 1000/- each and in multiples of ` 100/- thereafter. SWP (Monthly/Quarterly): 2 (two) installments of ` 100/-.
DHFL Pramerica Banking and PSU Debt Fund (DPBPDF) (An open ended debt scheme predominantly investing in Debt instruments of banks, Public Sector Undertakings, Public Financial Institutions and Municipal Bonds)Rated AAAmfs by ICRA##
Details as on September 28, 2018
This product is suitable for investors who are seeking*• Income over the short term• Investment in debt instruments issued by Banks
and Public Sector Undertakings, Public Financial institutions and Municipal Bonds
• Degree of risk – MODERATELY LOW* Investors should consult their financial advisers if in doubt about whether the product is suitable for them.
Moderate
Moderately
Low
Low
ModeratelyHigh
High
LOW HIGH
Moderately Low — investors understand that their principal will be at moderately low risk.
Asset Allocation (%) Credit Quality Profile (%)
Performance (CAGR)Fund CRISIL Short Term Bond Index ^ CRISIL 1 Year T-Bill Index#
Period Returns (%) Value (INR)* Returns (%) Value (INR)* Returns (%) Value (INR)*Regular Plan - Growth Option
Last 1 Year 3.60 10,359.74 4.25 10,424.68 5.58 10,558.37 Last 3 Years 6.71 12,150.54 7.16 12,305.25 6.43 12,055.12 Last 5 Years 8.07 14,747.15 8.22 14,849.60 7.26 14,197.12 Since Inception 7.80 15,187.05 8.14 15,453.52 6.90 14,492.68 Direct Plan - Growth Option
Last 1 Year 4.17 10,417.41 4.25 10,424.68 5.58 10,558.37 Last 3 Years 7.24 12,334.58 7.16 12,305.25 6.43 12,055.12 Last 5 Years 8.60 15,108.42 8.22 14,849.60 7.26 14,197.12 Since Inception 8.11 15,428.07 8.14 15,453.52 6.90 14,492.68
Date of Inception: Regular Plan: March 11, 2013; Direct Plan: March 11, 2013. CAGR – Compounded Annual Growth Rate^ Scheme Benchmark. # Standard Benchmark. *Based on standard investment of ̀ 10,000 made at the beginning of the relevant period. Past performance may or may not be sustained in future and should not be used as a basis for comparison with other investments.Returns for the benchmark have been calculated using TRI values.Puneet Pal is managing this fund since December 2017For performance of schemes managed by Puneet Pal refer page no. 22-24, 26-30Different plans have a different expense structure. For Total Expense Ratio as on September 28, 2018 refer page no. 30
Dividend HistoryRegular Plan Direct Plan
Record Date
Dividend/unit (`)#
NAV (`) Dividend/unit (`)#
NAV (`)
MONTHLY DIVIDEND27-Jul-18 0.0400 10.0937 0.0434 10.375831-Aug-18 0.0400 10.0921 0.0434 10.376428-Sep-18 0.0060 10.0177 0.0434 10.3010QUARTERLY DIVIDEND23-Mar-18 0.1204 10.4682 0.1271 10.881028-Jun-18 — — 0.1201 10.357528-Sep-18 0.1201 10.2979 — —ANNUAL DIVIDEND23-Mar-18 — — 0.4684 10.7710
# On face value of ` 10. Post Dividend per unit NAV will fall to the extent of the payout and applicable tax/surcharges/cess/other statutory levies. Dividend distribution is subject to availability of distributable surplus. Past Performance may or may not be sustained in future.
Issuer % to Net Assets
Rating
Commercial Paper 2.61
Power Grid Corporation Of India Ltd. 2.61 CRISIL A1+
Corporate Debt 16.58
SBI Cards And Payment Services 9.67 CRISIL AAA
PNB Housing Finance Limited 6.91 CARE AAA
Bank Bonds 0.76
Yes Bank Ltd. 0.76 ICRA AA
CBLO 0.08
Cash & Current Assets 3.63
Total 100.00
* AA include securities rated as AA and AA-0.08
0.76
2.61
3.63
9.67
16.58
66.67
CBLO
Bank Bonds
Commercial Paper
Cash & Current Assets
Certificate of Deposit
Corporate Debt
PSU Bonds
14.91
85.09
AA*
AAA / A1+

25
Fund Details
Investment Style Box:
Investment Objective: The investment objective of the Scheme is to seek to generate income and capital appreciation by investing predominantly in AA and below rated corporate debt (excluding AA+ rated corporate bonds). However, there can be no assurance that the investment objective of the Scheme will be achieved. The Scheme does not guarantee/ indicate any returns.Fund Manager: Mr. Kumaresh Ramakrishnan (Over 20 years of experience in Fixed Income market as Fund Manager and Analyst).Benchmark: CRISIL Composite AA Short Term Bond IndexOption: Dividend (Regular - Payout/Reinvestment, Monthly, Quarterly & Annual - Payout/Reinvestment/Sweep) and Growth.Quarterly (Jul-Sept 2018) Average AUM (` in Cr): 1,031.93Monthly Average AUM (` in Cr): 1,044.78AUM as on 28/09/2018 (` in Cr): 1,027.06Average Maturity: 2.09 yrsModified Duration: 1.64 yrs Portfolio Yield: 10.19%Fund Manager’s Report: The fund remains invested in relatively higher yielding corporate bonds in the 1-3 year segement. The fund holdings are well diversified across ratings ranging from AAA to AA & A.NAV Regular Plan Direct PlanGrowth ` 13.9256 ` 14.5096Regular Dividend ` 12.5769 —Monthly Dividend ` 10.1943 ` 10.3781Quarterly Dividend ` 10.4390 ` 10.8783Annual Dividend ` 12.9147 ` 13.3176
Load Structure$: Entry Load: NA. Exit Load: 10% of the units allotted may be redeemed without any exit load within 1 year from the date of allotment; Any redemptions / switch outs in excess of the above mentioned limit would be subject to an exit load of 1%, if the units are redeemed / switched out within 1 year from the date of allotment of units; Nil - If the units are redeemed / switched out after 1 year from the date of allotment of units.$No exit load will be charged for switches and STP from any scheme to the equity schemes of DPMF (except DHFL Pramerica Arbitrage Fund). Further, exit load as per prevailing structure will be charged for switches and STP from one debt scheme to another debt scheme of DPMF.
DHFL Pramerica Credit Risk Fund (DPCRF) (Formerly known as DHFL Pramerica Credit Opportunities Fund)(An open ended debt scheme predominantly investing in AA and below rated corporate bonds (excluding AA+ rated corporate bonds))
Details as on September 28, 2018
This product is suitable for investors who are seeking*• Income and capital appreciation over medium to long term• Investments predominantly in AA and below rated
corporate debt securities (excluding AA+ rated corporate bonds) of various maturities
• Degree of risk – MODERATE* Investors should consult their financial advisers if in doubt about whether the product is suitable for them.
Moderate
Moderately
Low
Low
ModeratelyHigh
High
LOW HIGH
Moderate — investors understand that their principal will be at moderate risk.
Portfolio
Asset Allocation (%) Credit Quality Profile (%)
* AA include securities rated as AA and AA-
Regular Plan and Direct Plan are available for subscription as per the below detailsInception Date: Regular Plan: 29/09/2014, Direct Plan: 29/09/2014. Application Amount: ` 5000/- and in multiples of ` 1/- thereafter. Additional Purchase Amount: Minimum of ` 1000/- and in multiples of ` 1/- thereafter or 100 units. Repurchase / Redemption Amount: ` 100/- and in multiples of ` 1/- thereafter or 0.1 units or account balance, whichever is lower. SIP/STP/SWP: Available. Investment Amount for SIP/STP/SWP: SIP/STP: Monthly: 10 installments of ` 500/- each and in multiples of ` 100/- thereafter. Quarterly: 5 installments of ` 1000/- each and in multiples of ` 100/- thereafter. SWP (Monthly/Quarterly): 2 (two) installments of ` 100/-.
Dividend HistoryRegular Plan Direct Plan
Record Date
Dividend/unit (`)#
NAV (`) Dividend/unit (`)#
NAV (`)
REGULAR DIVIDEND28-Dec-17 0.1807 13.0043 — —23-Mar-18 0.1807 12.9200 — —28-Sep-18 0.1801 12.5769 — —MONTHLY DIVIDEND27-Jul-18 0.0467 10.3016 0.0500 10.476731-Aug-18 0.0467 10.2919 0.0500 10.473428-Sep-18 0.0467 10.1943 0.0500 10.3781QUARTERLY DIVIDEND23-Mar-18 0.1472 10.6459 0.1606 11.130528-Jun-18 0.1001 10.4737 0.1601 10.972328-Sep-18 0.1001 10.4390 0.1601 10.8783ANNUAL DIVIDEND24-Mar-17 0.0602 12.8235 — —23-Mar-18 0.6022 13.6137 0.6692 14.0409
# On face value of ` 10. Post Dividend per unit NAV will fall to the extent of the payout and applicable tax/surcharges/cess/other statutory levies. Dividend distribution is subject to availability of distributable surplus. Past Performance may or may not be sustained in future.
Performance (CAGR)Fund CRISIL Composite AA Short Term
Bond Index^CRISIL 1 Year T-Bill Index#
Period Returns (%) Value (INR)* Returns (%) Value (INR)* Returns (%) Value (INR)*Regular Plan - Growth Option
Last 1 Year 4.08 10,408.24 5.73 10,573.16 5.58 10,558.37 Last 3 Years 7.69 12,487.98 8.28 12,694.14 6.43 12,055.12 Since Inception 8.63 13,925.60 8.67 13,948.01 6.96 13,089.16 Direct Plan - Growth Option
Last 1 Year 5.22 10,521.60 5.73 10,573.16 5.58 10,558.37 Last 3 Years 8.84 12,895.02 8.28 12,694.14 6.43 12,055.12 Since Inception 9.50 14,377.04 8.67 13,948.01 6.96 13,089.16 Date of Inception: Regular Plan: September 29, 2014; Direct Plan: September 29, 2014. CAGR – Compounded Annual Growth Rate^ Scheme Benchmark. # Standard Benchmark. *Based on standard investment of ̀ 10,000 made at the beginning of the relevant period. Past performance may or may not be sustained in future and should not be used as a basis for comparison with other investments.Last 5 years returns are not provided since the scheme has not completed 5 years.W.e.f. May 01, 2018, the benchmark of the scheme has been changed from CRISIL Short Term Bond Fund Index to CRISIL AA Short Term Bond Index. The name of the benchmark has been changed from CRISIL AA Short Term Bond Index to CRISIL Composite AA Short Term Bond Index.Returns for the benchmark have been calculated using TRI values.Kumaresh Ramakrishnan is managing this fund since March 2016For performance of schemes managed by Kumaresh Ramakrishnan refer page no. 11, 14-15, 18-21, 23, 25Different plans have a different expense structure. For Total Expense Ratio as on September 28, 2018 refer page no. 30
1 Loan against shares with collateral of equity shares of Emami Ltd.2 Guaranteed by Reliance Capital Ltd.3 Zee (Essel) group - Loan against shares (mainly Zee Entertainment Ltd.)4 Wholly owned by J.K. Lakshmi Cement5 Owned by Nirma Group6 Majority owned by Indian Hotels - Taj7 Loan against shares with collateral of equity shares of Reliance Capital Ltd.8 Collateralised by a pledge of shares of key A.V. Birla group companies
Issuer % to Net Assets
Rating
PSU Bonds 22.11UP Power Corporation Limited 4.34 AA(IND)(SO)Steel Authority Of India Ltd. 3.55 CARE AAPunjab And Sind Bank 4.81 ICRA A+Vijaya Bank 3.87 CARE AA-Syndicate Bank 3.32 CARE AA-Union Bank Of India 2.22 IND AACertificate Of Deposit 3.49RBL Bank Limited 3.49 ICRA A1+Commercial Paper 2.35Indiabulls Housing Finance Ltd. 2.35 CRISIL A1+Corporate Debt 63.90Emami Agrotech Ltd 1 6.09 BRICK AA- (SO)Business Broadcast News Holdings Limited 2
4.87 CARE AA+(SO)
Tata Capital Housing Finance Ltd. 4.84 ICRA AAAGreen Infra Wind Energy Ltd 4.83 AA(SO)Yes Bank Ltd. 4.66 ICRA AAARM Infra & Utilities Pvt Ltd 3 4.10 BRICK A+ (SO)Hansdeep Industries & Trading Company Ltd 4
3.98 CARE AA(SO)
Nuvuco Vistas Ltd 5 3.82 CRISIL AATata Housing Development Co. Ltd 3.50 ICRA AAReliance Commercial Finance Pvt. Ltd. 3.25 CARE AA+(SO)Oriental Hotels Limited 6 3.14 CARE A+
Issuer % to Net Assets
Rating
Reliance Big Entertainment Pvt Ltd 7 2.40 BRICK AA+ (SO)Nirma Limited 2.37 CRISIL AA-Dewan Housing Finance Corp. Ltd 2.35 CARE AANorthern Arc Capital Ltd 2.23 ICRA A+Piramal Enterprises Ltd 1.95 ICRA AADewan Housing Finance Corp. Ltd 1.68 CARE AAAS.D. Corporation Pvt Ltd. 1.05 CARE AA+(SO)Manav Investment & Trading Co. Ltd 8
0.99 ICRA AAA(SO)
Sunny View Estates Private Limited 0.96 ICRA AAAdani Ports And Special Economic Zone Ltd.
0.47 ICRA AA+
Indiabulls Housing Finance Ltd. 0.19 CRISIL AAAIndiabulls Housing Finance Ltd. 0.18 ICRA AAACash & Current Assets 8.15Total 100.00
2.35
3.49
8.15
22.11
63.90
Commercial Paper
Certificate of Deposit
Cash & Current Assets
PSU Bonds
Corporate Debt
14.28
51.81
12.04
21.87
Others
AA*
AA+
AAA / A1+

26
Fund Details
Investment Style Box:
Investment Objective: The objective of the Scheme is to seek to generate returns through active management of a portfolio of debt and money market instruments. However, there is no assurance that the investment objective of the Scheme will be realized and the Scheme does not assure or guarantee any returns.
Fund Manager: Mr. Puneet Pal (Over 16 years of experience in Debt Market)
Benchmark: CRISIL Composite Bond Fund Index
Option: Dividend (Monthly and Quarterly - Payout/Reinvestment) and Growth.
Quarterly (Jul-Sept 2018) Average AUM (` in Cr): 91.06
Monthly Average AUM (` in Cr): 87.55
AUM as on 28/09/2018 (` in Cr): 82.27
Average Maturity: 2.24 yrs
Modified Duration: 2.67 yrs Portfolio Yield: 8.63%
Fund Manager’s Report: The fund is invested in medium/long term GOI securities. We will continue to look for tactical opportunities to play duration, in an environment of hardening yields.
NAV Regular Plan Direct PlanGrowth ` 1661.7691 ` 1752.5087Monthly Dividend ` 1005.4000 ` 1237.0258Quarterly Dividend ` 1074.4526 ` 1132.5911
Load Structure$: Entry Load: NA. Exit Load: If the units are redeemed/switch-out on or before 30 days of allotment – 1%; If the units are redeemed/switch-out after 30 days – Nil$No exit load will be charged for switches and STP from any scheme to the equity schemes of DPMF (except DHFL Pramerica Arbitrage Fund). Further, exit load as per prevailing structure will be charged for switches and STP from one debt scheme to another debt scheme of DPMF.## For rating methodology refer page no. 30
Issuer % to Net Assets
Rating
GOI Securities 23.81
Government Of India - Gilts - 8.27% 2020
12.23 SOV
7.17 Govt. Stock 2028 11.58 SOV
Corporate Debt 22.57
SBI Cards And Payment Services 10.11 CRISIL AAA
ICICI Bank Ltd. 10.14 ICRA AA+
Portfolio
DHFL Pramerica Dynamic Bond Fund (DPDBF)(An open ended dynamic debt scheme investing across duration)Rated AAAmfs by ICRA##
Details as on September 28, 2018
This product is suitable for investors who are seeking*• Regular income for short term.• To generate returns through active management of
a portfolio of debt and money market instruments.• Degree of risk – MODERATE* Investors should consult their financial advisers if in doubt about whether the product is suitable for them.
Moderate
Moderately
Low
Low
ModeratelyHigh
High
LOW HIGH
Moderate — investors understand that their principal will be at moderate risk.
Asset Allocation (%) Credit Quality Profile (%)
Performance (CAGR)Fund CRISIL Composite Bond Fund
Index^CRISIL 10 Year
Gilt Index#
Period Returns (%) Value (INR)* Returns (%) Value (INR)* Returns (%) Value (INR)*
Regular Plan - Growth Option
Last 1 Year 1.16 10,115.70 0.51 10,051.04 -3.12 9,687.66
Last 3 Years 6.92 12,224.12 6.86 12,203.14 5.25 11,659.54
Last 5 Years 8.09 14,759.98 8.74 15,206.66 6.89 13,955.65
Since Inception 7.86 16,617.69 7.97 16,738.46 6.32 15,095.00
Direct Plan - Growth Option
Last 1 Year 2.24 10,223.97 0.51 10,051.04 -3.12 9,687.66
Last 3 Years 8.20 12,667.94 6.86 12,203.14 5.25 11,659.54
Last 5 Years 9.17 15,509.14 8.74 15,206.66 6.89 13,955.65
Since Inception 8.33 15,828.76 7.77 15,370.09 5.90 13,899.90
Date of Inception: Regular Plan: January 12, 2012; Direct Plan: January 01, 2013. CAGR – Compounded Annual Growth Rate^ Scheme Benchmark. # Standard Benchmark. *Based on standard investment of ̀ 10,000 made at the beginning of the relevant period. Past performance may or may not be sustained in future and should not be used as a basis for comparison with other investments.Returns for the benchmark have been calculated using TRI values.Puneet Pal is managing this fund since December 2017For performance of schemes managed by Puneet Pal refer page no. 22-24, 26-30Different plans have a different expense structure. For Total Expense Ratio as on September 28, 2018 refer page no. 30
Dividend HistoryRegular Plan Direct Plan
Record Date
Dividend/unit (`)#
NAV (`) Dividend/unit (`)#
NAV (`)
MONTHLY DIVIDEND27-Jul-18 2.4680 1008.6449 — —31-Aug-18 2.4680 1008.8652 — —28-Sep-18 2.4680 1005.4000 — —QUARTERLY DIVIDEND23-Mar-18 12.0450 1089.4257 13.3833 1145.525528-Jun-18 12.0064 1079.8565 13.3404 1136.990028-Sep-18 12.0064 1074.4526 13.3404 1132.5911
# On face value of ` 1000. Post Dividend per unit NAV will fall to the extent of the payout and applicable tax/surcharges/cess/other statutory levies. Dividend distribution is subject to availability of distributable surplus. Past Performance may or may not be sustained in future.
Issuer % to Net Assets
Rating
Dewan Housing Finance Corporation Limited
2.32 CARE AAA
CBLO 0.04
Cash & Current Assets 53.58
Total 100.00
Regular Plan and Direct Plan are available for subscription as per the below details
Inception Date: Regular Plan: 12/01/2012, Direct Plan: 01/01/2013. Application Amount: ` 5000/- and in multiples of ` 1/- thereafter. Additional Purchase Amount: Minimum of ` 1000/- and in multiples of ` 1/- thereafter or 100 units. Repurchase / Redemption Amount: ` 100/- and in multiples of ` 1/- thereafter or 0.1 units or account balance, whichever is lower. SIP/STP/SWP: Available. Investment Amount for SIP/STP/SWP: SIP/STP: Monthly: 10 installments of ` 500/- each and in multiples of ` 100/- thereafter. Quarterly: 5 installments of ` 1000/- each and in multiples of ` 100/- thereafter. SWP (Monthly/Quarterly): 2 (two) installments of ` 100/-.
23.81
10.14
66.05
SOVEREIGN
AA+
AAA / A1+
0.04
22.57
23.81
53.58
CBLO
Corporate Debt
GOI Securities
Cash & Current Assets

27
Fund Details
Investment Style Box:
Investment Objective: To seek to generate income and capital appreciation by investing in a portfolio of debt and money market instruments.Fund Manager: Mr. Puneet Pal (Over 16 years of experience in Debt Market)Benchmark: CRISIL Composite Bond Fund IndexOption: Dividend (Regular - Payout/Reinvestment, Monthly, Quarterly and Annual - Payout/Reinvestment/Sweep) and Growth.Quarterly (Jul-Sept 2018) Average AUM (` in Cr): 453.21Monthly Average AUM (` in Cr): 387.72AUM as on 28/09/2018 (` in Cr): 375.32Average Maturity: 2.00 yrs Modified Duration: 1.65 yrsMacaulay Duration: 20.59 months Portfolio Yield: 9.17%Fund Manager’s Report: The portfolio is predominantly invested in medium tenor high quality Corporate Bonds. We have reduced the Average Maturity to 2 years and intend to keep the duration of the portfolio low in view of the uncertain outlook on yield.NAV Regular Plan Direct PlanGrowth ` 14.7637 ` 15.2595Regular Dividend ` 12.2290 ` 12.6355Monthly Dividend ` 10.2400 ` 10.3572Quarterly Dividend ` 10.1394 —Annual Dividend — ` 10.2628
Load Structure$: Entry Load: NA. Exit Load: 1% if the investor redeemed / switched out within 1 month from the allotment of units and Nil if redeemed / switched out subsequent to 1 month of allotment of units.$No exit load will be charged for switches and STP from any scheme to the equity schemes of DPMF (except DHFL Pramerica Arbitrage Fund). Further, exit load as per prevailing structure will be charged for switches and STP from one debt scheme to another debt scheme of DPMF.## For rating methodology refer page no. 30
Issuer % to Net Assets
Rating
GOI Securities 5.078.39% Rajasthan SDL Special Mat 2022
4.37 SOV
8.21% Rajasthan SDL Uday Mat 2021
0.70 SOV
PSU Bonds 25.97Power Finance Corporation Ltd. 6.50 CRISIL AAANational Bank For Agriculture & Rural Development
5.77 CRISIL AAA
UP Power Corporation Limited 4.04 AA(IND)(SO)National Housing Bank 3.18 CRISIL AAAHousing & Urban Development Corporation Ltd
2.88 CARE AAA
Small Industries Development Bank Of India
1.58 CARE AAA
Indian Railway Finance Corporation Ltd
1.21 CARE AAA
Rural Electrification Corporation Ltd. 0.68 CRISIL AAABharat Petroleum Corporation Ltd. 0.13 CRISIL AAACertificate Of Deposit 6.44HDFC Bank Ltd. 6.44 CRISIL A1+
DHFL Pramerica Medium Term Fund (DPMTF) (Formerly known as DHFL Pramerica Medium Term Income Fund)(An open ended medium term debt scheme investing in instruments such that the Macaulay duration of the portfolio is between 3 years to 4 years)Rated AAAmfs by ICRA##
Details as on September 28, 2018
Portfolio
Asset Allocation (%) Credit Quality Profile (%)
Regular Plan and Direct Plan are available for subscription as per the below details
Inception Date: Regular Plan: 06/03/2014, Direct Plan: 06/03/2014 Application Amount: ̀ 5000/- and in multiples of ̀ 1/- thereafter. Additional Purchase Amount: ̀ 1000/- and in multiples of ̀ 1/- thereafter or 100 units. Repurchase / Redemption Amount: ` 100/- and in multiples of ` 1/- thereafter or 0.1 units or account balance, whichever is lower. SIP/STP/SWP: Available. Investment Amount for SIP/STP/SWP: SIP/STP: Monthly: 10 installments of ` 500/- each and in multiples of ` 100/- thereafter. Quarterly: 5 installments of ` 1000/- each and in multiples of ` 100/- thereafter. SWP (Monthly/Quarterly): 2 (two) installments of ` 100/-.
Dividend HistoryRegular Plan Direct Plan
Record Date
Dividend/unit (`)#
NAV (`) Dividend/unit (`)#
NAV (`)
REGULAR DIVIDEND23-Mar-18 0.1472 12.5526 0.1539 12.918828-Jun-18 0.1467 12.3477 0.1534 12.733628-Sep-18 0.1467 12.2290 0.1534 12.6355MONTHLY DIVIDEND27-Jul-18 0.0467 10.3638 0.0500 10.475731-Aug-18 0.0467 10.3521 0.0500 10.468128-Sep-18 0.0467 10.2400 0.0500 10.3572QUARTERLY DIVIDEND23-Mar-18 0.0401 10.1332 — —28-Jun-18 0.0200 10.0855 — —28-Sep-18 0.0200 10.1394 — —ANNUAL DIVIDEND23-Mar-18 — — 0.3346 10.6200
# On face value of ` 10. Post Dividend per unit NAV will fall to the extent of the payout and applicable tax/surcharges/cess/other statutory levies. Dividend distribution is subject to availability of distributable surplus. Past Performance may or may not be sustained in future.
Performance (CAGR)Fund CRISIL Composite
Bond Fund Index^CRISIL 10 Year
Gilt Index#
Period Returns (%) Value (INR)* Returns (%) Value (INR)* Returns (%) Value (INR)*
Regular Plan - Growth Option
Last 1 Year 2.10 10,210.31 0.51 10,051.04 -3.12 9,687.66
Last 3 Years 7.24 12,332.68 6.86 12,203.14 5.25 11,659.54
Since Inception 8.90 14,763.70 8.70 14,636.65 7.31 13,803.77
Direct Plan - Growth Option
Last 1 Year 2.99 10,299.06 0.51 10,051.04 -3.12 9,687.66
Last 3 Years 8.08 12,624.20 6.86 12,203.14 5.25 11,659.54
Since Inception 9.45 15,101.31 8.70 14,636.65 7.31 13,803.77
Date of Inception: Regular Plan: March 06, 2014; Direct Plan: March 06, 2014. CAGR – Compounded Annual Growth Rate^ Scheme Benchmark. # Standard Benchmark. *Based on standard investment of ̀ 10,000 made at the beginning of the relevant period. Past performance may or may not be sustained in future and should not be used as a basis for comparison with other investments.Last 5 years returns are not provided since the scheme has not completed 5 years.Returns for the benchmark have been calculated using TRI values.Puneet Pal is managing this fund since December 2017.For performance of schemes managed by Puneet Pal refer page no. 22-24, 26-30Different plans have a different expense structure. For Total Expense Ratio as on September 28, 2018 refer page no. 30
1 Pool PTC representing receivables of Shriram Transport Finance2 Collateralised by a pledge of shares of key A.V. Birla group companies3 NHAI annuity road project
Issuer % to Net Assets
Rating
Commercial Paper 5.61Power Grid Corporation Of India Ltd. 5.61 CRISIL A1+Corporate Debt 50.43Dewan Housing Finance Corp. Ltd 10.39 CARE AAAICICI Bank Ltd. 1.65 ICRA AA+Sansar Trust September 2016 VI 1 4.86 CRISIL AAA (SO)SBI Cards And Payment Services 9.27 CRISIL AAAManav Investment & Trading Company Ltd 2
6.79 ICRA AAA(SO)
Indiabulls Housing Finance Ltd. 6.60 ICRA AAAOriental Nagpur Betul Highway Ltd 3 6.53 CRISIL AAA (SO)Reliance Industries Ltd. 2.32 CRISIL AAAJorabat Shillong Expressway Ltd 2.02 CARE AAA(SO)CBLO 0.01Cash & Current Assets 6.47Total 100.00
This product is suitable for investors who are seeking*• Income and capital appreciation over the medium term• Investment in Debt and Money Market Instruments of
medium term• Degree of risk – MODERATE* Investors should consult their financial advisers if in doubt about whether the product is suitable for them.
Moderate
Moderately
Low
Low
ModeratelyHigh
High
LOW HIGH
Moderate — investors understand that their principal will be at moderate risk.
* AA include securities rated as AA and AA-0.01
5.07
5.61
6.44
6.47
25.97
50.43
CBLO
GOI Securities
Commercial Paper
Certificate of Deposit
Cash & Current Assets
PSU Bonds
Corporate Debt
5.07
4.04
1.65
89.24
SOVEREIGN
AA*
AA+
AAA / A1+

28
Fund Details
Investment Style Box:
Investment Objective: The investment objective of the Scheme is to seek to generate income and capital appreciation by predominantly investing in AA+ and above rated corporate bonds.Fund Manager: Mr. Rakesh Suri (Over 17 years of experience in Fixed Income Markets) and Mr. Puneet Pal (Over 16 years of experience in Debt Market)Benchmark: CRISIL Composite Bond Fund IndexOption: Dividend (Monthly, Quarterly and Annual - Payout/Reinvestment/Sweep) and Growth.Quarterly (Jul-Sept 2018) Average AUM (` in Cr): 445.06Monthly Average AUM (` in Cr): 305.07AUM as on 28/09/2018 (` in Cr): 163.49Average Maturity: 0.83 yrsModified Duration: 0.74 yrs Portfolio Yield: 8.55%Fund Manager’s Report: The fund has invested in medium term high grade (mostly AAA) PSU/Corporate bonds. The fund reduced duration during the month.
NAV Regular Plan Direct PlanGrowth ` 27.6980 ` 29.3131Monthly Dividend ` 12.9591 ` 14.6887Quarterly Dividend ` 11.6290 ` 12.8535Annual Dividend ` 10.7139 ` 11.9077Half Yearly Bonus ` 12.9376 —
Load Structure$: Entry Load: NA. Exit Load: Nil$No exit load will be charged for switches and STP from any scheme to the equity schemes of DPMF (except DHFL Pramerica Arbitrage Fund). Further, exit load as per prevailing structure will be charged for switches and STP from one debt scheme to another debt scheme of DPMF.## For rating methodology refer page no. 30
Regular Plan and Direct Plan are available for subscription as per the below detailsInception Date: Regular Plan: 30/01/2003, Direct Plan: 01/01/2013. Application Amount: ` 5000/- and in multiples of ̀ 1/- thereafter. Additional Purchase Amount: ̀ 1000/- and in multiples of ̀ 1/- thereafter or 100 units. Repurchase / Redemption Amount: ` 100/- and in multiples of ` 1/- thereafter or 0.1 units or account balance, whichever is lower. SIP/STP/SWP: Available. Investment Amount for SIP/STP/SWP: SIP/STP: Monthly: 10 installments of ` 500/- each and in multiples of ` 100/- thereafter. Quarterly: 5 installments of ` 1000/- each and in multiples of ` 100/- thereafter. SWP (Monthly/Quarterly): 2 (two) installments of ` 100/-.
DHFL Pramerica Premier Bond Fund (DPPBF) (An open ended debt scheme predominantly investing in AA+ and above rated corporate bonds)Rated AAAmfs by ICRA##
Details as on September 28, 2018
This product is suitable for investors who are seeking*• Income over the medium term• Investments predominantly in AA+ and above
rated corporate bonds including bonds• Degree of risk – MODERATE* Investors should consult their financial advisers if in doubt about whether the product is suitable for them.
Moderate
Moderately
Low
Low
ModeratelyHigh
High
LOW HIGH
Moderate — investors understand that their principal will be at moderate risk.
Portfolio
Asset Allocation (%) Credit Quality Profile (%)
Performance (CAGR)Fund CRISIL Composite
Bond Fund Index^CRISIL 10 Year
Gilt Index#
Period Returns (%) Value (INR)* Returns (%) Value (INR)* Returns (%) Value (INR)*
Regular Plan - Growth Option
Last 1 Year 2.75 10,274.73 0.51 10,051.04 -3.12 9,687.66
Last 3 Years 5.98 11,901.91 6.86 12,203.14 5.25 11,659.54
Last 5 Years 7.13 14,113.06 8.74 15,206.66 6.89 13,955.65
Since Inception 6.72 27,698.00 6.49 26,776.83 5.68 23,754.72
Direct Plan - Growth Option
Last 1 Year 4.07 10,406.75 0.51 10,051.04 -3.12 9,687.66
Last 3 Years 7.09 12,280.10 6.86 12,203.14 5.25 11,659.54
Last 5 Years 8.20 14,831.24 8.74 15,206.66 6.89 13,955.65
Since Inception 7.53 15,169.35 7.77 15,370.09 5.90 13,899.90 Date of Inception: Regular Plan: January 30, 2003; Direct Plan: January 01, 2013. CAGR – Compounded Annual Growth Rate^ Scheme Benchmark. # Standard Benchmark. *Based on standard investment of ̀ 10,000 made at the beginning of the relevant period. Past performance may or may not be sustained in future and should not be used as a basis for comparison with other investments.Returns for the benchmark have been calculated using TRI values.Rakesh Suri is managing this fund since March 2016 and Puneet Pal is managing this fund since December 2017For performance of schemes managed by Rakesh Suri refer page no. 24, 28, 31For performance of schemes managed by Puneet Pal refer page no. 22-24, 26-30Different plans have a different expense structure. For Total Expense Ratio as on September 28, 2018 refer page no. 30
Dividend HistoryRegular Plan Direct Plan
Record Date
Dividend/unit (`)#
NAV (`) Dividend/unit (`)#
NAV (`)
MONTHLY DIVIDEND27-Jul-18 0.0534 13.0388 0.0600 14.748331-Aug-18 0.0534 13.0351 0.0600 14.761028-Sep-18 0.0534 12.9591 0.0600 14.6887QUARTERLY DIVIDEND23-Mar-18 0.1405 11.8696 0.1606 13.061928-Jun-18 0.1401 11.6822 0.1601 12.884228-Sep-18 0.1401 11.6290 0.1601 12.8535ANNUAL DIVIDEND27-Mar-15 0.3750 10.5685 0.3750 11.249028-Mar-16 0.8000 10.8812 0.8000 11.712923-Mar-18 0.6022 11.4489 0.6692 12.6573
# On face value of ` 10. Post Dividend per unit NAV will fall to the extent of the payout and applicable tax/surcharges/cess/other statutory levies. Dividend distribution is subject to availability of distributable surplus. Past Performance may or may not be sustained in future.
Issuer % to Net Assets
Rating
PSU Bonds 18.06
Housing & Urban Development Corporation Ltd
18.06 CARE AAA
Certificate Of Deposit 29.21
Axis Bank Ltd. 14.79 ICRA A1+
Small Industries Development Bank Of India
14.42 CARE A1+
Issuer % to Net Assets
Rating
Corporate Debt 23.72
HDB Financial Services Limited 14.73 CRISIL AAA
PNB Housing Finance Limited 8.99 CARE AAA
CBLO 2.11
Cash & Current Assets 26.90
Total 100.00
2.11
18.06
23.72
26.90
29.21
CBLO
PSU Bonds
Corporate Debt
Cash & Current Assets
Certificate of Deposit 100.00AAA / A1+

29
Fund Details
Investment Style Box:
Investment Objective: To seek to generate reasonable returns by investing in Central/State Government securities of various maturities.
Fund Manager: Mr. Puneet Pal (Over 16 years of experience in Debt Market)
Benchmark: I-Sec Mi-Bex
Option: Dividend (Payout & Reinvestment) and Growth.
Quarterly (Jul-Sept 2018) Average AUM (` in Cr): 129.14
Monthly Average AUM (` in Cr): 103.70
AUM as on 28/09/2018 (` in Cr): 103.81
Average Maturity: 2.01 yrs
Modified Duration: 2.11 yrs Portfolio Yield: 8.41%
Fund Manager’s Report: We will continue to maintain low duration in the fund till the outlook on yields/rates become clear.
NAV Regular Plan Direct PlanGrowth ` 19.0482 ` 19.3655Dividend ` 13.7418 ` 13.9057Half Yearly Bonus — —
Load Structure$: Entry Load: NA. Exit Load: Nil.$No exit load will be charged for switches and STP from any scheme to the equity schemes of DPMF (except DHFL Pramerica Arbitrage Fund). Further, exit load as per prevailing structure will be charged for switches and STP from one debt scheme to another debt scheme of DPMF.
Issuer % to Net Assets
Rating
GOI Securities 50.04
7.38% Maharashtra SDL Uday Mat 2022 18.56 SOV
8.39% Rajasthan SDL Special Mat 2022 14.33 SOV
8.27% Rajasthan SDL Special Mat 2022 12.37 SOV
8.45% Punjab SDL Special Mat 2023 4.78 SOV
DHFL Pramerica Gilt Fund (DPGF)(An open ended debt scheme investing in government securities across maturities)
Details as on September 28, 2018
This product is suitable for investors who are seeking*• Income over the medium term• Investments only in Central/State securities of various
maturities• Degree of risk – MODERATE* Investors should consult their financial advisers if in doubt about whether the product is suitable for them.
Moderate
Moderately
Low
Low
ModeratelyHigh
High
LOW HIGH
Moderate — investors understand that their principal will be at moderate risk.
Portfolio Holdings
Asset Allocation (%) Credit Quality Profile (%)
Regular Plan and Direct Plan are available for subscription as per the below details
Inception Date: Regular Plan: 27/10/2008, Direct Plan: 01/01/2013. Application Amount: ̀ 5000/- and in multiples of ̀ 1/- thereafter. Additional Purchase Amount: ̀ 1000/- and in multiples of ̀ 1/- thereafter or 100 units. Repurchase / Redemption Amount: ` 100/- and in multiples of ` 1/- thereafter or 0.1 unit or account balance, whichever is lower. SIP/STP/SWP: Available. Investment Amount for SIP/STP/SWP: SIP/STP: Monthly: 10 installments of ` 500/- each and in multiples of ` 100/- thereafter. Quarterly: 5 installments of ` 1000/- each and in multiples of ` 100/- thereafter. SWP (Monthly/Quarterly): 2 (two) installments of ` 100/-.
Dividend HistoryRegular Plan Direct Plan
Record Date
Dividend/unit (`)#
NAV (`) Dividend/unit (`)#
NAV (`)
26-Sept-14 0.5971 13.0387 0.5971 13.0491
27-Mar-15 0.5385 13.2882 0.5385 13.3183
28-Mar-16 0.6692 13.3825 0.6692 13.4458
28-Dec-17 0.1472 14.1658 0.1539 14.2942
23-Mar-18 0.1472 14.0648 0.1539 14.1995
28-Jun-18 0.1467 13.8354 0.1534 13.9846
28-Sep-18 0.1467 13.7418 0.1534 13.9057
# On face value of ` 10. Post Dividend per unit NAV will fall to the extent of the payout and applicable tax/surcharges/cess/other statutory levies. Dividend distribution is subject to availability of distributable surplus. Past Performance may or may not be sustained in future.
Performance (CAGR)Fund I-Sec Mi-Bex ^ CRISIL 10 Year Gilt Index #
Period Returns (%) Value (INR)* Returns (%) Value (INR)* Returns (%) Value (INR)*
Regular Plan - Growth Option
Last 1 Year 0.76 10,076.12 2.02 10,201.95 -3.12 9,687.66
Last 3 Years 6.55 12,097.94 7.61 12,462.79 5.25 11,659.54
Last 5 Years 8.43 14,991.05 9.34 15,632.84 6.89 13,955.65
Since Inception 6.71 19,048.20 8.29 22,040.78 5.80 17,507.21
Direct Plan - Growth Option
Last 1 Year 1.30 10,130.25 2.02 10,201.95 -3.12 9,687.66
Last 3 Years 6.91 12,219.21 7.61 12,462.79 5.25 11,659.54
Last 5 Years 8.75 15,214.31 9.34 15,632.84 6.89 13,955.65
Since Inception 7.46 15,112.44 8.36 15,855.75 5.90 13,899.90
Date of Inception: Regular Plan: October 27, 2008; Direct Plan: January 01, 2013. CAGR – Compounded Annual Growth Rate^ Scheme Benchmark. # Standard Benchmark. *Based on standard investment of ̀ 10,000 made at the beginning of the relevant period. Past performance may or may not be sustained in future and should not be used as a basis for comparison with other investments.Returns for the benchmark have been calculated using TRI values.Puneet Pal is managing this fund since December 2017.For performance of schemes managed by Puneet Pal refer page no. 22-24, 26-30Different plans have a different expense structure. For Total Expense Ratio as on September 28, 2018 refer page no. 30
Issuer % to Net Assets
Rating
Treasury Bills 32.31
364 Days Tbill Mat 2019 22.69 SOV
91 Days Tbill Mat 2018 4.81 SOV
91 Day T Bill Mat 2018 4.81 SOV
CBLO 0.03
Cash & Current Assets 17.62
Total 100.00
0.03
17.62
32.31
50.04
CBLO
Cash & Current Assets
Treasury Bills
GOI Securities
82.35
17.65
SOVEREIGN
AAA / A1+
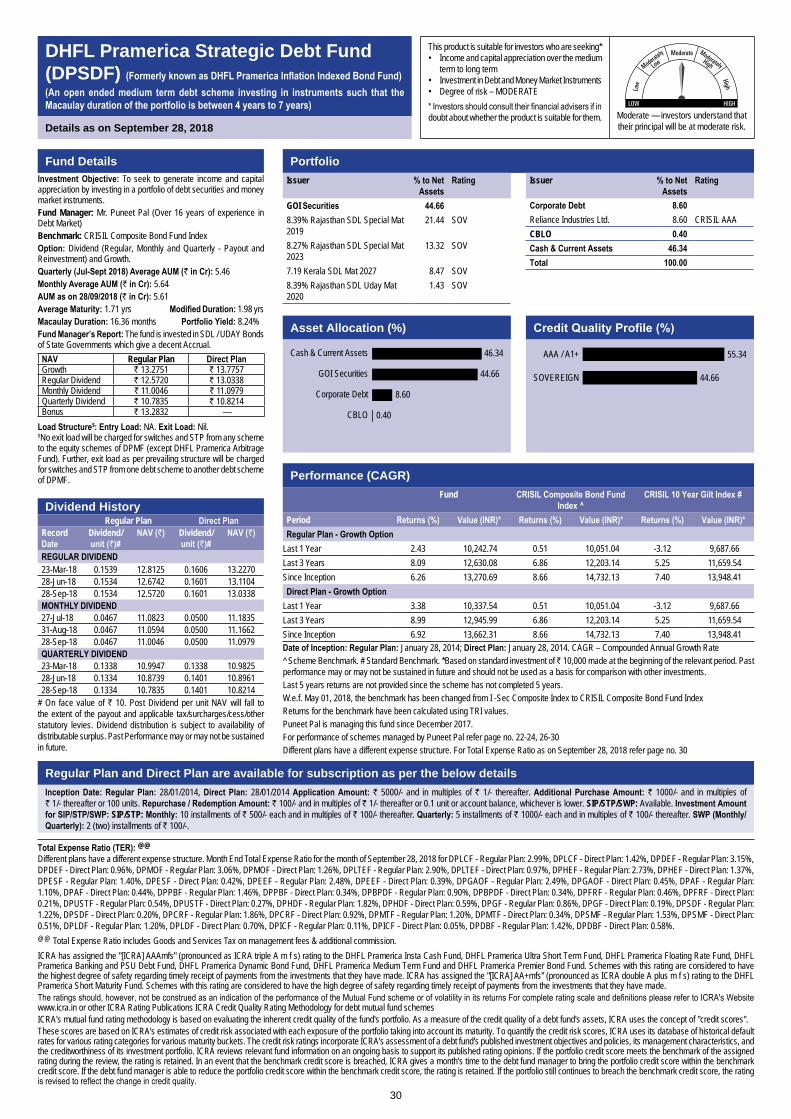
30
Fund DetailsInvestment Objective: To seek to generate income and capital appreciation by investing in a portfolio of debt securities and money market instruments.Fund Manager: Mr. Puneet Pal (Over 16 years of experience in Debt Market)Benchmark: CRISIL Composite Bond Fund IndexOption: Dividend (Regular, Monthly and Quarterly - Payout and Reinvestment) and Growth.Quarterly (Jul-Sept 2018) Average AUM (` in Cr): 5.46Monthly Average AUM (` in Cr): 5.64AUM as on 28/09/2018 (` in Cr): 5.61Average Maturity: 1.71 yrs Modified Duration: 1.98 yrsMacaulay Duration: 16.36 months Portfolio Yield: 8.24%Fund Manager’s Report: The fund is invested in SDL / UDAY Bonds of State Governments which give a decent Accrual.NAV Regular Plan Direct PlanGrowth ` 13.2751 ` 13.7757Regular Dividend ` 12.5720 ` 13.0338Monthly Dividend ` 11.0046 ` 11.0979Quarterly Dividend ` 10.7835 ` 10.8214Bonus ` 13.2832 —
Load Structure$: Entry Load: NA. Exit Load: Nil.$No exit load will be charged for switches and STP from any scheme to the equity schemes of DPMF (except DHFL Pramerica Arbitrage Fund). Further, exit load as per prevailing structure will be charged for switches and STP from one debt scheme to another debt scheme of DPMF.
Regular Plan and Direct Plan are available for subscription as per the below detailsInception Date: Regular Plan: 28/01/2014, Direct Plan: 28/01/2014 Application Amount: ` 5000/- and in multiples of ` 1/- thereafter. Additional Purchase Amount: ` 1000/- and in multiples of ` 1/- thereafter or 100 units. Repurchase / Redemption Amount: ` 100/- and in multiples of ` 1/- thereafter or 0.1 unit or account balance, whichever is lower. SIP/STP/SWP: Available. Investment Amount for SIP/STP/SWP: SIP/STP: Monthly: 10 installments of ` 500/- each and in multiples of ` 100/- thereafter. Quarterly: 5 installments of ` 1000/- each and in multiples of ` 100/- thereafter. SWP (Monthly/Quarterly): 2 (two) installments of ` 100/-.
DHFL Pramerica Strategic Debt Fund (DPSDF) (Formerly known as DHFL Pramerica Inflation Indexed Bond Fund)(An open ended medium term debt scheme investing in instruments such that the Macaulay duration of the portfolio is between 4 years to 7 years)
Details as on September 28, 2018
This product is suitable for investors who are seeking*• Income and capital appreciation over the medium
term to long term• Investment in Debt and Money Market Instruments• Degree of risk – MODERATE* Investors should consult their financial advisers if in doubt about whether the product is suitable for them.
Moderate
Moderately
Low
Low
ModeratelyHigh
High
LOW HIGH
Moderate — investors understand that their principal will be at moderate risk.
Asset Allocation (%) Credit Quality Profile (%)
Performance (CAGR)Fund CRISIL Composite Bond Fund
Index ^CRISIL 10 Year Gilt Index #
Period Returns (%) Value (INR)* Returns (%) Value (INR)* Returns (%) Value (INR)*Regular Plan - Growth Option
Last 1 Year 2.43 10,242.74 0.51 10,051.04 -3.12 9,687.66 Last 3 Years 8.09 12,630.08 6.86 12,203.14 5.25 11,659.54 Since Inception 6.26 13,270.69 8.66 14,732.13 7.40 13,948.41 Direct Plan - Growth Option
Last 1 Year 3.38 10,337.54 0.51 10,051.04 -3.12 9,687.66 Last 3 Years 8.99 12,945.99 6.86 12,203.14 5.25 11,659.54 Since Inception 6.92 13,662.31 8.66 14,732.13 7.40 13,948.41 Date of Inception: Regular Plan: January 28, 2014; Direct Plan: January 28, 2014. CAGR – Compounded Annual Growth Rate^ Scheme Benchmark. # Standard Benchmark. *Based on standard investment of ̀ 10,000 made at the beginning of the relevant period. Past performance may or may not be sustained in future and should not be used as a basis for comparison with other investments.Last 5 years returns are not provided since the scheme has not completed 5 years.W.e.f. May 01, 2018, the benchmark has been changed from I -Sec Composite Index to CRISIL Composite Bond Fund IndexReturns for the benchmark have been calculated using TRI values.Puneet Pal is managing this fund since December 2017.For performance of schemes managed by Puneet Pal refer page no. 22-24, 26-30Different plans have a different expense structure. For Total Expense Ratio as on September 28, 2018 refer page no. 30
Dividend HistoryRegular Plan Direct Plan
Record Date
Dividend/unit (`)#
NAV (`) Dividend/unit (`)#
NAV (`)
REGULAR DIVIDEND23-Mar-18 0.1539 12.8125 0.1606 13.227028-Jun-18 0.1534 12.6742 0.1601 13.110428-Sep-18 0.1534 12.5720 0.1601 13.0338MONTHLY DIVIDEND27-Jul-18 0.0467 11.0823 0.0500 11.183531-Aug-18 0.0467 11.0594 0.0500 11.166228-Sep-18 0.0467 11.0046 0.0500 11.0979QUARTERLY DIVIDEND23-Mar-18 0.1338 10.9947 0.1338 10.982528-Jun-18 0.1334 10.8739 0.1401 10.896128-Sep-18 0.1334 10.7835 0.1401 10.8214
# On face value of ` 10. Post Dividend per unit NAV will fall to the extent of the payout and applicable tax/surcharges/cess/other statutory levies. Dividend distribution is subject to availability of distributable surplus. Past Performance may or may not be sustained in future.
Total Expense Ratio (TER): @@Different plans have a different expense structure. Month End Total Expense Ratio for the month of September 28, 2018 for DPLCF - Regular Plan: 2.99%, DPLCF - Direct Plan: 1.42%, DPDEF - Regular Plan: 3.15%, DPDEF - Direct Plan: 0.96%, DPMOF - Regular Plan: 3.06%, DPMOF - Direct Plan: 1.26%, DPLTEF - Regular Plan: 2.90%, DPLTEF - Direct Plan: 0.97%, DPHEF - Regular Plan: 2.73%, DPHEF - Direct Plan: 1.37%, DPESF - Regular Plan: 1.40%, DPESF - Direct Plan: 0.42%, DPEEF - Regular Plan: 2.48%, DPEEF - Direct Plan: 0.39%, DPGAOF - Regular Plan: 2.49%, DPGAOF - Direct Plan: 0.45%, DPAF - Regular Plan: 1.10%, DPAF - Direct Plan: 0.44%, DPPBF - Regular Plan: 1.46%, DPPBF - Direct Plan: 0.34%, DPBPDF - Regular Plan: 0.90%, DPBPDF - Direct Plan: 0.34%, DPFRF - Regular Plan: 0.46%, DPFRF - Direct Plan: 0.21%, DPUSTF - Regular Plan: 0.54%, DPUSTF - Direct Plan: 0.27%, DPHDF - Regular Plan: 1.82%, DPHDF - Direct Plan: 0.59%, DPGF - Regular Plan: 0.86%, DPGF - Direct Plan: 0.19%, DPSDF - Regular Plan: 1.22%, DPSDF - Direct Plan: 0.20%, DPCRF - Regular Plan: 1.86%, DPCRF - Direct Plan: 0.92%, DPMTF - Regular Plan: 1.20%, DPMTF - Direct Plan: 0.34%, DPSMF - Regular Plan: 1.53%, DPSMF - Direct Plan: 0.51%, DPLDF - Regular Plan: 1.20%, DPLDF - Direct Plan: 0.70%, DPICF - Regular Plan: 0.11%, DPICF - Direct Plan: 0.05%, DPDBF - Regular Plan: 1.42%, DPDBF - Direct Plan: 0.58%.@@ Total Expense Ratio includes Goods and Services Tax on management fees & additional commission.ICRA has assigned the "[ICRA] AAAmfs" (pronounced as ICRA triple A m f s) rating to the DHFL Pramerica Insta Cash Fund, DHFL Pramerica Ultra Short Term Fund, DHFL Pramerica Floating Rate Fund, DHFL Pramerica Banking and PSU Debt Fund, DHFL Pramerica Dynamic Bond Fund, DHFL Pramerica Medium Term Fund and DHFL Pramerica Premier Bond Fund. Schemes with this rating are considered to have the highest degree of safety regarding timely receipt of payments from the investments that they have made. ICRA has assigned the "[ICRA] AA+mfs" (pronounced as ICRA double A plus m f s) rating to the DHFL Pramerica Short Maturity Fund. Schemes with this rating are considered to have the high degree of safety regarding timely receipt of payments from the investments that they have made.The ratings should, however, not be construed as an indication of the performance of the Mutual Fund scheme or of volatility in its returns For complete rating scale and definitions please refer to ICRA's Website www.icra.in or other ICRA Rating Publications ICRA Credit Quality Rating Methodology for debt mutual fund schemes ICRA's mutual fund rating methodology is based on evaluating the inherent credit quality of the fund's portfolio. As a measure of the credit quality of a debt fund's assets, ICRA uses the concept of "credit scores". These scores are based on ICRA's estimates of credit risk associated with each exposure of the portfolio taking into account its maturity. To quantify the credit risk scores, ICRA uses its database of historical default rates for various rating categories for various maturity buckets. The credit risk ratings incorporate ICRA's assessment of a debt fund's published investment objectives and policies, its management characteristics, and the creditworthiness of its investment portfolio. ICRA reviews relevant fund information on an ongoing basis to support its published rating opinions. If the portfolio credit score meets the benchmark of the assigned rating during the review, the rating is retained. In an event that the benchmark credit score is breached, ICRA gives a month's time to the debt fund manager to bring the portfolio credit score within the benchmark credit score. If the debt fund manager is able to reduce the portfolio credit score within the benchmark credit score, the rating is retained. If the portfolio still continues to breach the benchmark credit score, the rating is revised to reflect the change in credit quality.
PortfolioIssuer % to Net
AssetsRating
GOI Securities 44.668.39% Rajasthan SDL Special Mat 2019
21.44 SOV
8.27% Rajasthan SDL Special Mat 2023
13.32 SOV
7.19 Kerala SDL Mat 2027 8.47 SOV8.39% Rajasthan SDL Uday Mat 2020
1.43 SOV
Issuer % to Net Assets
Rating
Corporate Debt 8.60Reliance Industries Ltd. 8.60 CRISIL AAACBLO 0.40Cash & Current Assets 46.34Total 100.00
0.40
8.60
44.66
46.34
CBLO
Corporate Debt
GOI Securities
Cash & Current Assets
44.66
55.34
SOVEREIGN
AAA / A1+
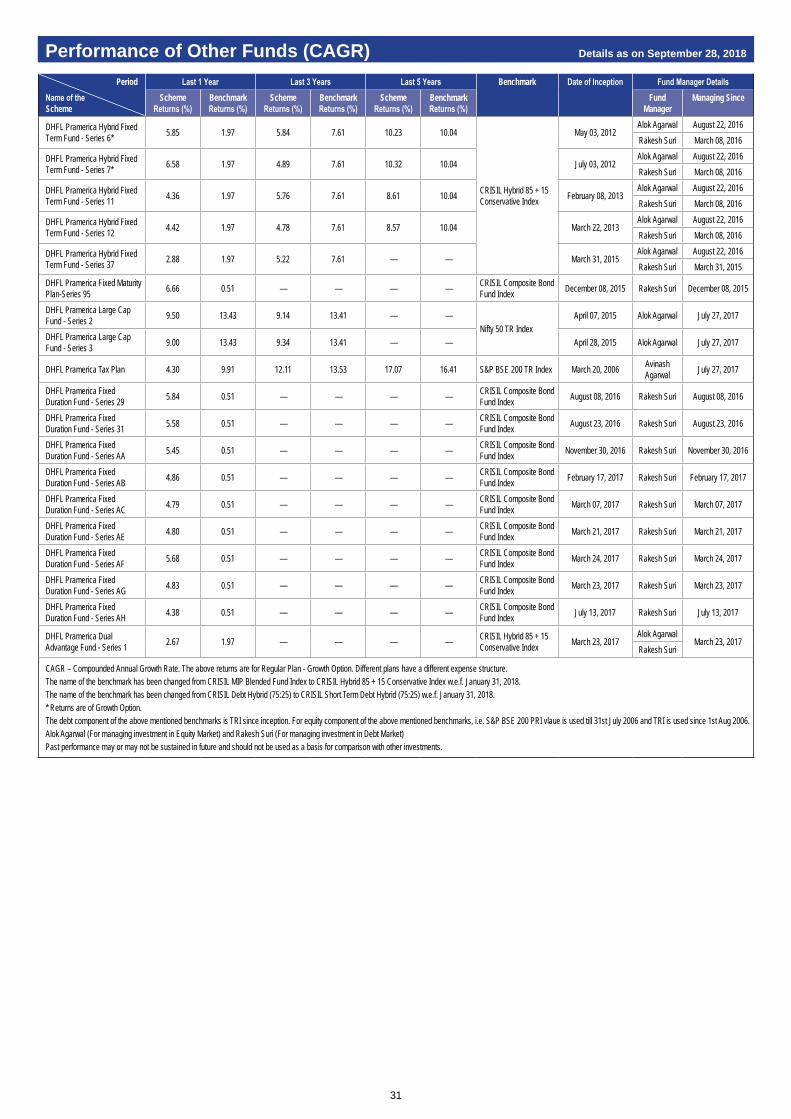
31
Performance of Other Funds (CAGR) Details as on September 28, 2018
Period Last 1 Year Last 3 Years Last 5 Years Benchmark Date of Inception Fund Manager DetailsName of the Scheme
Scheme Returns (%)
Benchmark Returns (%)
Scheme Returns (%)
Benchmark Returns (%)
Scheme Returns (%)
Benchmark Returns (%)
Fund Manager
Managing Since
DHFL Pramerica Hybrid Fixed Term Fund - Series 6* 5.85 1.97 5.84 7.61 10.23 10.04
CRISIL Hybrid 85 + 15 Conservative Index
May 03, 2012Alok Agarwal August 22, 2016Rakesh Suri March 08, 2016
DHFL Pramerica Hybrid Fixed Term Fund - Series 7* 6.58 1.97 4.89 7.61 10.32 10.04 July 03, 2012
Alok Agarwal August 22, 2016Rakesh Suri March 08, 2016
DHFL Pramerica Hybrid Fixed Term Fund - Series 11 4.36 1.97 5.76 7.61 8.61 10.04 February 08, 2013
Alok Agarwal August 22, 2016Rakesh Suri March 08, 2016
DHFL Pramerica Hybrid Fixed Term Fund - Series 12 4.42 1.97 4.78 7.61 8.57 10.04 March 22, 2013
Alok Agarwal August 22, 2016Rakesh Suri March 08, 2016
DHFL Pramerica Hybrid Fixed Term Fund - Series 37 2.88 1.97 5.22 7.61 — — March 31, 2015
Alok Agarwal August 22, 2016Rakesh Suri March 31, 2015
DHFL Pramerica Fixed Maturity Plan-Series 95 6.66 0.51 — — — — CRISIL Composite Bond
Fund Index December 08, 2015 Rakesh Suri December 08, 2015
DHFL Pramerica Large Cap Fund - Series 2 9.50 13.43 9.14 13.41 — —
Nifty 50 TR IndexApril 07, 2015 Alok Agarwal July 27, 2017
DHFL Pramerica Large Cap Fund - Series 3 9.00 13.43 9.34 13.41 — — April 28, 2015 Alok Agarwal July 27, 2017
DHFL Pramerica Tax Plan 4.30 9.91 12.11 13.53 17.07 16.41 S&P BSE 200 TR Index March 20, 2006 Avinash Agarwal July 27, 2017
DHFL Pramerica Fixed Duration Fund - Series 29 5.84 0.51 — — — — CRISIL Composite Bond
Fund Index August 08, 2016 Rakesh Suri August 08, 2016
DHFL Pramerica Fixed Duration Fund - Series 31 5.58 0.51 — — — — CRISIL Composite Bond
Fund Index August 23, 2016 Rakesh Suri August 23, 2016
DHFL Pramerica Fixed Duration Fund - Series AA 5.45 0.51 — — — — CRISIL Composite Bond
Fund Index November 30, 2016 Rakesh Suri November 30, 2016
DHFL Pramerica Fixed Duration Fund - Series AB 4.86 0.51 — — — — CRISIL Composite Bond
Fund Index February 17, 2017 Rakesh Suri February 17, 2017
DHFL Pramerica Fixed Duration Fund - Series AC 4.79 0.51 — — — — CRISIL Composite Bond
Fund Index March 07, 2017 Rakesh Suri March 07, 2017
DHFL Pramerica Fixed Duration Fund - Series AE 4.80 0.51 — — — — CRISIL Composite Bond
Fund Index March 21, 2017 Rakesh Suri March 21, 2017
DHFL Pramerica Fixed Duration Fund - Series AF 5.68 0.51 — — — — CRISIL Composite Bond
Fund Index March 24, 2017 Rakesh Suri March 24, 2017
DHFL Pramerica Fixed Duration Fund - Series AG 4.83 0.51 — — — — CRISIL Composite Bond
Fund Index March 23, 2017 Rakesh Suri March 23, 2017
DHFL Pramerica Fixed Duration Fund - Series AH 4.38 0.51 — — — — CRISIL Composite Bond
Fund Index July 13, 2017 Rakesh Suri July 13, 2017
DHFL Pramerica Dual Advantage Fund - Series 1 2.67 1.97 — — — — CRISIL Hybrid 85 + 15
Conservative Index March 23, 2017Alok Agarwal
March 23, 2017Rakesh Suri
CAGR – Compounded Annual Growth Rate. The above returns are for Regular Plan - Growth Option. Different plans have a different expense structure.The name of the benchmark has been changed from CRISIL MIP Blended Fund Index to CRISIL Hybrid 85 + 15 Conservative Index w.e.f. January 31, 2018.The name of the benchmark has been changed from CRISIL Debt Hybrid (75:25) to CRISIL Short Term Debt Hybrid (75:25) w.e.f. January 31, 2018.* Returns are of Growth Option.The debt component of the above mentioned benchmarks is TRI since inception. For equity component of the above mentioned benchmarks, i.e. S&P BSE 200 PRI vlaue is used till 31st July 2006 and TRI is used since 1st Aug 2006.Alok Agarwal (For managing investment in Equity Market) and Rakesh Suri (For managing investment in Debt Market)Past performance may or may not be sustained in future and should not be used as a basis for comparison with other investments.
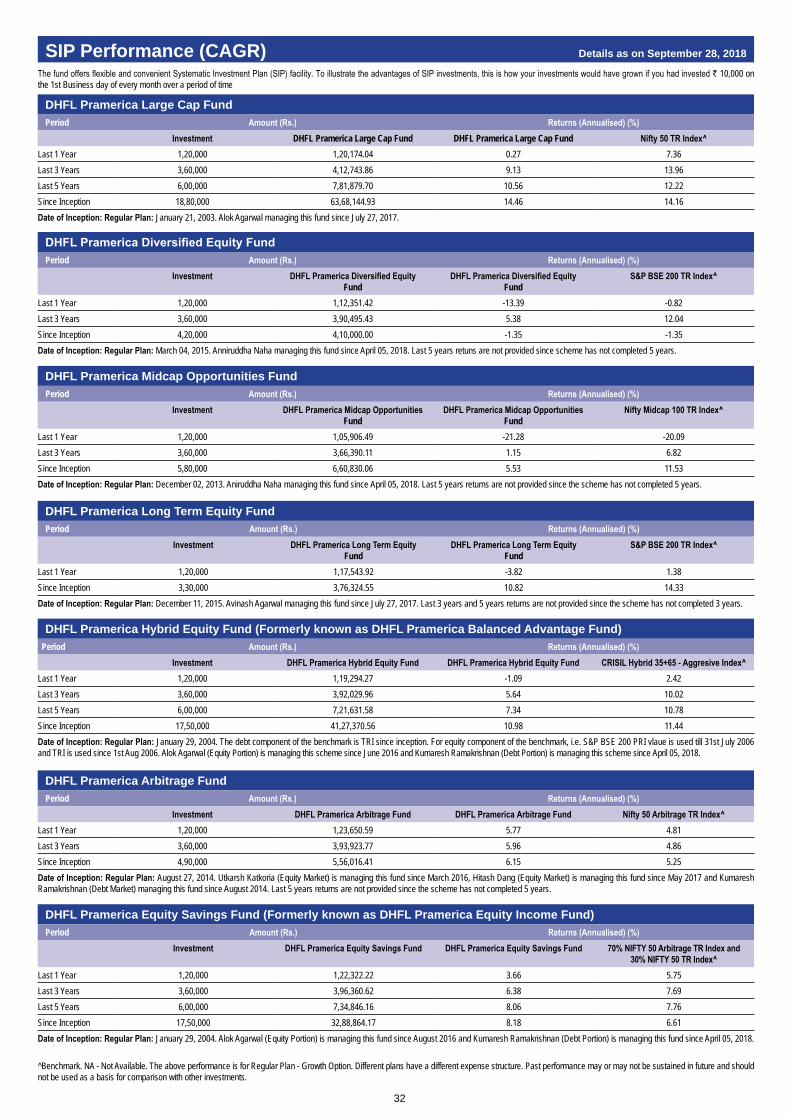
32
SIP Performance (CAGR) Details as on September 28, 2018
DHFL Pramerica Large Cap FundPeriod Amount (Rs.) Returns (Annualised) (%)
Investment DHFL Pramerica Large Cap Fund DHFL Pramerica Large Cap Fund Nifty 50 TR Index^Last 1 Year 1,20,000 1,20,174.04 0.27 7.36Last 3 Years 3,60,000 4,12,743.86 9.13 13.96Last 5 Years 6,00,000 7,81,879.70 10.56 12.22Since Inception 18,80,000 63,68,144.93 14.46 14.16Date of Inception: Regular Plan: January 21, 2003. Alok Agarwal managing this fund since July 27, 2017.
The fund offers flexible and convenient Systematic Investment Plan (SIP) facility. To illustrate the advantages of SIP investments, this is how your investments would have grown if you had invested ` 10,000 on the 1st Business day of every month over a period of time
DHFL Pramerica Diversified Equity FundPeriod Amount (Rs.) Returns (Annualised) (%)
Investment DHFL Pramerica Diversified Equity Fund
DHFL Pramerica Diversified Equity Fund
S&P BSE 200 TR Index^
Last 1 Year 1,20,000 1,12,351.42 -13.39 -0.82Last 3 Years 3,60,000 3,90,495.43 5.38 12.04Since Inception 4,20,000 4,10,000.00 -1.35 -1.35Date of Inception: Regular Plan: March 04, 2015. Anniruddha Naha managing this fund since April 05, 2018. Last 5 years retuns are not provided since scheme has not completed 5 years.
DHFL Pramerica Midcap Opportunities FundPeriod Amount (Rs.) Returns (Annualised) (%)
Investment DHFL Pramerica Midcap Opportunities Fund
DHFL Pramerica Midcap Opportunities Fund
Nifty Midcap 100 TR Index^
Last 1 Year 1,20,000 1,05,906.49 -21.28 -20.09Last 3 Years 3,60,000 3,66,390.11 1.15 6.82Since Inception 5,80,000 6,60,830.06 5.53 11.53Date of Inception: Regular Plan: December 02, 2013. Aniruddha Naha managing this fund since April 05, 2018. Last 5 years returns are not provided since the scheme has not completed 5 years.
^Benchmark. NA - Not Available. The above performance is for Regular Plan - Growth Option. Different plans have a different expense structure. Past performance may or may not be sustained in future and should not be used as a basis for comparison with other investments.
DHFL Pramerica Long Term Equity FundPeriod Amount (Rs.) Returns (Annualised) (%)
Investment DHFL Pramerica Long Term Equity Fund
DHFL Pramerica Long Term Equity Fund
S&P BSE 200 TR Index^
Last 1 Year 1,20,000 1,17,543.92 -3.82 1.38Since Inception 3,30,000 3,76,324.55 10.82 14.33Date of Inception: Regular Plan: December 11, 2015. Avinash Agarwal managing this fund since July 27, 2017. Last 3 years and 5 years returns are not provided since the scheme has not completed 3 years.
DHFL Pramerica Hybrid Equity Fund (Formerly known as DHFL Pramerica Balanced Advantage Fund)Period Amount (Rs.) Returns (Annualised) (%)
Investment DHFL Pramerica Hybrid Equity Fund DHFL Pramerica Hybrid Equity Fund CRISIL Hybrid 35+65 - Aggresive Index^Last 1 Year 1,20,000 1,19,294.27 -1.09 2.42Last 3 Years 3,60,000 3,92,029.96 5.64 10.02Last 5 Years 6,00,000 7,21,631.58 7.34 10.78Since Inception 17,50,000 41,27,370.56 10.98 11.44Date of Inception: Regular Plan: January 29, 2004. The debt component of the benchmark is TRI since inception. For equity component of the benchmark, i.e. S&P BSE 200 PRI vlaue is used till 31st July 2006 and TRI is used since 1st Aug 2006. Alok Agarwal (Equity Portion) is managing this scheme since June 2016 and Kumaresh Ramakrishnan (Debt Portion) is managing this scheme since April 05, 2018.
DHFL Pramerica Arbitrage FundPeriod Amount (Rs.) Returns (Annualised) (%)
Investment DHFL Pramerica Arbitrage Fund DHFL Pramerica Arbitrage Fund Nifty 50 Arbitrage TR Index^Last 1 Year 1,20,000 1,23,650.59 5.77 4.81Last 3 Years 3,60,000 3,93,923.77 5.96 4.86Since Inception 4,90,000 5,56,016.41 6.15 5.25Date of Inception: Regular Plan: August 27, 2014. Utkarsh Katkoria (Equity Market) is managing this fund since March 2016, Hitash Dang (Equity Market) is managing this fund since May 2017 and Kumaresh Ramakrishnan (Debt Market) managing this fund since August 2014. Last 5 years returns are not provided since the scheme has not completed 5 years.
DHFL Pramerica Equity Savings Fund (Formerly known as DHFL Pramerica Equity Income Fund)Period Amount (Rs.) Returns (Annualised) (%)
Investment DHFL Pramerica Equity Savings Fund DHFL Pramerica Equity Savings Fund 70% NIFTY 50 Arbitrage TR Index and 30% NIFTY 50 TR Index^
Last 1 Year 1,20,000 1,22,322.22 3.66 5.75Last 3 Years 3,60,000 3,96,360.62 6.38 7.69Last 5 Years 6,00,000 7,34,846.16 8.06 7.76Since Inception 17,50,000 32,88,864.17 8.18 6.61Date of Inception: Regular Plan: January 29, 2004. Alok Agarwal (Equity Portion) is managing this fund since August 2016 and Kumaresh Ramakrishnan (Debt Portion) is managing this fund since April 05, 2018.

33
Fund Manager:An employee of the asset management company such as a mutual fund or life insurer, who manages investments of the scheme. He is usually part of a larger team of fund managers and research analysts.
Application Amount for Fresh Subscription:This is the minimum investment amount for a new investor in a mutual fund scheme.
Minimum Additional Amount:This is the minimum investment amount for an existing investor in a mutual fund scheme.
Yield to Maturity:The Yield to Maturity or the YTM is the rate of return anticipated on a bond if held until maturity. YTM is expressed as an annual rate. The YTM factors in the bond’s current market price, par value, coupon interest rate and time to maturity.
SIP:SIP or systematic investment plan works on the principle of making periodic investment of a fixed sum. It works similar to a recurring bank deposit. For instance, an investor may opt for an SIP that invests Rs. 500 every 15th of the month in an equity fund for a period of three years.
NAV:The NAV or the net asset value is the total asset value per unit of the mutual fund after deducting all related and permissible expenses. The NAV is calculated at the end of every business day. It is the value at which the investor enters or exits the mutual fund.
Benchmark:A group of securities, usually a market index, whose performance is used as a standard or benchmark to measure investment performance of mutual funds, among other investments. Some typical benchmarks include the Nifty, Sensex, BSE200, BSE500, 10- year Gsec.
Entry Load:A mutual fund may have a sales charge or load at the time of entry and/or exit to compensate the distributor/agent.
Entry load is charged at the time an investor purchases the units of a mutual fund. The entry load is added to the prevailing NAV at the time of investment. For instance, if the NAV is Rs. 100 and the entry load is 1%, the investor will enter the fund at Rs. 101.
Note: SEBI, vide circular dated June 30, 2009 has abolished entry load and mandated that the upfront commission to distributors will be paid by the investor directly to the distributor, based on his assessment of various factors including the service rendered by the distributor.
Exit load:Exit load is charged at the time an investor redeems the units of a mutual fund. The exit load is deducted from the prevailing NAV at the time of redemption. For instance, if the NAV is Rs. 100 and the exit load is 1%, the redemption price would be Rs. 99 per unit.
Modified Duration:Modified duration is the price sensitivity and the percentage change in price for a unit change in yield.
Macaulay Duration:The Macaulay duration is the weighted average term to maturity of the cash flows from a bond. The weight of each cash flow is determined by dividing the present value of the cash flow by the price.
Standard Deviation:Standard Deviation is a statistical measure of the range of an investment’s performance. When a mutual fund has a high standard deviation, its means its range of performance is wide, implying greater volatility.
Sharpe Ratio:The Sharpe Ratio, named after its founder, the Nobel Laureate William Sharpe, is a measure of risk-adjusted returns. It is calculated using standard deviation and excess return to determine reward per unit of risk.
Beta:Beta is a measure of an investment’s volatility vis-à-vis the market. Beta of less than 1 means that the security will be less volatile than the market. A beta of greater than 1 implies that the security’s price will be more volatile than the market.
AUM:AUM or assets under management refers to the recent/ updated cumulative market value of investments managed by a mutual fund or any investment firm.
Holdings:The holdings or the portfolio is a mutual fund’s latest or updated reported statement of investments/ securities. These are usually displayed in terms of percentage to net assets or the rupee value or both. The objective is to give investors an idea of where their money is being invested by the fund manager.
Nature of Scheme:The investment objective and underlying investments determine the nature of the mutual fund scheme. For instance, a mutual fund that aims at generating capital appreciation by investing in stock markets is an equity fund or growth fund. Likewise, a mutual fund that aims at capital preservation by investing in debt markets is a debt fund or income fund. Each of these categories may have sub-categories.
Rating Profile:Mutual funds invest in securities after evaluating their creditworthiness as disclosed by the ratings. A depiction of the mutual fund in various investments based on their ratings becomes the rating profile of the fund. Typically, this is a feature of debt funds.
Portfolio Turnover:Portfolio Turnover is a measure of how frequently assets within a fund are bought and sold by the managers.
R-Squared:R-Squared is a statistical measure that represents the percentage of a fund or security’s movements that can be explained by movements in a benchmark index.
Average Maturity:In a mutual fund containing debt securities, Average Maturity is the average amount of time until the debt securities mature.
Portfolio Yield:Portfolio Yield is computed by determining the cash flows for the portfolio and determining the interest rate that will make the present value of the cash flows equal to the market value of the portfolio.
Total Expense Ratio:Weighted Average i.e. Total Expense of the month / average Asset / number of days in month* days in a year.
How to read the Factsheet

Enter Exit+Re-Enter
This information/disclosure is made at the discretion of DHFLPramericaAsset Managers Private Limited (‘theAMC’) and is for information purpose only. This information/disclosure doesnot constitute a distribution, an endorsement, an offer to buy or sell or the solicitation of an offer to buy or sell any securities or any other financial products / investment facility (collectively“Products”) mentioned in this information/disclosure or an attempt to influence the opinion or behavior of the Investors/Recipients. The information incorporated in this disclosure is solelyto enhance the transparency of the product/facility offered by theAMC and should not be treated as an endorsement in any manner whatsoever. This disclosure is not meant to serve as aprofessional advice for the Investors/Recipients and Investors/Recipients are advised to seek independent professional advice and arrive at an informed investment decision beforemaking any investments.
Stop trying to time the market ! Invest in a P/E based strategy
In the equitymarkets, one should invest when the valuation (P/E) is low, not the index level. Simply putwe should invest whenmarket is cheaper and theP/E ratio helps us decide this.� Methodology adopted for P/E basedStrategy illustrations:
� Asset allocation is done on the basis of the table shownhere;
� Theequitymarket/component is represented byNIFTY50;
� Thebalance allocation (i.e. portfolio valueminus equity allocation) is considered as debt component;
� Debt component returns is considered at 6%per annum for the calculation purpose;
� Any allocation into or out of equity is carried out on the first working day of themonth;
� Variation is defined as the deviation of 20 dayAverage trailingP/E ofNIFTY50as at themonth-end, comparedwith its Long-TermAverageP/E (i.e. from1st Jan. 1999).
Historic P/E Strategy Returns for Variation Band Above 40%
Data Source : NIFTY 50 , Market Data and Internal Calculations. The above graph and table are intended for illustration purpose only. To help understand the performance of the equitymarket, represented by the index NIFTY50, on amonthly rolling for 5 years CAGRbasis fromJanuary 1999 toSeptember 2018 based on the various bands of P/E variation. P/E variation isdefined as the deviation of trailing PE of NIFTY 50 (observed on a 20 days moving average basis) from Long-Term Average PE of NIFTY 50. Past performance may or may not besustained in the future.
The information contained herein is provided by DHFL PramericaAsset Managers Private Limited (theAMC) on the basis of publicly available information, internally developed data andother third party sources believed to be reliable. However, the AMC cannot guarantee the accuracy of such information, assure its completeness, or warrant such information will not bechanged. The information contained herein is current as of the date of issuance (or such earlier date as referenced herein) and is subject to change without notice. There can be noassurance that any forecast made herein will be actually realized. These materials do not take into account individual investor’s objectives, needs or circumstances or the suitability of anysecurities, financial instruments or investment strategies described herein for particular investor. Hence, each investor is advised to consult his or her own professional investment / taxadvisor / consultant for advice in this regard. These materials are not intended for distribution to or use by any person in any jurisdiction where such distribution would be contrary to locallawor regulation.
Disclaimer for Power Goal Facility: Power Goal Facility offered by DHFLPramericaAsset Managers Pvt. Ltd. or its affiliates is not sponsored, endorsed, sold or promoted by India IndexServices & Products Limited (IISL) and its affiliates. IISL and its affiliates do not make any representation or warranty, express or implied (including warranties of merchantability or fitnessfor particular purpose or use) to the owners of Power Goal Facility or any member of the public regarding the advisability of investing in securities generally or in the Power Goal Facilitylinked to Nifty 50 Index or particularly in the ability of the Nifty 50 Index to track general stock market performance in India. Please read the full Disclaimers in relation to Nifty 50 Index in theScheme InformationDocument.”
DHFL Pramerica Power Goals : Details as on 1st October, 2018
Long - termAverage P/E of Nifty 50 19.42
Last 20 Days MovingAverage of Nifty 50 27.47
Applicable P/E Variation Band Above 40%
InitialAssetAllocation 0%Allocation to Equity
Re - balancingAllocation 100% from equity to debt
Mutual Fund Investments are subject to market risks, read all scheme related documents carefully.Pramerica and Pramerica Financial are trade names used by Prudential Financial, Inc., a company incorporated and with its principal place of business in the United States, and by its
affiliated companies in select countries outside the United States. None of these companies are affiliated in any manner with Prudential plc, a company incorporated in the United Kingdom
5 Years
Minimum 18.86% -0.77%
Maximum 19.69% 2.44%
Average 19.41% 0.26%
5 Years
Minimum 15.86% 7.03%
Maximum 16.56% 9.50%
Average 16.22% 8.57%

Mutual Fund investments are subject to market risks, read all scheme related documents carefully. Pramerica is a trade name used by Prudential Financial, Inc., (PFI) a company incorporated and with its principal place of business in the United States, and by its affiliated
companies in select countries outside the United States. None of these companies are affiliated in any manner with Prudential plc, a company incorporated in the United Kingdom.
Rules Based Asset Allocation
A Solution For Long-Term Wealth Creation
Automatic Re-Balancing
Single Point Solution No Need To Time The Market
Manages Volatility Effectively
Power Your Returns &
Manage Market Volatility
with
(An Investment Facility)
DHFLPramerica

Mutual Fund investments are subject to market risks, read all scheme related documents carefully. Pramerica is a trade name used by Prudential Financial, Inc., (PFI) a company incorporated and with its principal place of business in the United States, and by its affiliated
companies in select countries outside the United States. None of these companies are affiliated in any manner with Prudential plc, a company incorporated in the United Kingdom.
Moderately High – Investors understand that their principal will be at moderately high risk
This product is suitable for investors who are seeking*:
• Capital growth over the long term
• Investment predominantly in equity and equity related securities of Large Cap companies
• Degree of risk – MODERATELY HIGH
*Investors should consult their financial advisers if in doubt about whether the product is suitable for them.
(Large Cap Fund - An open ended equity schemepredominantly investing in large cap stocks)
Celebrating 15 years of wealth creation
C82/1
8-19