Embed Size (px)
Citation preview

FUND UPDATEYOUR INVESTMENT PERFORMANCE
December 2018
Market Outlook Fund Performance Contents Individual Funds Group Funds
MARKET OUTLOOK 2 KOTAK GUARANTEED GROWTH FUND(ULIF-013-27/06/03-GRTGWTFND-107) 27
FUND PERFORMANCE OF ULIP FUNDS 7 KOTAK GUARANTEED BALANCED FUND(ULIF-010-27/06/03-GRTBALFND-107) 28
PRODUCT - FUND MATRIX 10 PENSION CLASSIC OPPORTUNITIES FUND(ULIF-042-07/01/10-PNCLAOPFND-107) 29
CLASSIC OPPORTUNITIES FUND(ULIF-033-16/12/09-CLAOPPFND-107) 12 KOTAK PENSION OPPORTUNITIES FUND
(ULIF-032-17/07/09-PNOPPFND-107) 30
FRONTLINE EQUITY FUND(ULIF-034-17/12/09-FRLEQUFND-107) 13 PENSION FRONTLINE EQUITY FUND
(ULIF-044-11/01/10-PNFRLEQFND-107) 31
DYNAMIC FLOOR FUND II(ULIF-035-17/12/09-DYFLRFND2-107) 14 PENSION GUARANTEE FUND
(ULIF-038-21/12/09-PNGRTFND-107) 32
BALANCED FUND(ULIF-037-21/12/09-BALKFND-107) 15 KOTAK PENSION GROWTH FUND
(ULIF-030-07/01/09-PNGWTFND-107) 33
KOTAK OPPORTUNITIES FUND(ULIF-029-02/10/08-OPPFND-107) 16 KOTAK PENSION FLOOR FUND
(ULIF-031-13/07/09-PNFLRFND-107) 34
KOTAK AGGRESSIVE GROWTH FUND(ULIF-018-13/09/04-AGRGWTFND-107) 17 PENSION FLOOR FUND II
(ULIF-043-08/01/10-PNFLRKFND2-107) 35
GUARANTEE FUND(ULIF-048-05/02/10-GRTFND-107) 18 KOTAK PENSION BALANCED FUND
(ULIF-011-27/06/03-PNBALFND-107 ) 36
MONEY MARKET FUND(ULIF-041-05/01/10-MNMKKFND-107) 19 PENSION BALANCED FUND II
(ULIF-046-24/01/10-PNBALFND2-107) 37
KOTAK DYNAMIC GROWTH FUND(ULIF-012-27/06/03-DYGWTFND-107) 20 KOTAK PENSION BOND FUND
(ULIF-017-15/04/04-PNBNDFND-107) 38
DYNAMIC FLOOR FUND(ULIF-028-14/11/06-DYFLRFND-107) 21 KOTAK PENSION GILT FUND
(ULIF-008-27/06/03-PNGLTFND-107) 39
KOTAK DYNAMIC BALANCED FUND(ULIF-009-27/06/03-DYBALFND-107) 22 KOTAK PENSION FLOATING RATE FUND
(ULIF-022-07/12/04-PNFLTRFND-107) 40
KOTAK DYNAMIC BOND FUND(ULIF-015-15/04/04-DYBNDFND-107) 23 PENSION MONEY MARKET FUND II
(ULIF-039-28/12/09-PNMNMKFND-107) 41
KOTAK DYNAMIC GILT FUND(ULIF-006-27/06/03-DYGLTFND-107) 24 KOTAK ADVANTAGE MULTIPLIER FUND II
(ULIF-026-21/04/06-ADVMULFND2-107) 42
KOTAK DYNAMIC FLOATING RATE FUND(ULIF-020-07/12/04-DYFLTRFND-107) 25 DISCONTINUED POLICY FUND
(ULIF-050-23/03/11-DISPOLFND-107) 43
PEAK GUARANTEE FUND I(ULIF-049-14/02/10-PKGRTFND1-107) 26
INDIVIDUAL FUNDS
Click on the Fund Name for details
GROUP FUNDS
Click on the Fund Name for details
KOTAK GROUP DYNAMIC FLOOR FUND(ULGF-015-07/01/10-DYFLRFND-107) 45 KOTAK GROUP SECURE CAPITAL FUND
(ULGF-016-12/04/11-SECCAPFND-107) 51
KOTAK GROUP BALANCED FUND(ULGF-003-27/06/03-BALFND-107) 46 KOTAK GROUP SHORT TERM BOND FUND
(ULGF-018-18/12/13-SHTRMBND-107) 52
KOTAK GROUP BOND FUND(ULGF-004-15/04/04-BNDFND-107) 47 ANNEXURE 53
KOTAK GROUP GILT FUND(ULGF-002-27/06/03-GLTFND-107) 48 DISCLAIMER 59
KOTAK GROUP FLOATING RATE FUND(ULGF-005-07/12/04-FLTRFND-107) 49
KOTAK GROUP MONEY MARKET FUND(ULGF-001-27/06/03-MNMKFND-107) 50
INDIVIDUAL FUNDS
Click on the Fund Name for details
GROUP FUNDS
Click on the Fund Name for details
KOTAK GROUP DYNAMIC FLOOR FUND(ULGF-015-07/01/10-DYFLRFND-107) 45 KOTAK GROUP SECURE CAPITAL FUND
(ULGF-016-12/04/11-SECCAPFND-107) 51
KOTAK GROUP BALANCED FUND(ULGF-003-27/06/03-BALFND-107) 46 KOTAK GROUP SHORT TERM BOND FUND
(ULGF-018-18/12/13-SHTRMBND-107) 52
KOTAK GROUP BOND FUND(ULGF-004-15/04/04-BNDFND-107) 47 KOTAK GROUP PRUDENT FUND
(ULGF-019-04/07/17-KGPFFND-107) 53
KOTAK GROUP GILT FUND(ULGF-002-27/06/03-GLTFND-107) 48 ANNEXURE 54
KOTAK GROUP FLOATING RATE FUND(ULGF-005-07/12/04-FLTRFND-107) 49 DISCLAIMER 60
KOTAK GROUP MONEY MARKET FUND(ULGF-001-27/06/03-MNMKFND-107) 50
MONTHLY UPDATE DECEMBER 2018 | (based on last business day) 01AS ON 30th NOVEMBER 2018
CONTENTS

Market Outlook Fund Performance Contents Individual Funds Group Funds
MONTHLY UPDATE DECEMBER 2018 | (based on last business day) 02
MARKET OUTLOOK
AS ON 30th NOVEMBER 2018
Month Gone By – Markets
Market Indicators (period ended November 30,2018)
Indian equities recovered from October lows (Nifty +4.7%) as locally sentiment turned positive on back of macro variables sustaining the favorable trend. Although global sentiment for equities was negatively impacted by US-China trade talks, but US Fed Chairman Mr.Powell’s statement that the central bank’s benchmark interest rate is “just below” neutral boosted the sentiments. Locally, RBI board met during the month followed by announcements of easing ECB hedging requirments thereby enabling larger banks to address the refiancing needs of NBFC. Nifty Mid-cap 50 and Small cap 50 indicies underperformed Nifty by 3.7% and 1.8% respectively.
10 year benchmark yield fell by 25 bps in Novemeber to 7.6%. Bond yields broadly tracked oil price movements which was down 22.2% in November post an 8.8% fall in October and below USD 60/bbl for the first time since October 2017. INR appreciated by 6% in November and ended the month at 69.6/USD, the best month for INR since Jan 2012.
Flows
Indices
Performance1
month1 yr
5yr
(CAGR)
Equity
Sensex 5.1% 9.2% 11.7%
Nifty 4.7% 6.4% 12.0%
Nifty Midcap 50 1.0% -8.3% 17.0%
Nifty SmallCap
502.9% -33.3% 12.4%
Bond Market
Crisil
Composite
Bond Index
1.9% 3.8% 9.0%
Commodities
Gold(USD/oz) 2.0% -4.5% -1.7%
Indices
PerformanceNov-18 Oct-18
1 month
Change
Bond Market
10 yr Gsec 7.6% 7.9% -0.2%
Currency
USD/INR 69.6 74.0 5.9%
Commodities
Brent
Crude(USD/bbl)58.7 75.5 -22.2%
Net Flows
(USD Bn)Nov-18 Oct-18 CY 18
FII (Equity) 0.9 -3.7 -4.9
FII (Debt) 0.9 -1.3 -7.5
DII (Equity) -0.1 3.5 15.8
Net FII Flows (USD b) Net DII Flows (USD b) Net FII Debt (USD b)
29.3
7.8
- 4.9
-13.0
14.1 15.8
26.222.9
-7.5
CY
06
CY
07
CY
08
CY
09
CY
10
CY
11
CY
12
CY
13
CY
14
CY
15
CY
16
CY
17
YT
D C
Y1
8
-12.2

Market Outlook Fund Performance Contents Individual Funds Group Funds
MONTHLY UPDATE DECEMBER 2018 | (based on last business day) 03
MARKET OUTLOOK
AS ON 30th NOVEMBER 2018
Economy
2QFY19 GDP growth slowed down to 7.1% from 8.2% in 1Q and came below consensus estimates of 7.5%. GVA rose 6.9% in 2Q, compared with the median estimate of 7.3%. Agriculture expanded 3.8% while manufacturing grew 7.4% in 2QFY19. Index for Industrial Production for September came in at 4.5%, slightly above expectations. Manufacturing was up 4.6% while electricity generation rose 8.2%. Capital goods production slowed to 5.8%. Positive growth in 17 of the 23 industry groups in the manufacturing sector.
Consumer Price Index (CPI) inflation for October declined further to 3.3%, marking 4 straight months of deceleration. Core inflation remained elevated at 5.8%. WPI hit 4-month high of 5.28% reflecting the impact of pass-through of higher commodity prices and INR depreciation. Food prices witnessed softening with deflation at 1.49% in October.
Trade deficit for October reverted to trend breaching USD17bn despite strong growth in exports (17.9% YoY) and lower gold imports (USD 1.7bn vs USD 2.6bn), offset by higher oil and capital goods imports (16.3% YoY). In imports, electronic goods (+32% YoY) and base metals (+30%) were leaders while in exports, pharma (+13%) and textiles (+22%) revived from September.
Index for Industrial Production (IIP)
3.8%
2.2%
8.4%
7.1%7.5%
7.1%
4.4%4.8%
3.2%
7.0%6.6%
4.3% 4.5%
0.0%
1.0%
2.0%
3.0%
4.0%
5.0%
6.0%
7.0%
8.0%
9.0%Inflation
CPI WPI
0.0%
1.0%
2.0%
3.0%
4.0%
5.0%
6.0%
7.0%
Foreign Institutional Investors (FIIs) turned buyers of Indian equities in November at USD 0.9bn after three consecutive months of outflows aggregating to USD 5.3 bn (Aug-Oct). YTD FIIs net equity outflows is now at USD 4.9 bn. DIIs remained net equity buyers at USD 0.1bn, lowest in last 10 months. YTD DII inflows are at USD15.8bn. Mutual funds recorded the 28th consecutive month of net buying at USD 0.3bn. YTD mutual fund inflows are at USD 16.8bn while other DIIs outflows are at USD 1.3bn. FIIs also recorded net intflows in debt markets at USD0.9bn in November. YTD FIIs are net sellers at USD7.5bn.

Market Outlook Fund Performance Contents Individual Funds Group Funds
MONTHLY UPDATE DECEMBER 2018 | (based on last business day) 04
MARKET OUTLOOK
AS ON 30th NOVEMBER 2018
Deal activity was muted in November with 5 deals totalling USD 301mn
Events impacting markets
• Earnings- 2Q FY19 earnings season ended satisfactorily at the aggregate level for the NIFTY universe. Aggregate revenue and PAT growth for Nifty universe was at 26% and 15% respectively.
• RBI Board Meet- RBI’s much anticipated Central Board meeting resulted in following outcomes: 1) Decision to create a joint expert committee between GOI and RBI to examine the Economic Capital Framework (ECF) which determines the Central Bank’s required reserves level. 2) Enacting a possible stressed standard assets’ restructuring scheme for SMEs with aggregate credit facilities of up to INR 250mn. 3) Extension of transition period for implementation of last tranche of 0.625% under the Capital Conservation Buffer (CCB) by one year while retaining the CRAR at 9%. 4) Examination of issues pertaining to banks under PCA by RBI’s Board for Financial Supervision (BFS)
• State elections- Assembly polls went underway in MP and Mizoram with reported record voter turnout of 75% with results to be declared on December 11. Rajasthan, Chattisgarh and Telagana will also head into election in early December, tracking the LS polls later next year
• Ease of Doing business Ranking- India jumped 23 notches to rank 77th in Ease of Doing Business Rankings, 2019 released by the World Bank, while also featuring as one of the top 10 improvers in this year’s assessment. India witnessed its ranking improving in 6 out of 10 parameters tracked by the World Bank with biggest improvements coming in dealing with construction permits (ranked 52 in 2019 vs 181 in 2018) and trading across border (ranked 80 in 2019 vs 146 in 2018).
Equities can react in the coming months based on following events
• Macrovariablessuchasinflation,fiscaldeficitandtheCADwouldneedclosemonitoringfrom here on along with the interest rate policy outlook. Any adverse movement in these macro variables can impact the market negatively.
• OngoingTradeWartusslebetweentheUnitedStaesandChinacanhaverepurcussionsfor the Global trade and markets. Both the sides seem to be unrelenting in their stance as of now, However since the US has a massive Trade deficit with China, it has found more absolute value of goods on which they have applied tariffs. If the issue escalates more, Global Gdp growth will also be impacted negatively
• GeopoliticaltensionsandlingeringrisksoflargesupplydisruptionsledbyUSsanctionson Iran adds upward risk bias to oil. However, the US also wants lower Oil prices and it remains to be seen if countries like Saudi Arabia can pump more oil to keep oil prices in check
Equity Market Outlook

Market Outlook Fund Performance Contents Individual Funds Group Funds
MONTHLY UPDATE DECEMBER 2018 | (based on last business day) 05
MARKET OUTLOOK
AS ON 30th NOVEMBER 2018
Source: NSE
Nifty P/B Peak Min Average
3.4
6.4
2.3
3.7
2
4
6
No
v-0
3
No
v-0
4
No
v-0
5
No
v-0
6
No
v-0
7
No
v-0
8
No
v-0
9
No
v-1
0
No
v-1
1
No
v-1
2
No
v-1
3
No
v-1
4
No
v-1
5
No
v-1
6
No
v-1
7
No
v-1
8
• Corporate earnings growth trajectory would be key factor to determine the path ofdomestic markets. Markets are now looking forward to the Q2 reportcard from the companies. Given the deteriorating macro, earnings delivery will go a long way in sustaining multiples
• Forearningsrecovery,arecoveryinoverallcapitalformationcyclewouldbeakeyfactorapart from growth in consumption. While the key driver for capex in the economy would continue to be public spend, the private capex cycle should also benefit from three years of low average lending rates, better corporate profitability, easier availability of credit from the banking system, higher equity raising from a buoyant market, more FDI into manufacturing and infrastructure and a renewed focus on housing. Public capex growth is likely to remain healthy with a focus on roads, rural development and affordable housing.
• Apartfromthefactorsmentionedabove,thepaceofresolutionofNPLs(NonPerformingLoans) and the repair of the balance sheets of corporate private sector banks and state owned banks would play a role in the revival of private sector investments in India. In this regard, the plan to infuse Rs 2.11trn of capital into Public sector banks through a mix of recapitalization bonds, capital infusion as planned in the budget and fresh raise from the market, stands in good stead. Over time as the resolution of big ticket NPLs gather pace, the cycle of low capital and low growth could be broken, resulting in a pick-up in credit growth. A busy election calendar, prospects of a higher fiscal deficit and the likelihood of a meaningful rise in equity supply are some of the known headwinds even as household balance sheets rebalancing toward equities is unabated.
• KeysourcesofvolatilityanddownsideforEMequitiesarelikelytobetheUSFedraisingrates accompanied by a more hawkish forecast for the policy rate trajectory over CY19 and the Trump Administrations’ protectionist measures and concerns of a trade war.

Market Outlook Fund Performance Contents Individual Funds Group Funds
MONTHLY UPDATE DECEMBER 2018 | (based on last business day) 06
MARKET OUTLOOK
AS ON 30th NOVEMBER 2018
Source: Bloomberg
10-Year India G-Sec Yield (%)
7.1%
6.0%
7.6%
7.9%
4.0%
5.0%
6.0%
7.0%
8.0%
9.0%
10.0%
No
v-0
8
No
v-0
9
No
v-1
0
No
v-1
1
No
v-1
2
No
v-1
3
No
v-1
4
No
v-1
5
No
v-1
6
No
v-1
7
No
v-1
8
Debt market was in a bullish mode during the month due to steep fall in crude oil prices and sharp appreciation in INR. Sharp fall in crude was due to increase in inventories in US and concerns about near term global growth outlook resulting in INR appreciation. Weak GDP data would persuade RBI to hold rates and it might also look to announce policy to infuse durable liquidity to address the current tight liquidity conditions.
Fed is expected to stay on hold in the December policy as suggested by a reversal in stance of US Fed Chief. This development helped Indian G-sec yield to rally during the month.
RBI had conducted OMO of INR40,000 cr. for the month of November to infuse durable liquidity. RBI has also announced OMO of INR40,000 cr for the month of December. Announcement of OMO calendar has helped improve system liquidity and also keep the G-sec yield under check which was at elevated levels as compared to the prevailing RBI repo rate.
RBI is expected to hold rates in the upcoming policy due to reversal in stance signaled by US Fed, lower CPI data and falling crude oil prices. The 10yr benchmark G-sec could trade in a range of 7.50-8.00% in the near term.
Debt Market Outlook
Market Outlook Fund Performance Contents Individual Funds Group Funds
MONTHLY UPDATE DECEMBER 2018 | (based on last business day) 07
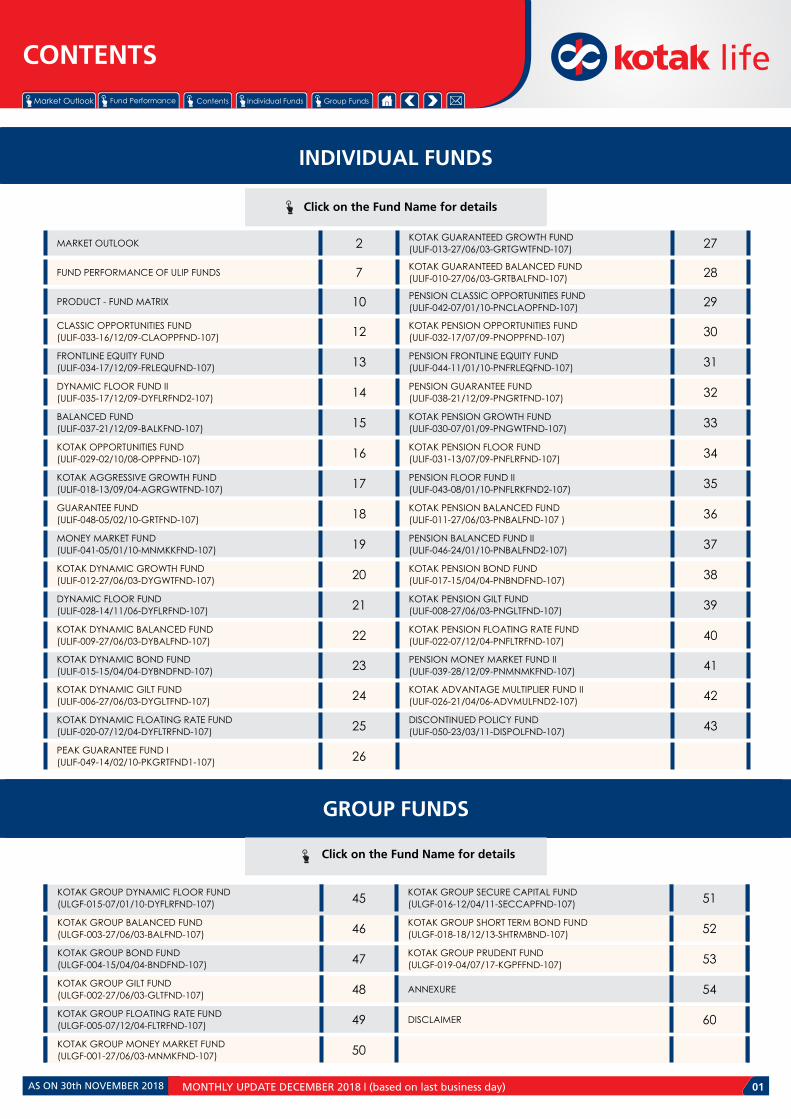
Funds available with insurance plans launched on & post Sept. 1, 2010.Returns AsOn 30th November 2018
Classic Opportunities Fund (AUM:
` 3,60,852.78 Lakhs)
Frontline Equity Fund
(AUM: ` 65,274.76
Lakhs)
Dynamic Floor Fund II (AUM: ` 60,225.01
Lakhs)
Balanced Fund (AUM: ` 12,574.77
Lakhs)
Guarantee Fund (AUM: ` 3,177.75
Lakhs)
Kotak Dynamic Bond
Fund (AUM: ` 97,333.95
Lakhs)
Kotak Dynamic Gilt Fund (AUM: ` 5,033.06
Lakhs)
Kotak Dynamic
Floating Rate Fund (AUM: ` 1,974.71
Lakhs)
Money Market Fund
(AUM: ` 35,253.25
Lakhs)
Discontinued Policy Fund
(AUM: ` 23,362.60
Lakhs)
1 month 4.6 4.2 2.9 3.2 2.4 2.3 2.7 1.1 0.6 0.5
3 months -8.1 -8.0 -1.5 -3.3 -2.0 3.5 4.5 2.1 1.7 1.5
6 months -3.0 -1.8 1.9 1.0 3.2 4.9 5.9 3.7 3.3 3.1
1 year -2.8 0.1 1.9 1.7 4.9 3.7 4.9 4.2 6.5 6.1
2 years 11.7 12.3 6.1 8.0 8.5 2.9 3.0 4.7 6.5 6.0
3 years 10.5 10.6 8.2 8.8 8.5 7.2 7.7 6.2 6.8 6.3
4 years 8.6 8.6 5.5 7.9 5.7 7.5 8.0 6.6 7.2 6.7
5 years 15.6 14.8 8.9 12.1 9.0 8.9 9.5 7.4 7.5 7.1
6 years 13.4 13.2 7.4 10.9 7.5 8.0 8.3 8.0 7.7 7.3
7 years 14.7 14.3 8.4 11.7 8.4 8.7 8.9 8.0 8.0 7.7
10 years n.a n.a n.a n.a n.a 9.2 8.1 7.5 n.a n.a
Inception 11.7 10.7 6.9 9.6 7.7 8.3 7.4 7.3 7.5 7.6
Funds available with insurance plans launched Prior to Sept. 1, 2010.Returns AsOn 30th November 2018
Kotak Opportunities Fund (AUM: ` 85,320.48
Lakhs)
Kotak Aggressive Growth Fund (AUM: ` 26,938.51
Lakhs)
Kotak Dynamic Growth Fund (AUM: ` 5,831.09
Lakhs)
Dynamic Floor Fund (AUM: ` 97,378.79
Lakhs)
Kotak Dynamic Balanced Fund (AUM: ` 2,116.02
Lakhs)
1 month 4.6 4.3 4.0 2.9 3.4
3 months -8.6 -7.7 -5.6 -1.5 -3.4
6 months -3.5 -1.1 -0.5 1.9 0.8
1 year -3.8 1.5 0.5 1.6 1.5
2 years 10.8 12.6 9.8 5.8 7.9
3 years 9.6 10.5 9.4 8.1 8.8
4 years 7.8 8.2 8.0 5.4 7.8
5 years 15.0 14.6 13.2 8.7 12.2
6 years 12.7 13.0 11.8 7.0 10.9
7 years 14.0 14.0 12.8 7.9 11.8
10 years 16.4 16.0 13.2 8.6 12.3
Inception 16.4 15.6 14.1 9.0 12.8
Returns AsOn 30th November 2018
Peak Guarantee Fund I (AUM: ` 1,538.72
Lakhs)
Kotak Guaranteed Growth Fund (AUM:
` 61,299.88Lakhs)
Kotak Guaranteed Balanced Fund
(AUM: ` 8,123.39Lakhs)
Pension Classic Opportunities Fund (AUM: ` 10,382.83
Lakhs)
Kotak Pension Opportunities Fund (AUM: ` 2,272.41
Lakhs)
Pension Frontline Equity Fund (AUM:
` 2,309.38Lakhs)
Pension Guarantee Fund (AUM: ` 9,455.82
Lakhs)
1 month 1.2 3.3 3.1 4.6 4.5 4.2 2.4
3 months 0.2 -3.7 -2.2 -8.3 -8.4 -7.9 -2.0
6 months 3.2 0.6 1.5 -3.1 -3.5 -1.9 3.3
1 year 6.3 1.0 1.9 -3.0 -3.7 -0.1 4.9
2 years 8.7 7.6 6.9 11.7 10.8 12.2 8.5
3 years 8.5 8.7 8.6 10.4 9.6 10.5 8.5
4 years 5.7 7.8 7.9 8.5 7.8 8.5 5.7
5 years 8.9 11.4 11.0 15.8 14.8 14.9 9.1
6 years 7.4 9.9 9.6 13.5 12.5 13.3 7.5
7 years 8.3 10.7 10.3 14.8 13.9 14.3 8.5
10 years n.a 10.8 10.6 n.a n.a n.a n.a
Inception 7.2 12.8 11.7 12.1 11.0 11.5 7.0
FUND PERFORMANCE OF ULIP FUNDS
AS ON 30th NOVEMBER 2018

Market Outlook Fund Performance Contents Individual Funds Group Funds
MONTHLY UPDATE DECEMBER 2018 | (based on last business day) 08
FUND PERFORMANCE OF ULIP FUNDS
Funds available with insurance plans launched Prior to Sept. 1, 2010.Returns AsOn 30th November 2018
Kotak Pension Growth Fund
(AUM: ` 1,847.38
Lakhs)
Kotak Pension Floor Fund
(AUM: ` 3,791.54
Lakhs)
Pension Floor Fund II (AUM:
` 5,944.49Lakhs)
Kotak Pension Balanced Fund
(AUM: ` 10,234.13
Lakhs)
Pension Balanced Fund
II (AUM: ` 369.49
Lakhs)
Kotak Pension Bond Fund
(AUM: ` 5,144.31
Lakhs)
Kotak Pension Gilt Fund (AUM:
` 685.25Lakhs)
Kotak Pension Floating Rate Fund (AUM:
` 231.15Lakhs)
Pension Money Market Fund II
(AUM: ` 913.30Lakhs)
1 month 3.2 3.0 3.0 3.2 3.1 2.3 2.8 1.2 0.6
3 months -3.1 -1.5 -1.4 -2.5 -3.4 3.5 4.6 2.3 1.7
6 months 1.1 1.8 2.0 1.4 0.7 4.9 5.9 3.9 3.3
1 year 1.6 1.7 2.1 1.4 1.6 3.6 5.0 4.6 6.4
2 years 7.7 5.9 6.4 6.6 8.1 2.8 3.1 4.9 6.5
3 years 8.7 8.2 8.4 8.4 8.9 7.2 7.7 6.3 6.8
4 years 7.8 5.4 5.6 7.8 7.9 7.5 8.1 6.6 7.2
5 years 11.4 8.7 9.0 10.9 12.2 8.8 9.5 7.4 7.5
6 years 9.9 7.2 7.4 9.5 10.9 8.0 8.4 8.0 7.7
7 years 10.7 8.1 8.4 10.2 11.7 8.6 9.0 8.0 7.9
10 years n.a n.a n.a 10.4 n.a 9.2 8.1 7.5 n.a
Inception 10.7 6.5 6.9 11.8 9.5 8.3 7.5 7.4 7.5
AS ON 30th NOVEMBER 2018

Market Outlook Fund Performance Contents Individual Funds Group Funds
MONTHLY UPDATE DECEMBER 2018 | (based on last business day) 09
FUND PERFORMANCE OF ULIP FUNDS
KOTAK PRIVILEDEGE ASSURANCE PLANSReturns AsOn 30th November 2018
Kotak Advantage Multiplier Fund II (AUM: ` 0.41
Lakhs)
1 month 1.3
3 months 2.0
6 months 3.3
1 year 2.2
2 years 2.4
3 years 2.9
4 years 3.5
5 years 4.2
6 years 4.2
7 years 4.8
10 years 5.7
Inception 4.8
Returns less than or equal to a year are absolute. Returns greater than a year are compounded annualised.
Sr No. Fund Manager Equity Debt Balanced
1 Rohit Agarwal 7 NA 19
2 KunalShah NA 15 26
NO. OF FUNDS MANAGED BY FUND MANAGER
Mr. Rohit Agarwal has over 10 years of experience in capital markets, looks at the Unit Linked Equity funds at Kotak Life Insurance . Before joining Kotak in 2011, Mr. Agarwal was associated with JP Morgan for about 6 years. Rohit is a Bachelor of Commerce (2001) and has done PGDBM, Symbiosis Pune (2005).
Mr. Rohit Agarwal– Equity Fund Manager
Mr. Kunal Shah has overall experience of over a decade and has been associated with the Kotak Life Insurance since May 2008. His key responsibilities include management of fixed income portfolios in Unit Linked and managing alternative investments for the company. Kunal is a Bachelor of Commerce (2001) , MBA (Finance), Sinhgad Institute, Pune (2004) and CFA (CFA Institute, USA)
Mr. Kunal Shah CFA – Debt Fund Manager
Returns AsOn 30th November 2018
Kotak Group Dynamic Floor Fund (AUM:
` 369.40 Lakhs)
Kotak Group Balanced Fund
(AUM: ` 77,071.07Lakhs)
Kotak Group Bond Fund (AUM:
` 1,28,116.84Lakhs)
Kotak Group Gilt Fund (AUM:
` 5,073.43Lakhs)
Kotak Group Floating Rate Fund (AUM:
` 12,203.84 Lakhs)
Kotak Group Money Market Fund
(AUM: ` 450.19Lakhs)
Kotak Group Secure Capital
(AUM: ` 29,329.14 Lakhs)
Kotak Group Prudent Fund
(AUM: ` 430.39 Lakhs)
1 month 2.7 3.2 2.3 2.8 1.1 0.4 2.3 2.8
3 months -0.2 -3.1 3.6 4.6 2.3 1.2 3.6 2.1
6 months 2.7 1.3 5.1 5.9 4.1 2.5 5.0 4.9
1 year 2.8 2.3 4.2 5.1 5.1 4.9 4.2 n.a
2 years 5.7 8.7 3.4 3.2 5.3 4.8 3.4 n.a
3 years 8.1 9.4 7.7 7.9 6.7 4.7 7.5 n.a
4 years 5.5 8.4 8.0 8.3 7.1 5.6 7.8 n.a
5 years 8.9 12.7 9.4 9.7 7.9 6.2 9.2 n.a
6 years 7.4 11.4 8.5 8.6 8.4 n.a 8.3 n.a
7 years 8.3 12.2 9.2 9.2 8.5 n.a 9.0 n.a
10 years n.a 12.6 9.9 8.4 8.0 n.a n.a n.a
Inception 6.8 13.0 8.8 7.6 7.8 6.5 8.8 4.9
KOTAK FIXED MATURITY PLANSReturns AsOn 30th November 2018
Kotak Group Short Term Bond Fund (AUM: ` 9,200.66
Lakhs)
1 month 1.2
3 months 2.3
6 months 3.9
1 year 4.7
2 years 5.2
3 years 6.8
4 years n.a
5 years n.a
6 years n.a
7 years n.a
10 years n.a
Inception 6.7
KOTAK GROUP PLANS
AS ON 30th NOVEMBER 2018
Market Outlook Fund Performance Contents Individual Funds Group Funds
MONTHLY UPDATE DECEMBER 2018 | (based on last business day) 10
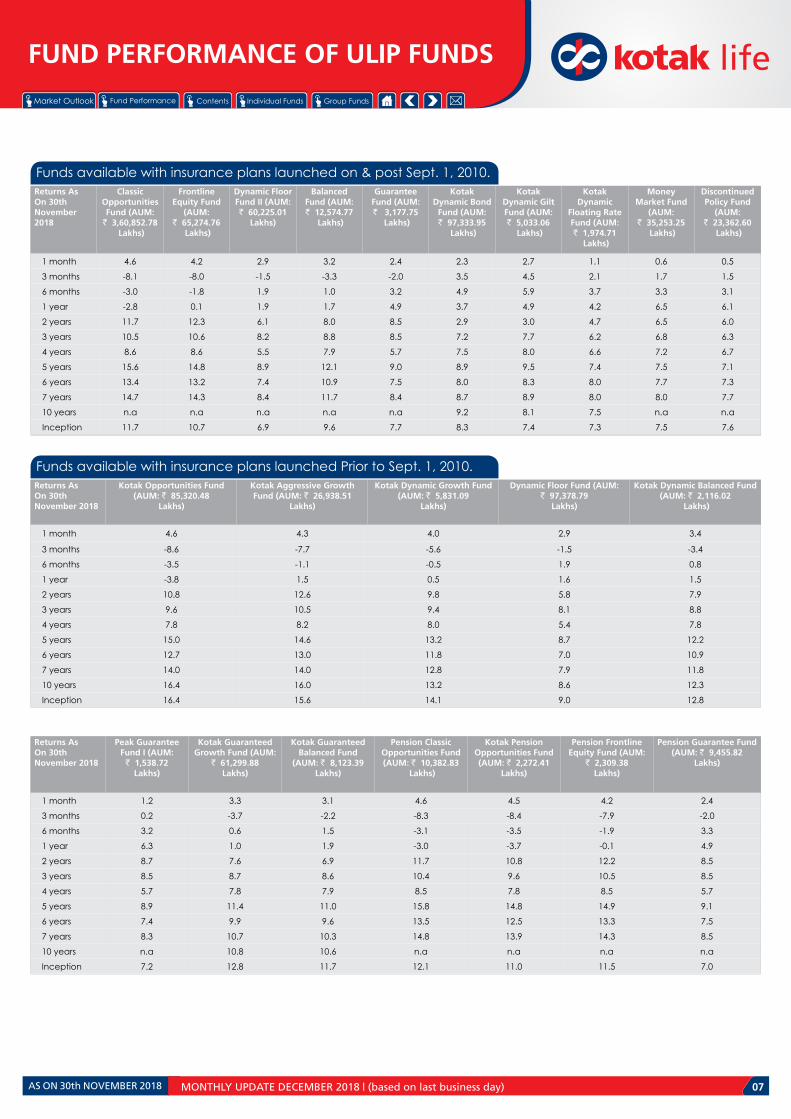
Kotak WealthInsurance
Kotak AceInvestment
Kotak SingleInvest
Advantage
Kotak HeadstartChild Assure
KotakPlatinum
Kotak InvestMaxima
Fund
s
Classic Opportunities Fund ü ü ü ü ü ü
Frontline Equity Fund ü ü ü ü ü ü
Balanced Fund ü ü r ü ü ü
Dynamic Bond Fund ü ü ü ü ü ü
Dynamic Floating Rate Fund ü ü r ü ü r
Money Market Fund ü ü ü ü ü ü
Dynamic Gilt Fund ü ü ü ü ü r
Discontinued Policy Fund ü ü ü ü ü ü
*currently active plans
PRODUCT - FUND MATRIX*
AS ON 30th NOVEMBER 2018

Market Outlook Fund Performance Contents Individual Funds Group Funds
MONTHLY UPDATE DECEMBER 2018 | (based on last business day) 11
INDIVIDUAL FUNDS
CLASSIC OPPORTUNITIESFUND
DYNAMIC FLOOR FUND II
BALANCED FUND
KOTAK OPPORTUNITIES FUND
KOTAK AGGRESSIVE GROWTH FUND
GUARANTEEFUND
MONEY MARKET FUND
DYNAMIC FLOOR FUND
KOTAK DYNAMIC BALANCED FUND
KOTAK DYNAMIC BOND FUND
KOTAK DYNAMIC FLOATING RATE FUND
PEAK GUARANTEEFUND I
KOTAK GAURANTEEDGROWTH FUND
KOTAK DYNAMICGROWTH FUND
KOTAK GAURANTEEDBALANCED FUND
PENSION CLASSICOPPORTUNITIES FUND
KOTAK PENSIONOPPORTUNITIES FUND
PENSION FRONTLINEEQUITY FUND
PENSION GUARANTEEFUND
KOTAK PENSIONGROWTH FUND
KOTAK PENSIONFLOOR FUND
PENSION FLOORFUND II
KOTAK PENSIONBALANCED FUND
KOTAK PENSION BOND FUND
KOTAK PENSIONGILT FUND
KOTAK PENSIONFLOATING RATE FUND
PENSION MONEYMARKET FUND II
KOTAK ADVANTAGEMULTIPLIER FUND II
DISCONTINUEDPOLICY FUND
FRONTLINE EQUITY FUND
KOTAK DYNAMIC GILT FUND
PENSION BALANCEDFUND II
AS ON 30th NOVEMBER 2018

Market Outlook Fund Performance Contents Individual Funds Group Funds
Holdings % to Fund
EQUITY 94.22
Reliance Industries Ltd 6.55
HDFC Bank Ltd 5.94
Infosys Ltd 5.35
SBI ETF Nifty Bank 4.64
Larsen And Toubro Ltd 4.42
KotakBankingETF-DividendPayoutOption 4.00
ICICI Bank Ltd 3.91
Tata Consultancy Services Ltd 3.80
Axis Bank Ltd 3.12
I T C Ltd 3.04
Mahindra & Mahindra Ltd 2.61
Britannia Industries Ltd 2.52
Aurobindo Pharma Ltd 2.34
Maruti Suzuki India Ltd 2.27
Hindustan Unilever Ltd 2.19
Housing Development Finance Corp. Ltd 2.10
IndusInd Bank Ltd 1.82
Bajaj Finance Ltd 1.75
Hindalco Industries Ltd 1.71
Tech Mahindra Ltd 1.70
Others 28.45
Corporate Debt 0.01
7.40% HDFC Bank FD NSE - 17.08.2019 0.004
7.40% HDFC Bank FD NSE - 01.08.2019 0.004
7.40% HDFC Bank FD BSE - 01.08.2019 0.002
MMI 5.62
NCA 0.15
Investment ObjectiveAims to maximize opportunity for you through long-term capital growth, by holding a significant portion in a diversified and flexible mix of large / medium sized company equities
Debt Ratings Profile (%)Portfolio
AUM (in Lakhs)
Sector Allocation as per NIC 2008 % to Fund**
**NIC 2008 - Industrial sector as defined under National Industrial Classification 2008.
MONTHLY UPDATE DECEMBER 2018 | (based on last business day) 12
Classic Opportunities
Fund (%)
Benchmark (%)
1 month 4.6 4.2
3 months -8.1 -8.2
6 months -3.0 -0.6
1 year -2.8 2.2
2 years 11.7 14.0
3 years 10.5 11.2
4 years 8.6 7.1
5 years 15.6 13.4
6 years 13.4 11.6
7 years 14.7 13.1
10 years n.a n.a
Inception 11.7 9.1
Past performance is not necessarily indicative of future performance
Approved (%) Actual (%)
Equity 75 - 100 94
Gsec / Debt
00 - 25 0
MMI /Others
00 - 25 6
Date of Inception
AUM (in Lakhs)
NAV
Fund Manager
Benchmark Details
Modified Duration
Asset Allocation
Performance Meter
16th December 2009
3,60,852.78
26.9391
Equity : Rohit AgarwalDebt : KunalShah
Equity - 100% (BSE 200)
Debt & MoneyMarket Instruments : 0.01
INDIVIDUAL FUNDCLASSIC OPPORTUNITIES FUND(ULIF-033-16/12/09-CLAOPPFND-107)
3,40,000
20,305 549
Equity Debt NCA
99.84
0.16
TREPS & MutualFund Investments
Fixed Deposit
13.55
2.61
2.65
3.04
3.73
4.41
4.57
7.26
7.71
10.84
39.61
Others
Warehousing andsupport activities for
transportation
Mfg of electricalequipment
Mfg of tobacco products
Mfg of chemicals andchemical products
Mfg of pharmaceuticals,medicinal chemical &
botanical products
Civil engineering
Mfg of coke and refinedpetroleum products
Mfg of motor vehicles,trailers and semi-trailers
Computer programming,consultancy and related
activities
Financial and insuranceactivities
AS ON 30th NOVEMBER 2018

Market Outlook Fund Performance Contents Individual Funds Group Funds
Holdings % to Fund
EQUITY 97.18
Reliance Industries Ltd 6.88
Infosys Ltd 6.41
ICICI Bank Ltd 5.58
HDFC Bank Ltd 5.09
I T C Ltd 4.65
KotakBankingETF-DividendPayoutOption 3.95
Larsen And Toubro Ltd 3.82
Mahindra & Mahindra Ltd 3.46
Reliance ETF Bank Bees 3.37
Axis Bank Ltd 3.02
IndusInd Bank Ltd 2.88
Hindustan Unilever Ltd 2.88
Tech Mahindra Ltd 2.50
Britannia Industries Ltd 2.17
HCL Technologies Ltd 1.91
Bata India Ltd 1.89
State Bank of India 1.88
Aurobindo Pharma Ltd 1.86
Maruti Suzuki India Ltd 1.83
Sun Pharmaceuticals Ltd 1.75
Others 29.39
Corporate Debt 0.01
7.40% HDFC Bank FD NSE - 01.08.2019 0.003
7.40% HDFC Bank FD NSE - 17.08.2019 0.003
7.40% HDFC Bank FD BSE - 01.08.2019 0.002
MMI 2.81
NCA 0.00
Investment ObjectiveAims for a high level of capital growth for you, by holding a significant portion in large sized company equities
Debt Ratings Profile (%)Portfolio
AUM (in Lakhs)
Sector Allocation as per NIC 2008 % to Fund**
**NIC 2008 - Industrial sector as defined under National Industrial Classification 2008.
MONTHLY UPDATE DECEMBER 2018 | (based on last business day) 13
FrontlineEquity Fund
(%)
Benchmark (%)
1 month 4.2 4.3
3 months -8.0 -7.5
6 months -1.8 0.7
1 year 0.1 3.9
2 years 12.3 14.5
3 years 10.6 11.2
4 years 8.6 6.5
5 years 14.8 12.5
6 years 13.2 11.1
7 years 14.3 12.6
10 years n.a n.a
Inception 10.7 8.8
Past performance is not necessarily indicative of future performance
Approved (%) Actual (%)
Equity 60 - 100 97
Gsec / Debt
00 - 40 0
MMI /Others
00 - 40 3
Date of Inception
AUM (in Lakhs)
NAV
Fund Manager
Benchmark Details
Modified Duration
Asset Allocation
Performance Meter
17th December 2009
65,274.76
24.8211
Equity : Rohit AgarwalDebt : KunalShah
Equity - 100% (BSE 100)
Debt & MoneyMarket Instruments : 0.01
INDIVIDUAL FUNDFRONTLINE EQUITY FUND(ULIF-034-17/12/09-FRLEQUFND-107)
63,433
1,840 2
Equity Debt NCA
99.70
0.30
TREPS & MutualFund Investments
Fixed Deposit
13.99
3.14
3.20
3.61
3.82
4.65
6.26
6.88
7.37
11.77
35.31
Others
Mfg of food products
Mfg of electricalequipment
Mfg of pharmaceuticals,medicinal chemical &
botanical products
Civil engineering
Mfg of tobacco products
Mfg of chemicals andchemical products
Mfg of coke and refinedpetroleum products
Mfg of motor vehicles,trailers and semi-trailers
Computer programming,consultancy and related
activities
Financial and insuranceactivities
AS ON 30th NOVEMBER 2018

Market Outlook Fund Performance Contents Individual Funds Group Funds
Holdings % to Fund
EQUITY 38.08
Reliance Industries Ltd 2.63
Infosys Ltd 2.62
ICICI Bank Ltd 2.21
HDFC Bank Ltd 2.10
KotakBankingETF-DividendPayoutOption 1.76
I T C Ltd 1.76
Reliance ETF Bank Bees 1.60
Larsen And Toubro Ltd 1.44
Mahindra & Mahindra Ltd 1.37
Hindustan Unilever Ltd 1.13
Axis Bank Ltd 1.13
IndusInd Bank Ltd 1.13
Tech Mahindra Ltd 1.00
Britannia Industries Ltd 0.89
Bata India Ltd 0.77
HCL Technologies Ltd 0.75
Aurobindo Pharma Ltd 0.73
Maruti Suzuki India Ltd 0.72
Sun Pharmaceuticals Ltd 0.69
SBI ETF Nifty Bank 0.68
Others 10.95
G-Sec 28.54
7.17% GOI - 08.01.2028 3.29
7.72% GOI - 26.10.2055 3.23
8.13% GOI - 22.06.2045 3.22
8.70% REC - 28.09.2028 2.41
7.06% GOI - 10.10.2046 2.36
8.58% GJ SDL - 31.10.2028 1.87
8.15% TN SDL -09.05.2028 1.70
8.47% NABARD - 31.08.2033 1.60
1.44% INFLATION INDEX GS 2023 1.26
8.62% HR SDL 03.09.2028 0.83
Others 6.78
Corporate Debt 28.62
7.4805%KotakMahindraPrimeLtd-11.06.2020 3.45
9.05% HDFC - 20.11.2023 1.67
8.56% REC - 29.11.2028 1.60
9.05% HDFC - 16.10.2028 1.35
8.3750% EXIM- 24.07.2025 1.21
7.62% EXIM- 01.09.2026 1.18
7.85% PFC - 03.04.2028 0.87
8.65% PFC - 28.12.2024 0.75
8.18% EXIM- 07.12.2025 0.70
11.08% HDFC - 13.04.2027 Set Down 13.04.20 - 7.78%
0.68
Others 15.16
MMI 3.73
NCA 1.02
Investment ObjectiveAims to provide you with stable long-term inflation beating growth over medium to long-term and defend your capital against short-term capital shocks.
Debt Ratings Profile (%)Portfolio
AUM (in Lakhs)
Sector Allocation as per NIC 2008 % to Fund**
**NIC 2008 - Industrial sector as defined under National Industrial Classification 2008.
MONTHLY UPDATE DECEMBER 2018 | (based on last business day) 14
Dynamic Floor Fund II
(%)
Benchmark (%)
1 month 2.9 2.9
3 months -1.5 -0.9
6 months 1.9 3.3
1 year 1.9 4.9
2 years 6.1 8.0
3 years 8.2 9.0
4 years 5.5 7.4
5 years 8.9 10.3
6 years 7.4 9.4
7 years 8.4 10.1
10 years n.a n.a
Inception 6.9 8.5
Past performance is not necessarily indicative of future performance
Approved (%) Actual (%)
Equity 00 - 75 38
Gsec / Debt
00 - 100 57
MMI /Others
00 - 40 5
Date of Inception
AUM (in Lakhs)
NAV
Fund Manager
Benchmark Details
Modified Duration
Asset Allocation
Performance Meter
17th December 2009
60,225.01
18.1899
Equity : Rohit AgarwalDebt : KunalShah
Equity - 37.5% (Nifty);Debt - 62.5% (CRISIL Bond)
Debt & MoneyMarket Instruments : 5.54
INDIVIDUAL FUNDDYNAMIC FLOOR FUND II(ULIF-035-17/12/09-DYFLRFND2-107)
22,936
36,674
615 -
10,000
20,000
30,000
40,000
Equity Debt NCA
46.86
45.46
6.13
1.420.07
0.05 Govt & GovtGuaranteed BondsAAA
TREPS & MutualFund InvestmentsAA+
Fixed Deposit
AA-
10.34
1.44
1.76
2.02
2.63
2.71
3.85
4.75
7.63
14.36
48.50
Others
Civil engineering
Mfg of tobacco products
Mfg of chemicals andchemical products
Mfg of coke and refinedpetroleum products
Mfg of motor vehicles,trailers and semi-trailers
Electricity, gas, steamand air conditioning
supply
Computer programming,consultancy and related
activities
State Development Loan
Govt. of India
Financial and insuranceactivities
AS ON 30th NOVEMBER 2018
Market Outlook Fund Performance Contents Individual Funds Group Funds
Holdings % to Fund
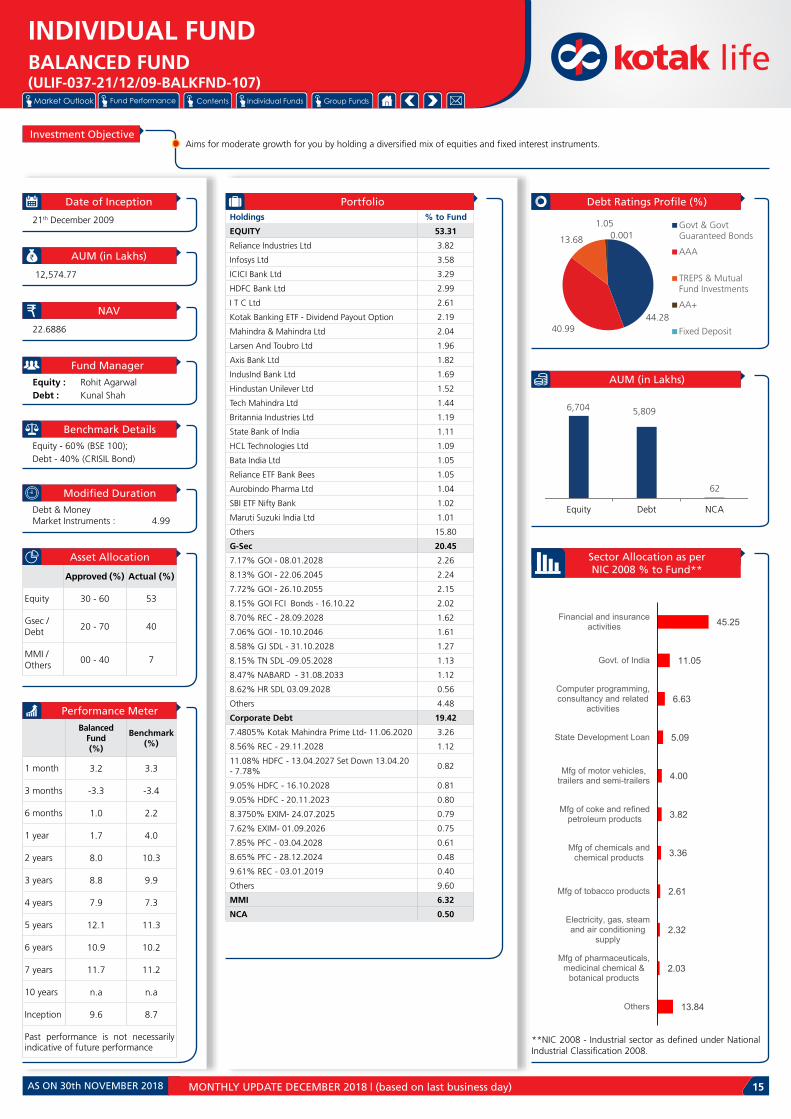
EQUITY 53.31
Reliance Industries Ltd 3.82
Infosys Ltd 3.58
ICICI Bank Ltd 3.29
HDFC Bank Ltd 2.99
I T C Ltd 2.61
KotakBankingETF-DividendPayoutOption 2.19
Mahindra & Mahindra Ltd 2.04
Larsen And Toubro Ltd 1.96
Axis Bank Ltd 1.82
IndusInd Bank Ltd 1.69
Hindustan Unilever Ltd 1.52
Tech Mahindra Ltd 1.44
Britannia Industries Ltd 1.19
State Bank of India 1.11
HCL Technologies Ltd 1.09
Bata India Ltd 1.05
Reliance ETF Bank Bees 1.05
Aurobindo Pharma Ltd 1.04
SBI ETF Nifty Bank 1.02
Maruti Suzuki India Ltd 1.01
Others 15.80
G-Sec 20.45
7.17% GOI - 08.01.2028 2.26
8.13% GOI - 22.06.2045 2.24
7.72% GOI - 26.10.2055 2.15
8.15% GOI FCI Bonds - 16.10.22 2.02
8.70% REC - 28.09.2028 1.62
7.06% GOI - 10.10.2046 1.61
8.58% GJ SDL - 31.10.2028 1.27
8.15% TN SDL -09.05.2028 1.13
8.47% NABARD - 31.08.2033 1.12
8.62% HR SDL 03.09.2028 0.56
Others 4.48
Corporate Debt 19.42
7.4805%KotakMahindraPrimeLtd-11.06.2020 3.26
8.56% REC - 29.11.2028 1.12
11.08% HDFC - 13.04.2027 Set Down 13.04.20 - 7.78%
0.82
9.05% HDFC - 16.10.2028 0.81
9.05% HDFC - 20.11.2023 0.80
8.3750% EXIM- 24.07.2025 0.79
7.62% EXIM- 01.09.2026 0.75
7.85% PFC - 03.04.2028 0.61
8.65% PFC - 28.12.2024 0.48
9.61% REC - 03.01.2019 0.40
Others 9.60
MMI 6.32
NCA 0.50
Investment ObjectiveAims for moderate growth for you by holding a diversified mix of equities and fixed interest instruments.
Debt Ratings Profile (%)Portfolio
AUM (in Lakhs)
Sector Allocation as per NIC 2008 % to Fund**
**NIC 2008 - Industrial sector as defined under National Industrial Classification 2008.
MONTHLY UPDATE DECEMBER 2018 | (based on last business day) 15
BalancedFund(%)
Benchmark (%)
1 month 3.2 3.3
3 months -3.3 -3.4
6 months 1.0 2.2
1 year 1.7 4.0
2 years 8.0 10.3
3 years 8.8 9.9
4 years 7.9 7.3
5 years 12.1 11.3
6 years 10.9 10.2
7 years 11.7 11.2
10 years n.a n.a
Inception 9.6 8.7
Past performance is not necessarily indicative of future performance
Approved (%) Actual (%)
Equity 30 - 60 53
Gsec / Debt
20 - 70 40
MMI /Others
00 - 40 7
Date of Inception
AUM (in Lakhs)
NAV
Fund Manager
Benchmark Details
Modified Duration
Asset Allocation
Performance Meter
21th December 2009
12,574.77
22.6886
Equity : Rohit AgarwalDebt : KunalShah
Equity - 60% (BSE 100);Debt - 40% (CRISIL Bond)
Debt & MoneyMarket Instruments : 4.99
INDIVIDUAL FUNDBALANCED FUND(ULIF-037-21/12/09-BALKFND-107)
6,704 5,809
62
Equity Debt NCA
44.2840.99
13.68
1.050.001
Govt & GovtGuaranteed Bonds
AAA
TREPS & MutualFund Investments
AA+
Fixed Deposit
13.84
2.03
2.32
2.61
3.36
3.82
4.00
5.09
6.63
11.05
45.25
Others
Mfg of pharmaceuticals,medicinal chemical &
botanical products
Electricity, gas, steamand air conditioning
supply
Mfg of tobacco products
Mfg of chemicals andchemical products
Mfg of coke and refinedpetroleum products
Mfg of motor vehicles,trailers and semi-trailers
State Development Loan
Computer programming,consultancy and related
activities
Govt. of India
Financial and insuranceactivities
AS ON 30th NOVEMBER 2018

Market Outlook Fund Performance Contents Individual Funds Group Funds
Holdings % to Fund
EQUITY 96.41
Reliance Industries Ltd 6.71
HDFC Bank Ltd 5.92
Infosys Ltd 5.47
SBI ETF Nifty Bank 4.89
Larsen And Toubro Ltd 4.57
KotakBankingETF-DividendPayoutOption 4.13
Tata Consultancy Services Ltd 3.87
ICICI Bank Ltd 3.80
I T C Ltd 3.11
Axis Bank Ltd 3.05
Mahindra & Mahindra Ltd 2.66
Britannia Industries Ltd 2.57
Aurobindo Pharma Ltd 2.45
Maruti Suzuki India Ltd 2.38
Hindustan Unilever Ltd 2.23
Housing Development Finance Corp. Ltd 2.10
IndusInd Bank Ltd 1.82
Tech Mahindra Ltd 1.77
Bajaj Finance Ltd 1.77
Hindalco Industries Ltd 1.76
Others 29.38
Corporate Debt 0.14
7.40% HDFC Bank FD NSE - 17.08.2019 0.06
7.40% HDFC Bank FD NSE - 01.08.2019 0.06
7.40% HDFC Bank FD BSE - 01.08.2019 0.03
MMI 3.18
NCA 0.26
Investment ObjectiveAims to maximize opportunity for long term capital growth, by holding a significant portion in a diversified and flexible mix of large/medium sized company equities.
Debt Ratings Profile (%)Portfolio
AUM (in Lakhs)
Sector Allocation as per NIC 2008 % to Fund**
**NIC 2008 - Industrial sector as defined under National Industrial Classification 2008.
MONTHLY UPDATE DECEMBER 2018 | (based on last business day) 16
OpportunitiesFund (%)
Benchmark (%)
1 month 4.6 4.2
3 months -8.6 -8.2
6 months -3.5 -0.6
1 year -3.8 2.2
2 years 10.8 14.0
3 years 9.6 11.2
4 years 7.8 7.1
5 years 15.0 13.4
6 years 12.7 11.6
7 years 14.0 13.1
10 years 16.4 15.0
Inception 16.4 11.0
Past performance is not necessarily indicative of future performance
Approved (%) Actual (%)
Equity 75 - 100 96
Gsec / Debt
00 - 25 0
MMI /Others
00 - 25 3
Date of Inception
AUM (in Lakhs)
NAV
Fund Manager
Benchmark Details
Modified Duration
Asset Allocation
Performance Meter
02nd October 2008
85,320.48
47.0020
Equity : Rohit AgarwalDebt : KunalShah
Equity - 100% (BSE 200)
Debt & MoneyMarket Instruments : 0.03
INDIVIDUAL FUNDKOTAK OPPORTUNITIES FUND(ULIF-029-02/10/08-OPPFND-107)
82,258
2,837 226
Equity Debt NCA
95.68
4.32
TREPS & MutualFund Investments
Fixed Deposit
14.10
2.74
2.77
3.11
3.87
4.61
4.73
7.42
7.99
11.11
37.55
Others
Warehousing andsupport activities for
transportation
Mfg of electricalequipment
Mfg of tobacco products
Mfg of chemicals andchemical products
Mfg of pharmaceuticals,medicinal chemical &
botanical products
Civil engineering
Mfg of coke and refinedpetroleum products
Mfg of motor vehicles,trailers and semi-trailers
Computer programming,consultancy and related
activities
Financial and insuranceactivities
AS ON 30th NOVEMBER 2018

Market Outlook Fund Performance Contents Individual Funds Group Funds
Holdings % to Fund
EQUITY 96.75
Infosys Ltd 7.00
Reliance Industries Ltd 6.55
HDFC Bank Ltd 5.76
ICICI Bank Ltd 4.72
I T C Ltd 4.56
KotakBankingETF-DividendPayoutOption 4.48
Larsen And Toubro Ltd 4.18
Reliance ETF Bank Bees 3.95
Mahindra & Mahindra Ltd 3.49
Hindustan Unilever Ltd 3.17
IndusInd Bank Ltd 2.96
Axis Bank Ltd 2.88
Britannia Industries Ltd 2.72
Tech Mahindra Ltd 2.35
Maruti Suzuki India Ltd 2.09
Asian Paints Ltd 2.07
Aurobindo Pharma Ltd 2.03
HCL Technologies Ltd 1.92
State Bank of India 1.84
Sun Pharmaceuticals Ltd 1.76
Others 26.27
Corporate Debt 0.38
7.40% HDFC Bank FD NSE - 01.08.2019 0.15
7.40% HDFC Bank FD NSE - 17.08.2019 0.15
7.40% HDFC Bank FD BSE - 01.08.2019 0.07
MMI 2.86
NCA 0.01
Investment ObjectiveAims for a high level of capital growth by holding a significant portion in large sized company equities.
Debt Ratings Profile (%)Portfolio
AUM (in Lakhs)
Sector Allocation as per NIC 2008 % to Fund**
**NIC 2008 - Industrial sector as defined under National Industrial Classification 2008.
MONTHLY UPDATE DECEMBER 2018 | (based on last business day) 17
AggressiveGrowth Fund
(%)
Benchmark (%)
1 month 4.3 4.3
3 months -7.7 -7.5
6 months -1.1 0.7
1 year 1.5 3.9
2 years 12.6 14.5
3 years 10.5 11.2
4 years 8.2 6.5
5 years 14.6 12.5
6 years 13.0 11.1
7 years 14.0 12.6
10 years 16.0 14.0
Inception 15.6 13.1
Past performance is not necessarily indicative of future performance
Approved (%) Actual (%)
Equity 60 - 100 97
Gsec / Debt
00 - 40 0
MMI /Others
00 - 40 3
Date of Inception
AUM (in Lakhs)
NAV
Fund Manager
Benchmark Details
Modified Duration
Asset Allocation
Performance Meter
13th September 2004
26,938.51
78.5154
Equity : Rohit AgarwalDebt : KunalShah
Equity - 100% (BSE 100)
Debt & MoneyMarket Instruments : 0.08
INDIVIDUAL FUNDKOTAK AGGRESSIVE GROWTH FUND(ULIF-018-13/09/04-AGRGWTFND-107)
26,064
871 3
Equity Debt NCA
88.34
11.66
TREPS & MutualFund Investments
Fixed Deposit
10.94
3.47
3.79
3.97
4.18
4.56
6.54
6.55
8.29
12.07
35.64
Others
Mfg of basic metals
Mfg of pharmaceuticals,medicinal chemical &
botanical products
Mfg of food products
Civil engineering
Mfg of tobacco products
Mfg of chemicals andchemical products
Mfg of coke and refinedpetroleum products
Mfg of motor vehicles,trailers and semi-trailers
Computer programming,consultancy and related
activities
Financial and insuranceactivities
AS ON 30th NOVEMBER 2018

Market Outlook Fund Performance Contents Individual Funds Group Funds
Holdings % to Fund
EQUITY 39.46
Reliance Industries Ltd 3.51
HDFC Bank Ltd 2.93
I T C Ltd 2.37
Infosys Ltd 2.34
Housing Development Finance Corp. Ltd 2.07
Tata Consultancy Services Ltd 1.95
Larsen And Toubro Ltd 1.86
ICICI Bank Ltd 1.47
Hindustan Unilever Ltd 1.46
Maruti Suzuki India Ltd 1.28
Mahindra & Mahindra Ltd 0.92
Sun Pharmaceuticals Ltd 0.91
Axis Bank Ltd 0.71
Asian Paints Ltd 0.71
State Bank of India 0.68
UltraTech Cement Ltd 0.67
Hero Honda Motors Ltd 0.66
Oil & Natural Gas Corporation Ltd 0.65
Bajaj Auto Ltd 0.57
Dr Reddys Laboratories Ltd 0.55
Others 11.18
G-Sec 22.60
7.72% GOI - 26.10.2055 2.36
7.17% GOI - 08.01.2028 2.35
8.13% GOI - 22.06.2045 2.32
8.70% REC - 28.09.2028 1.92
7.06% GOI - 10.10.2046 1.66
8.58% GJ SDL - 31.10.2028 1.34
8.47% NABARD - 31.08.2033 1.26
8.15% TN SDL -09.05.2028 1.22
1.44% INFLATION INDEX GS 2023 1.09
8.15% GOI FCI Bonds - 16.10.22 0.80
Others 6.26
Corporate Debt 24.04
7.4805%KotakMahindraPrimeLtd-11.06.2020 3.68
9.05% HDFC - 16.10.2028 3.19
9.05% HDFC - 20.11.2023 3.17
8.13% PGC - 25.04.2020 1.57
8.56% REC - 29.11.2028 1.27
7.85% PFC - 03.04.2028 0.90
7.62% EXIM- 01.09.2026 0.89
9.85% HDFC Bank 2019 - 17.03.2024 CALL 17.03.2019
0.63
8.65% PFC - 28.12.2024 0.63
8.18% EXIM- 07.12.2025 0.61
Others 7.50
MMI 13.63
NCA 0.27
Investment ObjectiveAims to provide stable, long-term inflation beating growth over medium to long-term and defend capital against short-term capital shocks
Debt Ratings Profile (%)Portfolio
AUM (in Lakhs)
Sector Allocation as per NIC 2008 % to Fund**
**NIC 2008 - Industrial sector as defined under National Industrial Classification 2008.
MONTHLY UPDATE DECEMBER 2018 | (based on last business day) 18
GuaranteeFund (%)
Benchmark (%)
1 month 2.4 2.95
3 months -2.0 -0.8
6 months 3.2 3.3
1 year 4.9 4.9
2 years 8.5 8.0
3 years 8.5 9.0
4 years 5.7 7.4
5 years 9.0 10.3
6 years 7.5 9.4
7 years 8.4 10.1
10 years n.a n.a
Inception 7.7 8.9
Past performance is not necessarily indicative of future performance
Approved (%) Actual (%)
Equity 00 - 75 39
Gsec / Debt
00 - 100 47
MMI /Others
00 - 100 14
Date of Inception
AUM (in Lakhs)
NAV
Fund Manager
Benchmark Details
Modified Duration
Asset Allocation
Performance Meter
05th February 2010
3,177.75
19.1956
Equity : Rohit AgarwalDebt : KunalShah
Equity - 37.5% (Nifty);Debt - 62.5% (CRISIL Bond)
Debt & MoneyMarket Instruments : 4.38
INDIVIDUAL FUNDGUARANTEE FUND(ULIF-048-05/02/10-GRTFND-107)
1,254
1,915
8
Equity Debt NCA
39.76
38.50
20.35
1.24 0.15Govt & GovtGuaranteed Bonds
AAA
TREPS & MutualFund Investments
AA+
Fixed Deposit
9.58
1.95
2.37
2.54
2.89
4.02
4.20
5.56
6.41
12.83
47.66
Others
Mfg of basic metals
Mfg of tobacco products
Mfg of motor vehicles,trailers and semi-trailers
Mfg of chemicals andchemical products
Electricity, gas, steamand air conditioning
supply
Mfg of coke and refinedpetroleum products
Computer programming,consultancy and related
activities
State Development Loan
Govt. of India
Financial and insuranceactivities
AS ON 30th NOVEMBER 2018

Market Outlook Fund Performance Contents Individual Funds Group Funds
Holdings % to Fund
MMI 99.99
NCA 0.01
Investment ObjectiveAims to protect your capital and not have downside risks
Debt Ratings Profile (%)Portfolio
AUM (in Lakhs)
Sector Allocation as per NIC 2008 % to Fund**
**NIC 2008 - Industrial sector as defined under National Industrial Classification 2008.
MONTHLY UPDATE DECEMBER 2018 | (based on last business day) 19
Money Market Fund
(%)
Benchmark (%)
1 month 0.6 0.6
3 months 1.7 1.9
6 months 3.3 3.8
1 year 6.5 7.4
2 years 6.5 7.0
3 years 6.8 7.2
4 years 7.2 7.5
5 years 7.5 7.9
6 years 7.7 8.0
7 years 8.0 8.1
10 years n.a n.a
Inception 7.5 7.8
Past performance is not necessarily indicative of future performance
Approved (%) Actual (%)
MMI /Others
100 100
Date of Inception
AUM (in Lakhs)
NAV
Fund Manager
Benchmark Details
Modified Duration
Asset Allocation
Performance Meter
05th January 2010
35,253.25
19.0471
Debt : KunalShah
Equity - 0% (NA);Debt - 100% (CRISIL Liquid)
Debt & MoneyMarket Instruments : 0.51
INDIVIDUAL FUNDMONEY MARKET FUND(ULIF-041-05/01/10-MNMKKFND-107)
35,249
4.36
Debt NCA
60.77
36.07
3.16A1+
Govt & GovtGuaranteed Bonds
TREPS & MutualFund Investments
0.01
7.94
36.07
55.98
NCA
Mfg of coke and refinedpetroleum products
Govt. of India
Financial and insuranceactivities
AS ON 30th NOVEMBER 2018

Market Outlook Fund Performance Contents Individual Funds Group Funds
Investment ObjectiveAims for a high level of capital growth by holding a significant portion in large sized company equities.
Debt Ratings Profile (%)
AUM (in Lakhs)
Sector Allocation as per NIC 2008 % to Fund**
**NIC 2008 - Industrial sector as defined under National Industrial Classification 2008.
MONTHLY UPDATE DECEMBER 2018 | (based on last business day) 20
KotakDynamic Growth
Fund (%)
Benchmark (%)
1 month 4.0 3.8
3 months -5.6 -5.4
6 months -0.5 1.5
1 year 0.5 4.0
2 years 9.8 12.4
3 years 9.4 10.6
4 years 8.0 6.9
5 years 13.2 11.9
6 years 11.8 10.7
7 years 12.8 12.0
10 years 13.2 12.7
Inception 14.1 13.1
Past performance is not necessarily indicative of future performance
Approved (%) Actual (%)
Equity 40 - 80 78
Gsec / Debt
20 - 60 21
MMI /Others
00 - 40 1
Date of Inception
AUM (in Lakhs)
NAV
Fund Manager
Benchmark Details
Modified Duration
Asset Allocation
Performance Meter
27th June 2003
5,831.09
76.1432
Equity : Rohit AgarwalDebt : KunalShah
Equity - 80% (BSE 100);Debt - 20% (CRISIL Bond)
Debt & MoneyMarket Instruments : 7.31
Holdings % to Fund
EQUITY 78.09
Reliance Industries Ltd 5.44
Infosys Ltd 5.20
ICICI Bank Ltd 4.39
HDFC Bank Ltd 4.28
I T C Ltd 3.56
KotakBankingETF-DividendPayoutOption 3.37
Larsen And Toubro Ltd 2.99
Reliance ETF Bank Bees 2.89
Mahindra & Mahindra Ltd 2.76
Hindustan Unilever Ltd 2.34
Axis Bank Ltd 2.31
IndusInd Bank Ltd 2.28
Tech Mahindra Ltd 2.03
Bata India Ltd 1.84
Britannia Industries Ltd 1.84
HCL Technologies Ltd 1.56
Maruti Suzuki India Ltd 1.48
Asian Paints Ltd 1.40
Sun Pharmaceuticals Ltd 1.39
Aurobindo Pharma Ltd 1.36
Others 23.37
G-Sec 18.14
8.30% GOI - 31.12.2042 3.24
8.13% GOI - 22.06.2045 3.19
8.17% GOI - 01.12.2044 3.02
8.97% GOI - 05.12.2030 1.69
7.72% GOI - 26.10.2055 0.84
6.65% Fertilizer Co GOI - 29.01.23 0.82
8.30% GOI - 02.07.2040 0.72
8.70% REC - 28.09.2028 0.70
8.42% TN SDL - 25.08.2020 0.69
8.15% GOI FCI Bonds - 16.10.22 0.68
Others 2.54
Corporate Debt 2.73
9.36% IDFC Bank - 21.08.24 0.85
9.85% HDFC Bank 2019 - 17.03.2024 CALL 17.03.2019
0.52
9.70% PFC - 15.12.2018 0.51
9.02% REC - 19.11.2022 0.35
9.75% REC - 11.11.2021. 0.18
7.40% HDFC Bank FD NSE - 01.08.2019 0.13
7.40% HDFC Bank FD NSE - 17.08.2019 0.13
7.40% HDFC Bank FD BSE - 01.08.2019 0.06
NCA 1.04
Portfolio
INDIVIDUAL FUNDKOTAK DYNAMIC GROWTH FUND(ULIF-012-27/06/03-DYGWTFND-107)
4,554
1,217
60
Equity Debt NCA
86.91
7.464.10
1.54 Govt & GovtGuaranteed Bonds
AAA
AA+
Fixed Deposit
17.45
2.57
2.75
2.99
3.56
5.07
5.44
5.52
9.57
15.49
29.59
Others
Mfg of food products
Mfg of pharmaceuticals,medicinal chemical &
botanical products
Civil engineering
Mfg of tobacco products
Mfg of chemicals andchemical products
Mfg of coke and refinedpetroleum products
Mfg of motor vehicles,trailers and semi-trailers
Computer programming,consultancy and related
activities
Govt. of India
Financial and insuranceactivities
AS ON 30th NOVEMBER 2018

Market Outlook Fund Performance Contents Individual Funds Group Funds
Investment ObjectiveAims to provide you with stable long-term inflation beating growth over medium to long-term and defend your capital against short-term capital shocks.
Debt Ratings Profile (%)
AUM (in Lakhs)
Sector Allocation as per NIC 2008 % to Fund**
**NIC 2008 - Industrial sector as defined under National Industrial Classification 2008.
MONTHLY UPDATE DECEMBER 2018 | (based on last business day) 21
DynamicFloor
Fund (%)
Benchmark (%)
1 month 2.9 2.9
3 months -1.5 -0.9
6 months 1.9 3.3
1 year 1.6 4.9
2 years 5.8 8.0
3 years 8.1 9.0
4 years 5.4 7.4
5 years 8.7 10.3
6 years 7.0 9.4
7 years 7.9 10.1
10 years 8.6 10.8
Inception 9.0 8.6
Past performance is not necessarily indicative of future performance
Approved (%) Actual (%)
Equity 00 - 75 39
Gsec / Debt
00 - 100 58
MMI /Others
00 - 40 3
Date of Inception
AUM (in Lakhs)
NAV
Fund Manager
Benchmark Details
Modified Duration
Asset Allocation
Performance Meter
14th November 2006
97,378.79
28.0998
Equity : Rohit AgarwalDebt : KunalShah
Equity - 37.5% (Nifty);Debt - 62.5% (CRISIL Bond)
Debt & MoneyMarket Instruments : 5.66
Holdings % to Fund
EQUITY 38.81
Reliance Industries Ltd 2.67
Infosys Ltd 2.62
ICICI Bank Ltd 2.22
HDFC Bank Ltd 2.14
I T C Ltd 1.76
KotakBankingETF-DividendPayoutOption 1.72
Reliance ETF Bank Bees 1.63
Larsen And Toubro Ltd 1.47
Mahindra & Mahindra Ltd 1.37
Axis Bank Ltd 1.14
IndusInd Bank Ltd 1.13
Hindustan Unilever Ltd 1.10
Tech Mahindra Ltd 1.01
Britannia Industries Ltd 0.91
Bata India Ltd 0.87
HCL Technologies Ltd 0.76
Aurobindo Pharma Ltd 0.74
Maruti Suzuki India Ltd 0.73
Sun Pharmaceuticals Ltd 0.69
SBI ETF Nifty Bank 0.69
Others 11.43
G-Sec 28.98
7.17% GOI - 08.01.2028 3.29
7.72% GOI - 26.10.2055 3.27
8.13% GOI - 22.06.2045 3.22
8.70% REC - 28.09.2028 2.43
7.06% GOI - 10.10.2046 2.37
8.58% GJ SDL - 31.10.2028 1.88
8.15% TN SDL -09.05.2028 1.72
8.47% NABARD - 31.08.2033 1.60
1.44% INFLATION INDEX GS 2023 1.19
8.62% HR SDL 03.09.2028 0.83
Others 7.18
Corporate Debt 29.27
7.4805%KotakMahindraPrimeLtd-11.06.2020 3.51
8.56% REC - 29.11.2028 1.59
9.05% HDFC - 16.10.2028 1.35
9.05% HDFC - 20.11.2023 1.24
8.3750% EXIM- 24.07.2025 1.24
7.62% EXIM- 01.09.2026 1.21
7.85% PFC - 03.04.2028 0.89
8.65% PFC - 28.12.2024 0.75
11.08% HDFC - 13.04.2027 Set Down 13.04.20 - 7.78%
0.74
8.18% EXIM- 07.12.2025 0.72
Others 16.04
MMI 1.80
NCA 1.14
Portfolio
INDIVIDUAL FUNDDYNAMIC FLOOR FUND(ULIF-028-14/11/06-DYFLRFND-107)
37,789
58,480
1,110
Equity Debt NCA
48.26
46.82
3.00
1.690.12
0.12 Govt & GovtGuaranteed BondsAAA
TREPS & MutualFund InvestmentsAA+
AA-
Fixed Deposit
10.82
1.47
1.76
2.43
2.67
2.73
4.11
4.78
7.97
14.44
46.83
Others
Civil engineering
Mfg of tobacco products
Mfg of chemicals andchemical products
Mfg of coke and refinedpetroleum products
Mfg of motor vehicles,trailers and semi-trailers
Electricity, gas, steamand air conditioning
supply
Computer programming,consultancy and related
activities
State Development Loan
Govt. of India
Financial and insuranceactivities
AS ON 30th NOVEMBER 2018

Market Outlook Fund Performance Contents Individual Funds Group Funds
Investment ObjectiveAims for moderate growth by holding a diversified mix of equities and fixed interest instruments.
Debt Ratings Profile (%)
AUM (in Lakhs)
Sector Allocation as per NIC 2008 % to Fund**
**NIC 2008 - Industrial sector as defined under National Industrial Classification 2008.
MONTHLY UPDATE DECEMBER 2018 | (based on last business day) 22
DynamicBalancedFund (%)
Benchmark (%)
1 month 3.4 3.3
3 months -3.4 -3.4
6 months 0.8 2.2
1 year 1.5 4.0
2 years 7.9 10.3
3 years 8.8 9.9
4 years 7.8 7.3
5 years 12.2 11.3
6 years 10.9 10.2
7 years 11.8 11.2
10 years 12.3 11.7
Inception 12.8 11.6
Past performance is not necessarily indicative of future performance
Approved (%) Actual (%)
Equity 30 - 60 58
Gsec / Debt
20 - 70 37
MMI /Others
00 - 40 6
Date of Inception
AUM (in Lakhs)
NAV
Fund Manager
Benchmark Details
Modified Duration
Asset Allocation
Performance Meter
27th June 2003
2,116.02
64.3302
Equity : Rohit AgarwalDebt : KunalShah
Equity - 60% (BSE 100);Debt - 40% (CRISIL Bond)
Debt & MoneyMarket Instruments : 5.21
Holdings % to Fund
EQUITY 57.55
Reliance Industries Ltd 4.07
Infosys Ltd 3.88
ICICI Bank Ltd 3.41
HDFC Bank Ltd 3.29
I T C Ltd 2.65
KotakBankingETF-DividendPayoutOption 2.36
Reliance ETF Bank Bees 2.26
Larsen And Toubro Ltd 2.20
Mahindra & Mahindra Ltd 1.95
Axis Bank Ltd 1.74
IndusInd Bank Ltd 1.68
Hindustan Unilever Ltd 1.62
Tech Mahindra Ltd 1.55
Britannia Industries Ltd 1.38
HCL Technologies Ltd 1.17
Bata India Ltd 1.10
State Bank of India 1.09
Sun Pharmaceuticals Ltd 1.07
SBI ETF Nifty Bank 1.06
Asian Paints Ltd 1.03
Others 16.96
G-Sec 21.89
7.17% GOI - 08.01.2028 2.34
7.72% GOI - 26.10.2055 2.31
8.13% GOI - 22.06.2045 2.25
8.70% REC - 28.09.2028 1.92
7.06% GOI - 10.10.2046 1.67
8.58% GJ SDL - 31.10.2028 1.32
8.15% TN SDL -09.05.2028 1.24
8.15% GOI FCI Bonds - 16.10.22 1.20
7.40% GOI 2035 - 09.09.35 0.96
8.47% NABARD - 31.08.2033 0.95
Others 5.74
Corporate Debt 14.75
7.4805%KotakMahindraPrimeLtd-11.06.2020 3.23
8.56% REC - 29.11.2028 0.95
9.61% REC - 03.01.2019 0.95
7.85% PFC - 03.04.2028 0.90
7.62% EXIM- 01.09.2026 0.89
8.85% PGC - 19.10.2026 0.60
8.85% PGC - 19.10.2025 0.60
9.75% REC - 11.11.2021. 0.49
9.39% LIC Housing Finance - 23.08.2024 - P - 26.08.15
0.48
9.85% HDFC Bank 2019 - 17.03.2024 CALL 17.03.2019
0.47
Others 5.19
MMI 3.31
NCA 2.50
Portfolio
INDIVIDUAL FUNDKOTAK DYNAMIC BALANCED FUND(ULIF-009-27/06/03-DYBALFND-107)
1,218
845
53
Equity Debt NCA
54.80
34.12
8.28
2.340.47
Govt & GovtGuaranteed Bonds
AAA
TREPS & MutualFund Investments
AA+
Fixed Deposit
16.90
2.20
2.50
2.65
3.64
3.81
4.07
5.99
7.18
12.09
38.97
Others
Civil engineering
NCA
Mfg of tobacco products
Mfg of chemicals andchemical products
Mfg of motor vehicles,trailers and semi-trailers
Mfg of coke and refinedpetroleum products
State DevelopmentLoan
Computer programming,consultancy and related
activities
Govt. of India
Financial and insuranceactivities
AS ON 30th NOVEMBER 2018

Market Outlook Fund Performance Contents Individual Funds Group Funds
Investment ObjectiveAims to preserve capital and minimize downside risk, with investment in debt and government instruments.
Debt Ratings Profile (%)
AUM (in Lakhs)
Sector Allocation as per NIC 2008 % to Fund**
**NIC 2008 - Industrial sector as defined under National Industrial Classification 2008.
MONTHLY UPDATE DECEMBER 2018 | (based on last business day) 23
Dynamic BondFund(%)
Benchmark (%)
1 month 2.3 1.9
3 months 3.5 2.8
6 months 4.9 4.3
1 year 3.7 3.8
2 years 2.9 3.8
3 years 7.2 7.4
4 years 7.5 7.9
5 years 8.9 9.0
6 years 8.0 8.2
7 years 8.7 8.4
10 years 9.2 7.9
Inception 8.3 6.5
Past performance is not necessarily indicative of future performance
Approved (%) Actual (%)
Gsec 00 - 75 50
Debt 25 - 100 47
MMI /Others
00 - 40 4
Date of Inception
AUM (in Lakhs)
NAV
Fund Manager
Benchmark Details
Modified Duration
Asset Allocation
Performance Meter
15th April 2004
97,333.95
32.1481
Debt : KunalShah
Debt - 100% (CRISIL Bond)
Debt & MoneyMarket Instruments : 6.05
Holdings % to Fund
G-Sec 49.68
7.17% GOI - 08.01.2028 5.88
7.72% GOI - 26.10.2055 5.75
8.13% GOI - 22.06.2045 5.75
8.70% REC - 28.09.2028 4.30
7.06% GOI - 10.10.2046 4.20
8.58% GJ SDL - 31.10.2028 3.36
8.15% TN SDL -09.05.2028 2.93
8.47% NABARD - 31.08.2033 2.84
1.44% INFLATION INDEX GS 2023 1.71
8.62% HR SDL 03.09.2028 1.46
Others 11.51
Corporate Debt 46.79
7.4805%KotakMahindraPrimeLtd-11.06.2020 3.44
8.56% REC - 29.11.2028 2.84
9.05% HDFC - 16.10.2028 2.19
9.05% HDFC - 20.11.2023 2.17
7.62% EXIM- 01.09.2026 2.08
8.3750% EXIM- 24.07.2025 1.90
7.85% PFC - 03.04.2028 1.53
8.18% EXIM- 07.12.2025 1.38
11.08% HDFC - 13.04.2027 Set Down 13.04.20 - 7.78%
1.27
8.65% PFC - 28.12.2024 1.03
Others 26.97
MMI 1.89
NCA 1.64
Portfolio
INDIVIDUAL FUNDDYNAMIC BOND FUND (ULIF-015-15/04/04-DYBNDFND-107)
95,739
1,595
Debt NCA
50.51
46.72
1.920.79
0.06Govt & GovtGuaranteed Bonds
AAA
TREPS & MutualFund Investments
AA+
AA-
0.06
1.64
3.35
6.11
13.00
25.14
50.70
Mfg of basic metals
NCA
Wholesale trade, exceptof motor vehicles and
motorcycles
Electricity, gas, steamand air conditioning
supply
State Development Loan
Govt. of India
Financial and insuranceactivities
AS ON 30th NOVEMBER 2018
Market Outlook Fund Performance Contents Individual Funds Group Funds
Investment ObjectiveAims to preserve your capital and minimize your downside risk, with investment in debt and government instruments.
Debt Ratings Profile (%)
AUM (in Lakhs)
Sector Allocation as per NIC 2008 % to Fund**
**NIC 2008 - Industrial sector as defined under National Industrial Classification 2008.
MONTHLY UPDATE DECEMBER 2018 | (based on last business day) 24
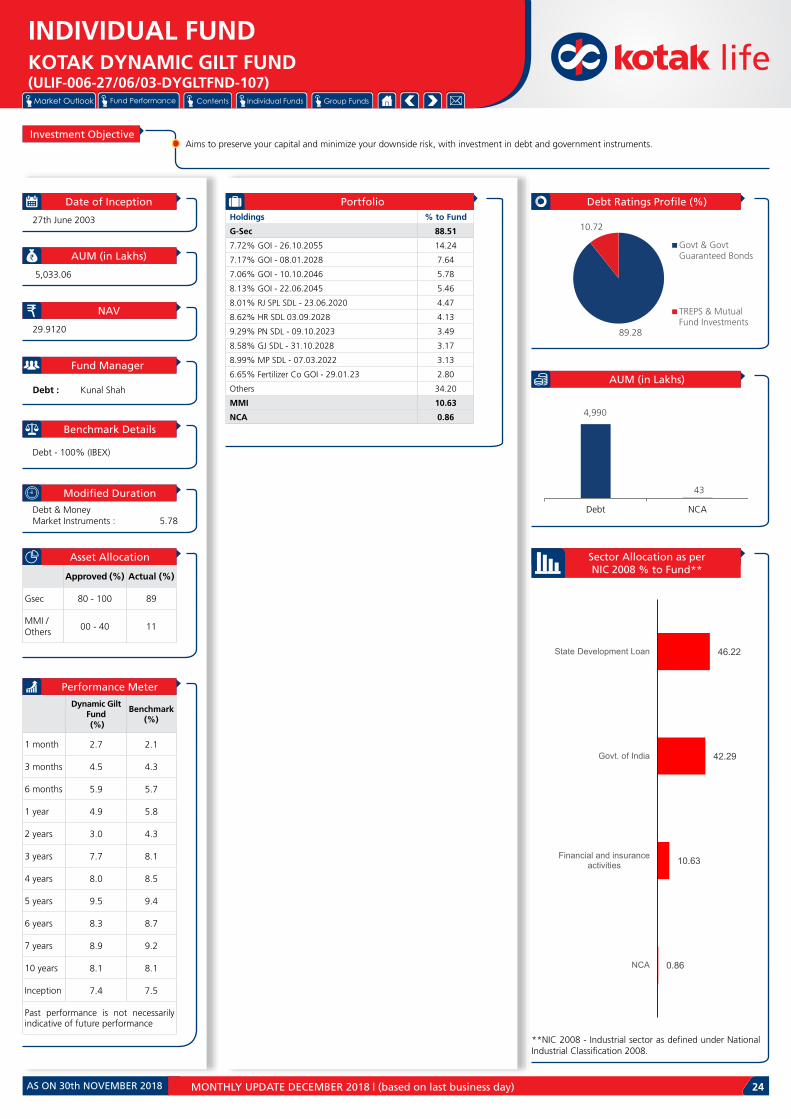
Dynamic GiltFund (%)
Benchmark (%)
1 month 2.7 2.1
3 months 4.5 4.3
6 months 5.9 5.7
1 year 4.9 5.8
2 years 3.0 4.3
3 years 7.7 8.1
4 years 8.0 8.5
5 years 9.5 9.4
6 years 8.3 8.7
7 years 8.9 9.2
10 years 8.1 8.1
Inception 7.4 7.5
Past performance is not necessarily indicative of future performance
Approved (%) Actual (%)
Gsec 80 - 100 89
MMI /Others
00 - 40 11
Date of Inception
AUM (in Lakhs)
NAV
Fund Manager
Benchmark Details
Modified Duration
Asset Allocation
Performance Meter
27th June 2003
5,033.06
29.9120
Debt : KunalShah
Debt - 100% (IBEX)
Debt & MoneyMarket Instruments : 5.78
Holdings % to Fund
G-Sec 88.51
7.72% GOI - 26.10.2055 14.24
7.17% GOI - 08.01.2028 7.64
7.06% GOI - 10.10.2046 5.78
8.13% GOI - 22.06.2045 5.46
8.01% RJ SPL SDL - 23.06.2020 4.47
8.62% HR SDL 03.09.2028 4.13
9.29% PN SDL - 09.10.2023 3.49
8.58% GJ SDL - 31.10.2028 3.17
8.99% MP SDL - 07.03.2022 3.13
6.65% Fertilizer Co GOI - 29.01.23 2.80
Others 34.20
MMI 10.63
NCA 0.86
Portfolio
INDIVIDUAL FUNDKOTAK DYNAMIC GILT FUND(ULIF-006-27/06/03-DYGLTFND-107)
4,990
43
Debt NCA
89.28
10.72
Govt & GovtGuaranteed Bonds
TREPS & MutualFund Investments
0.86
10.63
42.29
46.22
NCA
Financial and insuranceactivities
Govt. of India
State Development Loan
AS ON 30th NOVEMBER 2018
Market Outlook Fund Performance Contents Individual Funds Group Funds
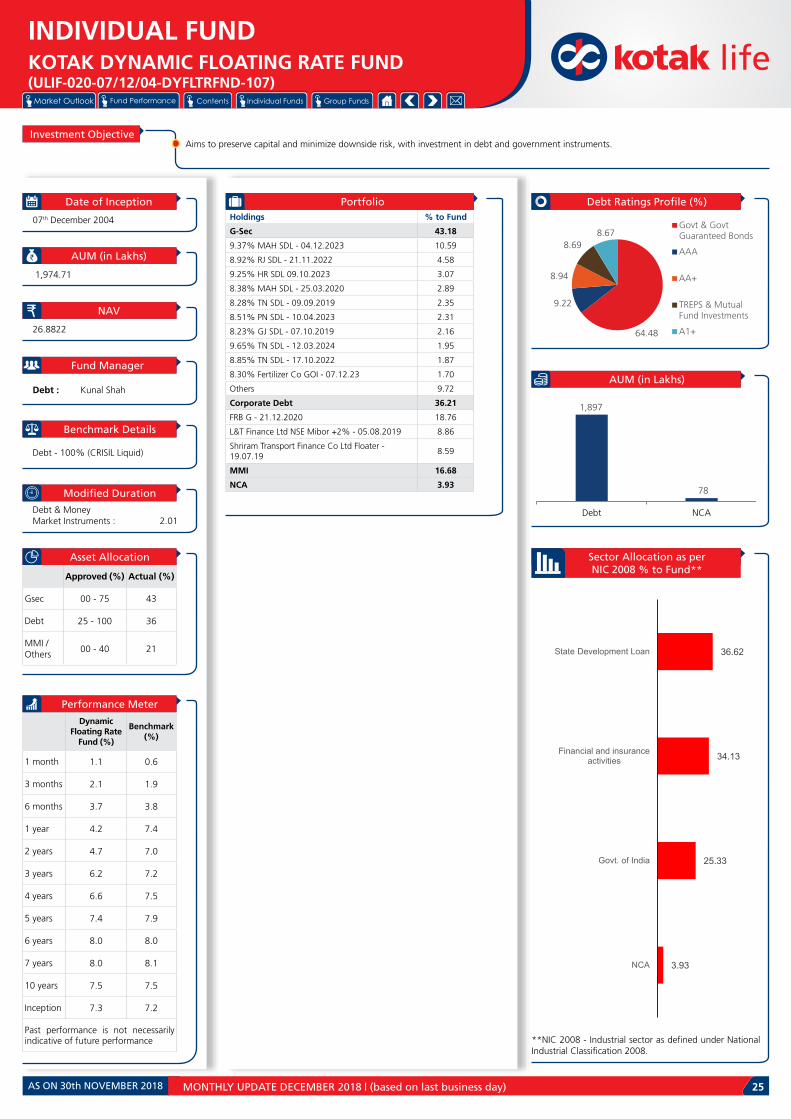
Investment ObjectiveAims to preserve capital and minimize downside risk, with investment in debt and government instruments.
Debt Ratings Profile (%)
AUM (in Lakhs)
Sector Allocation as per NIC 2008 % to Fund**
**NIC 2008 - Industrial sector as defined under National Industrial Classification 2008.
MONTHLY UPDATE DECEMBER 2018 | (based on last business day) 25
Dynamic Floating Rate
Fund (%)
Benchmark (%)
1 month 1.1 0.6
3 months 2.1 1.9
6 months 3.7 3.8
1 year 4.2 7.4
2 years 4.7 7.0
3 years 6.2 7.2
4 years 6.6 7.5
5 years 7.4 7.9
6 years 8.0 8.0
7 years 8.0 8.1
10 years 7.5 7.5
Inception 7.3 7.2
Past performance is not necessarily indicative of future performance
Approved (%) Actual (%)
Gsec 00 - 75 43
Debt 25 - 100 36
MMI /Others
00 - 40 21
Date of Inception
AUM (in Lakhs)
NAV
Fund Manager
Benchmark Details
Modified Duration
Asset Allocation
Performance Meter
07th December 2004
1,974.71
26.8822
Debt : KunalShah
Debt - 100% (CRISIL Liquid)
Debt & MoneyMarket Instruments : 2.01
Holdings % to Fund
G-Sec 43.18
9.37% MAH SDL - 04.12.2023 10.59
8.92% RJ SDL - 21.11.2022 4.58
9.25% HR SDL 09.10.2023 3.07
8.38% MAH SDL - 25.03.2020 2.89
8.28% TN SDL - 09.09.2019 2.35
8.51% PN SDL - 10.04.2023 2.31
8.23% GJ SDL - 07.10.2019 2.16
9.65% TN SDL - 12.03.2024 1.95
8.85% TN SDL - 17.10.2022 1.87
8.30% Fertilizer Co GOI - 07.12.23 1.70
Others 9.72
Corporate Debt 36.21
FRB G - 21.12.2020 18.76
L&T Finance Ltd NSE Mibor +2% - 05.08.2019 8.86
Shriram Transport Finance Co Ltd Floater - 19.07.19
8.59
MMI 16.68
NCA 3.93
Portfolio
INDIVIDUAL FUNDKOTAK DYNAMIC FLOATING RATE FUND(ULIF-020-07/12/04-DYFLTRFND-107)
1,897
78
Debt NCA
64.48
9.22
8.94
8.698.67
Govt & GovtGuaranteed Bonds
AAA
AA+
TREPS & MutualFund Investments
A1+
3.93
25.33
34.13
36.62
NCA
Govt. of India
Financial and insuranceactivities
State Development Loan
AS ON 30th NOVEMBER 2018

Market Outlook Fund Performance Contents Individual Funds Group Funds
Investment ObjectiveAims for a high level of capital growth by holding a significant portion in large sized company equities.
Debt Ratings Profile (%)
AUM (in Lakhs)
Sector Allocation as per NIC 2008 % to Fund**
**NIC 2008 - Industrial sector as defined under National Industrial Classification 2008.
MONTHLY UPDATE DECEMBER 2018 | (based on last business day) 26
PeakGuaranteeFund I (%)
Benchmark (%)
1 month 1.2 2.9
3 months 0.2 -0.9
6 months 3.2 3.3
1 year 6.3 4.9
2 years 8.7 8.0
3 years 8.5 9.0
4 years 5.7 7.4
5 years 8.9 10.3
6 years 7.4 9.4
7 years 8.3 10.1
10 years n.a n.a
Inception 7.2 8.8
Past performance is not necessarily indicative of future performance
Approved (%) Actual (%)
Equity 00 - 100 15
Gsec / Debt
00 - 100 58
MMI /Others
00 - 100 28
Date of Inception
AUM (in Lakhs)
NAV
Fund Manager
Benchmark Details
Modified Duration
Asset Allocation
Performance Meter
14th February 2010
1,538.72
18.3978
Equity : Rohit Agarwal Debt : KunalShah
Equity - 37.5% (Nifty);Debt - 62.5% (CRISIL Bond)
Debt & MoneyMarket Instruments : 0.86
Holdings % to Fund
EQUITY 14.82
Reliance Industries Ltd 1.33
HDFC Bank Ltd 1.16
I T C Ltd 0.89
Infosys Ltd 0.85
Housing Development Finance Corp. Ltd 0.82
Larsen And Toubro Ltd 0.72
Tata Consultancy Services Ltd 0.71
ICICI Bank Ltd 0.58
Hindustan Unilever Ltd 0.56
Maruti Suzuki India Ltd 0.46
Mahindra & Mahindra Ltd 0.34
Sun Pharmaceuticals Ltd 0.31
Axis Bank Ltd 0.28
State Bank of India 0.27
Asian Paints Ltd 0.27
Hero Honda Motors Ltd 0.25
UltraTech Cement Ltd 0.24
Oil & Natural Gas Corporation Ltd 0.22
Bajaj Auto Ltd 0.22
IndusInd Bank Ltd 0.21
Others 4.10
G-Sec 47.93
8.48% MAH SDL - 24.02.2020 36.11
8.14% MH SDL -23.09.2019 6.54
8.28% TN SDL - 09.09.2019 1.90
1.44% INFLATION INDEX GS 2023 1.33
8.20% GOI - 15.02.22 0.27
9.72% PN SDL - 28.08.2023 0.21
8.90%KASDL-19.12.2022 0.18
9.29% PN SDL - 09.10.2023 0.15
9.29% MP SDL - 16.01.2024 0.10
9.69% PN SDL - 12.02.2024 0.09
Others 1.06
Corporate Debt 9.61
9.7705% LIC Housing Finance - 26.02.19 - P - 26.03.15
3.91
8.80% REC - 06.10.2019 1.30
8.70% PFC- 14.05.2020 1.30
9.30% PGC - 28.06.2024 0.84
9.85% HDFC Bank 2019 - 17.03.2024 CALL 17.03.2019
0.65
8.70% PFC- 15.01.2020 0.65
8.57% REC - 21.12.2024 0.65
9.25% IDFC Bank - 13.09.19 0.13
7.40% HDFC Bank FD NSE - 17.08.2019 0.07
7.40% HDFC Bank FD NSE - 01.08.2019 0.07
Others 0.04
MMI 25.99
NCA 1.65
Portfolio
INDIVIDUAL FUNDPEAK GUARANTEE FUND I(ULIF-049-14/02/10-PKGRTFND1-107)
228
1,285
25
Equity Debt NCA
57.38
31.11
11.150.21 0.16
Govt & GovtGuaranteed Bonds
TREPS & MutualFund Investments
AAA
Fixed Deposit
AA+
4.09
0.89
0.92
1.10
1.23
1.59
1.65
1.81
2.03
38.56
46.12
Others
Mfg of tobacco products
Mfg of motor vehicles,trailers and semi-trailers
Mfg of chemicals andchemical products
Electricity, gas, steamand air conditioning
supply
Mfg of coke and refinedpetroleum products
NCA
Govt. of India
Computer programming,consultancy and related
activities
Financial and insuranceactivities
State Development Loan
AS ON 30th NOVEMBER 2018

Market Outlook Fund Performance Contents Individual Funds Group Funds
Investment ObjectiveAims for a high level of capital growth by holding a significant portion in large sized company equities.
Debt Ratings Profile (%)
AUM (in Lakhs)
Sector Allocation as per NIC 2008 % to Fund**
**NIC 2008 - Industrial sector as defined under National Industrial Classification 2008.
MONTHLY UPDATE DECEMBER 2018 | (based on last business day) 27
GuaranteedGrowth Fund
(%)
Benchmark (%)
1 month 3.3 2.8
3 months -3.7 -1.3
6 months 0.6 3.0
1 year 1.0 4.0
2 years 7.6 8.1
3 years 8.7 9.1
4 years 7.8 7.6
5 years 11.4 10.6
6 years 9.9 9.6
7 years 10.7 10.3
10 years 10.8 11.3
Inception 12.8 11.1
Past performance is not necessarily indicative of future performance
Approved (%) Actual (%)
Equity 00 - 80 56
Gsec / Debt
20 - 60 40
MMI /Others
00 - 40 4
Date of Inception
AUM (in Lakhs)
NAV
Fund Manager
Benchmark Details
Modified Duration
Asset Allocation
Performance Meter
27th June 2003
61,299.88
64.3041
Equity : Rohit Agarwal Debt : KunalShah
Equity - 40% (BSE 100);Debt - 60% (CRISIL Bond)
Debt & MoneyMarket Instruments : 5.32
Holdings % to Fund
EQUITY 55.69
Reliance Industries Ltd 3.81
Infosys Ltd 3.81
ICICI Bank Ltd 3.23
HDFC Bank Ltd 3.11
I T C Ltd 2.60
KotakBankingETF-DividendPayoutOption 2.25
Larsen And Toubro Ltd 2.24
Reliance ETF Bank Bees 2.09
Mahindra & Mahindra Ltd 2.04
Axis Bank Ltd 1.69
IndusInd Bank Ltd 1.60
Hindustan Unilever Ltd 1.55
Tech Mahindra Ltd 1.48
Britannia Industries Ltd 1.29
Bata India Ltd 1.19
HCL Technologies Ltd 1.13
State Bank of India 1.07
Mahindra & Mahindra Financial Services Ltd 1.03
Sun Pharmaceuticals Ltd 1.01
SBI ETF Nifty Bank 1.00
Others 16.47
G-Sec 20.05
7.17% GOI - 08.01.2028 2.11
8.13% GOI - 22.06.2045 2.07
7.72% GOI - 26.10.2055 1.99
1.44% INFLATION INDEX GS 2023 1.67
8.70% REC - 28.09.2028 1.58
7.06% GOI - 10.10.2046 1.53
8.58% GJ SDL - 31.10.2028 1.20
8.15% TN SDL -09.05.2028 1.15
8.47% NABARD - 31.08.2033 1.02
8.62% HR SDL 03.09.2028 0.54
Others 5.19
Corporate Debt 20.43
7.4805%KotakMahindraPrimeLtd-11.06.2020 2.00
8.56% REC - 29.11.2028 1.03
8.3750% EXIM- 24.07.2025 0.84
9.05% HDFC - 16.10.2028 0.83
7.62% EXIM- 01.09.2026 0.79
9.05% HDFC - 20.11.2023 0.66
7.85% PFC - 03.04.2028 0.56
8.65% PFC - 28.12.2024 0.51
11.08% HDFC - 13.04.2027 Set Down 13.04.20 - 7.78%
0.50
8.18% EXIM- 07.12.2025 0.37
Others 12.35
MMI 2.35
NCA 1.49
Portfolio
INDIVIDUAL FUNDKOTAK GUARANTEED GROWTH FUND(ULIF-013-27/06/03-GRTGWTFND-107)
34,135 26,252
912
Equity Debt NCA
46.8245.32
5.48
1.131.050.19
Govt & GovtGuaranteed BondsAAA
TREPS & MutualFund InvestmentsAA+
Fixed Deposit
AA-
16.07
2.24
2.60
3.29
3.59
3.74
3.81
5.57
6.80
10.10
42.19
Others
Civil engineering
Mfg of tobacco products
Electricity, gas, steamand air conditioning
supply
Mfg of chemicals andchemical products
Mfg of motor vehicles,trailers and semi-trailers
Mfg of coke and refinedpetroleum products
State Development Loan
Computer programming,consultancy and related
activities
Govt. of India
Financial and insuranceactivities
AS ON 30th NOVEMBER 2018

Market Outlook Fund Performance Contents Individual Funds Group Funds
Investment ObjectiveAims for moderate growth by holding a diversified mix of equities and fixed interest instruments.
Debt Ratings Profile (%)
AUM (in Lakhs)
Sector Allocation as per NIC 2008 % to Fund**
**NIC 2008 - Industrial sector as defined under National Industrial Classification 2008.
MONTHLY UPDATE DECEMBER 2018 | (based on last business day) 28
GuaranteedBalanced Fund (%)
Benchmark (%)
1 month 3.1 2.6
3 months -2.2 -0.3
6 months 1.5 3.3
1 year 1.9 4.0
2 years 6.9 7.1
3 years 8.6 8.7
4 years 7.9 7.7
5 years 11.0 10.2
6 years 9.6 9.3
7 years 10.3 9.9
10 years 10.6 10.5
Inception 11.7 10.0
Past performance is not necessarily indicative of future performance
Approved (%) Actual (%)
Equity 00 - 60 45
Gsec / Debt
20 - 70 51
MMI /Others
00 - 40 5
Date of Inception
AUM (in Lakhs)
NAV
Fund Manager
Benchmark Details
Modified Duration
Asset Allocation
Performance Meter
27th June 2003
8,123.39
55.5714
Equity : Rohit Agarwal Debt : KunalShah
Equity - 30% (BSE 100);Debt - 70% (CRISIL Bond)
Debt & MoneyMarket Instruments : 5.37
Holdings % to Fund
EQUITY 44.69
Reliance Industries Ltd 3.12
Infosys Ltd 3.05
ICICI Bank Ltd 2.55
HDFC Bank Ltd 2.50
KotakBankingETF-DividendPayoutOption 2.12
I T C Ltd 2.05
Reliance ETF Bank Bees 1.88
Larsen And Toubro Ltd 1.71
Mahindra & Mahindra Ltd 1.58
Axis Bank Ltd 1.33
IndusInd Bank Ltd 1.30
Hindustan Unilever Ltd 1.27
Tech Mahindra Ltd 1.16
Britannia Industries Ltd 1.05
Sun Pharmaceuticals Ltd 0.90
Bata India Ltd 0.90
HCL Technologies Ltd 0.87
Maruti Suzuki India Ltd 0.86
Asian Paints Ltd 0.81
SBI ETF Nifty Bank 0.79
Others 12.89
G-Sec 24.83
7.17% GOI - 08.01.2028 2.76
7.72% GOI - 26.10.2055 2.73
8.13% GOI - 22.06.2045 2.70
8.70% REC - 28.09.2028 2.00
7.06% GOI - 10.10.2046 1.98
8.58% GJ SDL - 31.10.2028 1.57
8.15% TN SDL -09.05.2028 1.45
8.47% NABARD - 31.08.2033 1.36
1.44% INFLATION INDEX GS 2023 1.34
8.62% HR SDL 03.09.2028 0.70
Others 6.24
Corporate Debt 25.77
7.4805%KotakMahindraPrimeLtd-11.06.2020 3.36
8.56% REC - 29.11.2028 1.36
11.08% HDFC - 13.04.2027 Set Down 13.04.20 - 7.78%
1.26
9.05% HDFC - 16.10.2028 1.25
9.05% HDFC - 20.11.2023 1.24
7.62% EXIM- 01.09.2026 1.05
8.3750% EXIM- 24.07.2025 0.97
7.85% PFC - 03.04.2028 0.70
10.08% IOT Utkal Energy Services Limited - 20.03.2023
0.68
10.08% IOT Utkal Energy Services Limited - 20.03.2024
0.62
Others 13.27
MMI 3.63
NCA 1.08
Portfolio
INDIVIDUAL FUNDKOTAK GUARANTEED BALANCED FUND(ULIF-010-27/06/03-GRTBALFND-107)
3,630
4,405
88
Equity Debt NCA
45.83
45.78
6.691.35
0.35AAA
Govt & GovtGuaranteed Bonds
TREPS & MutualFund Investments
AA+
Fixed Deposit
13.34
1.85
2.05
2.86
3.09
3.12
3.17
5.53
6.76
12.39
45.85
Others
Electricity, gas, steamand air conditioning
supply
Mfg of tobacco products
Mfg of chemicals andchemical products
Wholesale trade, exceptof motor vehicles and
motorcycles
Mfg of coke and refinedpetroleum products
Mfg of motor vehicles,trailers and semi-trailers
Computer programming,consultancy and related
activities
State Development Loan
Govt. of India
Financial and insuranceactivities
AS ON 30th NOVEMBER 2018

Market Outlook Fund Performance Contents Individual Funds Group Funds
Investment ObjectiveAims to maximize opportunity for long term capital growth by holding significant portions in a diversified and flexible mix of large/medium sized stocks.
Debt Ratings Profile (%)
AUM (in Lakhs)
Sector Allocation as per NIC 2008 % to Fund**
**NIC 2008 - Industrial sector as defined under National Industrial Classification 2008.
MONTHLY UPDATE DECEMBER 2018 | (based on last business day) 29
Pension Classic
Opportunities Fund (%)
Benchmark (%)
1 month 4.6 4.2
3 months -8.3 -8.2
6 months -3.1 -0.6
1 year -3.0 2.2
2 years 11.7 14.0
3 years 10.4 11.2
4 years 8.5 7.1
5 years 15.8 13.4
6 years 13.5 11.6
7 years 14.8 13.1
10 years n.a n.a
Inception 12.1 8.6
Past performance is not necessarily indicative of future performance
Approved (%) Actual (%)
Equity 75 - 100 96
Gsec / Debt
00 - 25 0
MMI /Others
00 - 25 4
Date of Inception
AUM (in Lakhs)
NAV
Fund Manager
Benchmark Details
Modified Duration
Asset Allocation
Performance Meter
07th January 2010
10,382.83
27.6726
Equity : Rohit Agarwal Debt : KunalShah
Equity - 100% (BSE 200)
Debt & MoneyMarket Instruments : 0.01
Holdings % to Fund
EQUITY 96.01
Reliance Industries Ltd 6.69
HDFC Bank Ltd 5.91
Infosys Ltd 5.45
SBI ETF Nifty Bank 4.99
Larsen And Toubro Ltd 4.49
KotakBankingETF-DividendPayoutOption 4.05
ICICI Bank Ltd 3.90
Tata Consultancy Services Ltd 3.83
Axis Bank Ltd 3.14
I T C Ltd 3.08
Mahindra & Mahindra Ltd 2.64
Britannia Industries Ltd 2.57
Aurobindo Pharma Ltd 2.40
Maruti Suzuki India Ltd 2.37
Hindustan Unilever Ltd 2.22
Housing Development Finance Corp. Ltd 2.10
IndusInd Bank Ltd 1.82
Bajaj Finance Ltd 1.79
Tech Mahindra Ltd 1.78
Hindalco Industries Ltd 1.74
Others 29.04
Corporate Debt 0.04
7.40% HDFC Bank FD NSE - 17.08.2019 0.02
7.40% HDFC Bank FD NSE - 01.08.2019 0.02
7.40% HDFC Bank FD BSE - 01.08.2019 0.01
MMI 3.71
NCA 0.24
Portfolio
INDIVIDUAL FUNDPENSION CLASSIC OPPORTUNITIES FUND(ULIF-042-07/01/10-PNCLAOPFND-107)
9,969
389 25
Equity Debt NCA
98.97
1.03
TREPS & MutualFund Investments
Fixed Deposit
13.97
2.66
2.75
3.08
3.83
4.52
4.65
7.41
7.92
11.06
38.14
Others
Warehousing andsupport activities for
transportation
Mfg of electricalequipment
Mfg of tobacco products
Mfg of chemicals andchemical products
Mfg of pharmaceuticals,medicinal chemical &
botanical products
Civil engineering
Mfg of coke and refinedpetroleum products
Mfg of motor vehicles,trailers and semi-trailers
Computer programming,consultancy and related
activities
Financial and insuranceactivities
AS ON 30th NOVEMBER 2018

Market Outlook Fund Performance Contents Individual Funds Group Funds
Investment ObjectiveAims to maximize opportunity for long term capital growth by holding significant portions in a diversified and flexible mix of large/medium sized stocks
Debt Ratings Profile (%)
AUM (in Lakhs)
Sector Allocation as per NIC 2008 % to Fund**
**NIC 2008 - Industrial sector as defined under National Industrial Classification 2008.
MONTHLY UPDATE DECEMBER 2018 | (based on last business day) 30
PensionOpportunities
Fund (%)
Benchmark (%)
1 month 4.46 4.2
3 months -8.4 -8.2
6 months -3.5 -0.6
1 year -3.7 2.2
2 years 10.8 14.0
3 years 9.6 11.2
4 years 7.8 7.1
5 years 14.8 13.4
6 years 12.5 11.6
7 years 13.9 13.1
10 years n.a n.a
Inception 11.0 10.3
Past performance is not necessarily indicative of future performance
Approved (%) Actual (%)
Equity 75 - 100 93
Gsec / Debt
00 - 25 0
MMI /Others
00 - 25 7
Date of Inception
AUM (in Lakhs)
NAV
Fund Manager
Benchmark Details
Modified Duration
Asset Allocation
Performance Meter
17th July 2009
2,272.41
26.7159
Equity : Rohit Agarwal Debt : KunalShah
Equity - 100% (BSE 200)
Debt & MoneyMarket Instruments : 0.01
Holdings % to Fund
EQUITY 93.40
Reliance Industries Ltd 6.56
HDFC Bank Ltd 5.89
Infosys Ltd 5.35
Larsen And Toubro Ltd 4.39
KotakBankingETF-DividendPayoutOption 3.97
SBI ETF Nifty Bank 3.94
ICICI Bank Ltd 3.90
Tata Consultancy Services Ltd 3.74
Axis Bank Ltd 3.11
I T C Ltd 3.00
Mahindra & Mahindra Ltd 2.59
Britannia Industries Ltd 2.51
Aurobindo Pharma Ltd 2.36
Maruti Suzuki India Ltd 2.29
Hindustan Unilever Ltd 2.17
Housing Development Finance Corp. Ltd 2.07
IndusInd Bank Ltd 1.86
Bajaj Finance Ltd 1.73
Tech Mahindra Ltd 1.70
Hindalco Industries Ltd 1.69
Others 28.56
Corporate Debt 0.06
7.40% HDFC Bank FD NSE - 01.08.2019 0.02
7.40% HDFC Bank FD NSE - 17.08.2019 0.02
7.40% HDFC Bank FD BSE - 01.08.2019 0.01
MMI 5.94
NCA 0.61
Portfolio
INDIVIDUAL FUNDKOTAK PENSION OPPORTUNITIES FUND(ULIF-032-17/07/09-PNOPPFND-107)
2,122
136 14
Equity Debt NCA
99.05
0.95
TREPS & MutualFund Investments
Fixed Deposit
14.03
2.62
2.69
3.00
3.75
4.43
4.54
7.27
7.69
10.79
39.20
Others
Warehousing andsupport activities for
transportation
Mfg of electricalequipment
Mfg of tobacco products
Mfg of chemicals andchemical products
Mfg of pharmaceuticals,medicinal chemical &
botanical products
Civil engineering
Mfg of coke and refinedpetroleum products
Mfg of motor vehicles,trailers and semi-trailers
Computer programming,consultancy and related
activities
Financial and insuranceactivities
AS ON 30th NOVEMBER 2018

Market Outlook Fund Performance Contents Individual Funds Group Funds
Investment ObjectiveAims for a high level of capital growth by holding a significant portion in large sized company equities.
Debt Ratings Profile (%)
AUM (in Lakhs)
Sector Allocation as per NIC 2008 % to Fund**
**NIC 2008 - Industrial sector as defined under National Industrial Classification 2008.
MONTHLY UPDATE DECEMBER 2018 | (based on last business day) 31
PensionFrontline
Equity Fund (%)
Benchmark (%)
1 month 4.2 4.3
3 months -7.9 -7.5
6 months -1.9 0.7
1 year -0.1 3.9
2 years 12.2 14.5
3 years 10.5 11.2
4 years 8.5 6.5
5 years 14.9 12.5
6 years 13.3 11.1
7 years 14.3 12.6
10 years n.a n.a
Inception 11.5 8.4
Past performance is not necessarily indicative of future performance
Approved (%) Actual (%)
Equity 60 - 100 98
Gsec / Debt
00 - 40 0
MMI /Others
00 - 40 2
Date of Inception
AUM (in Lakhs)
NAV
Fund Manager
Benchmark Details
Modified Duration
Asset Allocation
Performance Meter
11th January 2010
2,309.38
26.2469
Equity : Rohit Agarwal Debt : KunalShah
Equity - 100% (BSE 100)
Debt & MoneyMarket Instruments : 0.02
Holdings % to Fund
EQUITY 97.83
Reliance Industries Ltd 6.95
Infosys Ltd 6.66
ICICI Bank Ltd 5.60
HDFC Bank Ltd 5.58
I T C Ltd 4.55
Reliance ETF Bank Bees 4.17
KotakBankingETF-DividendPayoutOption 4.15
Larsen And Toubro Ltd 3.81
Mahindra & Mahindra Ltd 3.48
Axis Bank Ltd 2.94
IndusInd Bank Ltd 2.90
Hindustan Unilever Ltd 2.74
Tech Mahindra Ltd 2.58
HCL Technologies Ltd 1.98
Bata India Ltd 1.98
Aurobindo Pharma Ltd 1.94
Britannia Industries Ltd 1.79
Asian Paints Ltd 1.76
Sun Pharmaceuticals Ltd 1.76
SBI ETF Nifty Bank 1.74
Others 28.77
Corporate Debt 0.04
7.40% HDFC Bank FD NSE - 17.08.2019 0.02
7.40% HDFC Bank FD NSE - 01.08.2019 0.02
7.40% HDFC Bank FD BSE - 01.08.2019 0.01
MMI 1.95
NCA 0.19
Portfolio
INDIVIDUAL FUNDPENSION FRONTLINE EQUITY FUND(ULIF-044-11/01/10-PNFRLEQFND-107)
2,259
46 4
Equity Debt NCA
98.01
1.99
TREPS & MutualFund Investments
Fixed Deposit
14.13
2.72
2.83
3.70
3.81
4.55
6.28
6.59
6.95
12.21
36.21
Others
Mfg of food products
Mfg of basic metals
Mfg of pharmaceuticals,medicinal chemical &
botanical products
Civil engineering
Mfg of tobacco products
Mfg of chemicals andchemical products
Mfg of motor vehicles,trailers and semi-trailers
Mfg of coke and refinedpetroleum products
Computer programming,consultancy and related
activities
Financial and insuranceactivities
AS ON 30th NOVEMBER 2018
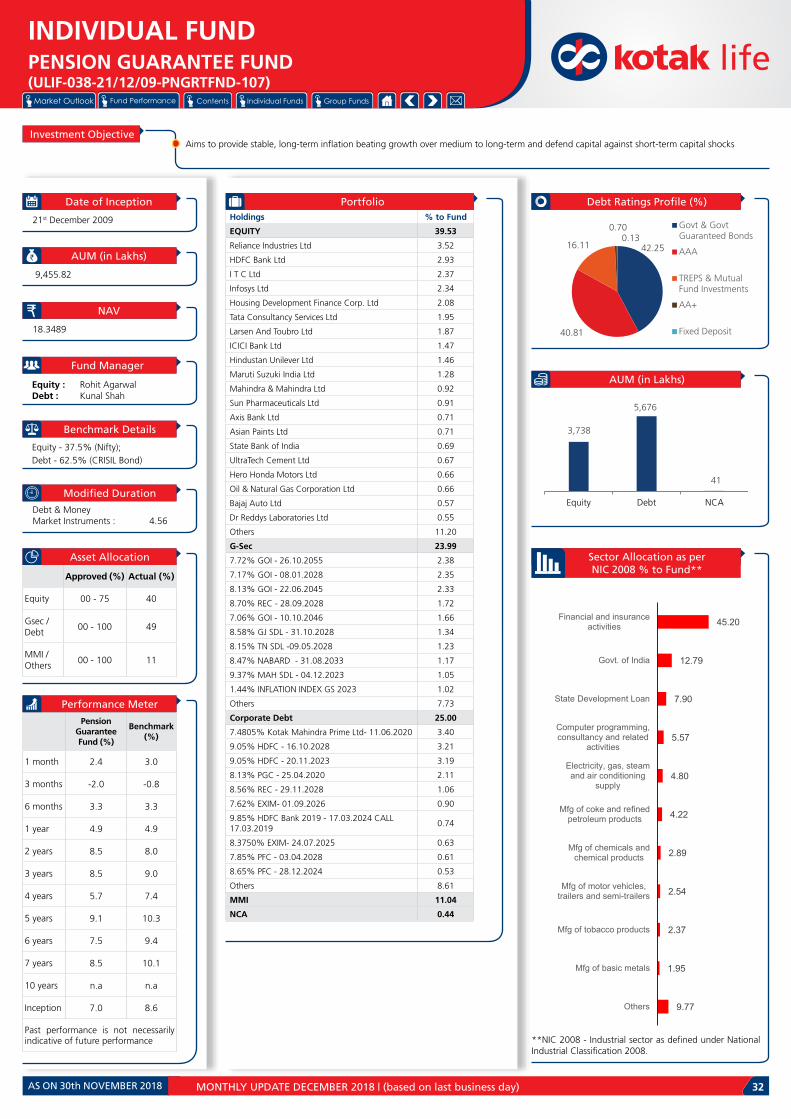
Market Outlook Fund Performance Contents Individual Funds Group Funds
Investment ObjectiveAims to provide stable, long-term inflation beating growth over medium to long-term and defend capital against short-term capital shocks
Debt Ratings Profile (%)
AUM (in Lakhs)
Sector Allocation as per NIC 2008 % to Fund**
**NIC 2008 - Industrial sector as defined under National Industrial Classification 2008.
MONTHLY UPDATE DECEMBER 2018 | (based on last business day) 32
PensionGuarantee Fund (%)
Benchmark (%)
1 month 2.4 3.0
3 months -2.0 -0.8
6 months 3.3 3.3
1 year 4.9 4.9
2 years 8.5 8.0
3 years 8.5 9.0
4 years 5.7 7.4
5 years 9.1 10.3
6 years 7.5 9.4
7 years 8.5 10.1
10 years n.a n.a
Inception 7.0 8.6
Past performance is not necessarily indicative of future performance
Approved (%) Actual (%)
Equity 00 - 75 40
Gsec / Debt
00 - 100 49
MMI /Others
00 - 100 11
Date of Inception
AUM (in Lakhs)
NAV
Fund Manager
Benchmark Details
Modified Duration
Asset Allocation
Performance Meter
21st December 2009
9,455.82
18.3489
Equity : Rohit Agarwal Debt : KunalShah
Equity - 37.5% (Nifty);Debt - 62.5% (CRISIL Bond)
Debt & MoneyMarket Instruments : 4.56
Holdings % to Fund
EQUITY 39.53
Reliance Industries Ltd 3.52
HDFC Bank Ltd 2.93
I T C Ltd 2.37
Infosys Ltd 2.34
Housing Development Finance Corp. Ltd 2.08
Tata Consultancy Services Ltd 1.95
Larsen And Toubro Ltd 1.87
ICICI Bank Ltd 1.47
Hindustan Unilever Ltd 1.46
Maruti Suzuki India Ltd 1.28
Mahindra & Mahindra Ltd 0.92
Sun Pharmaceuticals Ltd 0.91
Axis Bank Ltd 0.71
Asian Paints Ltd 0.71
State Bank of India 0.69
UltraTech Cement Ltd 0.67
Hero Honda Motors Ltd 0.66
Oil & Natural Gas Corporation Ltd 0.66
Bajaj Auto Ltd 0.57
Dr Reddys Laboratories Ltd 0.55
Others 11.20
G-Sec 23.99
7.72% GOI - 26.10.2055 2.38
7.17% GOI - 08.01.2028 2.35
8.13% GOI - 22.06.2045 2.33
8.70% REC - 28.09.2028 1.72
7.06% GOI - 10.10.2046 1.66
8.58% GJ SDL - 31.10.2028 1.34
8.15% TN SDL -09.05.2028 1.23
8.47% NABARD - 31.08.2033 1.17
9.37% MAH SDL - 04.12.2023 1.05
1.44% INFLATION INDEX GS 2023 1.02
Others 7.73
Corporate Debt 25.00
7.4805%KotakMahindraPrimeLtd-11.06.2020 3.40
9.05% HDFC - 16.10.2028 3.21
9.05% HDFC - 20.11.2023 3.19
8.13% PGC - 25.04.2020 2.11
8.56% REC - 29.11.2028 1.06
7.62% EXIM- 01.09.2026 0.90
9.85% HDFC Bank 2019 - 17.03.2024 CALL 17.03.2019
0.74
8.3750% EXIM- 24.07.2025 0.63
7.85% PFC - 03.04.2028 0.61
8.65% PFC - 28.12.2024 0.53
Others 8.61
MMI 11.04
NCA 0.44
Portfolio
INDIVIDUAL FUNDPENSION GUARANTEE FUND(ULIF-038-21/12/09-PNGRTFND-107)
3,738
5,676
41
Equity Debt NCA
42.25
40.81
16.11
0.700.13
Govt & GovtGuaranteed Bonds
AAA
TREPS & MutualFund Investments
AA+
Fixed Deposit
9.77
1.95
2.37
2.54
2.89
4.22
4.80
5.57
7.90
12.79
45.20
Others
Mfg of basic metals
Mfg of tobacco products
Mfg of motor vehicles,trailers and semi-trailers
Mfg of chemicals andchemical products
Mfg of coke and refinedpetroleum products
Electricity, gas, steamand air conditioning
supply
Computer programming,consultancy and related
activities
State Development Loan
Govt. of India
Financial and insuranceactivities
AS ON 30th NOVEMBER 2018

Market Outlook Fund Performance Contents Individual Funds Group Funds
Investment ObjectiveAims for a high level of capital growth by holding a significant portion in large sized company equities.
Debt Ratings Profile (%)
AUM (in Lakhs)
Sector Allocation as per NIC 2008 % to Fund**
**NIC 2008 - Industrial sector as defined under National Industrial Classification 2008.
MONTHLY UPDATE DECEMBER 2018 | (based on last business day) 33
PensionGrowth
Fund (%)
Benchmark (%)
1 month 3.2 2.8
3 months -3.1 -1.3
6 months 1.1 3.0
1 year 1.6 4.0
2 years 7.7 8.1
3 years 8.7 9.1
4 years 7.8 7.6
5 years 11.4 10.6
6 years 9.9 9.6
7 years 10.7 10.3
10 years n.a n.a
Inception 10.7 10.7
Past performance is not necessarily indicative of future performance
Approved (%) Actual (%)
Equity 00 - 80 54
Gsec / Debt
20 - 60 38
MMI /Others
00 - 40 8
Date of Inception
AUM (in Lakhs)
NAV
Fund Manager
Benchmark Details
Modified Duration
Asset Allocation
Performance Meter
07th January 2009
1,847.38
27.3308
Equity : Rohit Agarwal Debt : KunalShah
Equity - 40% (BSE 100);Debt - 60% (CRISIL Bond)
Debt & MoneyMarket Instruments : 5.01
Holdings % to Fund
EQUITY 53.68
Reliance Industries Ltd 3.73
Infosys Ltd 3.57
ICICI Bank Ltd 3.12
HDFC Bank Ltd 2.62
I T C Ltd 2.46
KotakBankingETF-DividendPayoutOption 2.29
Reliance ETF Bank Bees 2.27
Larsen And Toubro Ltd 2.05
Mahindra & Mahindra Ltd 1.92
Hindustan Unilever Ltd 1.63
Axis Bank Ltd 1.59
IndusInd Bank Ltd 1.59
Tech Mahindra Ltd 1.40
Britannia Industries Ltd 1.26
Bata India Ltd 1.20
HCL Technologies Ltd 1.06
Aurobindo Pharma Ltd 1.03
Maruti Suzuki India Ltd 1.01
Sun Pharmaceuticals Ltd 0.97
SBI ETF Nifty Bank 0.97
Others 15.92
G-Sec 24.14
7.17% GOI - 08.01.2028 2.57
7.72% GOI - 26.10.2055 2.54
8.13% GOI - 22.06.2045 2.53
8.70% REC - 28.09.2028 2.20
8.15% GOI FCI Bonds - 16.10.22 2.20
7.06% GOI - 10.10.2046 1.85
8.58% GJ SDL - 31.10.2028 1.48
8.15% TN SDL -09.05.2028 1.37
8.47% NABARD - 31.08.2033 1.09
1.44% INFLATION INDEX GS 2023 0.90
Others 5.41
Corporate Debt 13.81
7.4805%KotakMahindraPrimeLtd-11.06.2020 3.17
8.56% REC - 29.11.2028 1.09
7.85% PFC - 03.04.2028 1.03
7.62% EXIM- 01.09.2026 1.02
10.08% IOT Utkal Energy Services Limited - 20.03.2026
0.58
9.39% LIC Housing Finance - 23.08.2024 - P - 26.08.15
0.55
9.85% HDFC Bank 2019 - 17.03.2024 CALL 17.03.2019
0.54
9.3434% Mahindra and Mahindra Financial Services Ltd- 17.03.
0.54
9.61% REC - 03.01.2019 0.54
8.65% PFC - 28.12.2024 0.54
Others 4.20
MMI 7.31
NCA 1.07
Portfolio
INDIVIDUAL FUNDKOTAK PENSION GROWTH FUND(ULIF-030-07/01/09-PNGWTFND-107)
992 836
20
Equity Debt NCA
53.34
30.14
16.140.37 Govt & Govt
Guaranteed Bonds
AAA
TREPS & MutualFund Investments
Fixed Deposit
14.69
2.05
2.46
2.63
3.48
3.73
3.81
6.35
6.57
13.41
40.82
Others
Civil engineering
Mfg of tobacco products
Wholesale trade, exceptof motor vehicles and
motorcycles
Mfg of chemicals andchemical products
Mfg of coke and refinedpetroleum products
Mfg of motor vehicles,trailers and semi-trailers
State DevelopmentLoan
Computer programming,consultancy and related
activities
Govt. of India
Financial and insuranceactivities
AS ON 30th NOVEMBER 2018

Market Outlook Fund Performance Contents Individual Funds Group Funds
Investment ObjectiveAims to provide stable, long-term inflation beating growth over medium to long-term and defend capital against short-term capital shocks.
Debt Ratings Profile (%)
AUM (in Lakhs)
Sector Allocation as per NIC 2008 % to Fund**
**NIC 2008 - Industrial sector as defined under National Industrial Classification 2008.
MONTHLY UPDATE DECEMBER 2018 | (based on last business day) 34
Pension FloorFund (%)
Benchmark (%)
1 month 3.0 2.9
3 months -1.5 -0.8
6 months 1.8 3.3
1 year 1.7 4.9
2 years 5.9 8.0
3 years 8.2 9.0
4 years 5.4 7.4
5 years 8.7 10.3
6 years 7.2 9.4
7 years 8.1 10.1
10 years n.a n.a
Inception 6.5 9.3
Past performance is not necessarily indicative of future performance
Approved (%) Actual (%)
Equity 00 - 75 38
Gsec / Debt
00 - 100 56
MMI /Others
00 - 40 6
Date of Inception
AUM (in Lakhs)
NAV
Fund Manager
Benchmark Details
Modified Duration
Asset Allocation
Performance Meter
13th July 2009
3,791.54
18.0484
Equity : Rohit Agarwal Debt : KunalShah
Equity - 37.5% (Nifty);Debt - 62.5% (CRISIL Bond)
Debt & MoneyMarket Instruments : 5.56
Holdings % to Fund
EQUITY 38.50
Reliance Industries Ltd 2.75
Infosys Ltd 2.65
ICICI Bank Ltd 2.22
HDFC Bank Ltd 2.17
I T C Ltd 1.78
Reliance ETF Bank Bees 1.69
KotakBankingETF-DividendPayoutOption 1.55
Larsen And Toubro Ltd 1.51
Mahindra & Mahindra Ltd 1.38
Axis Bank Ltd 1.16
IndusInd Bank Ltd 1.11
Hindustan Unilever Ltd 1.07
Tech Mahindra Ltd 1.00
Britannia Industries Ltd 0.92
Bata India Ltd 0.79
Aurobindo Pharma Ltd 0.76
HCL Technologies Ltd 0.76
Asian Paints Ltd 0.71
Mahindra & Mahindra Financial Services Ltd 0.70
Sun Pharmaceuticals Ltd 0.69
Others 11.12
G-Sec 30.30
7.17% GOI - 08.01.2028 3.31
7.72% GOI - 26.10.2055 3.26
8.13% GOI - 22.06.2045 3.22
8.70% REC - 28.09.2028 2.41
7.06% GOI - 10.10.2046 2.39
8.58% GJ SDL - 31.10.2028 1.87
8.15% TN SDL -09.05.2028 1.75
1.44% INFLATION INDEX GS 2023 1.65
8.47% NABARD - 31.08.2033 1.59
8.62% HR SDL 03.09.2028 0.84
Others 8.01
Corporate Debt 25.56
7.4805%KotakMahindraPrimeLtd-11.06.2020 3.34
8.56% REC - 29.11.2028 1.86
8.3750% EXIM- 24.07.2025 1.30
7.62% EXIM- 01.09.2026 1.25
8.65% PFC - 28.12.2024 0.79
8.18% EXIM- 07.12.2025 0.77
7.85% PFC - 03.04.2028 0.75
L&T Finance Ltd NSE Mibor +2% - 05.08.2019 0.66
9.39% LIC Housing Finance - 23.08.2024 - P - 26.08.15
0.53
9.25% LIC Housing Finance - 12.11.2022 0.53
Others 13.76
MMI 4.48
NCA 1.16
Portfolio
INDIVIDUAL FUNDKOTAK PENSION FLOOR FUND(ULIF-031-13/07/09-PNFLRFND-107)
1,460
2,288
44
Equity Debt NCA
10.28
1.51
1.78
2.46
2.62
2.75
3.58
4.80
8.08
15.10
47.03
Others
Civil engineering
Mfg of tobacco products
Mfg of chemicals andchemical products
Mfg of motor vehicles,trailers and semi-trailers
Mfg of coke and refinedpetroleum products
Electricity, gas, steamand air conditioning
supply
Computer programming,consultancy and related
activities
State Development Loan
Govt. of India
Financial and insuranceactivities
AS ON 30th NOVEMBER 2018
50.22
40.12
7.43
1.910.33
Govt & GovtGuaranteed Bonds
AAA
TREPS & MutualFund Investments
AA+
Fixed Deposit
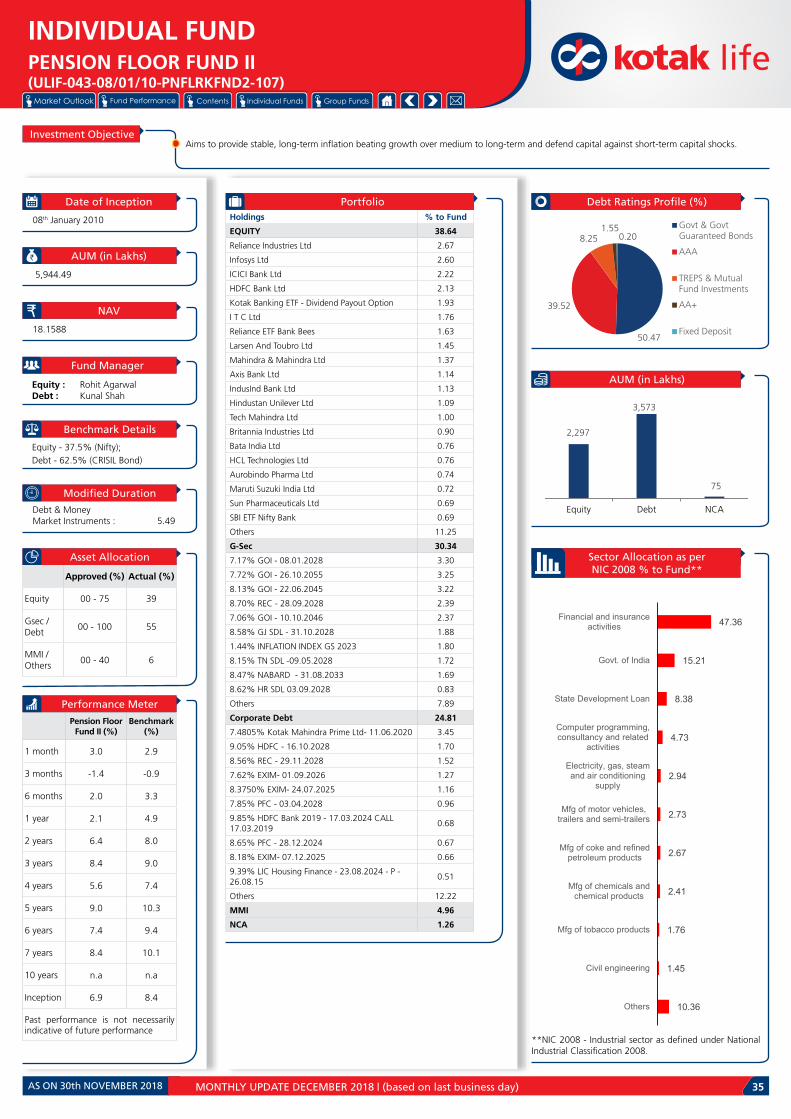
Market Outlook Fund Performance Contents Individual Funds Group Funds
Investment ObjectiveAims to provide stable, long-term inflation beating growth over medium to long-term and defend capital against short-term capital shocks.
Debt Ratings Profile (%)
AUM (in Lakhs)
Sector Allocation as per NIC 2008 % to Fund**
**NIC 2008 - Industrial sector as defined under National Industrial Classification 2008.
MONTHLY UPDATE DECEMBER 2018 | (based on last business day) 35
Pension Floor Fund II (%)
Benchmark (%)
1 month 3.0 2.9
3 months -1.4 -0.9
6 months 2.0 3.3
1 year 2.1 4.9
2 years 6.4 8.0
3 years 8.4 9.0
4 years 5.6 7.4
5 years 9.0 10.3
6 years 7.4 9.4
7 years 8.4 10.1
10 years n.a n.a
Inception 6.9 8.4
Past performance is not necessarily indicative of future performance
Approved (%) Actual (%)
Equity 00 - 75 39
Gsec / Debt
00 - 100 55
MMI /Others
00 - 40 6
Date of Inception
AUM (in Lakhs)
NAV
Fund Manager
Benchmark Details
Modified Duration
Asset Allocation
Performance Meter
08th January 2010
5,944.49
18.1588
Equity : Rohit Agarwal Debt : KunalShah
Equity - 37.5% (Nifty);Debt - 62.5% (CRISIL Bond)
Debt & MoneyMarket Instruments : 5.49
Holdings % to Fund
EQUITY 38.64
Reliance Industries Ltd 2.67
Infosys Ltd 2.60
ICICI Bank Ltd 2.22
HDFC Bank Ltd 2.13
KotakBankingETF-DividendPayoutOption 1.93
I T C Ltd 1.76
Reliance ETF Bank Bees 1.63
Larsen And Toubro Ltd 1.45
Mahindra & Mahindra Ltd 1.37
Axis Bank Ltd 1.14
IndusInd Bank Ltd 1.13
Hindustan Unilever Ltd 1.09
Tech Mahindra Ltd 1.00
Britannia Industries Ltd 0.90
Bata India Ltd 0.76
HCL Technologies Ltd 0.76
Aurobindo Pharma Ltd 0.74
Maruti Suzuki India Ltd 0.72
Sun Pharmaceuticals Ltd 0.69
SBI ETF Nifty Bank 0.69
Others 11.25
G-Sec 30.34
7.17% GOI - 08.01.2028 3.30
7.72% GOI - 26.10.2055 3.25
8.13% GOI - 22.06.2045 3.22
8.70% REC - 28.09.2028 2.39
7.06% GOI - 10.10.2046 2.37
8.58% GJ SDL - 31.10.2028 1.88
1.44% INFLATION INDEX GS 2023 1.80
8.15% TN SDL -09.05.2028 1.72
8.47% NABARD - 31.08.2033 1.69
8.62% HR SDL 03.09.2028 0.83
Others 7.89
Corporate Debt 24.81
7.4805%KotakMahindraPrimeLtd-11.06.2020 3.45
9.05% HDFC - 16.10.2028 1.70
8.56% REC - 29.11.2028 1.52
7.62% EXIM- 01.09.2026 1.27
8.3750% EXIM- 24.07.2025 1.16
7.85% PFC - 03.04.2028 0.96
9.85% HDFC Bank 2019 - 17.03.2024 CALL 17.03.2019
0.68
8.65% PFC - 28.12.2024 0.67
8.18% EXIM- 07.12.2025 0.66
9.39% LIC Housing Finance - 23.08.2024 - P - 26.08.15
0.51
Others 12.22
MMI 4.96
NCA 1.26
Portfolio
INDIVIDUAL FUNDPENSION FLOOR FUND II(ULIF-043-08/01/10-PNFLRKFND2-107)
2,297
3,573
75
Equity Debt NCA
50.47
39.52
8.251.55
0.20Govt & GovtGuaranteed Bonds
AAA
TREPS & MutualFund Investments
AA+
Fixed Deposit
10.36
1.45
1.76
2.41
2.67
2.73
2.94
4.73
8.38
15.21
47.36
Others
Civil engineering
Mfg of tobacco products
Mfg of chemicals andchemical products
Mfg of coke and refinedpetroleum products
Mfg of motor vehicles,trailers and semi-trailers
Electricity, gas, steamand air conditioning
supply
Computer programming,consultancy and related
activities
State Development Loan
Govt. of India
Financial and insuranceactivities
AS ON 30th NOVEMBER 2018

Market Outlook Fund Performance Contents Individual Funds Group Funds
Investment ObjectiveAims for moderate growth by holding a diversified mix of equities and fixed interest instruments.
Debt Ratings Profile (%)
AUM (in Lakhs)
Sector Allocation as per NIC 2008 % to Fund**
**NIC 2008 - Industrial sector as defined under National Industrial Classification 2008.
MONTHLY UPDATE DECEMBER 2018 | (based on last business day) 36
Pension BalancedFund (%)
Benchmark (%)
1 month 3.2 2.6
3 months -2.5 -0.3
6 months 1.4 3.3
1 year 1.4 4.0
2 years 6.6 7.1
3 years 8.4 8.7
4 years 7.8 7.7
5 years 10.9 10.2
6 years 9.5 9.3
7 years 10.2 9.9
10 years 10.4 10.5
Inception 11.8 10.0
Past performance is not necessarily indicative of future performance
Approved (%) Actual (%)
Equity 00 - 60 47
Gsec / Debt
20 - 70 49
MMI /Others
00 - 40 4
Date of Inception
AUM (in Lakhs)
NAV
Fund Manager
Benchmark Details
Modified Duration
Asset Allocation
Performance Meter
27th June 2003
10,234.13
56.1723
Equity : Rohit Agarwal Debt : KunalShah
Equity - 30% (BSE 100);Debt - 70% (CRISIL Bond)
Debt & MoneyMarket Instruments : 5.49
Holdings % to Fund
EQUITY 47.49
Reliance Industries Ltd 3.56
Infosys Ltd 3.33
HDFC Bank Ltd 2.58
ICICI Bank Ltd 2.45
I T C Ltd 2.31
KotakBankingETF-DividendPayoutOption 1.88
Larsen And Toubro Ltd 1.88
Reliance ETF Bank Bees 1.69
Axis Bank Ltd 1.56
Mahindra & Mahindra Ltd 1.54
Tech Mahindra Ltd 1.34
IndusInd Bank Ltd 1.33
Hindustan Unilever Ltd 1.29
Bata India Ltd 1.23
State Bank of India 1.02
HCL Technologies Ltd 1.01
Sun Pharmaceuticals Ltd 1.00
Britannia Industries Ltd 0.90
Aurobindo Pharma Ltd 0.87
Asian Paints Ltd 0.86
Others 13.87
G-Sec 25.12
7.72% GOI - 26.10.2055 2.49
8.13% GOI - 22.06.2045 2.48
7.17% GOI - 08.01.2028 2.45
1.44% INFLATION INDEX GS 2023 2.40
7.06% GOI - 10.10.2046 1.89
8.70% REC - 28.09.2028 1.79
8.58% GJ SDL - 31.10.2028 1.48
8.47% NABARD - 31.08.2033 1.18
8.15% TN SDL -09.05.2028 1.13
8.62% HR SDL 03.09.2028 0.67
Others 7.17
Corporate Debt 23.77
7.62% EXIM- 01.09.2026 1.20
8.56% REC - 29.11.2028 1.08
11.08% HDFC - 13.04.2027 Set Down 13.04.20 - 7.78%
1.00
8.3750% EXIM- 24.07.2025 0.87
8.65% PFC - 28.12.2024 0.68
7.85% PFC - 03.04.2028 0.65
10.08% IOT Utkal Energy Services Limited - 20.03.2022
0.56
10.08% IOT Utkal Energy Services Limited - 20.03.2027
0.53
9.85% HDFC Bank 2019 - 17.03.2024 CALL 17.03.2019
0.49
7.20% PGC - 09.08.2027 0.45
Others 16.24
MMI 0.63
NCA 2.98
Portfolio
INDIVIDUAL FUNDKOTAK PENSION BALANCED FUND(ULIF-011-27/06/03-PNBALFND-107)
4,860 5,068
305
Equity Debt NCA
50.73
45.78
1.28
1.040.97
0.20 Govt & GovtGuaranteed BondsAAA
TREPS & MutualFund InvestmentsFixed Deposit
AA+
AA-
15.83
2.31
2.98
2.98
3.18
3.56
4.38
6.01
6.90
12.95
38.92
Others
Mfg of tobacco products
Mfg of motor vehicles,trailers and semi-trailers
NCA
Mfg of chemicals andchemical products
Mfg of coke and refinedpetroleum products
Electricity, gas, steamand air conditioning
supply
Computer programming,consultancy and related
activities
State DevelopmentLoan
Govt. of India
Financial and insuranceactivities
AS ON 30th NOVEMBER 2018

Market Outlook Fund Performance Contents Individual Funds Group Funds
Investment ObjectiveAims for moderate growth by holding a diversified mix of equities and fixed interest instruments.
Debt Ratings Profile (%)
AUM (in Lakhs)
Sector Allocation as per NIC 2008 % to Fund**
**NIC 2008 - Industrial sector as defined under National Industrial Classification 2008.
MONTHLY UPDATE DECEMBER 2018 | (based on last business day) 37
PensionBalanced
Fund II (%)
Benchmark (%)
1 month 3.1 3.3
3 months -3.4 -3.4
6 months 0.7 2.2
1 year 1.6 4.0
2 years 8.1 10.3
3 years 8.9 9.9
4 years 7.9 7.3
5 years 12.2 11.3
6 years 10.9 10.2
7 years 11.7 11.2
10 years n.a n.a
Inception 9.5 8.7
Past performance is not necessarily indicative of future performance
Approved (%) Actual (%)
Equity 30 - 60 53
Gsec / Debt
20 - 70 33
MMI /Others
00 - 40 13
Date of Inception
AUM (in Lakhs)
NAV
Fund Manager
Benchmark Details
Modified Duration
Asset Allocation
Performance Meter
24th January 2010
369.49
22.2642
Equity : Rohit Agarwal Debt : KunalShah
Equity - 60% (BSE 100);Debt - 40% (CRISIL Bond)
Debt & MoneyMarket Instruments : 4.30
Holdings % to Fund
EQUITY 53.38
Infosys Ltd 3.74
Reliance Industries Ltd 3.66
ICICI Bank Ltd 3.22
HDFC Bank Ltd 2.90
I T C Ltd 2.33
KotakBankingETF-DividendPayoutOption 2.29
Mahindra & Mahindra Ltd 2.00
Axis Bank Ltd 1.93
Larsen And Toubro Ltd 1.90
Reliance ETF Bank Bees 1.87
IndusInd Bank Ltd 1.66
Hindustan Unilever Ltd 1.54
Tech Mahindra Ltd 1.45
Britannia Industries Ltd 1.20
State Bank of India 1.15
HCL Technologies Ltd 1.13
Aurobindo Pharma Ltd 1.01
SBI ETF Nifty Bank 1.00
Maruti Suzuki India Ltd 1.00
Bata India Ltd 0.99
Others 15.42
G-Sec 22.65
8.56% NABARD - 14.11.2028 2.73
8.47% NABARD - 31.08.2033 2.72
7.72% GOI - 26.10.2055 2.32
7.17% GOI - 08.01.2028 2.29
8.13% GOI - 22.06.2045 2.24
7.06% GOI - 10.10.2046 1.64
8.15% GOI FCI Bonds - 16.10.22 1.37
8.58% GJ SDL - 31.10.2028 1.30
8.15% TN SDL -09.05.2028 1.17
1.44% INFLATION INDEX GS 2023 0.83
Others 4.03
Corporate Debt 10.64
9.61% REC - 03.01.2019 2.71
9.36% IDFC Bank - 21.08.24 2.70
7.4805%KotakMahindraPrimeLtd-11.06.2020 2.64
10.08% IOT Utkal Energy Services Limited - 20.03.2026
0.58
10.08% IOT Utkal Energy Services Limited - 20.03.2025
0.57
10.08% IOT Utkal Energy Services Limited - 20.03.2024
0.57
10.08% IOT Utkal Energy Services Limited - 20.03.2027
0.29
10.08% IOT Utkal Energy Services Limited - 20.03.2023
0.28
10.08% IOT Utkal Energy Services Limited - 20.03.2022
0.28
7.40% HDFC Bank FD NSE - 17.08.2019 0.01
Others 0.01
MMI 12.17
NCA 1.16
Portfolio
INDIVIDUAL FUNDPENSION BALANCED FUND II(ULIF-046-24/01/10-PNBALFND2-107)
197 168
4
Equity Debt NCA
49.8226.78
17.41
5.93 0.05Govt & GovtGuaranteed Bonds
TREPS & MutualFund Investments
AAA
AA+
Fixed Deposit
13.53
1.97
2.33
2.68
3.29
3.66
3.87
5.81
6.84
11.39
44.62
Others
Mfg of pharmaceuticals,medicinal chemical &
botanical products
Mfg of tobacco products
Wholesale trade, exceptof motor vehicles and
motorcycles
Mfg of chemicals andchemical products
Mfg of coke and refinedpetroleum products
Mfg of motor vehicles,trailers and semi-trailers
State Development Loan
Computer programming,consultancy and related
activities
Govt. of India
Financial and insuranceactivities
AS ON 30th NOVEMBER 2018

Market Outlook Fund Performance Contents Individual Funds Group Funds
Investment ObjectiveAims to preserve capital and minimize downside risk, with investment in debt and government instruments.
Debt Ratings Profile (%)
AUM (in Lakhs)
Sector Allocation as per NIC 2008 % to Fund**
**NIC 2008 - Industrial sector as defined under National Industrial Classification 2008.
MONTHLY UPDATE DECEMBER 2018 | (based on last business day) 38
PensionBond Fund
(%)
Benchmark (%)
1 month 2.3 1.9
3 months 3.5 2.8
6 months 4.9 4.3
1 year 3.6 3.8
2 years 2.8 3.8
3 years 7.2 7.4
4 years 7.5 7.9
5 years 8.8 9.0
6 years 8.0 8.2
7 years 8.6 8.4
10 years 9.2 7.9
Inception 8.3 6.5
Past performance is not necessarily indicative of future performance
Approved (%) Actual (%)
Gsec 00 - 75 52
Debt 25 - 100 44
MMI /Others
00 - 40 5
Date of Inception
AUM (in Lakhs)
NAV
Fund Manager
Benchmark Details
Modified Duration
Asset Allocation
Performance Meter
15th April 2004
5,144.31
32.2311
Debt : KunalShah
Equity - 0% (NA);Debt - 100% (CRISIL Bond)
Debt & MoneyMarket Instruments : 6.08
Holdings % to Fund
G-Sec 51.70
7.17% GOI - 08.01.2028 5.91
7.72% GOI - 26.10.2055 5.87
8.13% GOI - 22.06.2045 5.75
8.70% REC - 28.09.2028 4.55
7.06% GOI - 10.10.2046 4.28
8.58% GJ SDL - 31.10.2028 3.44
1.44% INFLATION INDEX GS 2023 3.09
8.15% TN SDL -09.05.2028 2.98
8.47% NABARD - 31.08.2033 2.73
8.62% HR SDL 03.09.2028 1.48
Others 11.62
Corporate Debt 43.72
7.4805%KotakMahindraPrimeLtd-11.06.2020 3.60
8.56% REC - 29.11.2028 2.74
7.62% EXIM- 01.09.2026 2.21
9.05% HDFC - 16.10.2028 1.97
8.3750% EXIM- 24.07.2025 1.73
7.85% PFC - 03.04.2028 1.48
8.65% PFC - 28.12.2024 1.36
8.18% EXIM- 07.12.2025 1.33
9.3434% Mahindra and Mahindra Financial Services Ltd- 17.03.
0.78
7.20% PGC - 09.08.2027 0.71
Others 25.81
MMI 2.53
NCA 2.06
Portfolio
INDIVIDUAL FUNDKOTAK PENSION BOND FUND(ULIF-017-15/04/04-PNBNDFND-107)
5,038
106
Debt NCA
52.78
43.86
2.58 0.78 Govt & GovtGuaranteed Bonds
AAA
TREPS & MutualFund Investments
AA+
2.06
3.00
6.96
13.60
26.79
47.58
NCA
Wholesale trade, exceptof motor vehicles and
motorcycles
Electricity, gas, steamand air conditioning
supply
State Development Loan
Govt. of India
Financial and insuranceactivities
AS ON 30th NOVEMBER 2018

Market Outlook Fund Performance Contents Individual Funds Group Funds
Investment ObjectiveAims to preserve your capital and minimize your downside risk, with investment in debt and government instruments.
Debt Ratings Profile (%)
AUM (in Lakhs)
Sector Allocation as per NIC 2008 % to Fund**
**NIC 2008 - Industrial sector as defined under National Industrial Classification 2008.
MONTHLY UPDATE DECEMBER 2018 | (based on last business day) 39
PensionGilt Fund
(%)
Benchmark (%)
1 month 2.8 2.1
3 months 4.6 4.3
6 months 5.9 5.7
1 year 5.0 5.8
2 years 3.1 4.3
3 years 7.7 8.1
4 years 8.1 8.5
5 years 9.5 9.4
6 years 8.4 8.7
7 years 9.0 9.2
10 years 8.1 8.1
Inception 7.5 7.5
Past performance is not necessarily indicative of future performance
Approved (%) Actual (%)
Gsec 80 - 100 90
MMI /Others
00 - 40 10
Date of Inception
AUM (in Lakhs)
NAV
Fund Manager
Benchmark Details
Modified Duration
Asset Allocation
Performance Meter
27th June 2003
685.25
30.5036
Debt : KunalShah
Equity - 0% (NA);Debt - 100% (IBEX)
Debt & MoneyMarket Instruments : 5.83
Holdings % to Fund
G-Sec 89.99
7.72% GOI - 26.10.2055 15.56
7.17% GOI - 08.01.2028 7.78
7.06% GOI - 10.10.2046 5.96
8.13% GOI - 22.06.2045 5.47
8.01% RJ SPL SDL - 23.06.2020 4.94
8.99% MP SDL - 07.03.2022 3.37
8.58% GJ SDL - 31.10.2028 3.35
8.63% MH SDL - 09.01.2023 3.15
9.11% MP SDL - 28.05.2024 3.01
8.15% TN SDL -09.05.2028 3.01
Others 34.38
MMI 8.75
NCA 1.26
Portfolio
INDIVIDUAL FUNDKOTAK PENSION GILT FUND(ULIF-008-27/06/03-PNGLTFND-107)
677
9
Debt NCA
91.14
8.86
Govt & GovtGuaranteed Bonds
TREPS & MutualFund Investments
1.26
8.75
43.56
46.43
NCA
Financial and insuranceactivities
Govt. of India
State Development Loan
AS ON 30th NOVEMBER 2018

Market Outlook Fund Performance Contents Individual Funds Group Funds
Investment ObjectiveAims to preserve capital and minimize downside risk, with investment in debt and government instruments.
Debt Ratings Profile (%)
AUM (in Lakhs)
Sector Allocation as per NIC 2008 % to Fund**
**NIC 2008 - Industrial sector as defined under National Industrial Classification 2008.
MONTHLY UPDATE DECEMBER 2018 | (based on last business day) 40
PensionFloating Rate
Fund (%)
Benchmark (%)
1 month 1.2 0.6
3 months 2.3 1.9
6 months 3.9 3.8
1 year 4.6 7.4
2 years 4.9 7.0
3 years 6.3 7.2
4 years 6.6 7.5
5 years 7.4 7.9
6 years 8.0 8.0
7 years 8.0 8.1
10 years 7.5 7.5
Inception 7.4 7.2
Past performance is not necessarily indicative of future performance
Approved (%) Actual (%)
Gsec 00 - 75 45
Debt 25 - 100 35
MMI /Others
00 - 40 21
Date of Inception
AUM (in Lakhs)
NAV
Fund Manager
Benchmark Details
Modified Duration
Asset Allocation
Performance Meter
07th December 2004
231.15
27.0414
Debt : KunalShah
Equity - 0% (NA);Debt - 100% (CRISIL Liquid)
Debt & MoneyMarket Instruments : 2.14
Holdings % to Fund
G-Sec 44.65
9.37% MAH SDL - 04.12.2023 8.47
8.92% RJ SDL - 21.11.2022 5.33
8.38% MAH SDL - 25.03.2020 3.27
8.68% GJ SDL - 06.02.2023 2.99
8.28% TN SDL - 09.09.2019 2.57
8.23% GJ SDL - 07.10.2019 2.39
8.85% TN SDL - 17.10.2022 2.36
9.65% TN SDL - 12.03.2024 2.19
8.51% PN SDL - 10.04.2023 2.17
8.30% Fertilizer Co GOI - 07.12.23 1.76
Others 11.14
Corporate Debt 34.65
FRB G - 21.12.2020 26.02
Shriram Transport Finance Co Ltd Floater - 19.07.19
8.63
MMI 14.86
NCA 5.84
Portfolio
INDIVIDUAL FUNDKOTAK PENSION FLOATING RATE FUND(ULIF-022-07/12/04-PNFLTRFND-107)
218
13
Debt NCA
75.05
9.17
8.906.89 Govt & Govt
Guaranteed Bonds
AA+
A1+
TREPS & MutualFund Investments
5.84
23.49
31.86
38.81
NCA
Financial and insuranceactivities
Govt. of India
State Development Loan
AS ON 30th NOVEMBER 2018

Market Outlook Fund Performance Contents Individual Funds Group Funds
Investment ObjectiveAims to protect your capital and not have downside risks
Debt Ratings Profile (%)
AUM (in Lakhs)
Sector Allocation as per NIC 2008 % to Fund**
**NIC 2008 - Industrial sector as defined under National Industrial Classification 2008.
MONTHLY UPDATE DECEMBER 2018 | (based on last business day) 41
PensionMoneyMarket
Fund II (%)
Benchmark (%)
1 month 0.6 0.6
3 months 1.7 1.9
6 months 3.3 3.8
1 year 6.4 7.4
2 years 6.5 7.0
3 years 6.8 7.2
4 years 7.2 7.5
5 years 7.5 7.9
6 years 7.7 8.0
7 years 7.9 8.1
10 years n.a n.a
Inception 7.5 7.8
Past performance is not necessarily indicative of future performance
Approved (%) Actual (%)
MMI /Others
100 100
Date of Inception
AUM (in Lakhs)
NAV
Fund Manager
Benchmark Details
Modified Duration
Asset Allocation
Performance Meter
28th December 2009
913.30
19.0844
Debt : KunalShah
Equity - 0% (NA);Debt - 100% (CRISIL Liquid)
Debt & MoneyMarket Instruments : 0.49
Holdings % to Fund
MMI 99.55
NCA 0.454
Portfolio
INDIVIDUAL FUNDPENSION MONEY MARKET FUND II(ULIF-039-28/12/09-PNMNMKFND-107)
909
4.15
Debt NCA
62.39
32.66
4.95A1+
Govt & GovtGuaranteed Bonds
TREPS & MutualFund Investments
0.45
8.06
32.52
58.97
NCA
Mfg of coke andrefined petroleum
products
Govt. of India
Financial andinsurance activities
AS ON 30th NOVEMBER 2018

Market Outlook Fund Performance Contents Individual Funds Group Funds
Investment ObjectiveAims for a high level of capital growth by holding a significant portion in equities. May experience high levels of shorter term volatility (downside risk).
Debt Ratings Profile (%)
AUM (in Lakhs)
Sector Allocation as per NIC 2008 % to Fund**
**NIC 2008 - Industrial sector as defined under National Industrial Classification 2008.
MONTHLY UPDATE DECEMBER 2018 | (based on last business day) 42
KotakAdvantageMultiplier Fund II (%)
Benchmark (%)
1 month 1.3 3.3
3 months 2.0 -2.1
6 months 3.3 2.9
1 year 2.2 5.3
2 years 2.4 9.4
3 years 2.9 9.5
4 years 3.5 7.2
5 years 4.2 10.7
6 years 4.2 9.7
7 years 4.8 10.6
10 years 5.7 11.7
Inception 4.8 8.9
Past performance is not necessarily indicative of future performance
Approved (%) Actual (%)
Equity 00 - 100 -
Gsec / Debt
00 - 100 88
MMI /Others
00 - 40 12
Date of Inception
AUM (in Lakhs)
NAV
Fund Manager
Benchmark Details
Modified Duration
Asset Allocation
Performance Meter
21st April 2006
0.41
18.0700
Equity : Rohit Agarwal Debt : KunalShah
Equity - 50% (Nifty);Debt - 50% (CRISIL Bond)
Debt & MoneyMarket Instruments : 2.42
Holdings % to Fund
G-Sec 88.26
8.56% TN SDL - 22.06.2021 80.08
9.20% GOI - 30.09.2030 8.18
NCA 11.74
Portfolio
INDIVIDUAL FUNDKOTAK ADVANTAGE MULTIPLIER FUND II(ULIF-026-21/04/06-ADVMULFND2-107)
0.36
0.05
Debt NCA
100.00
Govt & GovtGuaranteed Bonds
8.18
11.74
80.08
Govt. of India
NCA
State Development Loan
AS ON 30th NOVEMBER 2018

Market Outlook Fund Performance Contents Individual Funds Group Funds
Investment ObjectiveAims to provide secure returns to policies in the discontinued state, by investing in low- risk debt instruments.
Debt Ratings Profile (%)
AUM (in Lakhs)
Sector Allocation as per NIC 2008 % to Fund**
**NIC 2008 - Industrial sector as defined under National Industrial Classification 2008.
MONTHLY UPDATE DECEMBER 2018 | (based on last business day) 43
DiscontinuedPolicy Fund
(%)
Benchmark (%)
1 month 0.5 0.7
3 months 1.5 1.9
6 months 3.1 3.8
1 year 6.1 7.5
2 years 6.0 7.0
3 years 6.3 7.2
4 years 6.7 7.5
5 years 7.1 7.9
6 years 7.3 8.0
7 years 7.7 8.1
10 years n.a n.a
Inception 7.6 8.1
Past performance is not necessarily indicative of future performance
Approved (%) Actual (%)
Gsec 60 - 100 67
MMI /Others
00 - 40 33
Date of Inception
AUM (in Lakhs)
NAV
Fund Manager
Benchmark Details
Modified Duration
Asset Allocation
Performance Meter
23rd March 2011
23,362.60
17.6100
Debt : KunalShah
Debt - 100% (CRISIL Liquid)
Debt & MoneyMarket Instruments : 0.21
Holdings % to Fund
G-Sec 67.28
364 Days T Bill - 03.01.2019 31.92
364 Days T Bill - 17.01.2019 21.65
364 Days T Bill - 13.06.2019 9.08
364 Days T Bill - 10.10.2019 4.63
MMI 32.70
NCA 0.0196
Portfolio
INDIVIDUAL FUNDDISCONTINUED POLICY FUND(ULIF-050-23/03/11-DISPOLFND-107)
23,358
4.58
Debt NCA
67.29
17.14
15.57 Govt & GovtGuaranteed Bonds
TREPS & MutualFund Investments
A1+
0.02
6.72
25.98
67.28
NCA
Mfg of coke andrefined petroleum
products
Financial andinsurance activities
Govt. of India
AS ON 30th NOVEMBER 2018

Market Outlook Fund Performance Contents Individual Funds Group Funds
MONTHLY UPDATE DECEMBER 2018 | (based on last business day) 44
GROUP FUNDS
KOTAK GROUPDYNAMIC FLOOR FUND
KOTAK GROUPBALANCED FUND
KOTAK GROUP BOND FUND
KOTAK GROUP GILT FUND
KOTAK GROUPFLOATING RATE FUND
KOTAK GROUP MONEY MARKET FUND
KOTAK GROUP SECURE CAPITAL FUND
KOTAK GROUP SHORT TERM BOND FUND
KOTAK GROUPPRUDENT FUND
AS ON 30th NOVEMBER 2018

Market Outlook Fund Performance Contents Individual Funds Group Funds
MONTHLY UPDATE DECEMBER 2018 | (based on last business day) 45
GROUP FUNDKOTAK GROUP DYNAMIC FLOOR FUND(ULGF-015-07/01/10-DYFLRFND-107)
AS ON 30th NOVEMBER 2018
Investment ObjectiveAims to provide stable long term inflation beating growth over the medium to longer term and defend capital against short term capital shocks.Is likely to out-perform traditional balanced or equity funds during sideways or falling markets and shadow the rising equity markets.
Debt Ratings Profile (%)
AUM (in Lakhs)
Sector Allocation as per NIC 2008 % to Fund**
**NIC 2008 - Industrial sector as defined under National Industrial Classification 2008.
Kotak Group Dynamic Floor
Fund (%)
Benchmark (%)
1 month 2.7 2.7
3 months -0.2 -0.1
6 months 2.7 3.5
1 year 2.8 4.7
2 years 5.7 7.2
3 years 8.1 8.7
4 years 5.5 7.5
5 years 8.9 10.1
6 years 7.4 9.2
7 years 8.3 9.8
10 years n.a n.a
Inception 6.8 8.3
Past performance is not necessarily indicative of future performance
Approved (%) Actual (%)
Equity 00 - 60 29
Gsec / Debt
00 - 100 62
MMI /Others
00 - 40 9
Date of Inception
AUM (in Lakhs)
NAV
Fund Manager
Benchmark Details
Modified Duration
Asset Allocation
Performance Meter
07th January 2010
369.40
29.0067
Equity: Rohit Agarwal Debt : KunalShah
Equity - 30% (Nifty)Debt - 70% (CRISIL Bond)
Debt & MoneyMarket Instruments : 5.48
Holdings % to Fund
EQUITY 28.91
Reliance Industries Ltd 2.00
Infosys Ltd 1.93
ICICI Bank Ltd 1.76
HDFC Bank Ltd 1.64
I T C Ltd 1.32
KotakBankingETF-DividendPayoutOption 1.19
Mahindra & Mahindra Ltd 1.09
Larsen And Toubro Ltd 1.08
Reliance ETF Bank Bees 1.07
IndusInd Bank Ltd 0.89
Axis Bank Ltd 0.87
Hindustan Unilever Ltd 0.85
Tech Mahindra Ltd 0.78
Britannia Industries Ltd 0.69
HCL Technologies Ltd 0.59
Aurobindo Pharma Ltd 0.56
SBI ETF Nifty Bank 0.54
Bata India Ltd 0.54
Maruti Suzuki India Ltd 0.54
Sun Pharmaceuticals Ltd 0.53
Others 8.46
G-Sec 38.35
7.17% GOI - 08.01.2028 3.75
8.13% GOI - 22.06.2045 3.68
7.72% GOI - 26.10.2055 3.65
9.20% GOI - 30.09.2030 3.00
8.70% REC - 28.09.2028 2.75
8.15% GOI FCI Bonds - 16.10.22 2.75
8.56% NABARD - 14.11.2028 2.74
8.47% NABARD - 31.08.2033 2.72
7.06% GOI - 10.10.2046 2.68
8.58% GJ SDL - 31.10.2028 2.13
Others 8.51
Corporate Debt 23.73
9.30% PGC - 28.06.2023 3.48
8.85% PGC - 19.10.2021 3.43
8.90% PFC - 18.03.2028 2.74
8.63% REC - 25.08.2028 2.71
9.10% Shriram Transport Finance Co Ltd 12.07.2021
2.65
7.4805%KotakMahindraPrimeLtd-11.06.2020 2.64
7.85% PFC - 03.04.2028 2.58
Others 3.50
MMI 8.12
NCA 0.90
Portfolio
107
259
3
Equity Debt NCA
7.61
1.09
1.32
1.83
2.00
2.11
3.57
7.18
8.21
21.93
43.15
Others
Mfg of pharmaceuticals,medicinal chemical &
botanical products
Mfg of tobacco products
Mfg of chemicals andchemical products
Mfg of coke and refinedpetroleum products
Mfg of motor vehicles,trailers and semi-trailers
Computer programming,consultancy and related
activities
Electricity, gas, steamand air conditioning
supply
State Development Loan
Govt. of India
Financial and insuranceactivities
54.63
28.70
11.573.78 1.33 Govt & Govt
Guaranteed Bonds
AAA
TREPS & MutualFund Investments
AA+
Fixed Deposit

Market Outlook Fund Performance Contents Individual Funds Group Funds
MONTHLY UPDATE DECEMBER 2018 | (based on last business day) 46
GROUP FUNDKOTAK GROUP BALANCED FUND(ULGF-003-27/06/03-BALFND-107)
AS ON 30th NOVEMBER 2018
Investment ObjectiveAims for moderate growth by holding a diversified mix of equities and fixed interest instruments. May also be susceptible to moderate levels of shorter-term volatility (downside risk).
Debt Ratings Profile (%)
AUM (in Lakhs)
Sector Allocation as per NIC 2008 % to Fund**
**NIC 2008 - Industrial sector as defined under National Industrial Classification 2008.
Kotak Group Balanced Fund (%)
Benchmark (%)
1 month 3.2 3.3
3 months -3.1 -3.4
6 months 1.3 2.2
1 year 2.3 4.0
2 years 8.7 10.3
3 years 9.4 9.9
4 years 8.4 7.3
5 years 12.7 11.3
6 years 11.4 10.2
7 years 12.2 11.2
10 years 12.6 11.7
Inception 13.0 11.6
Past performance is not necessarily indicative of future performance
Approved (%) Actual (%)
Equity 30 - 60 54
Gsec / Debt
20 - 70 42
MMI /Others
00 - 40 4
Date of Inception
AUM (in Lakhs)
NAV
Fund Manager
Benchmark Details
Modified Duration
Asset Allocation
Performance Meter
27th June 2003
77,071.07
66.2883
Equity: Rohit Agarwal Debt : KunalShah
Equity - 60% (BSE 100)Debt - 40% (CRISIL Bond)
Debt & MoneyMarket Instruments : 4.98
Holdings % to Fund
EQUITY 53.85
Reliance Industries Ltd 3.81
Infosys Ltd 3.60
ICICI Bank Ltd 3.30
HDFC Bank Ltd 2.96
ITC Ltd 2.56
KotakBankingETF-DividendPayoutOption 2.11
Mahindra & Mahindra Ltd 2.04
Reliance ETF Bank Bees 1.93
Larsen And Toubro Ltd 1.93
Axis Bank Ltd 1.79
IndusInd Bank Ltd 1.70
Hindustan Unilever Ltd 1.45
Tech Mahindra Ltd 1.44
Britannia Industries Ltd 1.16
HCL Technologies Ltd 1.09
State Bank of India 1.07
Aurobindo Pharma Ltd 1.04
SBI ETF Nifty Bank 1.03
Bata India Ltd 1.02
Maruti Suzuki India Ltd 1.01
Others 15.83
G-Sec 19.88
7.17% GOI - 08.01.2028 2.09
7.72% GOI - 26.10.2055 2.07
8.13% GOI - 22.06.2045 2.07
8.70% REC - 28.09.2028 1.50
7.06% GOI - 10.10.2046 1.50
8.58% GJ SDL - 31.10.2028 1.17
8.15% TN SDL -09.05.2028 1.05
8.47% NABARD - 31.08.2033 1.02
8.15% GOI FCI Bonds - 16.10.22 0.70
8.62% HR SDL 03.09.2028 0.52
Others 6.20
Corporate Debt 21.77
7.4805%KotakMahindraPrimeLtd-11.06.2020 2.51
9.05% HDFC - 16.10.2028 1.18
9.05% HDFC - 20.11.2023 1.17
8.56% REC - 29.11.2028 1.03
8.3750% EXIM- 24.07.2025 1.03
8.65% PFC - 28.12.2024 0.78
L&T Finance Ltd NSE Mibor +2% - 05.08.2019 0.71
7.62% EXIM- 01.09.2026 0.68
Shriram Transport Finance Co Ltd Floater - 19.07.19
0.67
7.85% PFC - 03.04.2028 0.56
Others 11.45
MMI 3.89
NCA 0.60
Portfolio
41,507 35,099
466
Equity Debt NCA
13.55
2.04
2.56
2.67
3.35
3.81
4.01
6.05
6.66
9.72
45.57
Others
Mfg of pharmaceuticals,medicinal chemical &
botanical products
Mfg of tobacco products
Electricity, gas, steamand air conditioning
supply
Mfg of chemicals andchemical products
Mfg of coke and refinedpetroleum products
Mfg of motor vehicles,trailers and semi-trailers
State Development Loan
Computer programming,consultancy and related
activities
Govt. of India
Financial and insuranceactivities
45.81
43.66
7.431.92
1.100.07
AAA
Govt & GovtGuaranteed BondsTREPS & MutualFund InvestmentsAA+
A1+
Fixed Deposit

Market Outlook Fund Performance Contents Individual Funds Group Funds
MONTHLY UPDATE DECEMBER 2018 | (based on last business day) 47
GROUP FUNDKOTAK GROUP BOND FUND(ULGF-004-15/04/04-BNDFND-107)
AS ON 30th NOVEMBER 2018
Investment ObjectiveReturns will be in line with those of fixed interest instruments, and may provide little protection against unexpected inflation increases. Will pre-serve capital and minimize downside risk, with investment in debt and government instruments.
Debt Ratings Profile (%)
AUM (in Lakhs)
Sector Allocation as per NIC 2008 % to Fund**
**NIC 2008 - Industrial sector as defined under National Industrial Classification 2008.
Kotak Group Bond Fund
(%)
Benchmark (%)
1 month 2.3 1.9
3 months 3.6 2.8
6 months 5.1 4.3
1 year 4.2 3.8
2 years 3.4 3.8
3 years 7.7 7.4
4 years 8.0 7.9
5 years 9.4 9.0
6 years 8.5 8.2
7 years 9.2 8.4
10 years 9.9 7.9
Inception 8.8 6.5
Past performance is not necessarily indicative of future performance
Approved (%) Actual (%)
Gsec 00 - 75 49
Debt 25 - 100 48
MMI /Others
00 - 40 4
Date of Inception
AUM (in Lakhs)
NAV
Fund Manager
Benchmark Details
Modified Duration
Asset Allocation
Performance Meter
15th April 2004
1,28,116.84
34.5331
Debt : KunalShah
Equity - 0% (NA)Debt - 100% (CRISIL Bond)
Debt & MoneyMarket Instruments : 6.05
Holdings % to Fund
G-Sec 48.73
7.17% GOI - 08.01.2028 5.89
8.13% GOI - 22.06.2045 5.74
7.72% GOI - 26.10.2055 5.72
8.70% REC - 28.09.2028 4.36
7.06% GOI - 10.10.2046 4.20
8.58% GJ SDL - 31.10.2028 3.36
8.15% TN SDL -09.05.2028 3.04
8.47% NABARD - 31.08.2033 2.83
8.62% HR SDL 03.09.2028 1.45
8.20% NABARD - 09.03.2028 1.17
Others 10.98
Corporate Debt 47.75
7.4805%KotakMahindraPrimeLtd-11.06.2020 3.45
8.56% REC - 29.11.2028 2.87
9.05% HDFC - 20.11.2023 2.59
9.05% HDFC - 16.10.2028 2.37
8.3750% EXIM- 24.07.2025 2.15
7.62% EXIM- 01.09.2026 2.06
7.85% PFC - 03.04.2028 1.53
8.65% PFC - 28.12.2024 1.35
11.08% HDFC - 13.04.2027 Set Down 13.04.20 - 7.78%
1.20
8.18% EXIM- 07.12.2025 1.18
Others 26.99
MMI 1.89
NCA 1.63
Portfolio
1,26,027
2,090
Debt NCA
0.08
1.63
2.48
6.07
12.72
24.33
52.70
Mfg of basic metals
NCA
Wholesale trade, exceptof motor vehicles and
motorcycles
Electricity, gas, steamand air conditioning
supply
State Development Loan
Govt. of India
Financial and insuranceactivities
49.54
47.78
1.92
0.680.08
Govt & GovtGuaranteed Bonds
AAA
TREPS & MutualFund Investments
AA+
AA-

Market Outlook Fund Performance Contents Individual Funds Group Funds
MONTHLY UPDATE DECEMBER 2018 | (based on last business day) 48
GROUP FUNDKOTAK GROUP GILT FUND(ULGF-002-27/06/03-GLTFND-107)
AS ON 30th NOVEMBER 2018
Investment ObjectiveReturns will be in line with those of fixed interest instruments, and may provide little protection against unexpected inflation increases. Will pre-serve capital and minimize downside risk, with investment in debt and government instruments.
Debt Ratings Profile (%)
AUM (in Lakhs)
Sector Allocation as per NIC 2008 % to Fund**
**NIC 2008 - Industrial sector as defined under National Industrial Classification 2008.
Kotak Group Gilt Fund
(%)
Benchmark (%)
1 month 2.8 2.1
3 months 4.6 4.3
6 months 5.9 5.7
1 year 5.1 5.8
2 years 3.2 4.3
3 years 7.9 8.1
4 years 8.3 8.5
5 years 9.7 9.4
6 years 8.6 8.7
7 years 9.2 9.2
10 years 8.4 8.1
Inception 7.6 7.5
Past performance is not necessarily indicative of future performance
Approved (%) Actual (%)
Gsec 80 - 100 88
MMI /Others
00 - 20 12
Date of Inception
AUM (in Lakhs)
NAV
Fund Manager
Benchmark Details
Modified Duration
Asset Allocation
Performance Meter
27th June 2003
5,073.43
31.1703
Debt : KunalShah
Equity - 0% (NA)Debt - 100% (IBEX)
Debt & MoneyMarket Instruments : 5.88
Holdings % to Fund
G-Sec 88.36
7.72% GOI - 26.10.2055 14.64
7.17% GOI - 08.01.2028 7.67
7.06% GOI - 10.10.2046 5.75
8.13% GOI - 22.06.2045 5.47
8.62% HR SDL 03.09.2028 4.56
8.01% RJ SPL SDL - 23.06.2020 4.30
8.18% HR Uday SDL 15.06.2023 3.94
9.29% PN SDL - 09.10.2023 3.26
8.58% GJ SDL - 31.10.2028 3.08
6.65% Fertilizer Co GOI - 29.01.23 2.73
Others 32.96
MMI 10.74
NCA 0.90
Portfolio
5,028
46
Debt NCA
0.90
10.74
44.14
44.22
NCA
Financial and insuranceactivities
State Development Loan
Govt. of India
89.16
10.84
Govt & GovtGuaranteed Bonds
TREPS & MutualFund Investments

Market Outlook Fund Performance Contents Individual Funds Group Funds
MONTHLY UPDATE DECEMBER 2018 | (based on last business day) 49
GROUP FUNDKOTAK GROUP FLOATING RATE FUND(ULGF-005-07/12/04-FLTRFND-107)
AS ON 30th NOVEMBER 2018
Investment ObjectiveReturns will be in line with those of fixed interest instruments, and may provide little protection against unexpected inflation increases Will preserve capital and minimize downside risk, with investment in debt and government instruments.
Debt Ratings Profile (%)
AUM (in Lakhs)
Sector Allocation as per NIC 2008 % to Fund**
**NIC 2008 - Industrial sector as defined under National Industrial Classification 2008.
Kotak Group Floating Rate
Fund (%)
Benchmark (%)
1 month 1.1 0.6
3 months 2.3 1.9
6 months 4.1 3.8
1 year 5.1 7.4
2 years 5.3 7.0
3 years 6.7 7.2
4 years 7.1 7.5
5 years 7.9 7.9
6 years 8.4 8.0
7 years 8.5 8.1
10 years 8.0 7.5
Inception 7.8 7.2
Past performance is not necessarily indicative of future performance
Approved (%) Actual (%)
Gsec 00 - 75 44
Debt 25 - 100 33
MMI /Others
00 - 40 22
Date of Inception
AUM (in Lakhs)
NAV
Fund Manager
Benchmark Details
Modified Duration
Asset Allocation
Performance Meter
07th December 2004
12,203.84
28.5114
Debt : KunalShah
Equity - 0% (NA)Debt - 100% (CRISIL Liquid)
Debt & MoneyMarket Instruments : 2.01
Holdings % to Fund
G-Sec 44.17
9.37% MAH SDL - 04.12.2023 11.76
9.12% GJ SDL - 23.05.2022 7.60
8.92% RJ SDL - 21.11.2022 3.37
8.15% GOI FCI Bonds - 16.10.22 2.99
8.14% MH SDL -23.09.2019 2.47
8.38% MAH SDL - 25.03.2020 1.69
8.62% MAH SDL - 20.02.2023 1.67
8.30% MH SDL -09.09.2019 1.65
8.84% PN SDL - 11.06.2024 1.53
7.72% GOI - 26.10.2055 1.38
Others 8.05
Corporate Debt 33.46
FRB G - 21.12.2020 17.38
Shriram Transport Finance Co Ltd Floater - 19.07.19
8.09
L&T Finance Ltd NSE Mibor +2% - 05.08.2019 7.99
MMI 19.22
NCA 3.15
Portfolio
11,819
384
Debt NCA
3.15
25.07
35.30
36.47
NCA
Govt. of India
Financial and insuranceactivities
State Development Loan
63.55
11.59
8.36
8.26
8.25 Govt & GovtGuaranteed Bonds
TREPS & MutualFund Investments
AA+
A1+
AAA

Market Outlook Fund Performance Contents Individual Funds Group Funds
MONTHLY UPDATE DECEMBER 2018 | (based on last business day) 50
GROUP FUNDKOTAK GROUP MONEY MARKET FUND(ULGF-001-27/06/03-MNMKFND-107)
AS ON 30th NOVEMBER 2018
Investment ObjectiveWill protect capital and not have downside risks.
Debt Ratings Profile (%)
AUM (in Lakhs)
Sector Allocation as per NIC 2008 % to Fund**
**NIC 2008 - Industrial sector as defined under National Industrial Classification 2008.
Kotak Group Money
Market Fund (%)
Benchmark (%)
1 month 0.4 0.7
3 months 1.2 1.9
6 months 2.5 3.9
1 year 4.9 7.5
2 years 4.8 7.0
3 years 4.7 7.2
4 years 5.6 7.5
5 years 6.2 7.9
6 years n.a n.a
7 years n.a n.a
10 years n.a n.a
Inception 6.5 8.1
Past performance is not necessarily indicative of future performance
Approved (%) Actual (%)
MMI /Others
100 100
Date of Inception
AUM (in Lakhs)
NAV
Fund Manager
Benchmark Details
Modified Duration
Asset Allocation
Performance Meter
12th August 2013
450.19
13.9556
Debt : KunalShah
Equity - 0% (NA)Debt - 100% (CRISIL Liquid)
Debt & MoneyMarket Instruments : 0.88
Holdings % to Fund
MMI 99.51
NCA 0.49
Portfolio
448
2.19
Debt NCA
0.49
5.55
93.96
NCA
Financial and insuranceactivities
Govt. of India
94.42
5.58
Govt & GovtGuaranteed Bonds
TREPS & MutualFund Investments

Market Outlook Fund Performance Contents Individual Funds Group Funds
MONTHLY UPDATE DECEMBER 2018 | (based on last business day) 51
GROUP FUNDKOTAK GROUP SECURE CAPITAL FUND(ULGF-016-12/04/11-SECCAPFND-107)
AS ON 30th NOVEMBER 2018
Investment ObjectiveThe portfolio will consist of highly rated debt instruments including corporate debt and infrastructure debt assets as defined in the IRDA regula-tions, Government securities and short term investments.
Debt Ratings Profile (%)
AUM (in Lakhs)
Sector Allocation as per NIC 2008 % to Fund**
**NIC 2008 - Industrial sector as defined under National Industrial Classification 2008.
Kotak Group Secure Capital
Fund (%)
Benchmark (%)
1 month 2.3 1.9
3 months 3.6 2.8
6 months 5.0 4.3
1 year 4.2 3.8
2 years 3.4 3.8
3 years 7.5 7.4
4 years 7.8 7.9
5 years 9.2 9.0
6 years 8.3 8.2
7 years 9.0 8.4
10 years n.a n.a
Inception 8.8 8.2
Past performance is not necessarily indicative of future performance
Approved (%) Actual (%)
Gsec 00 - 75 50
Debt 25 - 100 46
MMI /Others
00 - 40 4
Date of Inception
AUM (in Lakhs)
NAV
Fund Manager
Benchmark Details
Modified Duration
Asset Allocation
Performance Meter
12th April 2011
29,329.14
19.0910
Debt : KunalShah
Debt - 100% (CRISIL Bond)
Debt & MoneyMarket Instruments : 5.84
Holdings % to Fund
G-Sec 50.38
7.17% GOI - 08.01.2028 5.87
8.13% GOI - 22.06.2045 5.75
7.72% GOI - 26.10.2055 5.62
8.70% REC - 28.09.2028 4.33
7.06% GOI - 10.10.2046 4.18
8.58% GJ SDL - 31.10.2028 3.35
8.47% NABARD - 31.08.2033 2.84
8.15% TN SDL -09.05.2028 2.39
8.62% HR SDL 03.09.2028 1.45
8.20% NABARD - 09.03.2028 1.18
Others 13.42
Corporate Debt 45.95
7.4805%KotakMahindraPrimeLtd-11.06.2020 3.33
8.56% REC - 29.11.2028 2.85
9.05% HDFC - 16.10.2028 1.73
8.3750% EXIM- 24.07.2025 1.69
7.85% PFC - 03.04.2028 1.53
11.08% HDFC - 13.04.2027 Set Down 13.04.20 - 7.78%
1.05
8.65% PFC - 28.12.2024 0.92
9.3434% Mahindra and Mahindra Financial Services Ltd- 17.03.
0.82
9.09% IRFC - 29.03.2026 0.71
10.08% IOT Utkal Energy Services Limited - 20.03.2024
0.66
Others 30.67
MMI 2.18
NCA 1.49
Portfolio
28,891
438
Debt NCA
1.49
2.31
8.10
13.43
25.48
49.19
NCA
Wholesale trade, exceptof motor vehicles and
motorcycles
Electricity, gas, steamand air conditioning
supply
State Development Loan
Govt. of India
Financial and insuranceactivities
51.14
46.00
2.210.64
Govt & GovtGuaranteed Bonds
AAA
TREPS & MutualFund Investments
AA+

Market Outlook Fund Performance Contents Individual Funds Group Funds
MONTHLY UPDATE DECEMBER 2018 | (based on last business day) 52
GROUP FUNDKOTAK GROUP SHORT TERM BOND FUND(ULGF-018-18/12/13-SHTRMBND-107)
AS ON 30th NOVEMBER 2018
Investment ObjectiveWill generate stable returns through investments in a suitable mix of debt and money market instruments.
Debt Ratings Profile (%)
AUM (in Lakhs)
Sector Allocation as per NIC 2008 % to Fund**
**NIC 2008 - Industrial sector as defined under National Industrial Classification 2008.
Kotak Group Short Term Bond Fund
(%)
Benchmark (%)
1 month 1.2 1.2
3 months 2.3 2.0
6 months 3.9 4.0
1 year 4.7 5.6
2 years 5.2 5.8
3 years 6.8 7.4
4 years n.a n.a
5 years n.a n.a
6 years n.a n.a
7 years n.a n.a
10 years n.a n.a
Inception 6.7 7.3
Past performance is not necessarily indicative of future performance
Approved (%) Actual (%)
Gsec 00 - 50 29
Debt 25 - 75 58
MMI /Others
10 - 75 13
Date of Inception
AUM (in Lakhs)
NAV
Fund Manager
Benchmark Details
Modified Duration
Asset Allocation
19th October 2015
9,200.66
12.2442
Debt : KunalShah
CRISIL Short Term Bond Fund Index
Debt & MoneyMarket Instruments : 2.24
Holdings % to Fund
G-Sec 29.07
8.65% RJ SDL - 03.10.2028 5.52
8.15% RJ SPL SDL - 23.06.2021 5.47
9.50% GJ SDL - 11.09.2023 2.29
8.09% GJ SDL - 25.05.2020 2.19
6.65% Fertilizer Co GOI - 29.01.23 1.57
9.69% PN SDL - 12.02.2024 1.15
9.17% PN SDL - 11.04.2022 1.12
8.90%KASDL-19.12.2022 1.12
8.09% TN SDL - 09.06.2020 1.09
9.25% RJ SDL - 09.10.2023 0.85
Others 6.71
Corporate Debt 58.34
8.95% Bajaj Finance Ltd - 10.04.2020 7.59
9.30% PGC - 28.06.2020 5.50
9.05% HDFC - 20.11.2023 5.47
8.60% LIC Housing Finance - 22.07.2020 5.42
08.48% Mahindra and Mahindra Financial Services Ltd- 26.06.2
5.37
8.80% REC - 17.11.2019 4.36
7.4805%KotakMahindraPrimeLtd-11.06.2020 3.18
8.55% IRFC - 15.01.2019 2.83
8.90% PGCIL - 25.02.2021 2.20
7.74% IRFC - 22.12.2020 1.94
Others 14.49
MMI 10.01
NCA 2.59
Portfolio
8,963
238
Debt NCA
2.13
2.59
3.51
8.24
25.55
57.97
Mfg of coke and refinedpetroleum products
NCA
Govt. of India
Electricity, gas, steamand air conditioning
supply
State Development Loan
Financial and insuranceactivities
59.88
29.84
7.43 2.84 AAA
Govt & GovtGuaranteed Bonds
A1+
TREPS & MutualFund Investments
Performance Meter

Market Outlook Fund Performance Contents Individual Funds Group Funds
MONTHLY UPDATE DECEMBER 2018 | (based on last business day) 53
GROUP FUNDKOTAK GROUP PRUDENT FUND(ULGF-019-04/07/17-KGPFFND-107)
AS ON 30th NOVEMBER 2018
Investment ObjectiveAims to provide enhanced long term returns by taking a moderate exposure to equity and equity related securities and active management of a fixed income portfolio.
Debt Ratings Profile (%)
AUM (in Lakhs)
Sector Allocation as per NIC 2008 % to Fund**
**NIC 2008 - Industrial sector as defined under National Industrial Classification 2008.
Kotak Group Prudent Fund
(%)
Benchmark (%)
1 month 2.8 2.4
3 months 2.1 0.8
6 months 4.9 3.8
1 year n.a n.a
2 years n.a n.a
3 years n.a n.a
4 years n.a n.a
5 years n.a n.a
6 years n.a n.a
7 years n.a n.a
10 years n.a n.a
Inception 4.9 3.8
Past performance is not necessarily indicative of future performance
Approved (%) Actual (%)
Equity 00 - 20 15
Gsec / Debt
40 - 100 66
MMI /Others
00 - 40 19
Date of Inception
AUM (in Lakhs)
NAV
Fund Manager
Benchmark Details
Modified Duration
Asset Allocation
1st June 2018
430.39
10.4905
Equity : Rohit AgarwalDebt : KunalShah
20% BSE 100 & 80% CRISIL Bond
Debt & MoneyMarket Instruments : 5.97
Holdings % to Fund
EQUITY 15.12
Reliance Industries Ltd 1.43
Infosys Ltd 1.29
ICICI Bank Ltd 1.09
HDFC Bank Ltd 1.02
KotakBankingETF-DividendPayoutOption 0.77
Larsen And Toubro Ltd 0.75
Axis Bank Ltd 0.65
IndusInd Bank Ltd 0.55
Tech Mahindra Ltd 0.53
ITC Ltd 0.50
Mahindra & Mahindra Ltd 0.43
SBI ETF Nifty Bank 0.42
State Bank of India 0.40
Hindustan Unilever Ltd 0.33
Mahindra & Mahindra Financial Services Ltd 0.30
Britannia Industries Ltd 0.25
HCL Technologies Ltd 0.25
Aurobindo Pharma Ltd 0.23
Bajaj Finance Ltd 0.22
Bata India Ltd 0.22
Others 3.49
G-Sec 52.28
7.72% GOI - 26.10.2055 21.75
8.70% REC - 28.09.2028 7.09
8.74% PN SDL - 14.12.2021 5.96
7.17% GOI - 08.01.2028 5.64
8.47% NABARD - 31.08.2033 4.66
8.20% NABARD - 16.03.2028 4.60
9.20% GOI - 30.09.2030 2.58
Corporate Debt 13.78
9.24% LIC Housing Finance - 30.09.2024 4.68
8.55% IRFC - 03.02.2020 4.67
7.85% PFC - 03.04.2028 4.43
MMI 17.07
NCA 1.76
Portfolio
65
358
8
Equity Debt NCA
2.71
0.50
0.73
0.75
0.85
1.43
1.76
2.22
5.96
35.43
47.67
Others
Mfg of tobacco products
Mfg of chemicals andchemical products
Civil engineering
Mfg of motor vehicles,trailers and semi-trailers
Mfg of coke and refinedpetroleum products
NCA
Computer programming,consultancy and related
activities
State Development Loan
Govt. of India
Financial and insuranceactivities
69.46
16.57
13.97Govt & GovtGuaranteed Bonds
AAA
TREPS & MutualFund Investments
Performance Meter

Market Outlook Fund Performance Contents Individual Funds Group Funds
MONTHLY UPDATE DECEMBER 2018 | (based on last business day) 54
The Break-up of Others is as given below
Equity Classic Opportunities Fund
Others 28.45Asian Paints Ltd 1.55GAIL (India) Ltd 1.43State Bank of India 1.38Bata India Ltd 1.30Ashok Leyland Ltd 1.21Petronet L N G Ltd 1.18Havells India Ltd 1.11Torrent Pharmaceuticals Ltd 1.04Sun Pharmaceuticals Ltd 1.03Shree Cement Ltd 1.03Mahindra & Mahindra Financial Services Ltd 1.02Reliance ETF Bank Bees 1.00Bharat Forge Ltd 0.90The Ramco Cements Ltd 0.88Ratnakar Bank Ltd 0.84Exide Industries Ltd 0.82Whirlpool of India Ltd 0.72Motherson Sumi Systems Ltd 0.71Bharat Petroleum Corporation Ltd 0.71Eicher Motors Ltd 0.71Future Retail Ltd 0.68Interglobe Aviation Ltd 0.67Titan Industries Ltd 0.66Odisha Cement Ltd 0.66AU Small Finance Bank Ltd 0.64ICICI Lombard General Insurance Company Ltd 0.63HDFC Asset Management Co Ltd 0.55Astral Poly Technik Ltd 0.54Schaeffler India Ltd 0.53Brigade Enterprises Ltd 0.49Container Corporation of India Ltd 0.48Tata Steel Ltd 0.45Jindal Steel and Power Ltd 0.45Somany Ceramics Ltd 0.29Sadbhav Engineering Ltd 0.156% Zee Entertainment Enterprises Ltd Pref Shares 0.01
Equity Dynamic Floor Fund II
Others 10.95Asian Paints Ltd 0.67Mahindra & Mahindra Financial Services Ltd 0.66State Bank of India 0.63Whirlpool of India Ltd 0.47Ratnakar Bank Ltd 0.43Zee Entertainment Enterprises Ltd 0.43The Ramco Cements Ltd 0.42Apollo Tyres Ltd 0.41Hindalco Industries Ltd 0.41Interglobe Aviation Ltd 0.39Tata Consultancy Services Ltd 0.38Bajaj Finance Ltd 0.37Havells India Ltd 0.36Supreme Industries Ltd 0.35Petronet L N G Ltd 0.35Bharat Forge Ltd 0.35Voltas Ltd 0.34Tata Power Company Ltd 0.33Vedanta Ltd 0.28Shree Cement Ltd 0.28Ashok Leyland Ltd 0.28Jindal Steel and Power Ltd 0.26Odisha Cement Ltd 0.26AU Small Finance Bank Ltd 0.26GlaxoSmithKlineConsumerHealthcareLtd 0.23Brigade Enterprises Ltd 0.23Coromandel International Ltd 0.21Aavas Financiers Ltd 0.16Astral Poly Technik Ltd 0.16Tata Steel Ltd 0.14Exide Industries Ltd 0.14Titan Industries Ltd 0.12Marico Ltd 0.12Somany Ceramics Ltd 0.08
Equity Frontline Equity Fund
Others 29.39SBI ETF Nifty Bank 1.74Asian Paints Ltd 1.70Mahindra & Mahindra Financial Services Ltd 1.43Exide Industries Ltd 1.30Ashok Leyland Ltd 1.16S R F Ltd 1.09Zee Entertainment Enterprises Ltd 1.07The Ramco Cements Ltd 1.06Apollo Tyres Ltd 1.04Whirlpool of India Ltd 1.03Hindalco Industries Ltd 1.02Interglobe Aviation Ltd 0.97Tata Consultancy Services Ltd 0.95Ratnakar Bank Ltd 0.94Bharat Forge Ltd 0.93Bajaj Finance Ltd 0.91Havells India Ltd 0.87Voltas Ltd 0.86Tata Power Company Ltd 0.85Supreme Industries Ltd 0.81Petronet L N G Ltd 0.80Vedanta Ltd 0.72AU Small Finance Bank Ltd 0.71Shree Cement Ltd 0.70Jindal Steel and Power Ltd 0.59Coromandel International Ltd 0.59Odisha Cement Ltd 0.58GlaxoSmithKlineConsumerHealthcareLtd 0.51Brigade Enterprises Ltd 0.51Marico Ltd 0.46Aavas Financiers Ltd 0.41Astral Poly Technik Ltd 0.36Tata Steel Ltd 0.30Titan Industries Ltd 0.22Somany Ceramics Ltd 0.196% Zee Entertainment Enterprises Ltd Pref Shares 0.01
Equity Balanced Fund
Others 15.80Sun Pharmaceuticals Ltd 0.99Asian Paints Ltd 0.94Mahindra & Mahindra Financial Services Ltd 0.91Apollo Tyres Ltd 0.62Zee Entertainment Enterprises Ltd 0.61S R F Ltd 0.60The Ramco Cements Ltd 0.59Ratnakar Bank Ltd 0.57Hindalco Industries Ltd 0.56Bharat Forge Ltd 0.55Bajaj Finance Ltd 0.55Interglobe Aviation Ltd 0.55Tata Consultancy Services Ltd 0.52Tata Power Company Ltd 0.50Havells India Ltd 0.49Whirlpool of India Ltd 0.46Supreme Industries Ltd 0.45Voltas Ltd 0.43Petronet L N G Ltd 0.43Marico Ltd 0.42Shree Cement Ltd 0.42Vedanta Ltd 0.41AU Small Finance Bank Ltd 0.40Ashok Leyland Ltd 0.40Odisha Cement Ltd 0.32Jindal Steel and Power Ltd 0.32Coromandel International Ltd 0.31GlaxoSmithKlineConsumerHealthcareLtd 0.25Aavas Financiers Ltd 0.23Tata Steel Ltd 0.20Brigade Enterprises Ltd 0.20Exide Industries Ltd 0.20Astral Poly Technik Ltd 0.20Titan Industries Ltd 0.12Somany Ceramics Ltd 0.096% Zee Entertainment Enterprises Ltd Pref Shares 0.003
ANNEXURE
AS ON 30th NOVEMBER 2018

Market Outlook Fund Performance Contents Individual Funds Group Funds
MONTHLY UPDATE DECEMBER 2018 | (based on last business day) 55
Equity Kotak Opportunities Fund
Others 29.38Asian Paints Ltd 1.64GAIL (India) Ltd 1.48State Bank of India 1.39Bata India Ltd 1.32Petronet L N G Ltd 1.26Ashok Leyland Ltd 1.25Havells India Ltd 1.12Torrent Pharmaceuticals Ltd 1.10Sun Pharmaceuticals Ltd 1.06Reliance ETF Bank Bees 1.06Shree Cement Ltd 1.05Mahindra & Mahindra Financial Services Ltd 1.01Bharat Forge Ltd 0.96The Ramco Cements Ltd 0.92Ratnakar Bank Ltd 0.89Exide Industries Ltd 0.85Whirlpool of India Ltd 0.80Motherson Sumi Systems Ltd 0.73Eicher Motors Ltd 0.72Future Retail Ltd 0.72Bharat Petroleum Corporation Ltd 0.71Titan Industries Ltd 0.70Interglobe Aviation Ltd 0.68Odisha Cement Ltd 0.67AU Small Finance Bank Ltd 0.64ICICI Lombard General Insurance Company Ltd 0.62Astral Poly Technik Ltd 0.57Schaeffler India Ltd 0.55Brigade Enterprises Ltd 0.51Container Corporation of India Ltd 0.49HDFC Asset Management Co Ltd 0.47Jindal Steel and Power Ltd 0.46Tata Steel Ltd 0.46Somany Ceramics Ltd 0.33Sadbhav Engineering Ltd 0.166% Zee Entertainment Enterprises Ltd Pref Shares 0.03
Equity Guarantee Fund
Others 11.18National Thermal Power Corporation Ltd 0.55Eicher Motors Ltd 0.54IndusInd Bank Ltd 0.54HCL Technologies Ltd 0.52Vedanta Ltd 0.52Power Grid Corporation of India Ltd 0.52Bharti Airtel Ltd 0.51Hindalco Industries Ltd 0.50J S W Steel Ltd 0.49Cipla Ltd 0.46Zee Entertainment Enterprises Ltd 0.46Titan Industries Ltd 0.44Tata Steel Ltd 0.43Tech Mahindra Ltd 0.41Grasim Industries Ltd 0.40Bajaj Finance Ltd 0.39GAIL (India) Ltd 0.39Adani Ports and Special Economic Zone Ltd 0.36Tata Motors Ltd 0.34Wipro Ltd 0.34UPL Ltd 0.32Indian Oil Corporation Ltd 0.28Bharti Infratel Ltd 0.27Bharat Petroleum Corporation Ltd 0.25Bajaj Finserv Ltd 0.23Coal India Ltd 0.21Yes Bank Ltd 0.20Hindustan Petroleum Corporation Ltd 0.17Indiabulls Housing Finance Ltd 0.15
Equity Kotak Aggressive Growth Fund
Others 26.27Bata India Ltd 1.75Ashok Leyland Ltd 1.58Mahindra & Mahindra Financial Services Ltd 1.53S R F Ltd 1.30The Ramco Cements Ltd 1.27SBI ETF Nifty Bank 1.26Ratnakar Bank Ltd 1.21Bharat Forge Ltd 1.12Zee Entertainment Enterprises Ltd 1.11Hindalco Industries Ltd 1.08Apollo Tyres Ltd 1.06Tata Power Company Ltd 0.99Voltas Ltd 0.94Tata Steel Ltd 0.91Supreme Industries Ltd 0.89Shree Cement Ltd 0.85Vedanta Ltd 0.83Exide Industries Ltd 0.81Tata Consultancy Services Ltd 0.81Bajaj Finance Ltd 0.69GlaxoSmithKlineConsumerHealthcareLtd 0.67Interglobe Aviation Ltd 0.66Jindal Steel and Power Ltd 0.65Marico Ltd 0.57AU Small Finance Bank Ltd 0.53Titan Industries Ltd 0.42Aavas Financiers Ltd 0.40Odisha Cement Ltd 0.20Havells India Ltd 0.156% Zee Entertainment Enterprises Ltd Pref Shares 0.03
Equity Kotak Dynamic Growth Fund
Others 23.37
Mahindra & Mahindra Financial Services Ltd 1.34
State Bank of India 1.32
Havells India Ltd 1.29
SBI ETF Nifty Bank 1.13
S R F Ltd 0.90
Whirlpool of India Ltd 0.88
Zee Entertainment Enterprises Ltd 0.86
Hindalco Industries Ltd 0.84
Apollo Tyres Ltd 0.83
The Ramco Cements Ltd 0.83
Ratnakar Bank Ltd 0.79
Tata Consultancy Services Ltd 0.77
Interglobe Aviation Ltd 0.77
Bajaj Finance Ltd 0.73
Bharat Forge Ltd 0.71
Petronet L N G Ltd 0.71
Supreme Industries Ltd 0.69
Voltas Ltd 0.68
Tata Power Company Ltd 0.67
Vedanta Ltd 0.58
Ashok Leyland Ltd 0.56
Jindal Steel and Power Ltd 0.53
Odisha Cement Ltd 0.51
Tata Steel Ltd 0.50
Brigade Enterprises Ltd 0.49
GlaxoSmithKlineConsumerHealthcareLtd 0.49
AU Small Finance Bank Ltd 0.48
Shree Cement Ltd 0.45
Coromandel International Ltd 0.44
Aavas Financiers Ltd 0.32
Astral Poly Technik Ltd 0.32
Exide Industries Ltd 0.28
Marico Ltd 0.24
Titan Industries Ltd 0.19
Somany Ceramics Ltd 0.17
6% Zee Entertainment Enterprises Ltd Pref Shares 0.03
The Break-up of Others is as given below
ANNEXURE
AS ON 30th NOVEMBER 2018

Market Outlook Fund Performance Contents Individual Funds Group Funds
MONTHLY UPDATE DECEMBER 2018 | (based on last business day) 56
The Break-up of Others is as given below
Equity Dynamic Floor Fund
Others 11.43Asian Paints Ltd 0.68Mahindra & Mahindra Financial Services Ltd 0.66State Bank of India 0.61Whirlpool of India Ltd 0.46Ratnakar Bank Ltd 0.44S R F Ltd 0.43Zee Entertainment Enterprises Ltd 0.43The Ramco Cements Ltd 0.42Apollo Tyres Ltd 0.41Interglobe Aviation Ltd 0.41Hindalco Industries Ltd 0.40Tata Consultancy Services Ltd 0.38Bajaj Finance Ltd 0.37Havells India Ltd 0.36Petronet L N G Ltd 0.36Supreme Industries Ltd 0.35Bharat Forge Ltd 0.35Voltas Ltd 0.34Tata Power Company Ltd 0.33Vedanta Ltd 0.29Shree Cement Ltd 0.28Ashok Leyland Ltd 0.28Jindal Steel and Power Ltd 0.26Odisha Cement Ltd 0.26AU Small Finance Bank Ltd 0.26GlaxoSmithKlineConsumerHealthcareLtd 0.23Brigade Enterprises Ltd 0.23Coromandel International Ltd 0.21Aavas Financiers Ltd 0.16Astral Poly Technik Ltd 0.16Tata Steel Ltd 0.14Exide Industries Ltd 0.14Marico Ltd 0.12Titan Industries Ltd 0.11Somany Ceramics Ltd 0.09
Equity Peak Guarantee Fund I
Others 4.10National Thermal Power Corporation Ltd 0.20Eicher Motors Ltd 0.20HCL Technologies Ltd 0.19Power Grid Corporation of India Ltd 0.19Dr Reddys Laboratories Ltd 0.19Bharti Airtel Ltd 0.19Hindalco Industries Ltd 0.19Vedanta Ltd 0.18Zee Entertainment Enterprises Ltd 0.17J S W Steel Ltd 0.17Tata Steel Ltd 0.16Cipla Ltd 0.16Bajaj Finance Ltd 0.15Titan Industries Ltd 0.15Grasim Industries Ltd 0.15Tech Mahindra Ltd 0.15GAIL (India) Ltd 0.14Adani Ports and Special Economic Zone Ltd 0.13Tata Motors Ltd 0.13Wipro Ltd 0.12UPL Ltd 0.12Indian Oil Corporation Ltd 0.11Bharti Infratel Ltd 0.10Bharat Petroleum Corporation Ltd 0.09Bajaj Finserv Ltd 0.09Coal India Ltd 0.09Yes Bank Ltd 0.08Hindustan Petroleum Corporation Ltd 0.06Indiabulls Housing Finance Ltd 0.06
Equity Kotak Dynamic Balanced Fund
Others 16.96Aurobindo Pharma Ltd 1.02Mahindra & Mahindra Financial Services Ltd 0.91Maruti Suzuki India Ltd 0.90Whirlpool of India Ltd 0.70S R F Ltd 0.67Ratnakar Bank Ltd 0.64Apollo Tyres Ltd 0.63Hindalco Industries Ltd 0.62Zee Entertainment Enterprises Ltd 0.62The Ramco Cements Ltd 0.62Interglobe Aviation Ltd 0.62Tata Consultancy Services Ltd 0.58Bajaj Finance Ltd 0.56Havells India Ltd 0.54Bharat Forge Ltd 0.53Petronet L N G Ltd 0.52Tata Power Company Ltd 0.52Supreme Industries Ltd 0.51Voltas Ltd 0.50Vedanta Ltd 0.44Ashok Leyland Ltd 0.42Shree Cement Ltd 0.42AU Small Finance Bank Ltd 0.39Jindal Steel and Power Ltd 0.38Odisha Cement Ltd 0.38GlaxoSmithKlineConsumerHealthcareLtd 0.34Brigade Enterprises Ltd 0.33Coromandel International Ltd 0.31Aavas Financiers Ltd 0.24Astral Poly Technik Ltd 0.24Exide Industries Ltd 0.21Marico Ltd 0.18Tata Steel Ltd 0.15Titan Industries Ltd 0.14Somany Ceramics Ltd 0.136% Zee Entertainment Enterprises Ltd Pref Shares 0.02
Equity Kotak Guaranteed Growth Fund
Others 16.47Asian Paints Ltd 0.98Aurobindo Pharma Ltd 0.97Maruti Suzuki India Ltd 0.86Whirlpool of India Ltd 0.67S R F Ltd 0.67The Ramco Cements Ltd 0.66Hindalco Industries Ltd 0.62Apollo Tyres Ltd 0.62Zee Entertainment Enterprises Ltd 0.60Voltas Ltd 0.58Bharat Forge Ltd 0.57Havells India Ltd 0.57Ratnakar Bank Ltd 0.56Supreme Industries Ltd 0.54Bajaj Finance Ltd 0.54Tata Power Company Ltd 0.49Petronet L N G Ltd 0.47GlaxoSmithKlineConsumerHealthcareLtd 0.44Interglobe Aviation Ltd 0.44Brigade Enterprises Ltd 0.43Vedanta Ltd 0.42Odisha Cement Ltd 0.42Shree Cement Ltd 0.41Jindal Steel and Power Ltd 0.40Coromandel International Ltd 0.38Tata Consultancy Services Ltd 0.38AU Small Finance Bank Ltd 0.31Ashok Leyland Ltd 0.26Aavas Financiers Ltd 0.24Astral Poly Technik Ltd 0.23Exide Industries Ltd 0.19Marico Ltd 0.18Somany Ceramics Ltd 0.14Titan Industries Ltd 0.14Tata Steel Ltd 0.056% Zee Entertainment Enterprises Ltd Pref Shares 0.03
ANNEXURE
AS ON 30th NOVEMBER 2018

Market Outlook Fund Performance Contents Individual Funds Group Funds
MONTHLY UPDATE DECEMBER 2018 | (based on last business day) 57
The Break-up of Others is as given below
Equity Kotak Guaranteed Balanced Fund
Others 12.89Mahindra & Mahindra Financial Services Ltd 0.79Aurobindo Pharma Ltd 0.78State Bank of India 0.71Whirlpool of India Ltd 0.55S R F Ltd 0.53Zee Entertainment Enterprises Ltd 0.49The Ramco Cements Ltd 0.49Hindalco Industries Ltd 0.47Tata Consultancy Services Ltd 0.45Interglobe Aviation Ltd 0.44Ratnakar Bank Ltd 0.44Apollo Tyres Ltd 0.43Bajaj Finance Ltd 0.42Havells India Ltd 0.42Petronet L N G Ltd 0.42Supreme Industries Ltd 0.41Bharat Forge Ltd 0.41Voltas Ltd 0.39Vedanta Ltd 0.33Ashok Leyland Ltd 0.32Shree Cement Ltd 0.32Jindal Steel and Power Ltd 0.31Odisha Cement Ltd 0.30GlaxoSmithKlineConsumerHealthcareLtd 0.28Astral Poly Technik Ltd 0.28Brigade Enterprises Ltd 0.27AU Small Finance Bank Ltd 0.26Coromandel International Ltd 0.25Aavas Financiers Ltd 0.19Tata Steel Ltd 0.17Exide Industries Ltd 0.16Marico Ltd 0.14Titan Industries Ltd 0.13Somany Ceramics Ltd 0.11Tata Power Company Ltd 0.026% Zee Entertainment Enterprises Ltd Pref Shares 0.01
Equity Kotak Pension Opportunities Fund
Others 28.56
Asian Paints Ltd 1.58
GAIL (India) Ltd 1.42
State Bank of India 1.36
Bata India Ltd 1.34
Ashok Leyland Ltd 1.20
Petronet L N G Ltd 1.19
Reliance ETF Bank Bees 1.13
Havells India Ltd 1.10
Torrent Pharmaceuticals Ltd 1.04
Sun Pharmaceuticals Ltd 1.03
Mahindra & Mahindra Financial Services Ltd 1.02
Shree Cement Ltd 1.01
Bharat Forge Ltd 0.91
The Ramco Cements Ltd 0.88
Ratnakar Bank Ltd 0.86
Exide Industries Ltd 0.82
Whirlpool of India Ltd 0.77
Eicher Motors Ltd 0.72
Motherson Sumi Systems Ltd 0.71
Bharat Petroleum Corporation Ltd 0.70
Future Retail Ltd 0.68
Titan Industries Ltd 0.67
Interglobe Aviation Ltd 0.66
Odisha Cement Ltd 0.65
AU Small Finance Bank Ltd 0.63
ICICI Lombard General Insurance Company Ltd 0.59
Astral Poly Technik Ltd 0.54
Schaeffler India Ltd 0.54
Brigade Enterprises Ltd 0.49
HDFC Asset Management Co Ltd 0.49
Container Corporation of India Ltd 0.48
Jindal Steel and Power Ltd 0.45
Tata Steel Ltd 0.44
Somany Ceramics Ltd 0.29
Sadbhav Engineering Ltd 0.15
6% Zee Entertainment Enterprises Ltd Pref Shares 0.02
Equity Pension Classic Opportunities Fund
Others 29.04Asian Paints Ltd 1.61GAIL (India) Ltd 1.45State Bank of India 1.33Bata India Ltd 1.33Ashok Leyland Ltd 1.23Petronet L N G Ltd 1.21Havells India Ltd 1.12Torrent Pharmaceuticals Ltd 1.07Sun Pharmaceuticals Ltd 1.05Shree Cement Ltd 1.04Mahindra & Mahindra Financial Services Ltd 1.04Reliance ETF Bank Bees 1.03Bharat Forge Ltd 0.94The Ramco Cements Ltd 0.90Ratnakar Bank Ltd 0.87Exide Industries Ltd 0.83Whirlpool of India Ltd 0.79Motherson Sumi Systems Ltd 0.74Eicher Motors Ltd 0.73Bharat Petroleum Corporation Ltd 0.72Future Retail Ltd 0.70Titan Industries Ltd 0.68Interglobe Aviation Ltd 0.68Odisha Cement Ltd 0.67AU Small Finance Bank Ltd 0.64ICICI Lombard General Insurance Company Ltd 0.61Astral Poly Technik Ltd 0.56Schaeffler India Ltd 0.55HDFC Asset Management Co Ltd 0.51Brigade Enterprises Ltd 0.50Container Corporation of India Ltd 0.49Tata Steel Ltd 0.46Jindal Steel and Power Ltd 0.46Somany Ceramics Ltd 0.31Sadbhav Engineering Ltd 0.166% Zee Entertainment Enterprises Ltd Pref Shares 0.05
Equity Pension Frontline Equity Fund
Others 28.77Mahindra & Mahindra Financial Services Ltd 1.70State Bank of India 1.67Maruti Suzuki India Ltd 1.51Whirlpool of India Ltd 1.21Ratnakar Bank Ltd 1.15S R F Ltd 1.13Zee Entertainment Enterprises Ltd 1.10The Ramco Cements Ltd 1.07Hindalco Industries Ltd 1.05Apollo Tyres Ltd 1.05Tata Consultancy Services Ltd 0.99Interglobe Aviation Ltd 0.97Bajaj Finance Ltd 0.91Petronet L N G Ltd 0.91Bharat Forge Ltd 0.89Supreme Industries Ltd 0.88Voltas Ltd 0.87Tata Power Company Ltd 0.85Vedanta Ltd 0.74Ashok Leyland Ltd 0.71Shree Cement Ltd 0.71Jindal Steel and Power Ltd 0.67Odisha Cement Ltd 0.65Coromandel International Ltd 0.65AU Small Finance Bank Ltd 0.65Brigade Enterprises Ltd 0.64GlaxoSmithKlineConsumerHealthcareLtd 0.63Havells India Ltd 0.46Astral Poly Technik Ltd 0.41Aavas Financiers Ltd 0.41Tata Steel Ltd 0.37Exide Industries Ltd 0.33Marico Ltd 0.31Titan Industries Ltd 0.25Somany Ceramics Ltd 0.226% Zee Entertainment Enterprises Ltd Pref Shares 0.04
ANNEXURE
AS ON 30th NOVEMBER 2018

Market Outlook Fund Performance Contents Individual Funds Group Funds
MONTHLY UPDATE DECEMBER 2018 | (based on last business day) 58
The Break-up of Others is as given below
Equity Pension Guarantee Fund
Others 11.20
National Thermal Power Corporation Ltd 0.55
Eicher Motors Ltd 0.54
IndusInd Bank Ltd 0.54
HCL Technologies Ltd 0.52
Vedanta Ltd 0.52
Power Grid Corporation of India Ltd 0.52
Bharti Airtel Ltd 0.52
Hindalco Industries Ltd 0.50
J S W Steel Ltd 0.49
Cipla Ltd 0.46
Zee Entertainment Enterprises Ltd 0.46
Titan Industries Ltd 0.44
Tata Steel Ltd 0.43
Tech Mahindra Ltd 0.41
Grasim Industries Ltd 0.40
Bajaj Finance Ltd 0.39
GAIL (India) Ltd 0.39
Adani Ports and Special Economic Zone Ltd 0.36
Tata Motors Ltd 0.34
Wipro Ltd 0.34
UPL Ltd 0.32
Indian Oil Corporation Ltd 0.28
Bharti Infratel Ltd 0.27
Bharat Petroleum Corporation Ltd 0.25
Bajaj Finserv Ltd 0.23
Coal India Ltd 0.21
Yes Bank Ltd 0.20
Hindustan Petroleum Corporation Ltd 0.17
Indiabulls Housing Finance Ltd 0.15
Equity Kotak Pension Floor Fund
Others 11.12SBI ETF Nifty Bank 0.69State Bank of India 0.62Maruti Suzuki India Ltd 0.59Whirlpool of India Ltd 0.49Ratnakar Bank Ltd 0.47S R F Ltd 0.46The Ramco Cements Ltd 0.43Hindalco Industries Ltd 0.41Zee Entertainment Enterprises Ltd 0.41Tata Consultancy Services Ltd 0.39Apollo Tyres Ltd 0.38Havells India Ltd 0.38Petronet L N G Ltd 0.37Bajaj Finance Ltd 0.37Supreme Industries Ltd 0.36Bharat Forge Ltd 0.36Voltas Ltd 0.35Vedanta Ltd 0.29Ashok Leyland Ltd 0.28Shree Cement Ltd 0.27Interglobe Aviation Ltd 0.27Jindal Steel and Power Ltd 0.27Odisha Cement Ltd 0.27Brigade Enterprises Ltd 0.26AU Small Finance Bank Ltd 0.26GlaxoSmithKlineConsumerHealthcareLtd 0.25Coromandel International Ltd 0.22Astral Poly Technik Ltd 0.17Aavas Financiers Ltd 0.17Tata Steel Ltd 0.15Exide Industries Ltd 0.14Marico Ltd 0.12Titan Industries Ltd 0.11Somany Ceramics Ltd 0.10Tata Power Company Ltd 0.02
Equity Kotak Pension Growth Fund
Others 15.92Asian Paints Ltd 0.94State Bank of India 0.91Mahindra & Mahindra Financial Services Ltd 0.90Whirlpool of India Ltd 0.65Ratnakar Bank Ltd 0.62S R F Ltd 0.61Zee Entertainment Enterprises Ltd 0.60The Ramco Cements Ltd 0.59Apollo Tyres Ltd 0.59Hindalco Industries Ltd 0.57Interglobe Aviation Ltd 0.54Tata Consultancy Services Ltd 0.53Bajaj Finance Ltd 0.52Havells India Ltd 0.50Petronet L N G Ltd 0.49Bharat Forge Ltd 0.48Supreme Industries Ltd 0.48Voltas Ltd 0.47Tata Power Company Ltd 0.47Vedanta Ltd 0.40Ashok Leyland Ltd 0.39Shree Cement Ltd 0.38Jindal Steel and Power Ltd 0.37AU Small Finance Bank Ltd 0.36Odisha Cement Ltd 0.35GlaxoSmithKlineConsumerHealthcareLtd 0.33Brigade Enterprises Ltd 0.32Coromandel International Ltd 0.30Astral Poly Technik Ltd 0.23Aavas Financiers Ltd 0.22Tata Steel Ltd 0.20Exide Industries Ltd 0.19Marico Ltd 0.17Titan Industries Ltd 0.13Somany Ceramics Ltd 0.126% Zee Entertainment Enterprises Ltd Pref Shares 0.02
Equity Pension Floor Fund II
Others 11.25Asian Paints Ltd 0.68Mahindra & Mahindra Financial Services Ltd 0.67Whirlpool of India Ltd 0.47Ratnakar Bank Ltd 0.44The Ramco Cements Ltd 0.43Zee Entertainment Enterprises Ltd 0.43S R F Ltd 0.43Apollo Tyres Ltd 0.41State Bank of India 0.41Interglobe Aviation Ltd 0.41Hindalco Industries Ltd 0.40Tata Consultancy Services Ltd 0.38Bajaj Finance Ltd 0.37Havells India Ltd 0.36Petronet L N G Ltd 0.35Bharat Forge Ltd 0.35Supreme Industries Ltd 0.35Voltas Ltd 0.34Tata Power Company Ltd 0.33Vedanta Ltd 0.29Shree Cement Ltd 0.28Ashok Leyland Ltd 0.28Jindal Steel and Power Ltd 0.26Odisha Cement Ltd 0.26Brigade Enterprises Ltd 0.26AU Small Finance Bank Ltd 0.26GlaxoSmithKlineConsumerHealthcareLtd 0.24Coromandel International Ltd 0.21Aavas Financiers Ltd 0.16Astral Poly Technik Ltd 0.16Tata Steel Ltd 0.14Exide Industries Ltd 0.14Marico Ltd 0.12Titan Industries Ltd 0.09Somany Ceramics Ltd 0.08
ANNEXURE
AS ON 30th NOVEMBER 2018

Market Outlook Fund Performance Contents Individual Funds Group Funds
MONTHLY UPDATE DECEMBER 2018 | (based on last business day) 59
The Break-up of Others is as given below
Equity Kotak Pension Balanced Fund
Others 13.87SBI ETF Nifty Bank 0.80Maruti Suzuki India Ltd 0.72Mahindra & Mahindra Financial Services Ltd 0.70Whirlpool of India Ltd 0.67The Ramco Cements Ltd 0.65S R F Ltd 0.63Hindalco Industries Ltd 0.59Havells India Ltd 0.56Zee Entertainment Enterprises Ltd 0.54Supreme Industries Ltd 0.53Bharat Forge Ltd 0.48Voltas Ltd 0.47GlaxoSmithKlineConsumerHealthcareLtd 0.46Brigade Enterprises Ltd 0.44Jindal Steel and Power Ltd 0.44Tata Power Company Ltd 0.42Petronet L N G Ltd 0.42Coromandel International Ltd 0.40Odisha Cement Ltd 0.39Vedanta Ltd 0.38Shree Cement Ltd 0.36Interglobe Aviation Ltd 0.35Apollo Tyres Ltd 0.34Tata Consultancy Services Ltd 0.33Bajaj Finance Ltd 0.25Ashok Leyland Ltd 0.24Aavas Financiers Ltd 0.22Astral Poly Technik Ltd 0.21AU Small Finance Bank Ltd 0.21Marico Ltd 0.17Exide Industries Ltd 0.16Somany Ceramics Ltd 0.15Titan Industries Ltd 0.13Tata Steel Ltd 0.036% Zee Entertainment Enterprises Ltd Pref Shares 0.02
Equity Kotak Group Dynamic Floor Fund
Others 8.46
Asian Paints Ltd 0.51
State Bank of India 0.48
Mahindra & Mahindra Financial Services Ltd 0.48
Zee Entertainment Enterprises Ltd 0.33
Apollo Tyres Ltd 0.33
Whirlpool of India Ltd 0.33
S R F Ltd 0.32
The Ramco Cements Ltd 0.31
Ratnakar Bank Ltd 0.31
Interglobe Aviation Ltd 0.31
Hindalco Industries Ltd 0.31
Bajaj Finance Ltd 0.28
Tata Consultancy Services Ltd 0.28
Bharat Forge Ltd 0.28
Havells India Ltd 0.27
Tata Power Company Ltd 0.26
Petronet L N G Ltd 0.25
Supreme Industries Ltd 0.25
Voltas Ltd 0.24
Vedanta Ltd 0.22
Ashok Leyland Ltd 0.21
AU Small Finance Bank Ltd 0.20
Jindal Steel and Power Ltd 0.19
Odisha Cement Ltd 0.18
Shree Cement Ltd 0.18
GlaxoSmithKlineConsumerHealthcareLtd 0.18
Brigade Enterprises Ltd 0.16
Coromandel International Ltd 0.15
Astral Poly Technik Ltd 0.12
Exide Industries Ltd 0.11
Aavas Financiers Ltd 0.11
Tata Steel Ltd 0.10
Marico Ltd 0.09
Titan Industries Ltd 0.07
Somany Ceramics Ltd 0.07
Equity Pension Balanced Fund II
Others 15.42Sun Pharmaceuticals Ltd 0.96Asian Paints Ltd 0.90Mahindra & Mahindra Financial Services Ltd 0.85Zee Entertainment Enterprises Ltd 0.62Apollo Tyres Ltd 0.60Whirlpool of India Ltd 0.60Ratnakar Bank Ltd 0.58The Ramco Cements Ltd 0.58S R F Ltd 0.57Hindalco Industries Ltd 0.54Interglobe Aviation Ltd 0.54Bajaj Finance Ltd 0.53Tata Consultancy Services Ltd 0.52Havells India Ltd 0.49Tata Power Company Ltd 0.49Bharat Forge Ltd 0.47Petronet L N G Ltd 0.45Supreme Industries Ltd 0.44Voltas Ltd 0.42AU Small Finance Bank Ltd 0.42Vedanta Ltd 0.41Ashok Leyland Ltd 0.40Jindal Steel and Power Ltd 0.33Odisha Cement Ltd 0.32Shree Cement Ltd 0.31Brigade Enterprises Ltd 0.31GlaxoSmithKlineConsumerHealthcareLtd 0.30Coromandel International Ltd 0.28Aavas Financiers Ltd 0.21Exide Industries Ltd 0.20Tata Steel Ltd 0.18Astral Poly Technik Ltd 0.18Marico Ltd 0.16Titan Industries Ltd 0.11Somany Ceramics Ltd 0.116% Zee Entertainment Enterprises Ltd Pref Shares 0.03
Equity Kotak Group Balanced Fund
Others 15.83Sun Pharmaceuticals Ltd 1.00Asian Paints Ltd 0.94Mahindra & Mahindra Financial Services Ltd 0.91Apollo Tyres Ltd 0.62Zee Entertainment Enterprises Ltd 0.61S R F Ltd 0.60The Ramco Cements Ltd 0.59Bharat Forge Ltd 0.56Hindalco Industries Ltd 0.56Voltas Ltd 0.55Bajaj Finance Ltd 0.55Interglobe Aviation Ltd 0.54Tata Consultancy Services Ltd 0.53Ratnakar Bank Ltd 0.50Whirlpool of India Ltd 0.50Tata Power Company Ltd 0.50Havells India Ltd 0.48Shree Cement Ltd 0.42Vedanta Ltd 0.41Supreme Industries Ltd 0.40Petronet L N G Ltd 0.40Ashok Leyland Ltd 0.40AU Small Finance Bank Ltd 0.39Coromandel International Ltd 0.37Marico Ltd 0.36Odisha Cement Ltd 0.31Jindal Steel and Power Ltd 0.30Brigade Enterprises Ltd 0.25GlaxoSmithKlineConsumerHealthcareLtd 0.25Aavas Financiers Ltd 0.23Exide Industries Ltd 0.20Tata Steel Ltd 0.19Astral Poly Technik Ltd 0.18Titan Industries Ltd 0.12Somany Ceramics Ltd 0.096% Zee Entertainment Enterprises Ltd Pref Shares 0.01
ANNEXURE
AS ON 30th NOVEMBER 2018
Market Outlook Fund Performance Contents Individual Funds Group Funds
MONTHLY UPDATE DECEMBER 2018 | (based on last business day) 60
Disclaimer
Disclaimer :
About Us :Kotak Mahindra Life Insurance Company Ltd. (Formerly known as Kotak Mahindra Old Mutual Life Insurance Ltd.)
KotakMahindraLife InsuranceCompanyLimited(KotakLife Insurance) isa100%ownedsubsidiaryofKotakMahindraBank(Kotak).KotakLife Insuranceprovides world-class insurance products with high customer empathy. Its product suite leverages the combined prowess of protection and long term savings. KotakLifeInsuranceisoneofthefastestgrowinginsurancecompaniesinIndiaandhascoveredoverseveralmillionlives.Formoreinformation,pleasevisitthecompany’s website at https://insurance.kotak.com
Kotak Mahindra Group
Establishedin1985,KotakMahindraGroupisoneofIndia’sleadingfinancialservicesconglomerate.InFebruary2003,KotakMahindraFinanceLtd.(KMFL),theGroup’s flagship company, received banking license from the Reserve Bank of India (RBI), becoming the first nonbanking finance company in India to convert into abank-KotakMahindraBankLtd.TheGroupoffersawiderangeoffinancialservicesthatencompasseverysphereoflife.Fromcommercialbanking,tostockbroking, mutual funds, insurance and investment banking, the Group caters to the diverse financial needs of individuals and the corporate sector. The Group has a wide distribution network through branches and franchisees across India, and International Business Units. For more information, please visit the company’s website at www.kotak.com
Trade Logo Disclaimer
TradeLogodisplayedabovebelongstoKotakMahindraBankLimitedandisusedbyKotakMahindraLifeInsuranceCompanyLtd.underlicense.
Kotak Mahindra Life Insurance Company Ltd. (Formerly known as Kotak Mahindra Old Mutual Life Insurance Ltd.); Regn. No.: 107, CIN: U66030MH-2000PLC128503,Regd.Office:2ndFloor,Plot#C-12,G-Block,BKC,Bandra(E),Mumbai-400051.
Website: http://insurance.kotak.com Email:[email protected] I Toll Free No. – 1800 209 8800
Risk factors :
Thoughdocumentisthoroughlyresearched&preparedbyourfundexperts.KotakMahindraLifeInsuranceCompanyLtdhowevermakesnowarranties,repre-sentations, promises or statements that the information contained herein is clear, correct, precise or accurate. this document has been prepared for the purpose of providing an overview of kli funds without taking account of any particular investor’s objectives, financial situation or needs you are therefore requested not to substitute this document with any professional opinion/advice and to use your discretion basis your financial objectives.
• Unit Linked Life Insurance Products are different from traditional insurance products and are subject to the risk factors.
• The premium paid in Unit Linked Life Insurance Products are subject to investment risk associated with capital markets and the NAVs of the units may go up or down based on the performance of the fund and factors influencing the capital market and insured is responsible for his/her decisions.
• KotakLifeInsuranceisonlythenameoftheInsuranceCompanyandthespecifiedUnitLinkedfundsdonotinanywayindicatethequalityofthecontract,its future prospects or returns.
• Please know the associated risks and the applicable charges from your insurance agent or the intermediary or policy document of the insurer.
• Past performance of any of the funds is not indicative of their future prospects or returns.
AS ON 30th NOVEMBER 2018