Embed Size (px)
DESCRIPTION
Fundamentals of MCUs Session 4
Citation preview
12/12/2013
Jacob Beningo
Digital Signal Processing with the STM32F4 Discovery Board
1
Fundamentals of Microcontrollers (MCU’s) : Hands-on Workshop
Course Overview
• Introduction to Microcontrollers
• Selecting the Right Microcontroller
• An Overview of the STM32F4 Discovery Board
• Digital Signal Processing with the STM32F4
• Introduction to Graphics Processing
2
Session Overview
• Introduction to DSP
• DSP Sampling
• DSP Algorithms
• Floating Point
• Hands-on FPU Bench Marking
3

Introduction to DSP
4
Sampling Analog Digital
• Digital Signal Processing
– Changing and/or analyzing information which is
measured as discrete sequences of numbers
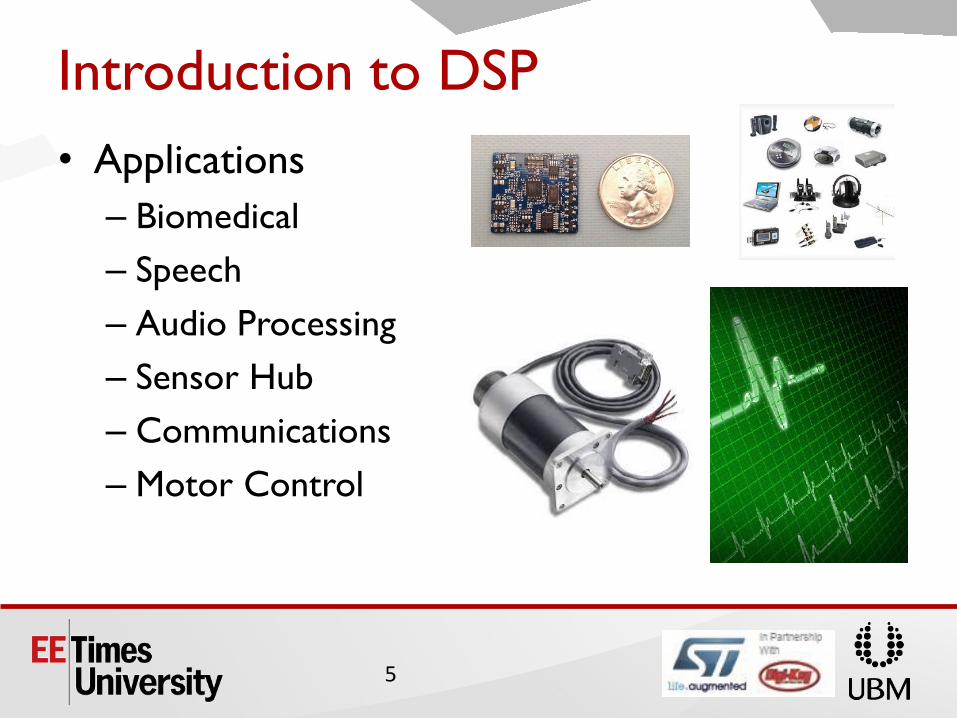
Introduction to DSP
5
• Applications
– Biomedical
– Speech
– Audio Processing
– Sensor Hub
– Communications
– Motor Control
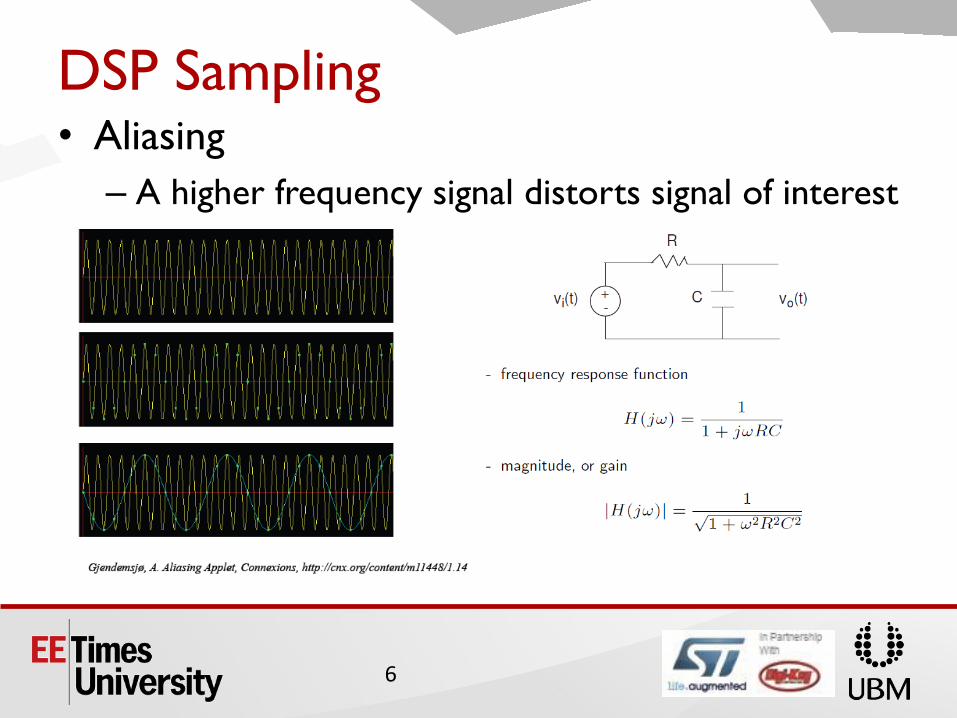
DSP Sampling
6
• Aliasing
– A higher frequency signal distorts signal of interest
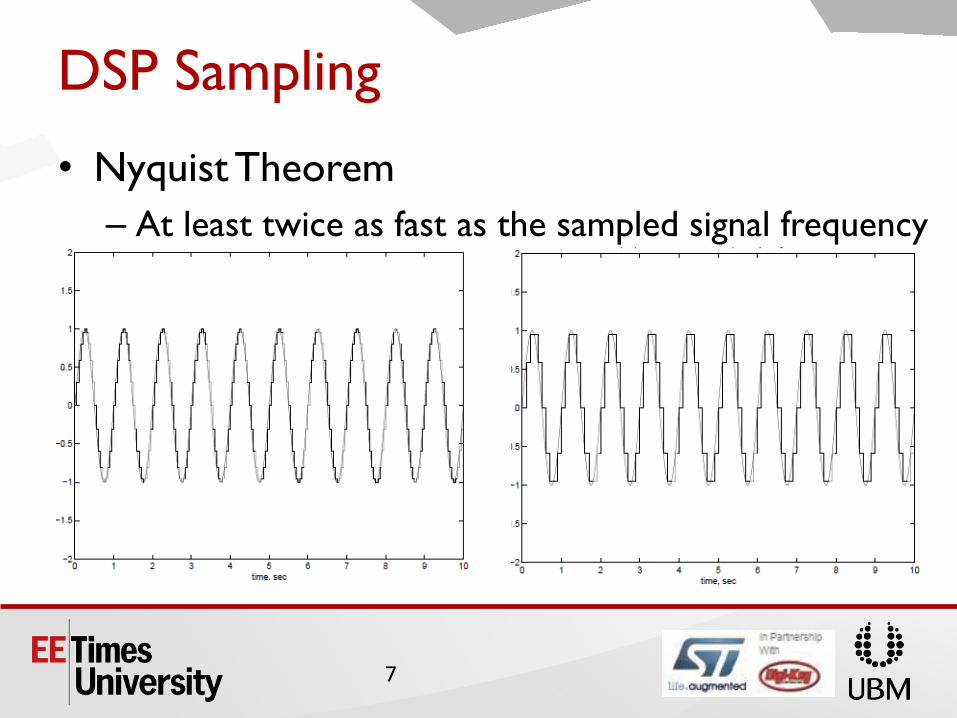
DSP Sampling
7
• Nyquist Theorem
– At least twice as fast as the sampled signal frequency
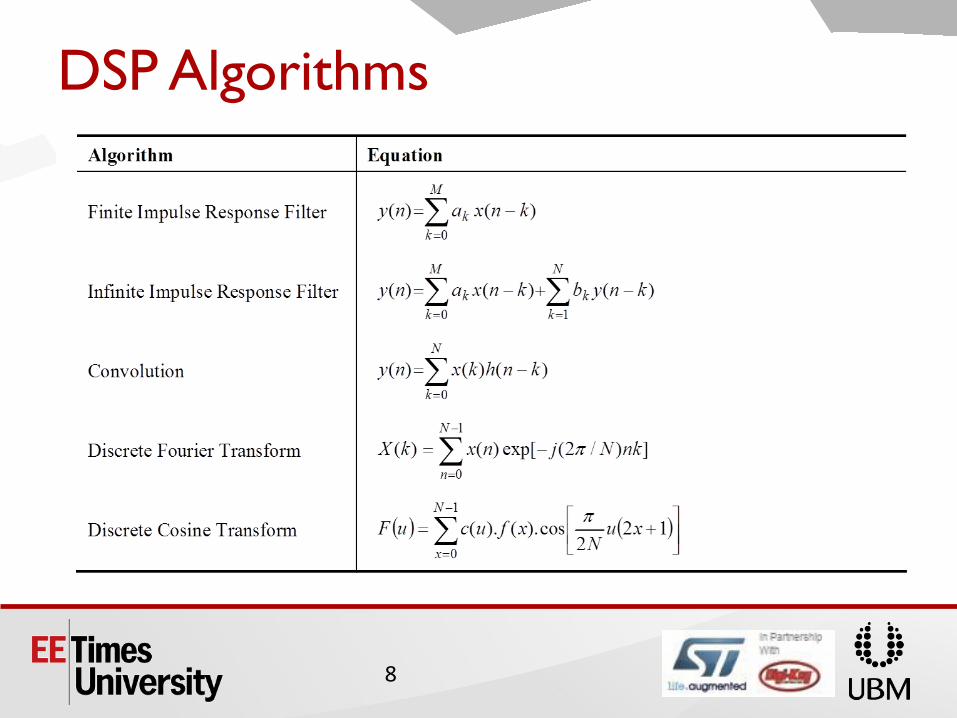
DSP Algorithms
8
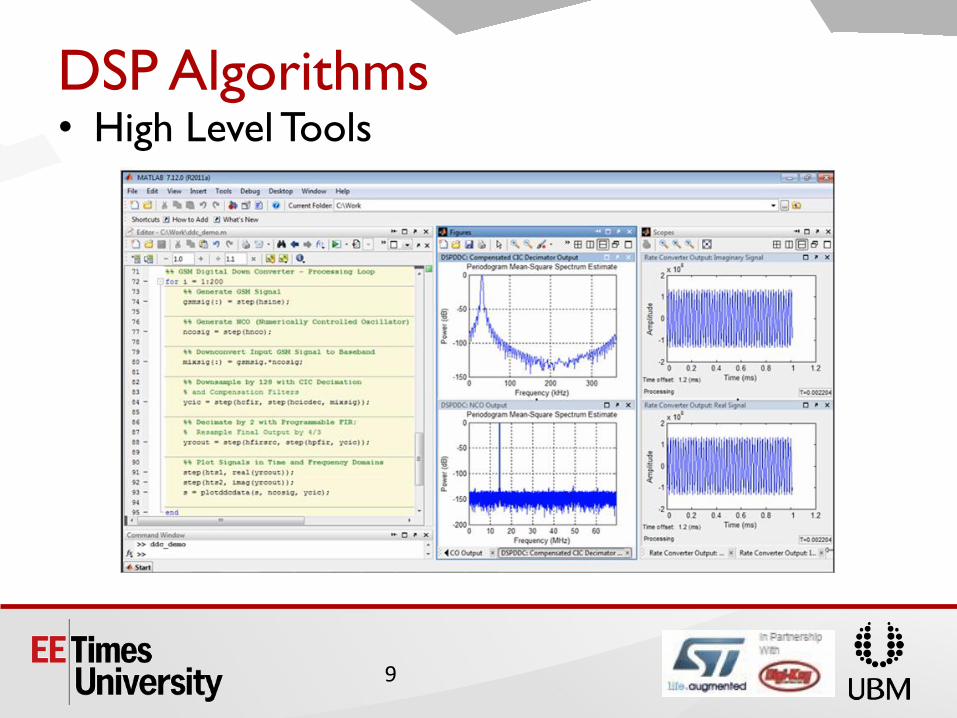
9
DSP Algorithms • High Level Tools
Floating Point Processor
10
• Floating Point Processor
– Ease of use
– High Precision
– Large Dynamic Range
– Fast!
• Fixed Point
– Floating point values are encoded in fixed point
– IQMath Libraries
BenchMarking Floating Point Calculations
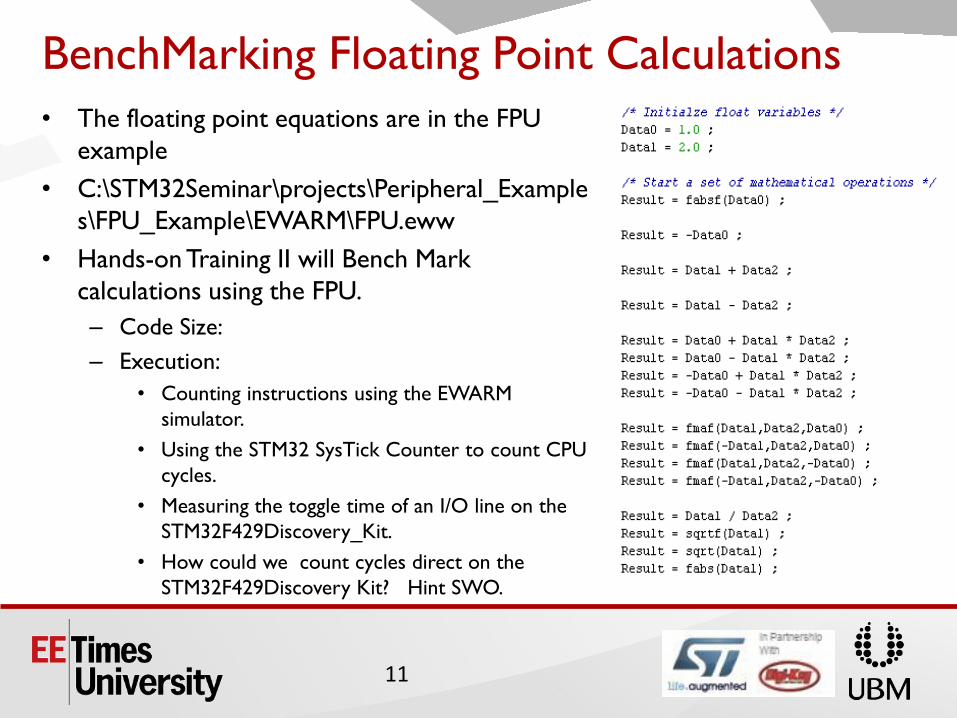
• The floating point equations are in the FPU
example
• C:\STM32Seminar\projects\Peripheral_Example
s\FPU_Example\EWARM\FPU.eww
• Hands-on Training II will Bench Mark
calculations using the FPU.
– Code Size:
– Execution:
• Counting instructions using the EWARM
simulator.
• Using the STM32 SysTick Counter to count CPU
cycles.
• Measuring the toggle time of an I/O line on the
STM32F429Discovery_Kit.
• How could we count cycles direct on the
STM32F429Discovery Kit? Hint SWO.
11
Step #1 Activate the FPU Project
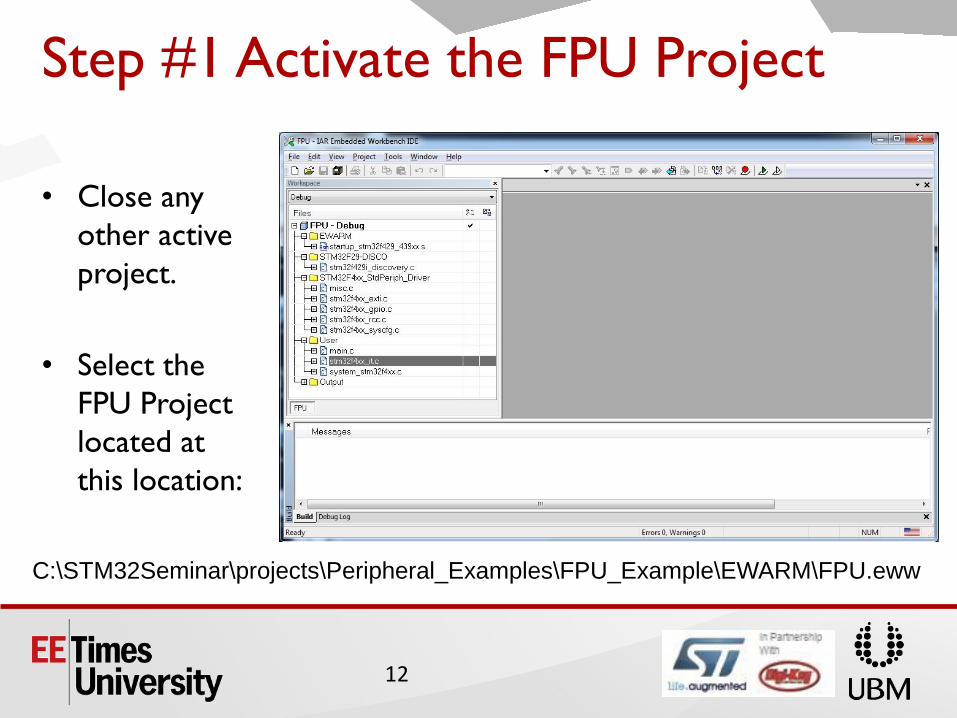
• Close any
other active
project.
• Select the
FPU Project
located at
this location:
C:\STM32Seminar\projects\Peripheral_Examples\FPU_Example\EWARM\FPU.eww
12
Step #2a FPU code size BenchMark
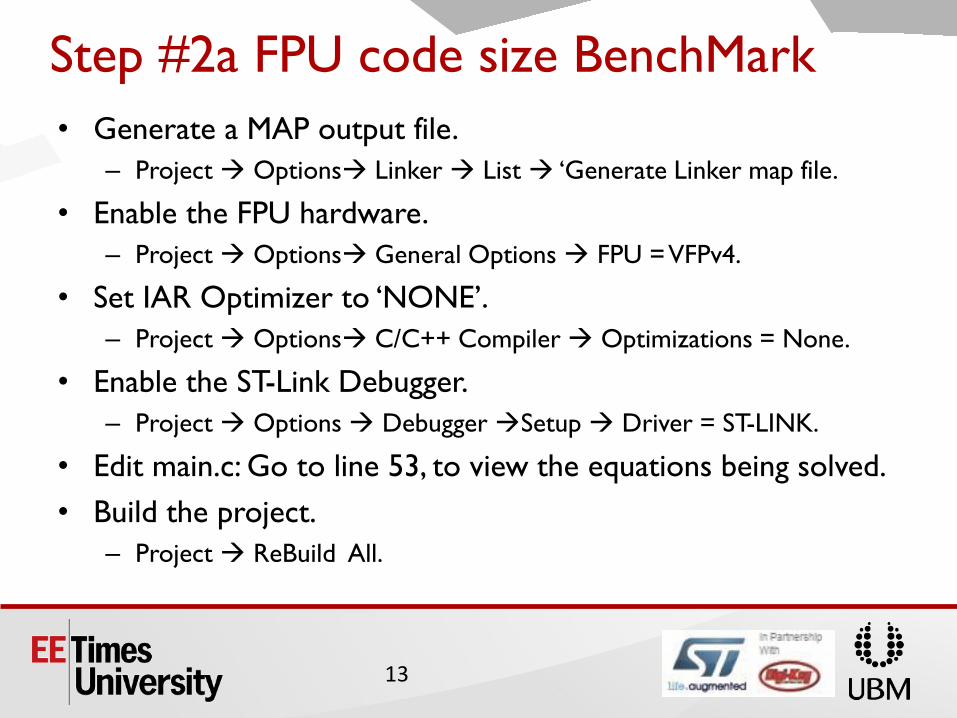
• Generate a MAP output file.
– Project Options Linker List ‘Generate Linker map file.
• Enable the FPU hardware.
– Project Options General Options FPU = VFPv4.
• Set IAR Optimizer to ‘NONE’.
– Project Options C/C++ Compiler Optimizations = None.
• Enable the ST-Link Debugger.
– Project Options Debugger Setup Driver = ST-LINK.
• Edit main.c: Go to line 53, to view the equations being solved.
• Build the project.
– Project ReBuild All.
13
Step #2b FPU code size BenchMark
• Disable the Hardware FPU.
• Project Options General Options FPU = none.
• Build the project
• Project ReBuild All.
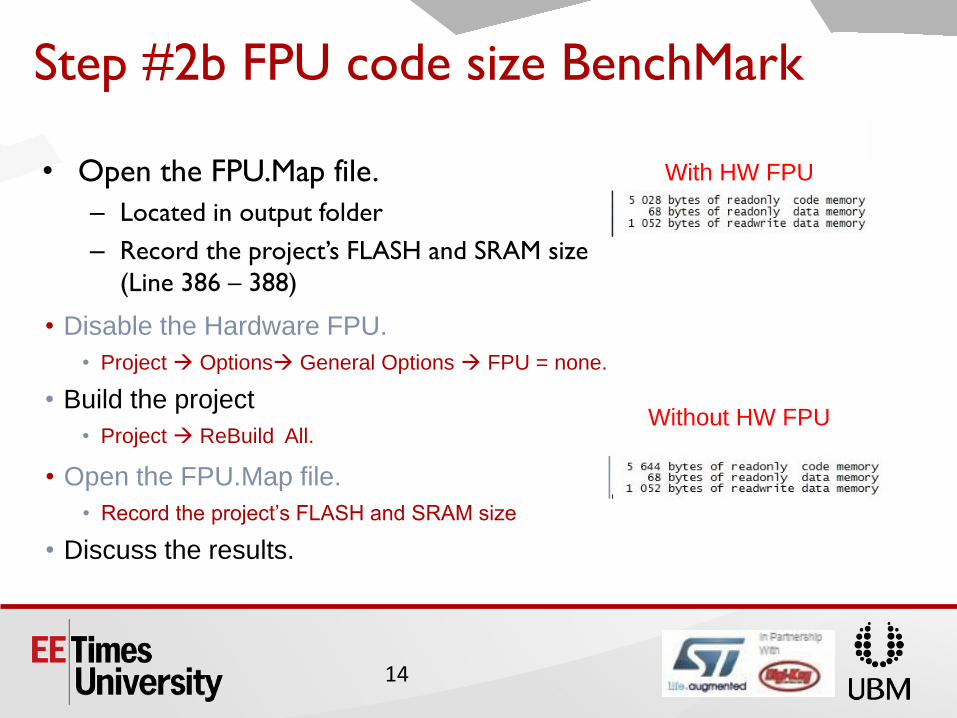
• Open the FPU.Map file.
– Located in output folder
– Record the project’s FLASH and SRAM size
(Line 386 – 388)
• Open the FPU.Map file.
• Record the project’s FLASH and SRAM size
• Discuss the results.
With HW FPU
Without HW FPU
14
Step #3a FPU performance Bench Mark
• Close the FPU.MAP file
• Enable FPU hardware.
– Project Options General Options FPU = VFPv4.
• Verify the IAR Optimizer is set to ‘NONE’.
– Project Options C/C++ Compiler Optimizations = None.
• Enable the EWARM Simulator
– Project Options Debugger Setup Simulator.
• Build the project.
– Project ReBuild All.
• Start the IAR EWARM Simulator
– Project Download and Debug (<ctrl> F5).
15
Step #3b FPU performance Bench Mark
• Place a BREAK point at Line 72.
• Open a ‘Variable’ Window to view the results. Over this window on the
Disassembly window.
– View Auto.
• Close the ‘Messages’ Window.
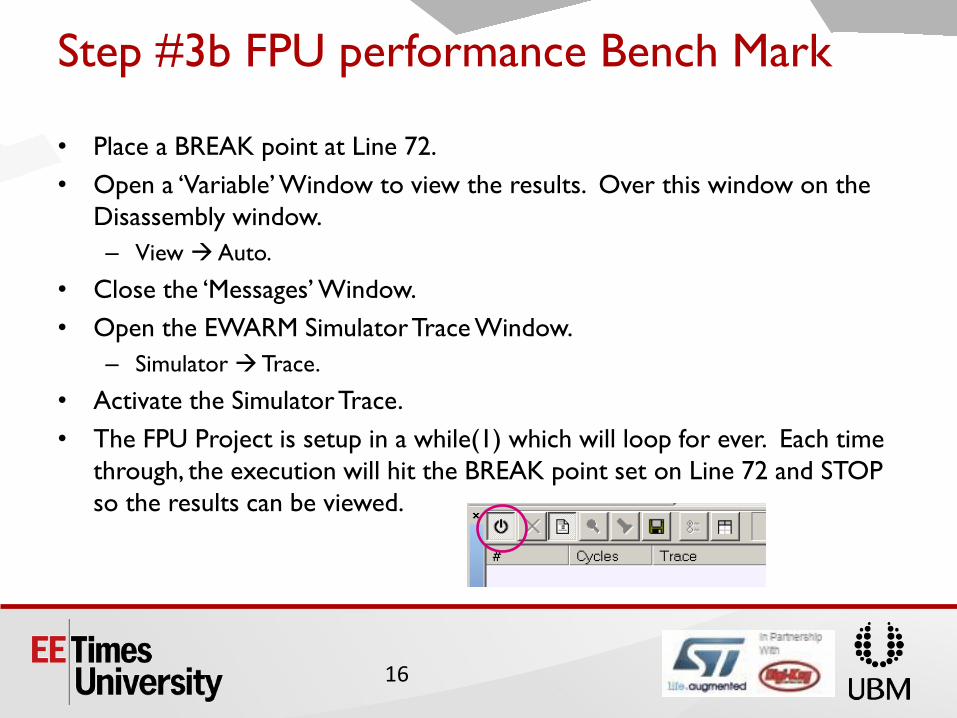
• Open the EWARM Simulator Trace Window.
– Simulator Trace.
• Activate the Simulator Trace.
• The FPU Project is setup in a while(1) which will loop for ever. Each time
through, the execution will hit the BREAK point set on Line 72 and STOP
so the results can be viewed.
16
Step #3c FPU performance Bench Mark
• Run the Program.
– Debug GO or F5.
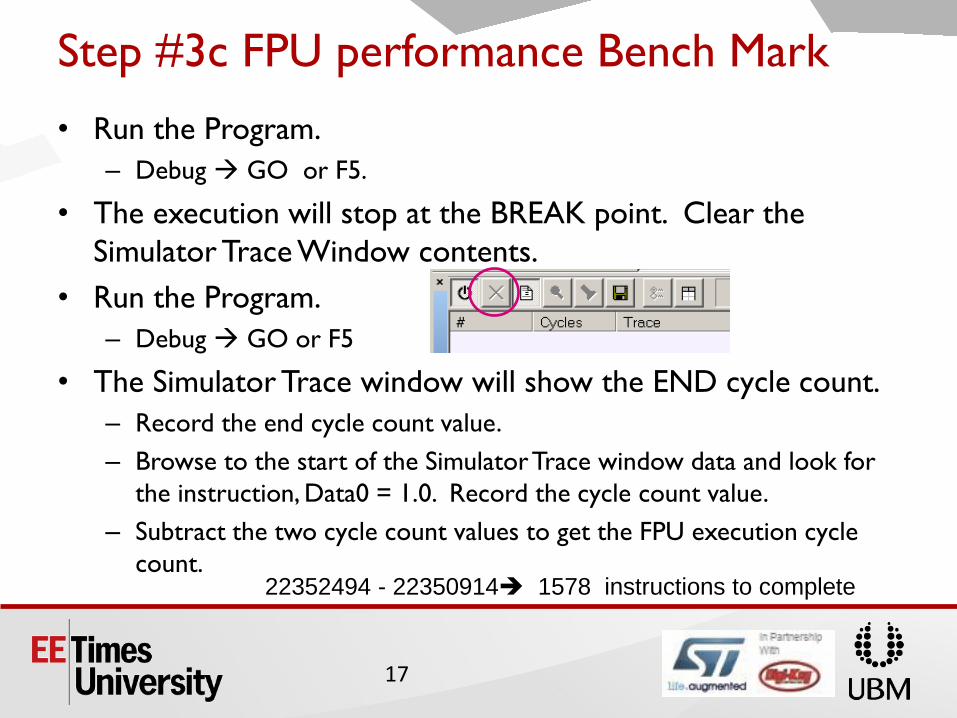
• The execution will stop at the BREAK point. Clear the
Simulator Trace Window contents.
• Run the Program.
– Debug GO or F5
• The Simulator Trace window will show the END cycle count.
– Record the end cycle count value.
– Browse to the start of the Simulator Trace window data and look for
the instruction, Data0 = 1.0. Record the cycle count value.
– Subtract the two cycle count values to get the FPU execution cycle
count.
22352494 - 22350914 1578 instructions to complete
17
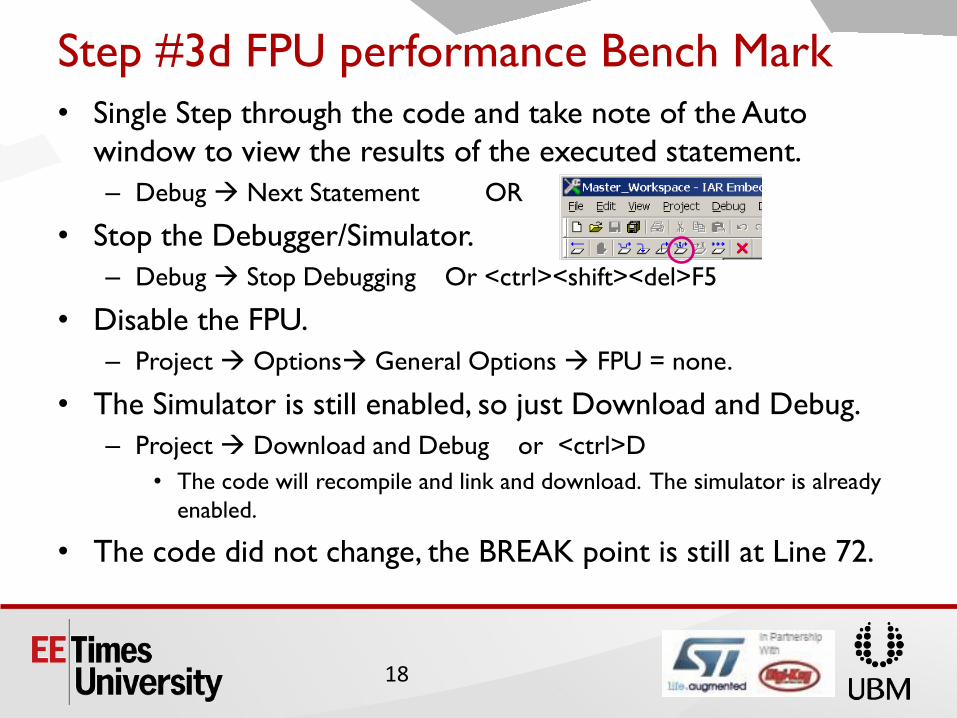
Step #3d FPU performance Bench Mark
• Single Step through the code and take note of the Auto
window to view the results of the executed statement.
– Debug Next Statement OR
• Stop the Debugger/Simulator.
– Debug Stop Debugging Or <ctrl><shift><del>F5
• Disable the FPU.
– Project Options General Options FPU = none.
• The Simulator is still enabled, so just Download and Debug.
– Project Download and Debug or <ctrl>D
• The code will recompile and link and download. The simulator is already
enabled.
• The code did not change, the BREAK point is still at Line 72.
18
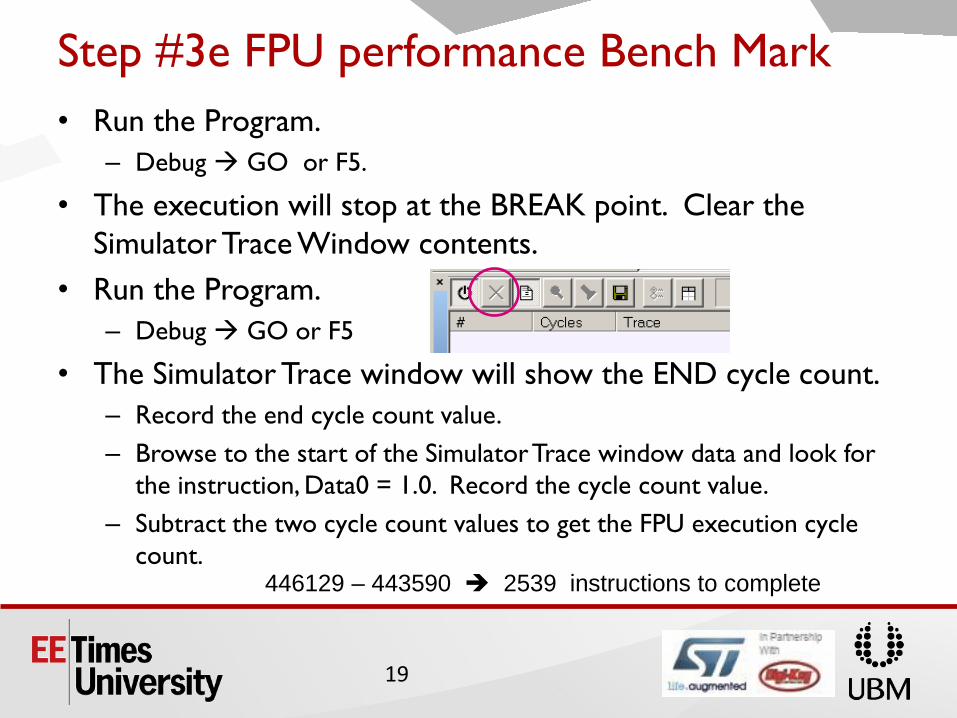
Step #3e FPU performance Bench Mark
• Run the Program.
– Debug GO or F5.
• The execution will stop at the BREAK point. Clear the
Simulator Trace Window contents.
• Run the Program.
– Debug GO or F5
• The Simulator Trace window will show the END cycle count.
– Record the end cycle count value.
– Browse to the start of the Simulator Trace window data and look for
the instruction, Data0 = 1.0. Record the cycle count value.
– Subtract the two cycle count values to get the FPU execution cycle
count.
446129 – 443590 2539 instructions to complete
19
Step #4a FPU Bench Mark, SysTick • STOP the Debugger.
• Enable FPU hardware.
– Project Options General Options FPU = VFPv4.
• Verify the IAR Optimizer is set to ‘NONE’.
– Project Options C/C++ Compiler Optimizations = None.
• Enable the STLINK Debugger
– Project Options Debugger Setup STLINK
– Project Options Debugger Download… ‘Verify Download, Use FLASH
Loader’.
– Project Options ST-LINK Interface… ‘SWD’.
• Modify the FPU Project source by copying main_step4.c, Cycle_Counter.c,
and Cycle_Counter.h into the FPU Project ‘working directory’.
• These files are located in C:\STM32Seminar\Projects\FPU_BenchMark_Counter ->
C:\STM32Seminar\Projects\Peripheral_Examples\FPU_Example
20
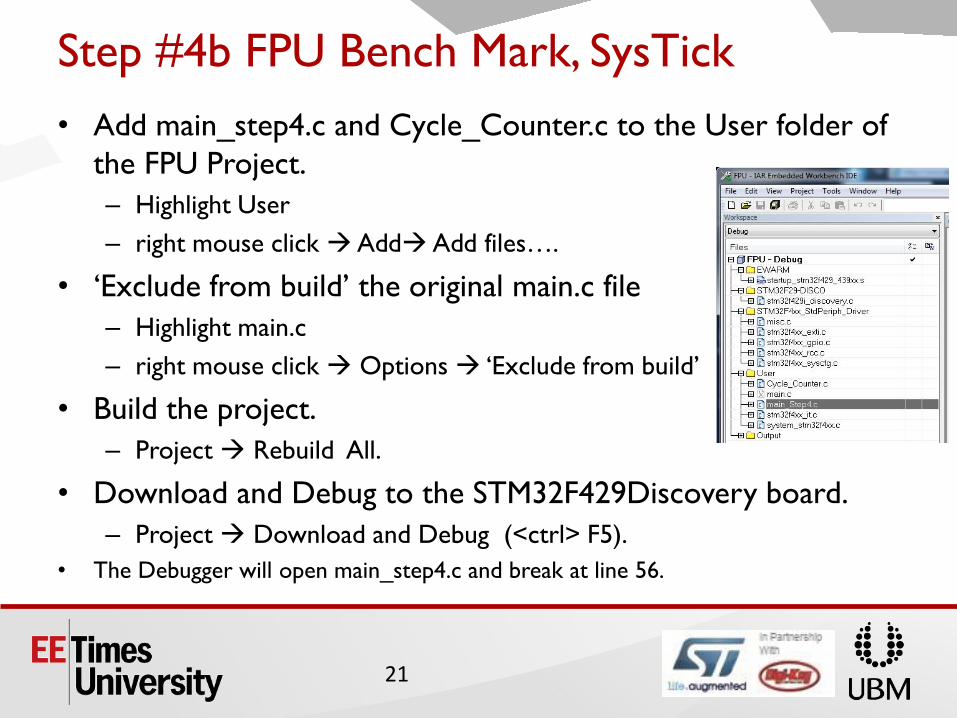
Step #4b FPU Bench Mark, SysTick
• Add main_step4.c and Cycle_Counter.c to the User folder of
the FPU Project.
– Highlight User
– right mouse click Add Add files….
• ‘Exclude from build’ the original main.c file
– Highlight main.c
– right mouse click Options ‘Exclude from build’
• Build the project.
– Project Rebuild All.
• Download and Debug to the STM32F429Discovery board.
– Project Download and Debug (<ctrl> F5).
• The Debugger will open main_step4.c and break at line 56.
21
Step #4c FPU Bench Mark, SysTick
• Explore the following functions in main_Step4.c file:
– Line 79: TimerCount_Start().
– Line 110: TimerCount_Stop(nb_cycles)
• What is happening with the SysTick?
• What Frequency is the SysTick operating at?
– Discuss the location of each function in the program and what will be counted.
• Place a BREAK point at Line 111.
• Open a ‘Variable’ Window to view the results. Overlay the ‘Auto’ window
on the Disassembly window.
– View Auto.
• The FPU Project is setup in a while(1) which will loop for ever. Each time
through, the execution will hit the BREAK point set on Line 111 and STOP
so the results can be viewed.
22
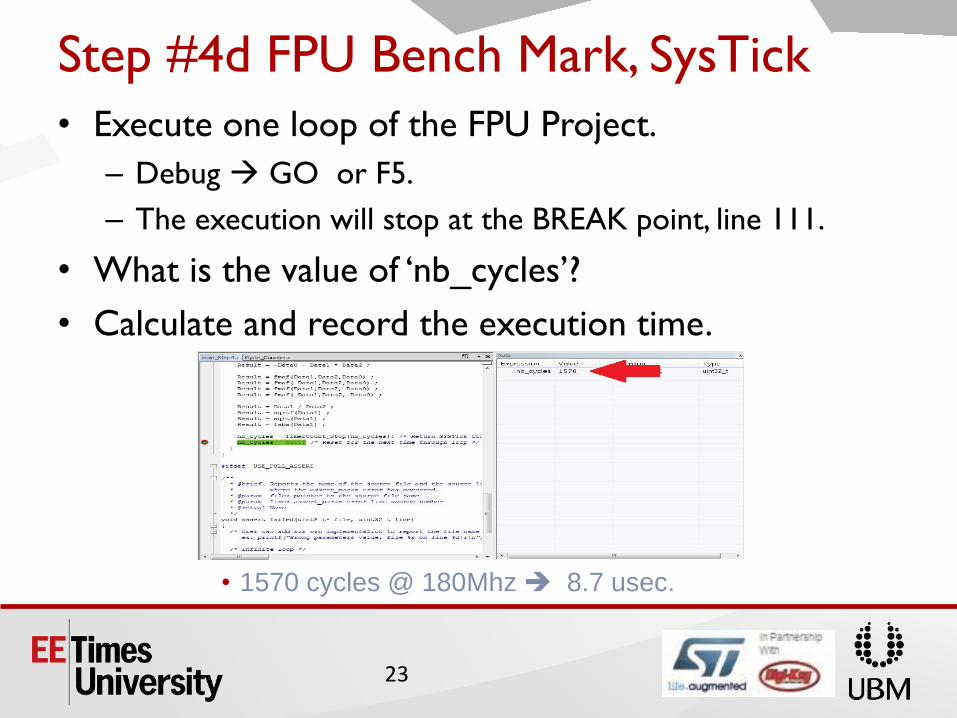
Step #4d FPU Bench Mark, SysTick
• Execute one loop of the FPU Project.
– Debug GO or F5.
– The execution will stop at the BREAK point, line 111.
• What is the value of ‘nb_cycles’?
• Calculate and record the execution time.
• 1570 cycles @ 180Mhz 8.7 usec.
23
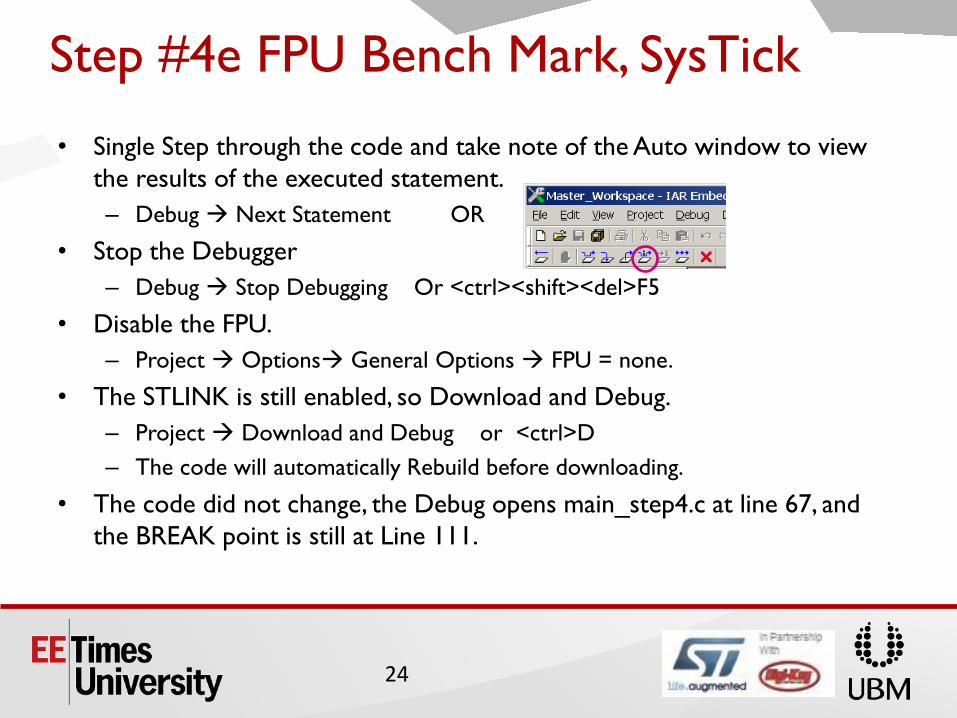
Step #4e FPU Bench Mark, SysTick
• Single Step through the code and take note of the Auto window to view
the results of the executed statement.
– Debug Next Statement OR
• Stop the Debugger
– Debug Stop Debugging Or <ctrl><shift><del>F5
• Disable the FPU.
– Project Options General Options FPU = none.
• The STLINK is still enabled, so Download and Debug.
– Project Download and Debug or <ctrl>D
– The code will automatically Rebuild before downloading.
• The code did not change, the Debug opens main_step4.c at line 67, and
the BREAK point is still at Line 111.
24
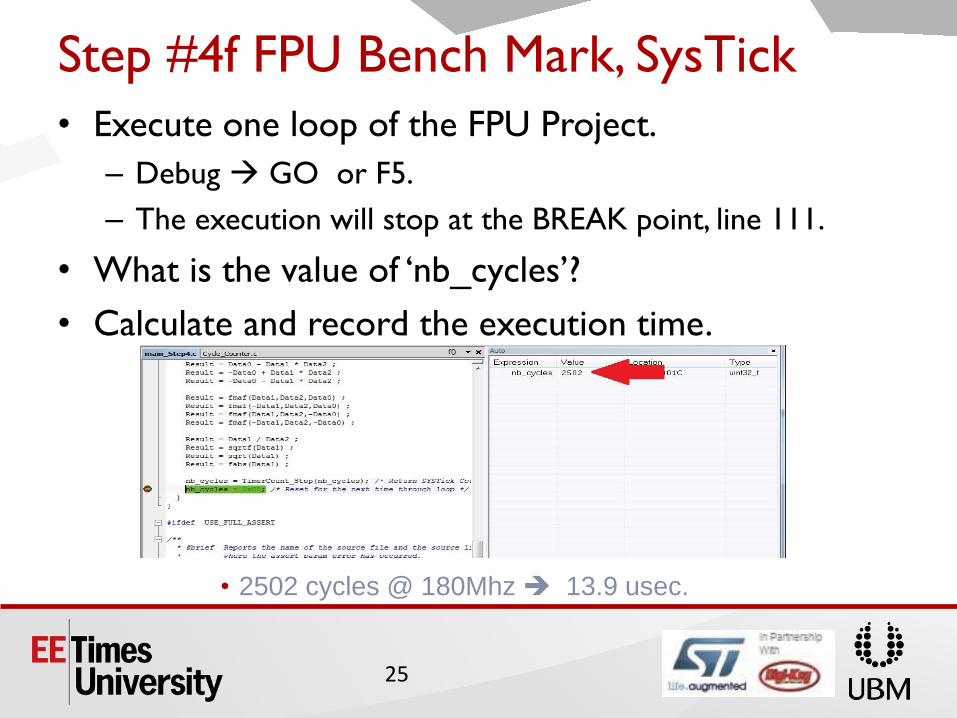
Step #4f FPU Bench Mark, SysTick
• Execute one loop of the FPU Project.
– Debug GO or F5.
– The execution will stop at the BREAK point, line 111.
• What is the value of ‘nb_cycles’?
• Calculate and record the execution time.
• 2502 cycles @ 180Mhz 13.9 usec.
25
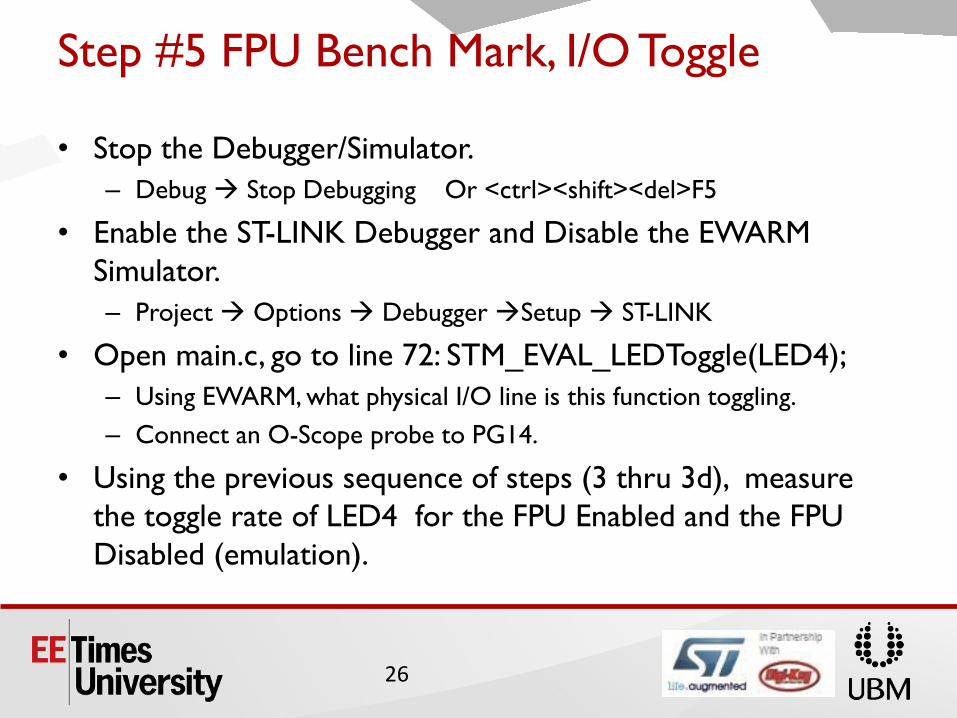
Step #5 FPU Bench Mark, I/O Toggle
• Stop the Debugger/Simulator.
– Debug Stop Debugging Or <ctrl><shift><del>F5
• Enable the ST-LINK Debugger and Disable the EWARM
Simulator.
– Project Options Debugger Setup ST-LINK
• Open main.c, go to line 72: STM_EVAL_LEDToggle(LED4);
– Using EWARM, what physical I/O line is this function toggling.
– Connect an O-Scope probe to PG14.
• Using the previous sequence of steps (3 thru 3d), measure
the toggle rate of LED4 for the FPU Enabled and the FPU
Disabled (emulation).
26
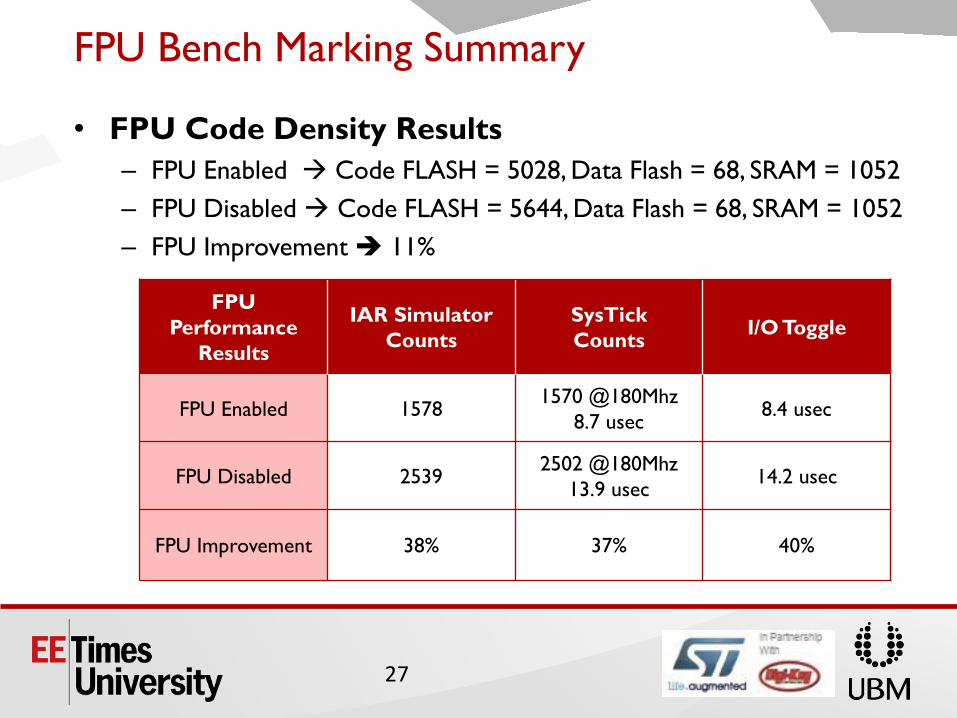
FPU Bench Marking Summary
• FPU Code Density Results
– FPU Enabled Code FLASH = 5028, Data Flash = 68, SRAM = 1052
– FPU Disabled Code FLASH = 5644, Data Flash = 68, SRAM = 1052
– FPU Improvement 11%
FPU
Performance
Results
IAR Simulator
Counts
SysTick
Counts I/O Toggle
FPU Enabled 1578 1570 @180Mhz
8.7 usec 8.4 usec
FPU Disabled 2539 2502 @180Mhz
13.9 usec 14.2 usec
FPU Improvement 38% 37% 40%
27

© 2013 Jacob Beningo, All Rights Reserved
Questions
Contact Info
Jacob Beningo ( [email protected] )
www.beningo.com
Jacob_Beningo
Beningo Engineering
JacobBeningo
Embedded Basics