Embed Size (px)
Citation preview

Fundamentals of Nuclear Power
The Nuclear Fuel Cycle
Osher Lifelong Learning Institute
Spring 2012

Administrative Overhead
Topic for final
(May 9) session?


Primary Energy Sources
• Fossil
– Oil
– Coal
– Gas
• Solar
– Hydroelectric
– Wind
– Biomass
– Direct solar heat
– Photovoltaics
• Non-solar "Renewable" – geothermal, waves, tides
• Nuclear

Secondary Energy Sources ("Carriers")
• Electricity
• Hydrogen – mainly from natural gas or
electrolysis of water
• Alcohols – from wood or other plant
material
• Oil and gas – from coal


Coles Hill, VA
• 7th largest deposit in the world


Coles Hill, VA
• 7th largest deposit in the world
"There will be a dead zone with a 30 mile
radius of the mine. Nothing will grow.
Animals will die. The radiation genetically
alters tissue. Animals will not be able to
reproduce. We'll see malformed fetuses." --
Jack Dunavant, Southside Concerned
Citizens


Mining Techniques
• Open cut or open pit (grade control usually achieved by measuring radioactivity as a surrogate for U concentration)


Mining Techniques
• Open cut or open pit (grade control usually achieved by measuring radioactivity as a surrogate for U concentration)
• Underground (grade control achieved as with open cut)

Mining Techniques
• Open cut or open pit (grade control usually achieved by measuring radioactivity as a surrogate for U concentration)
• Underground (grade control achieved as with open cut)
• In Situ Leach (ISL) – popular in US and Kazakhstan – acid (sulfuric, phosphoric, etc.) or alkaline agent


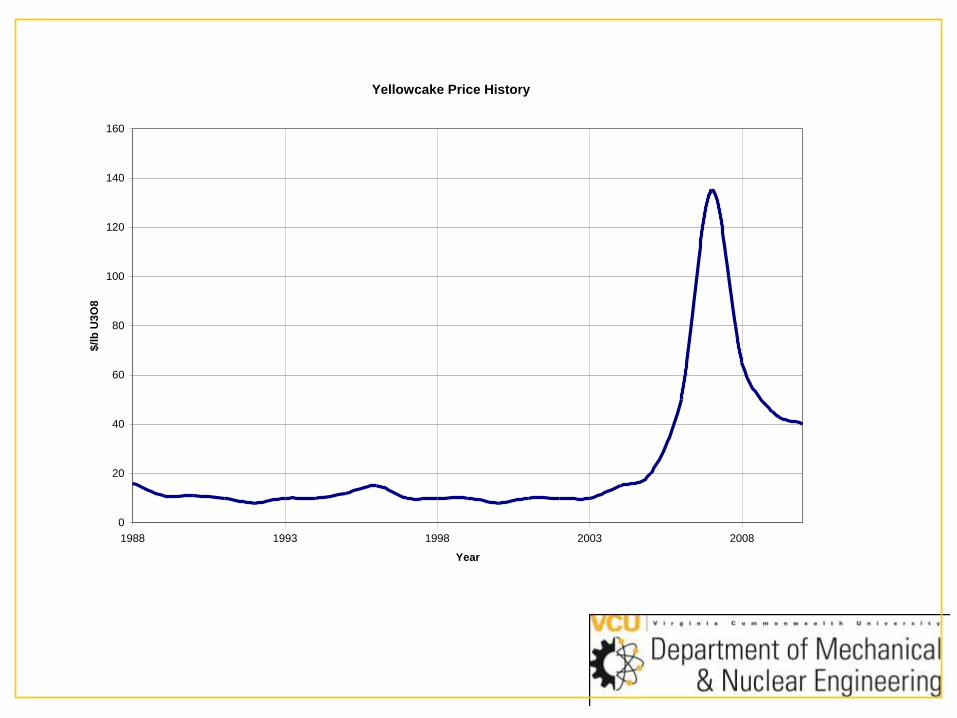
Yellowcake Price History
0
20
40
60
80
100
120
140
160
1988 1993 1998 2003 2008
Year
$/lb
U3O
8

UF6
U in ground
Various
forms
Mining and
Milling
U3O8, etc.
Yellowcake
UF6
UO2
Conversion
Enrichment
Fabrication Natural U
Rx
U in ground
Various
forms
Mining and
Milling
U in ground
Various
forms
U3O8, etc.
Yellowcake
Mining and
Milling
U in ground
Various
forms
U3O8, etc.
Yellowcake
Mining and
Milling
U in ground
Various
forms
Conversion
U3O8, etc.
Yellowcake
Mining and
Milling
U in ground
Various
forms
UF6
Conversion
U3O8, etc.
Yellowcake
Mining and
Milling
U in ground
Various
forms
Enrichment UF6
Conversion
U3O8, etc.
Yellowcake
Mining and
Milling
U in ground
Various
forms
UF6 Enrichment UF6
Conversion
U3O8, etc.
Yellowcake
Mining and
Milling
U in ground
Various
forms
Fabrication
UF6 Enrichment UF6
Conversion
U3O8, etc.
Yellowcake
Mining and
Milling
U in ground
Various
forms
UO2 Fabrication
UF6 Enrichment UF6
Conversion
U3O8, etc.
Yellowcake
Mining and
Milling
U in ground
Various
forms
Natural U
Rx UO2
Fabrication
UF6 Enrichment UF6
Conversion
U3O8, etc.
Yellowcake
Mining and
Milling
U in ground
Various
forms
Natural U
Rx UO2
Fabrication
UF6 Enrichment UF6
Conversion
U3O8, etc.
Yellowcake
Mining and
Milling
U in ground
Various
forms

UF6
• Gas at ~ 60C
• Fluorine has only one isotope
• UF6 exposed to moist air reacts with the water in the air to produce UO2F2 and HF, both of which are highly soluble and toxic.

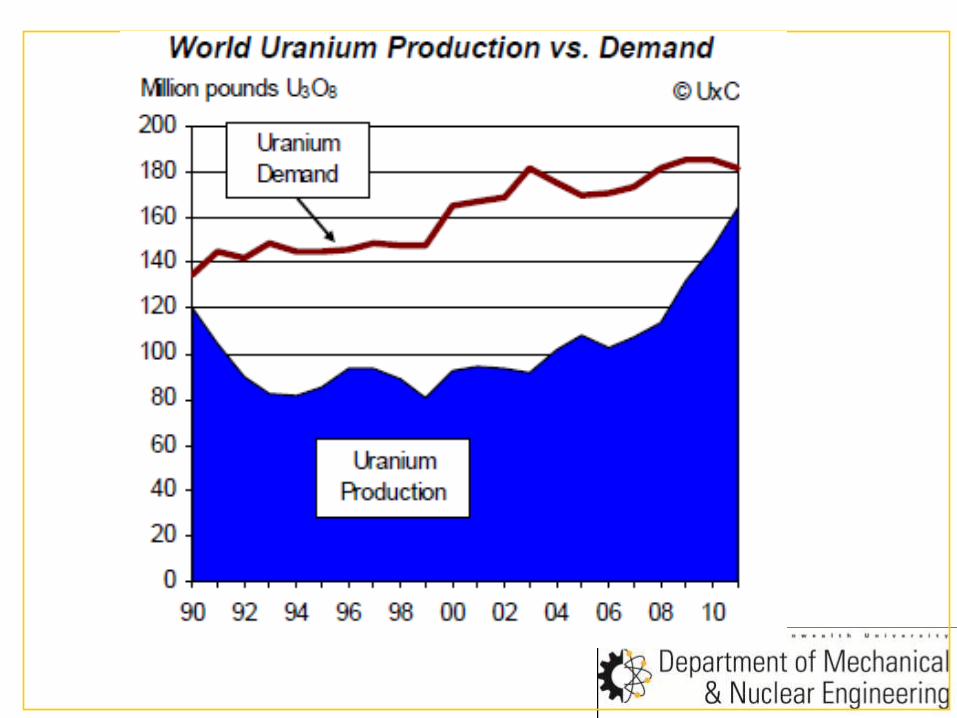
Feed
Product
Tailings
Enrichment


UF6 Storage
• About 95% of depleted U produced to date is stored as
depleted UF6 in steel cylinders in open air yards close to
enrichment plants.
• Each cylinder contains up to 12.7 tons of solid UF6.
• In the U.S. alone, 560,000 tons of depleted UF6 had
accumulated by 1993.
• In 2005, 686,500 tons in 57,122 storage cylinders were
located near Portsmouth, Ohio, Oak Ridge, Tennessee,
and Paducah, Kentucky
• Storage cylinders must be regularly inspected for signs
of corrosion and leaks.
• The estimated life time of the steel cylinders is measured
in decades.

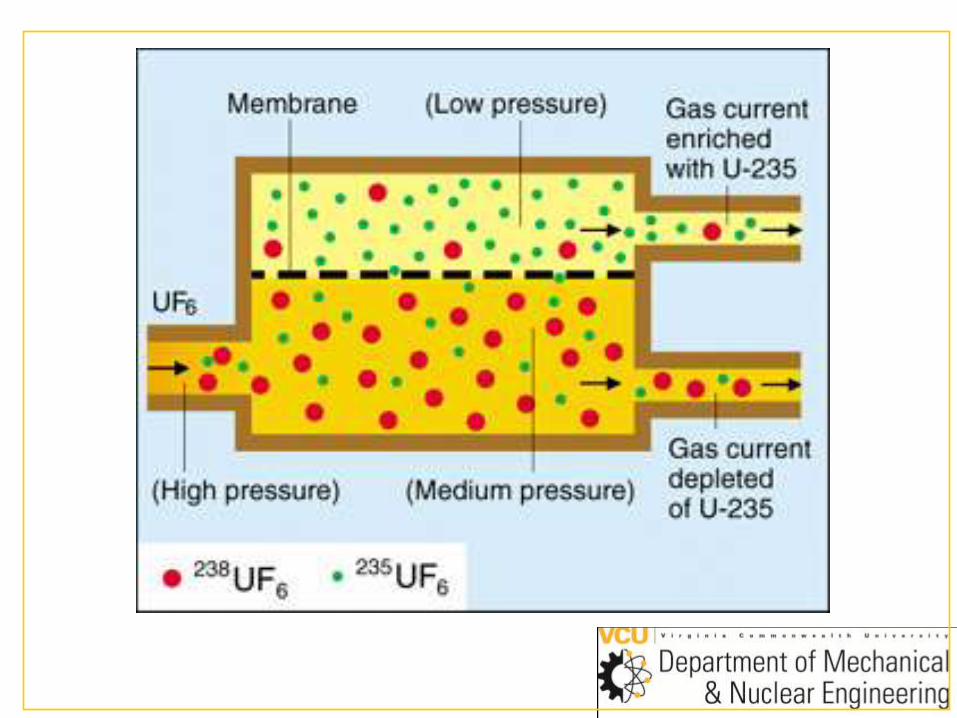
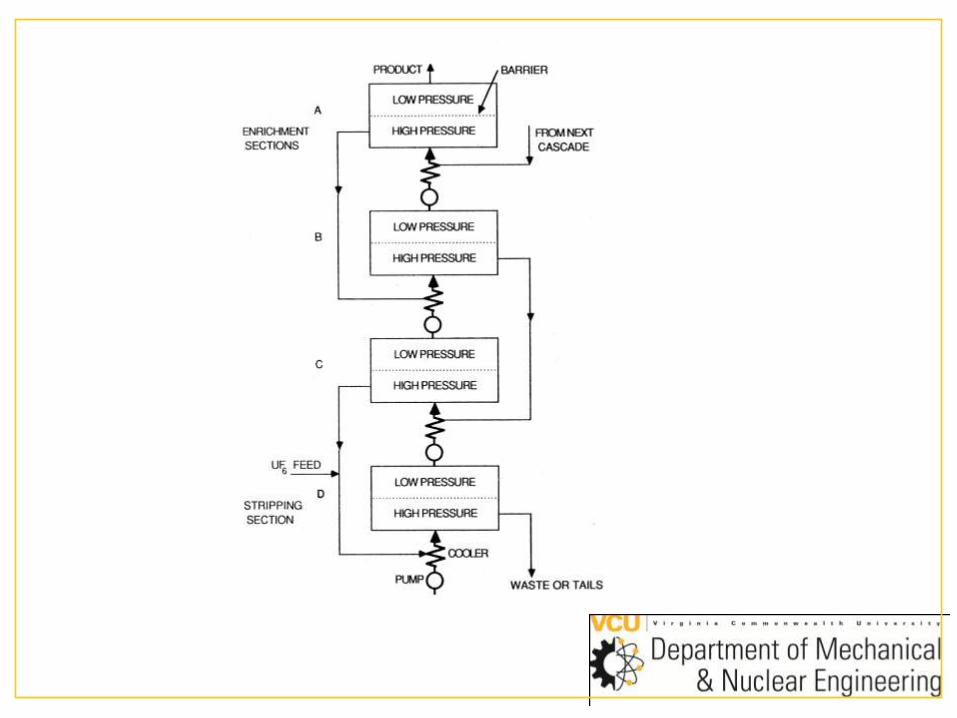
Gaseous Diffusion
• Principal operating cost is electrical power required
• 1950s Oak Ridge, Portsmouth, OH and Paducah, KY
plants
• Only US plant operating today is USEC's Paducah.
• Transferred to private sector 1998
• Capacity 8x10⁶ SWU/y. US reactors need 12.7x10⁶
SWU/y.
• Expected to close once three new plants begin
operation by 2020.
• 2009 – Russia's Tenex contracts with US utilities for
enrichment services starting about 2014

Enriched
exit
Depleted exit
U235 is lighter and
collects in the center
(Enriched)
U238 is heavier and
collects on the outside walls
(Depleted/Tails)
Feed to
Next Stage
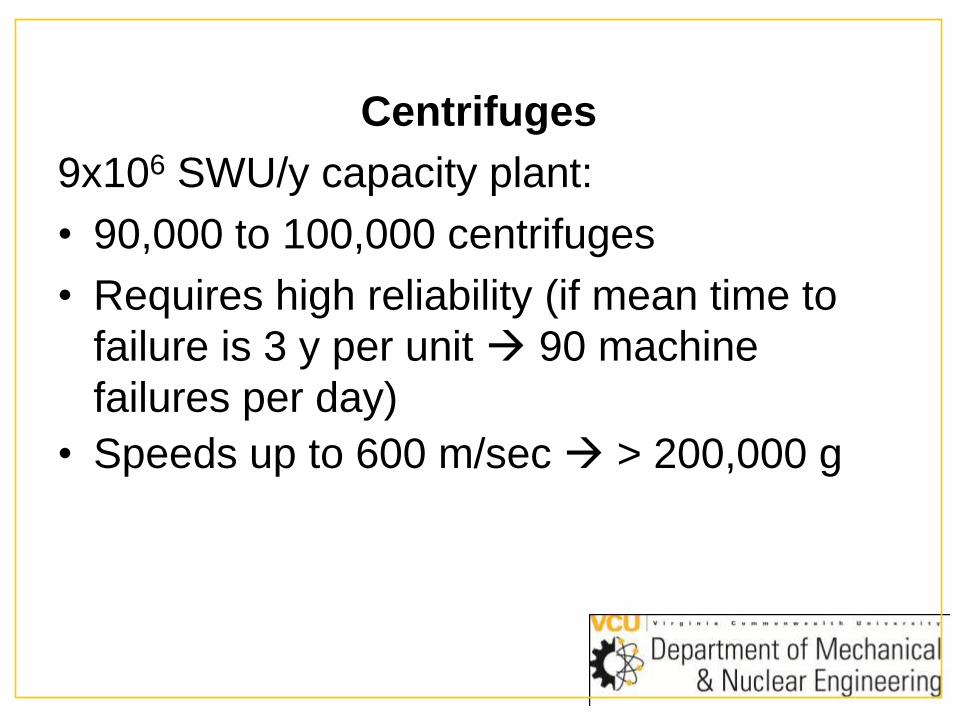
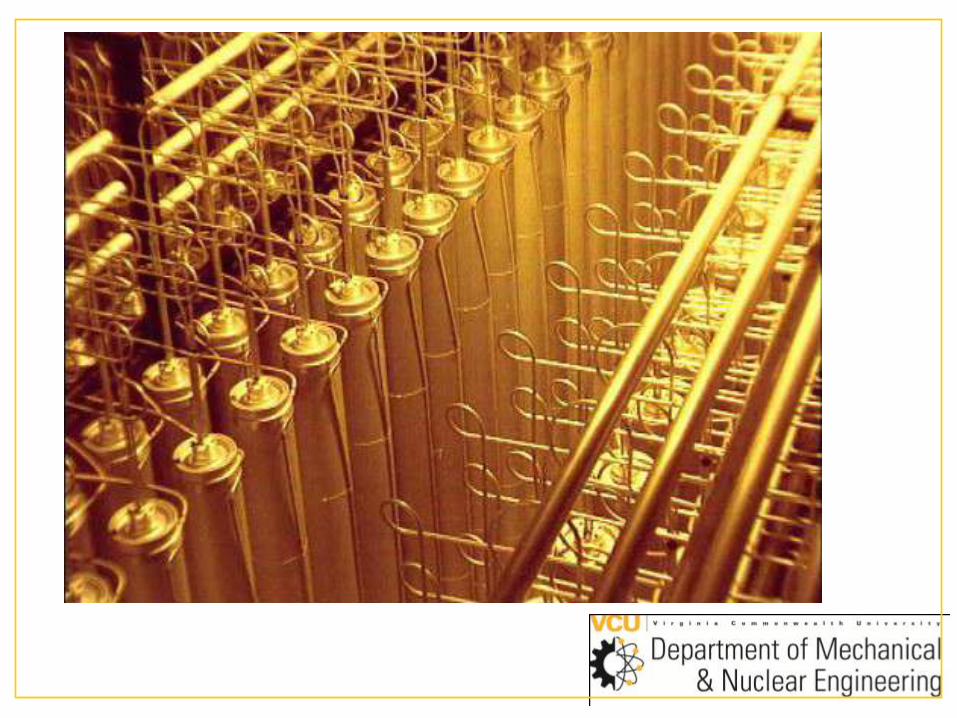
Centrifuges
9x10⁶ SWU/y capacity plant:
• 90,000 to 100,000 centrifuges
• Requires high reliability (if mean time to
failure is 3 y per unit 90 machine
failures per day)
• Speeds up to 600 m/sec > 200,000 g

Stuxnet Worm
• A computer virus that appears to have been
designed specifically to target Iran’s centrifuge
machines so that they spin out of control.
• In November, 2010, Iran admitted that their
centrifuges suffered partial sabotage by a
computer virus
• U.S. or Israel seen as possible developers of
Stuxnet—both governments denied
responsibility.
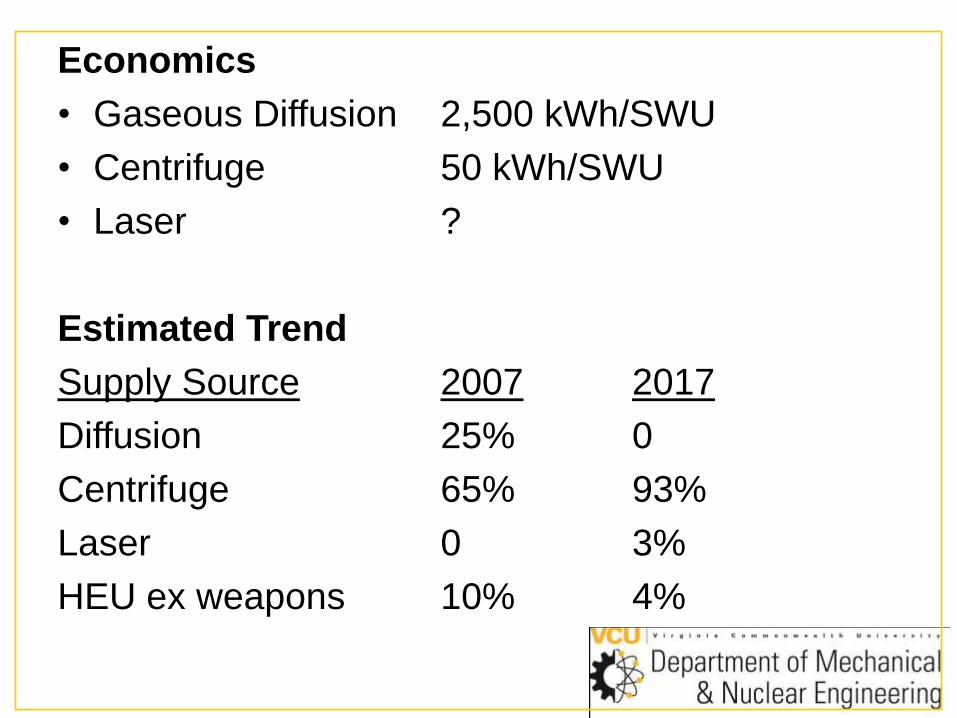
Economics
• Gaseous Diffusion 2,500 kWh/SWU
• Centrifuge 50 kWh/SWU
• Laser ?
Estimated Trend
Supply Source 2007 2017
Diffusion 25% 0
Centrifuge 65% 93%
Laser 0 3%
HEU ex weapons 10% 4%

World Enrichment Capacity – Operational and Planned
(1000 SWU/y)
Country 2005 2015
France 10,800 7,000
Germany-Holland-UK 8,100 12,200
Japan 150 750
USA (USEC Paducah) 11,300 3,800
USA (Urenco, NM) 0 5,900
USA (Areva, ID) 0 >1,000
Russia 20,000 33,000
China 1,000 3,300


Once
Through
Nuclear
Fuel Cycle

Coal vs. Nuclear Waste Comparison • Coal-primary waste output
– 400+ tons of ash per day
– 35,000 tons of CO2 per day
– 250 tons of SO2 per day
– 20 tons of NOx per day
• Nuclear-primary waste output
– 300 m3 low level and mixed waste per YEAR
– 25 tons worth of radioactive spent nuclear fuel assemblies per YEAR

Coal-Fired Plant
• 1000 MWe coal-fired plant burns
10,000 tons of fuel (110 rail cars) per
day
• 5% of burned coal ash
• In mass terms, 20,000 times more
coal is needed than U.


Nuclear Cask Crash Tests
http://www.youtube.com/watch?feature=play
er_detailpage&v=1mHtOW-OBO4#t=9s
http://www.youtube.com/watch?feature=play
er_detailpage&v=1mHtOW-OBO4#t=9s

Sandia National Laboratory Test

Sandia National Laboratory Test
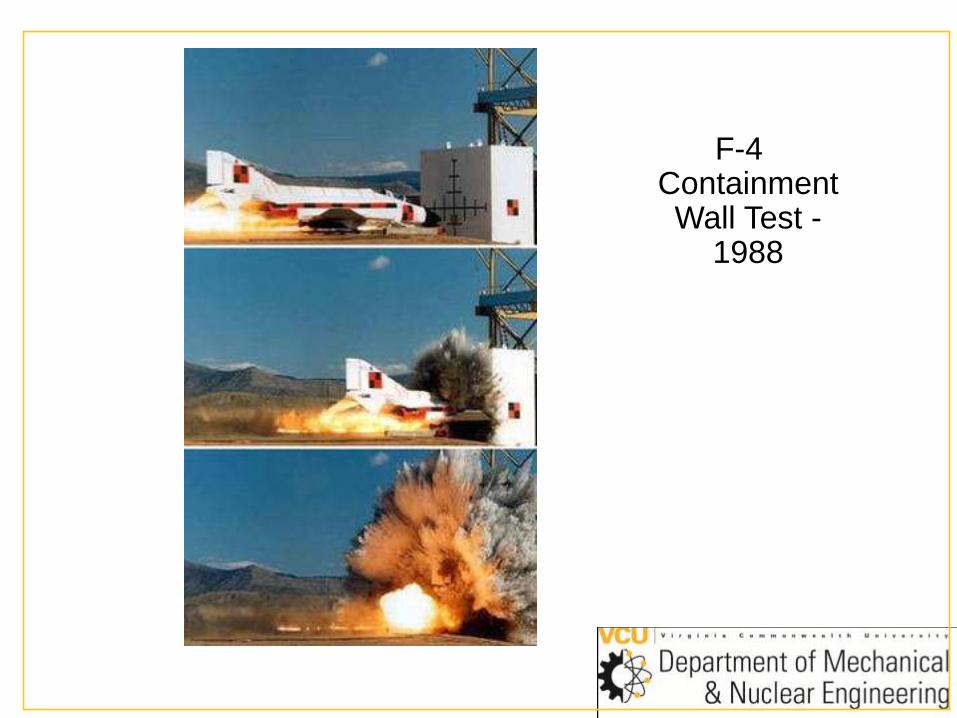
F-4 Containment Wall Test -
1988

Complete Nuclear Fuel
Cycle

• Once-through fuel cycle uses only 5% of
energy in the fuel.

• Once-through fuel cycle uses only 5% of
energy in the fuel.
• Of 290,000 t of used fuel produced over
50 yr, 90,000 has been recycled.

• Once-through fuel cycle uses only 5% of
energy in the fuel.
• Of 290,000 t of used fuel produced over
50 yr, 90,000 has been recycled.
• France Cap la Hague reprocessing facility
capacity = 1,700 t/yr.

• Once-through fuel cycle uses only 5% of
energy in the fuel.
• Of 290,000 t of used fuel produced over
50 yr, 90,000 has been recycled.
• France Cap la Hague reprocessing facility
capacity = 1,700 t/yr.
• 22 of 59 French reactors modified to use
recycled fuel.
• Once-through fuel cycle uses only 5% of
energy in the fuel.
• Of 290,000 t of used fuel produced over
50 yr, 90,000 has been recycled.
• France Cap la Hague reprocessing facility
capacity = 1,700 t/yr.
• 22 of 59 French reactors modified to use
recycled fuel.
• West Valley, NY reprocessing plant
operated 1966-1972.

• Although US ban on recycling was
rationalized in terms of preventing nuclear
proliferation, there was no ban on the US
military manufacturing weapons-grade Pu.

• Although US ban on recycling was
rationalized in terms of preventing nuclear
proliferation, there was no ban on the US
military manufacturing weapons-grade Pu.
• Present economics do not favor recycling.

• Although US ban on recycling was
rationalized in terms of preventing nuclear
proliferation, there was no ban on the US
military manufacturing weapons-grade Pu.
• Present economics do not favor recycling.
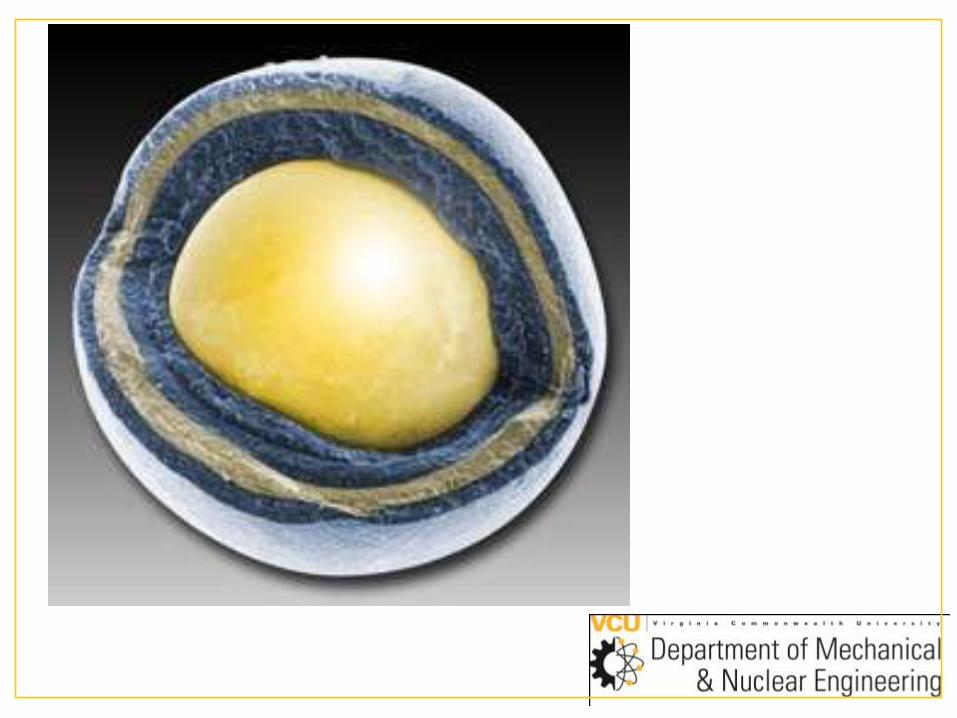
• After 5 to 10 years in spent fuel pool, fuel
can be moved to dry cask storage.

• Although US ban on recycling was
rationalized in terms of preventing nuclear
proliferation, there was no ban on the US
military manufacturing weapons-grade Pu.
• Present economics do not favor recycling.
• After 5 to 10 years in spent fuel pool, fuel
can be moved to dry cask storage.
• 50 years of US used fuel would occupy
football field 22 ft deep. If recycled, its
waste would occupy football field 9 inches
deep.

Thorium
• Insignificant production of long-
lived minor actinides compared to
uranium
• Proliferation resistance due to
hard gamma emitters in U233

Advantages of Thorium (cont.)
• Since U233 has lower mass # compared
to U235 and U238, amount of higher
actinides (Np, Pu, Am, Cm) produced per
unit of energy generated is insignificant
compared to uranium-based fuels.
• Plutonium is completely absent from
thorium fueled reactor waste.


Present Energy Demand and Supply
• Typical US household wired for 24 kW (120 V x 200 A), peak ~15 kW (electric stove/dryer ~ 5 kW each)

Present Energy Demand and Supply
• Typical US household wired for 24 kW (120 V x 200 A), peak ~15 kW (electric stove/dryer ~ 5 kW each)
• Oil production peaked in 1979 and did not return to that level until 1994.

Present Energy Demand and Supply
• Typical US household wired for 24 kW (120 V x 200 A), peak ~15 kW (electric stove/dryer ~ 5 kW each)
• Oil production peaked in 1979 and did not return to that level until 1994.
• Oil consumption is now twice the rate of discovery.

Present Energy Demand and Supply
• Typical US household wired for 24 kW (120 V x 200 A), peak ~15 kW (electric stove/dryer ~ 5 kW each)
• Oil production peaked in 1979 and did not return to that level until 1994.
• Oil consumption is now twice the rate of discovery.
• Transportation of LNG consumes up to 30% of it.
• 1/3 of world’s population does not have access to electricity supply, and another 1/3 does not enjoy reliable supply.
• Electricity demand growing faster than overall energy demand.

Economics
• Green is taken to mean:
– “acceptable” environmental impact, and
– sustainable,
Economics
• Green is taken to mean:
– “acceptable” environmental impact, and
– sustainable,
• Being green is typically associated with an
acceptable degree of environmental risk. The
economic side of the equation is typically
distorted or ignored.

Economics
• Green is taken to mean:
– “acceptable” environmental impact, and
– sustainable,
• Being green is typically associated with an
acceptable degree of environmental risk. The
economic side of the equation is typically
distorted or ignored.
• Green is a relative, not an absolute.

Economics
• Green is taken to mean:
– “acceptable” environmental impact, and
– sustainable.
• Being green is typically associated with an
acceptable degree of environmental risk. The
economic side of the equation is typically
distorted or ignored.
• Green is a relative, not an absolute.
• All energy sources have advantages and
disadvantages.

Economics (cont.)
• All energy sources impact the environment, and
none are indefinitely sustainable.

Economics (cont.)
• All energy sources impact the environment, and
none are indefinitely sustainable.
• An energy source that is “economically
competitive” does not require taxpayer
subsidies.

Economics (cont.)
• All energy sources impact the environment, and
none are indefinitely sustainable.
• An energy sources that is “economically
competitive” does not require taxpayer
subsidies.
• negative externalities – costs of production that
are shifted to non-producers; e.g., factory air
pollution.

Economics (cont.)
• Although it is often stated that today it is
“cheaper” to produce electricity using natural
gas than uranium, the comparison ignores the
greater negative externalities of natural gas
version uranium.

Economics (cont.)
• Although it is often stated that today it is
“cheaper” to produce electricity using natural
gas than uranium, the comparison ignores the
greater negative externalities of natural gas
version uranium.
• Nuclear is the only energy source wherein the
industry accounts for and is held responsible for
all associated costs.

Green Energy
• Small Is Beautiful: Economics As If
People Mattered – E. F. Schumacher,
1973 (associate of Keynes and Galbraith)
• US average solar flux 200 W/m2
• Wind farm – 1000 MWe 600 mi2 (25%
efficiency assumed)

"A Plan to Power 100 Percent of the Planet
with Renewables," Mark Z. Jacobson and
Mark A. Delucchi, Scientific American,
October 26, 2009

• Nuclear less costly than renewables.
• Equivalent solar plant requires
–15concrete
–75steel
–2,530land
Rancho Seco
• Nuclear plant 1975-1989, 913 MWe, 39%
capacity factor, closed by public
referendum
• 2 MWt (?) solar plant (PV1 and PV2)


Gilbert Atomic Energy Lab - 1951
The set came with four types of uranium
ore, a beta-alpha source (Pb-210), a pure
beta source (Ru-106), a gamma source
(Zn-65?), a spinthariscope, a cloud
chamber with its own short-lived alpha
source (Po-210), an electroscope, a geiger
counter, a manual, a comic book
(Dagwood Splits the Atom) and a
government manual "Prospecting for
Uranium."

The Shoreham Saga
• 820 MWe BWR built by Long Island Lighting Company (LILCO)

The Shoreham Saga
• 820 MWe BWR built by Long Island Lighting Company (LILCO)
• Construction permit delayed 3 years by intervenors, including a total imposter claiming to be an expert with a Ph.D. and an M.D.

The Shoreham Saga
• 820 MWe BWR built by Long Island Lighting Company (LILCO)
• Construction permit delayed 3 years by intervenors, including a total imposter claiming to be an expert with a Ph.D. and an M.D.
• 1973-1984 construction
• 1985-1989 low power testing

The Shoreham Saga
• 820 MWe BWR built by Long Island Lighting Company (LILCO)
• Construction permit delayed 3 years by intervenors, including a total imposter claiming to be an expert with a Ph.D. and an M.D.
• 1973-1984 construction
• 1985-1989 low power testing
• Once completed, officials in Suffolk County refused to cooperate with emergency response exercise, making it impossible to comply with NRC requirement.

• NRC finally issued operating license claiming that in the even of an actual accident, officials would cooperate.

• NRC finally issued operating license claiming that in the even of an actual accident, officials would cooperate.
• Mario Cuomo intervenes.
• 1989 – LILCO agrees not to operate the plant with most of the $6 billion cost being passed on to Long Island residents.

• NRC finally issued operating license claiming that in the even of an actual accident, officials would cooperate.
• Mario Cuomo intervenes.
• 1989 – LILCO agrees not to operate the plant with most of the $6 billion cost being passed on to Long Island residents.
• State of New York buys plant for $1. Decommissioned in 1996 at cost of $186 million.
• 1998 – State takes over LILCO, now the Long Island Power Authority.
• Total amount of commercial power generated by Shoreham = ZERO