Embed Size (px)
Citation preview
Funding Guidelines Peer Performance Analysis
University System of Maryland
Morgan State University
St. Mary’s College Of Maryland
December 2005
Table of Contents
Executive Summary ............................................................................................................ 1 Background......................................................................................................................... 2 Refining Funding Guidelines.............................................................................................. 2
Performance Measures.................................................................................................... 3 Assessing Institution Performance.................................................................................. 3 Data Availability............................................................................................................. 4
St. Mary’s College of Maryland Quality Profile ................................................................ 4 Peer Performance Analysis
Bowie State University ................................................................................................. 11 Coppin State University................................................................................................ 15 Frostburg State University ............................................................................................ 19 Salisbury University...................................................................................................... 23 Towson University........................................................................................................ 27 University of Baltimore ................................................................................................ 31 University of Maryland, Baltimore............................................................................... 35 University of Maryland Baltimore County ................................................................... 39 University of Maryland, College Park .......................................................................... 43 University of Maryland Eastern Shore ......................................................................... 47 University of Maryland University College ................................................................. 51 Morgan State University ............................................................................................... 53 St. Mary’s College of Maryland ................................................................................... 57
Appendix A. Methodology for Selecting Performance Peers at the University System of Maryland Institutions .........................................................................................................63 Appendix B. University System of Maryland Operational Definitions for Performance Indicators............................................................................................................................65 Appendix C. Morgan State University Operational Definitions for Performance Indicators ............................................................................................................................................75 Appendix D. St. Mary’s College of Maryland Operational Definitions for Performance Indicators............................................................................................................................79
1
Executive Summary In September 1999, the Maryland Higher Education Commission adopted a peer-based model for the establishment of funding guidelines for the University System of Maryland and Morgan State University. The guidelines are designed to inform the budget process by providing both a funding standard and a basis for comparison between institutions. The basic concept of the funding guidelines is to identify peer institutions that are similar to Maryland institutions on a variety of characteristics. These funding peers are compared to the Maryland institutions to inform resource questions and assess performance. Included in the funding guidelines process is an annual performance accountability component. Each applicable Maryland institution selects 10 performance peers from their list of funding peers. The Commission, in consultation with representatives from the University System of Maryland, Morgan State University, the Department of Budget and Management and the Department of Legislative Services, identified a set of comprehensive, outcome-oriented performance measures to compare Maryland institutions against their performance peers. There are 16 measures for USM institutions and 14 for Morgan. These indicators are consistent with the State’s Managing for Results (MFR) initiative and include indicators for which data are currently available. In some instances, institutions added specific indicators that were more reflective of the institution’s role and mission. Maryland institutions are expected to perform at or above their performance peers on most indicators. Furthermore, Commission staff assessed their performance within the context of the State’s MFR initiative. Commission staff examined trend data and benchmarks for indicators that are comparable to the peer performance indicators. In instances where an institution’s performance is below the performance of its peers, the institution was required to identify actions that it will take to improve. An exception was made for an institution that demonstrates progress towards achieving its benchmarks on related indicators established within the MFR initiative. St. Mary’s College of Maryland participates in the performance assessment process despite the fact that it does not participate in the funding guidelines. St. Mary’s has selected twelve current peers and six aspirant peers on which to base performance. The 26 performance measures are similar to those chosen for the other four-year public institutions and also reflect St. Mary’s role as the State’s only public liberal arts college. This report contains a comprehensive assessment of the performance of each University System of Maryland institution, Morgan State University and St. Mary’s College of Maryland in comparison to their performance peers. The report includes a discussion of the performance measures, criteria used to assess institutional performance, and issues related to data availability. In addition, each institution will be given an opportunity to respond to the Commission’s assessment of its performance in comparison to its peers. Institutional responses and comments are summarized in the analysis section.
2
Background In September 1999, the Maryland Higher Education Commission adopted funding guidelines; a peer-based model designed to inform the budget process by providing both a funding standard and a basis for comparison between institutions. The basic concept of the funding guidelines is to identify peer institutions (i.e. funding peers) that are similar to the Maryland institution (i.e. home institution) in mission, size, program mix, enrollment composition, and other defining characteristics. These funding peers are then compared and contrasted with the Maryland institution. One critical component in determining whether the State’s higher education institutions are performing at the level of their funding peers is performance accountability. To compare performance, the presidents of each Maryland institution (except the University of Maryland, College Park; University of Maryland, Baltimore; and Morgan State University) selected ten performance peers from their list of funding peers. The presidents based this selection on criteria relevant to their specific institutional objectives. The University of Maryland, College Park is measured only against its aspirational peers - those institutions that College Park aspires to emulate in performance and reputation. For the University of Maryland, Baltimore (UMB), composite peers are used to recognize UMB’s status as the State’s public academic health and law university with six professional schools. UMB’s peers include institutions classified by the Carnegie Foundation as Specialized and institutions classified as Doctoral/Research Universities – Extensive institutions. Morgan State University’s performance peers are the same as its funding peers. Appendix A lists the criteria used by each institution to select their performance peers.
Refining Funding Guidelines In fiscal year 2002, for the first time, the Commission provided a report to the General Assembly on the University System of Maryland’s performance relative to their performance peers. The budget committees expressed concern that this report was not comprehensive because the performance indicators did not place enough emphasis on outcome and achievement measures. The Commission, in consultation with a workgroup composed of representatives from the University System of Maryland (USM), the Department of Budget and Management (DBM), the Department of Legislative Services (DLS) and Morgan State University (MSU), identified a set of performance measures to compare Maryland institutions against their performance peers and developed a method to assess institutional performance. Fiscal year 2006 represented the sixth year the funding guidelines influenced the allocation of State resources. As funding guidelines continue to evolve, so too does the assessment of institutional performance. This report contains the sixth comprehensive assessment of the performance of each USM institution, the fifth for Morgan State
3
University and the fourth for St. Mary’s College of Maryland (St. Mary’s) in comparison to their performance peers. A discussion of the performance measures, criteria used to assess institutional performance, and issues related to data availability follow.
Performance Measures There are 16 performance measures for the USM institutions (see Table 1). Not all institutions are required to provide data on all of the measures. There are separate sets of indicators for Maryland’s comprehensive institutions and for the research universities. Furthermore, institutions have the flexibility to add specific indicators that are more reflective of their role and mission. The indicators include retention and graduation rates, and outcome measures such as licensure examination passing rates, the number of faculty awards, and student and employer satisfaction rates. All indicators are consistent with the State’s Managing for Results (MFR) initiative and reflect statewide policy goals. Appendix B lists the operational definitions for each indicator. There are 14 performance measures for Morgan State University (see Table 2). These indicators include retention and graduation rates, student and employer satisfaction rates, and the passing rate on the Praxis II examination (an assessment that measures teacher candidates’ knowledge of the subjects that they will teach). Appendix C lists the operational definitions for Morgan’s indicators.
Assessing Institution Performance
Maryland institutions are expected to perform at or above their performance peers on most indicators. Furthermore, Commission staff assessed institutional performance within the context of the State’s MFR initiative. In general, institutions were expected to make progress towards achieving their benchmarks established within MFR. Commission staff examined trend data and benchmarks for indicators that are comparable to the peer performance indicators. In instances where an institution’s performance is below the performance of its peers, the institution is required to identify actions that it will take to improve performance. An exception will be made for an institution that demonstrates progress towards achieving its benchmarks on related indicators established within MFR. For this report, each institution was given an opportunity to respond to the Commission’s assessment of its performance in comparison to its peers. Institutional responses and comments are summarized in the analysis section of this report.
4
Data Availability It was difficult to obtain nationally comparable outcome-based performance measures. To the extent possible, the measures identified for peer comparisons use data that are verifiable and currently available from national data systems such as the National Center for Education Statistics’ Integrated Postsecondary Education Database Systems (IPEDS), the National Science Foundation, and U.S. News and World Report. Although the National Center for Education Statistics is currently in the process of designing methods to gather outcome-based indicators, many of these data are not readily available. For example, peer data are not available for alumni giving, graduate satisfaction, employers’ satisfaction, and passing rates on several professional licensure examinations. In cases where data are not available through national data systems, Maryland institutions obtained data either directly from their peer institutions or compared its performance to Maryland institutions that are in the same Carnegie classification. It should be noted that for one measure, the pass rate on the Praxis II examination, research suggests that comparisons of pass rates across state lines is not advisable because of major differences in the testing requirements from one state to another. Since each state independently determines the level of performance required for teacher certification, this indicator is useful only for comparing institutional performance to other Maryland institutions. In addition, there are subtle differences between the operational definitions found in this analysis and the definitions used in MFR for several performance indicators. For example, in this analysis, the second-year retention rate and the six-year graduation rate measure the proportion of first-time, full-time degree seeking undergraduate students who either returned to or graduated from the same college or university. In addition, the graduation data used in this analysis are based on the Federal Graduation Rate Survey (GRS), a federal initiative that collects data required by the Student Right-to-Know Act of 1990. In contrast, MFR captures students who re-enroll or graduate from the same institution as well as those students who transfer to any Maryland public four-year institution. Because of these subtle differences, it was not possible to assess institutional performance on retention and graduation within the context of MFR. Despite the overall difficulties in obtaining nationally comparable performance measures, institutions were expected to take appropriate steps to collect data on all performance measures. In the analysis section of this report, institutions were asked to identify the actions that they are taking to collect data.
St. Mary’s College of Maryland Quality Profile St. Mary’s College of Maryland’s general fund appropriation is determined by a statutory formula and not through the funding guideline process. However, the college expressed interest in providing a set of institutions for the purpose of assessing its performance as the State’s only public liberal arts college. Due to its unique characteristic as a public,
5
liberal arts college offering only Baccalaureate degrees, St. Mary’s is categorized as a Baccalaureate Colleges – Liberal Arts institution. Of the approximately 163 institutions in this category, only a small number of institutions are public. Therefore, along with a small group of public institutions with a liberal arts mission, the comparison group for St. Mary’s includes private institutions. St. Mary’s peer group includes twelve current peers and six aspirant peers. The aspirant peers represent those institutions that St. Mary’s aspires to emulate in performance and reputation. Of the twelve current peers, four are public. All of the aspirant peers are private institutions. The college used the following attributes to identify similar institutions: size, minority enrollment, distribution of bachelor’s and master’s degrees awarded, distribution of degrees awarded by broad discipline area, proportion of part-time students, location, tuition and fees, and revenue and expenditure data. In addition, St. Mary’s examined additional factors to select its peers, including: the academic attributes of new freshmen, the proportion of graduates pursuing graduate or professional education, the existence of a senior project requirement; and the value of the institution’s endowment. St. Mary’s chose performance measures that mirrored those chosen by the other State public institutions as well as measures that reflect the college’s particular role in the State’s system of higher education. There are 26 performance measures for St. Mary’s College of Maryland including many descriptive indicators (see Table 3). These indicators include retention and graduation rates, faculty salaries, student/faculty ratio, and library holdings. Appendix D details the operational definitions.
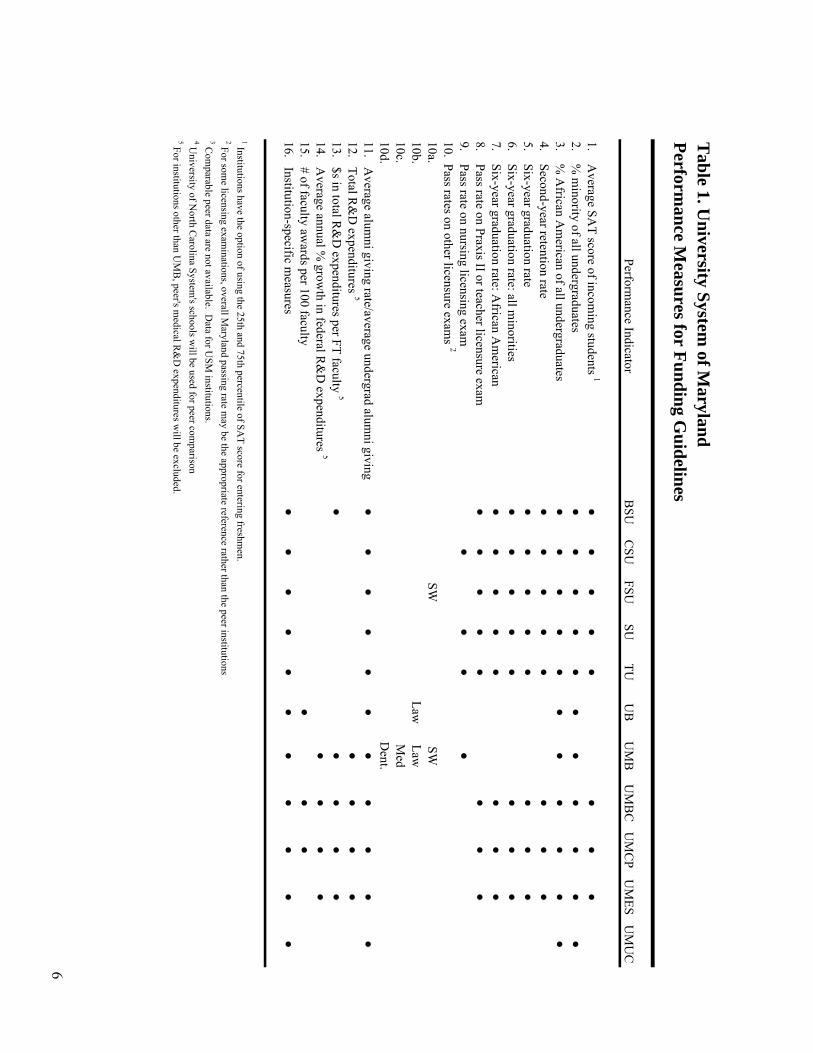
Table 1. U
niversity System of M
arylandPerform
ance Measures for Funding G
uidelines
Performance Indicator
BSU
CSU
FSUSU
TUU
BU
MB
UM
BC
UM
CP
UM
ESU
MU
C
1. Average SA
T score of incoming students 1
●●
●●
●
●
●●
2. % m
inority of all undergraduates●
●●
●●
●●
●●
●●
3. % A
frican Am
erican of all undergraduates●
●●
●●
●●
●●
●●
4. Second-year retention rate●
●●
●●
●●
●5. Six-year graduation rate
●●
●●
●●
●●
6. Six-year graduation rate: all minorities
●●
●●
●●
●●
7. Six-year graduation rate: African A
merican
●●
●●
●●
●●
8. Pass rate on Praxis II or teacher licensure exam●
●●
●●
●●
●9. Pass rate on nursing licensing exam
●●
●●
10. Pass rates on other licensure exams 2
10a.SW
SW10b.
LawLaw
10c.M
ed10d.
Dent.
11. Average alum
ni giving rate/average undergrad alumni giving
●●
●●
●●
●●
●●
●12. Total R
&D
expenditures 5●
●●
●13. $s in total R
&D
expenditures per FT faculty 5●
●●
●●
14. Average annual %
growth in federal R
&D
expenditures 5●
●●
●15. # of faculty aw
ards per 100 faculty●
●●
16. Institution-specific measures
●●
●●
●●
●●
●●
●
1 Institutions have the option of using the 25th and 75th percentile of SAT score for entering freshm
en.2 For som
e licensing examinations, overall M
aryland passing rate may be the appropriate reference rather than the peer institutions
3 Com
parable peer data are not available. Data for U
SM institutions.
4 University of N
orth Carolina System
's schools will be used for peer com
parison5 For institutions other than U
MB
, peer's medical R
&D
expenditures will be excluded.
6
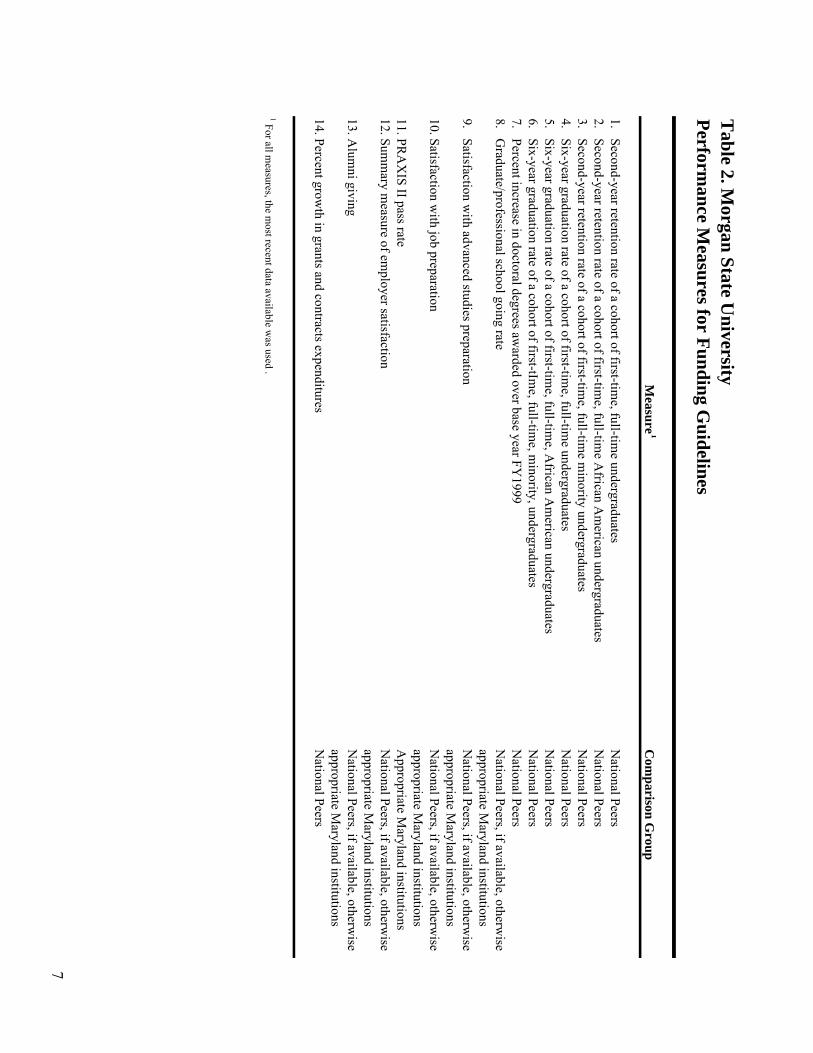
Table 2. M
organ State University
Com
parison Group
1. Second-year retention rate of a cohort of first-time, full-tim
e undergraduates N
ational Peers2. Second-year retention rate of a cohort of first-tim
e, full-time A
frican Am
erican undergraduatesN
ational Peers3. Second-year retention rate of a cohort of first-tim
e, full-time m
inority undergraduatesN
ational Peers4. Six-year graduation rate of a cohort of first-tim
e, full-time undergraduates
National Peers
5. Six-year graduation rate of a cohort of first-time, full-tim
e, African A
merican undergraduates
National Peers
6. Six-year graduation rate of a cohort of first-tIme, full-tim
e, minority, undergraduates
National Peers
7. Percent increase in doctoral degrees awarded over base year FY
1999N
ational Peers8. G
raduate/professional school going rateN
ational Peers, if available, otherwise
appropriate Maryland institutions
9. Satisfaction with advanced studies preparation
National Peers, if available, otherw
iseappropriate M
aryland institutions10. Satisfaction w
ith job preparation N
ational Peers, if available, otherwise
appropriate Maryland institutions
11. PRA
XIS II pass rate
Appropriate M
aryland institutions12. Sum
mary m
easure of employer satisfaction
National Peers, if available, otherw
iseappropriate M
aryland institutions13. A
lumni giving
National Peers, if available, otherw
iseappropriate M
aryland institutions14. Percent grow
th in grants and contracts expendituresN
ational Peers
1 For all measures, the m
ost recent data available was used .
Measure
1
Performance M
easures for Funding Guidelines
7
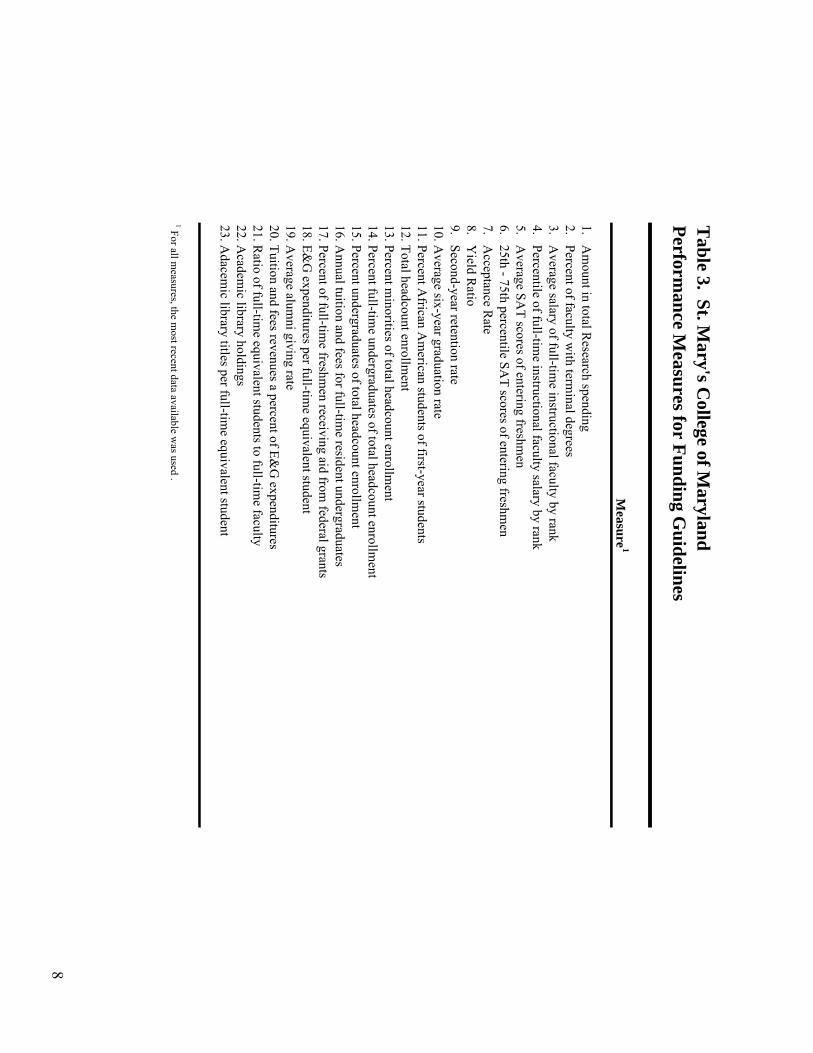
Table 3. St. M
ary's College of M
arylandPerform
ance Measures for Funding G
uidelines
1. Am
ount in total Research spending
2. Percent of faculty with term
inal degrees3. A
verage salary of full-time instructional faculty by rank
4. Percentile of full-time instructional faculty salary by rank
5. Average SA
T scores of entering freshmen
6. 25th - 75th percentile SAT scores of entering freshm
en7. A
cceptance Rate
8. Yield R
atio9. Second-year retention rate10. A
verage six-year graduation rate11. Percent A
frican Am
erican students of first-year students12. Total headcount enrollm
ent13. Percent m
inorities of total headcount enrollment
14. Percent full-time undergraduates of total headcount enrollm
ent15. Percent undergraduates of total headcount enrollm
ent16. A
nnual tuition and fees for full-time resident undergraduates
17. Percent of full-time freshm
en receiving aid from federal grants
18. E&G
expenditures per full-time equivalent student
19. Average alum
ni giving rate20. Tuition and fees revenues a percent of E&
G expenditures
21. Ratio of full-tim
e equivalent students to full-time faculty
22. Academ
ic library holdings23. A
dacemic library titles per full-tim
e equivalent student
1 For all measures, the m
ost recent data available was used .
Measure
1
8
9
Peer Performance Analysis

10
11
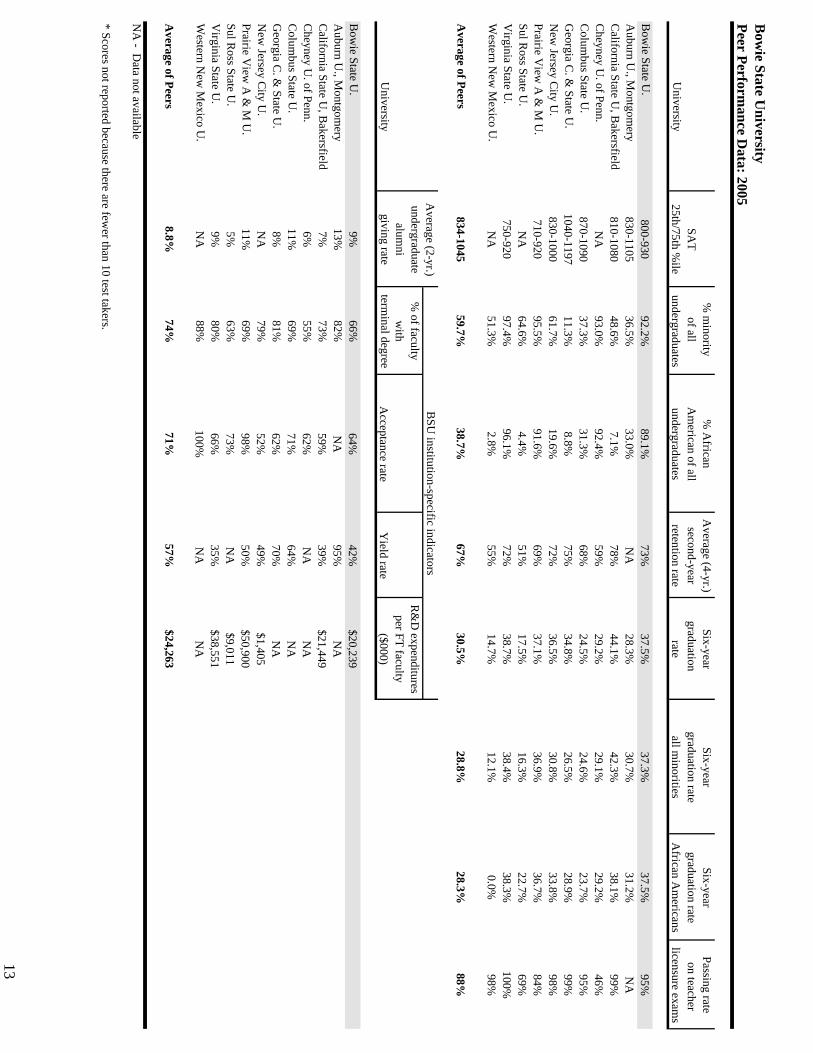
Bowie State University Bowie State University exceeds the performance of its peers on a number of performance measures. The university’s six-year graduation rate exceeds the average of its peer institutions. Its second-year retention rate is also higher than the peer average. The percentage of minority and African American undergraduate students attending the institution significantly exceeds the peer average. These student populations also have higher six-year graduation rates. The university reports a 95 percent pass rate on the Praxis exam, an improvement over last year’s rate. The university’s alumni giving rate has dropped to the peer average. Bowie selected four institution-specific indicators: the percent of faculty with terminal degrees, acceptance rate, yield rate (enrollment rate), and research and development (R&D) expenditures per full-time faculty. The university’s percent of faculty with terminal degrees remains at 66 percent for 2005, slightly below the peer average. The university’s average acceptance rate has improved to 64 percent, however the yield rate dropped to 42 percent and is below the peer average. The university’s level of expenditures for research and development per full-time faculty rose by $2 million from the previous year, but is below the peer average. In this case, however, only five of its peers reported expenditures in this area. Commission staff notes that Bowie has achieved almost compete reporting for this year’s data. This is a significant improvement over prior year submissions. Institution’s Response Bowie State University’s strategy to significantly improve its performance relative to its national peer has continued. However, there are a few areas in which we have intensified our efforts to meet or exceed our national peers. More specifically, the four institution-specific indicators have taken priority in our improvement efforts that are below our national peers are: Alumni giving rate The office of alumni relations and the entire development office have developed several initiatives designed to improve institutional performance in this area relative to our national peers. Among the more promising are: • Encouraging each graduating senior to provide an alumni donation as a gift to the
university upon graduation. This effort is a part of an overall class gifts project. • Organized more graduation anniversary class associations with a major of objective
to provide a monetary gift to the university as a collective. • Promote the development of a pre-alumni council as a means of cultivating the
seeds of an expanded annual giving program for the future alumni.
12
The university expects that these and our strategic initiatives will enable the university to meet or exceed the mean amongst our national peers in the area of Alumni giving. Percent of faculty with terminal degree Percent of full-time faculty is 68 percent. However we have intensified our recruitment of new terminal degreed core faculty. To date, we were very successful in the recruitment of new faculty for the fall 2005 semester. The percentage of new faculty with terminal degrees exceeded 85 percent. Already, prospective new hires exceed 95 percent. Consequently, we are anticipating a significant improvement on this measure. New Student Recruitment Yield rate Bowie’s resulting yield rate is 42 percent, as indicated in the peer performance data. Even though we are below our target of 50 percent it is an improvement. Our intensified initiatives to significantly improve this measure include: • Increase institutional aid to facilitate increased financial aid packages for needy
students. • Seek alternative sources of housing address to strong demand for housing. • Implement expanded and earlier placement test opportunities for new students. • Technical improvements to the application module components in the PeopleSoft
system Expenditures for research and development per full-time faculty The university has made improvements in the facilitation of grant writing for full -time faculty. Included in this initiative are incentives that will encourage more faculty grant writing. In addition, our faculty recruitment efforts are targeted to senior faculty with substantial granting writing portfolios and junior faculty with research and grant writing goals. We expect that our efforts will yield positive returns that meet or exceed the mean of our national peers.
% m
inority %
African
Average (4-yr.)
Six-yearSix-year
Six-yearPassing rate
SAT
of all A
merican of all
second-yeargraduation
graduation rategraduation rate
on teacherU
niversity25th/75th %
ileundergraduates
undergraduatesretention rate
rateall m
inoritiesA
frican Am
ericanslicensure exam
s
Bow
ie State U.
800-93092.2%
89.1%73%
37.5%37.3%
37.5%95%
Auburn U
., Montgom
ery830-1105
36.5%33.0%
NA
28.3%30.7%
31.2%N
AC
alifornia State U, B
akersfield810-1080
48.6%7.1%
78%44.1%
42.3%38.1%
99%C
heyney U. of Penn.
NA
93.0%92.4%
59%29.2%
29.1%29.2%
46%C
olumbus State U
.870-1090
37.3%31.3%
68%24.5%
24.6%23.7%
95%G
eorgia C. &
State U.
1040-119711.3%
8.8%75%
34.8%26.5%
28.9%99%
New
Jersey City U
.830-1000
61.7%19.6%
72%36.5%
30.8%33.8%
98%Prairie V
iew A
& M
U.
710-92095.5%
91.6%69%
37.1%36.9%
36.7%84%
Sul Ross State U
.N
A64.6%
4.4%51%
17.5%16.3%
22.7%69%
Virginia State U
.750-920
97.4%96.1%
72%38.7%
38.4%38.3%
100%W
estern New
Mexico U
.N
A51.3%
2.8%55%
14.7%12.1%
0.0%98%
Average of Peers
834-104559.7%
38.7%67%
30.5%28.8%
28.3%88%
Average (2-yr.)
undergraduate%
of facultyR
&D
expendituresalum
niw
ithper FT faculty
Universit y
giving rateterm
inal degreeA
cceptance rateY
ield rate($000)
Bow
ie State U.
9%66%
64%42%
$20,239A
uburn U., M
ontgomery
13%82%
NA
95%N
AC
alifornia State U, B
akersfield7%
73%59%
39%$21,449
Cheyney U
. of Penn.6%
55%62%
NA
NA
Colum
bus State U.
11%69%
71%64%
NA
Georgia C
. & State U
.8%
81%62%
70%N
AN
ew Jersey C
ity U.
NA
79%52%
49%$1,405
Prairie View
A &
M U
.11%
69%98%
50%$50,900
Sul Ross State U
.5%
63%73%
NA
$9,011V
irginia State U.
9%80%
66%35%
$38,551W
estern New
Mexico U
.N
A88%
100%N
AN
A
Average of Peers
8.8%74%
71%57%
$24,263
NA
- Data not available
* Scores not reported because there are fewer than 10 test takers.
BSU
institution-specific indicators
Bow
ie State University
Peer Performance D
ata: 2005
13

14
15
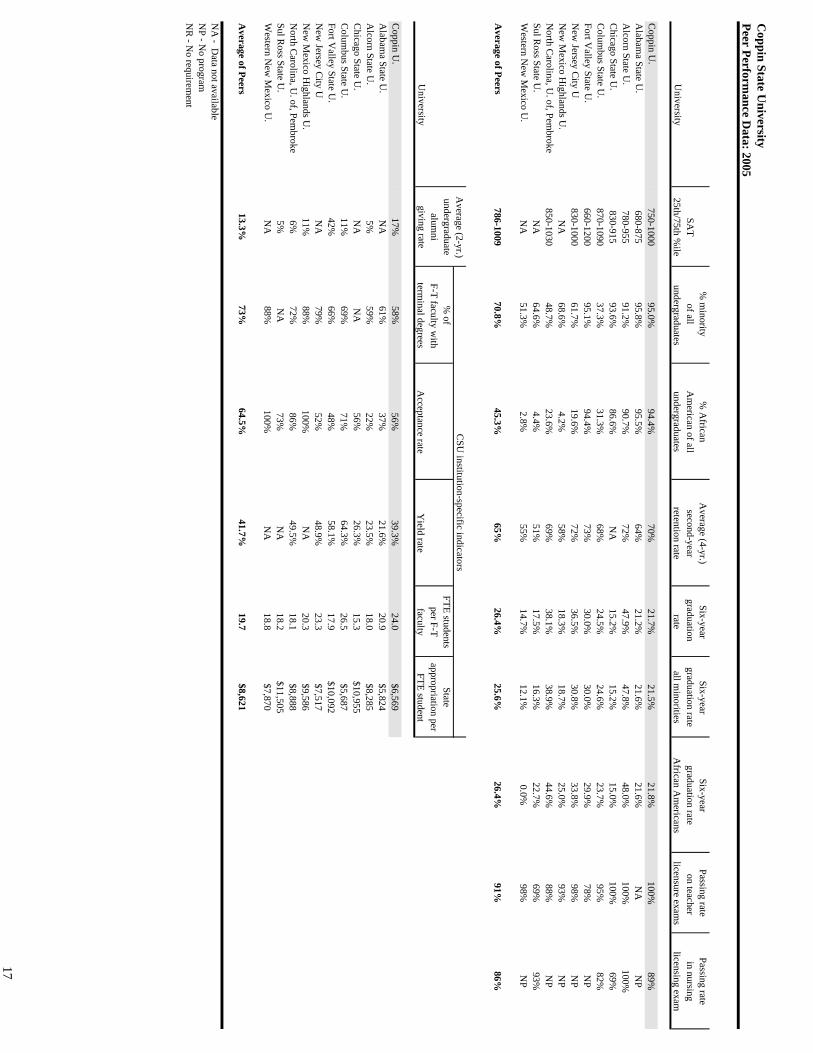
Coppin State University Coppin State University’s performance on a number of indicators meets or exceeds its peer average. Compared to its peers, Coppin State University has the third highest second-year retention rate. Although the rate has fallen slightly, it remains above the average of its peers. In addition, the percentage of minority and African American undergraduate students attending the institution is well above the peer average. In terms of the institution’s effectiveness in preparing teaching and nursing students, Coppin’s percentage of students passing the certification exams are above the peer averages and have improved over last year. The university’s average undergraduate alumni giving rate is also above the peer average. Conversely, the university underperforms the average of its peers on SAT scores for entering freshmen. Furthermore, Coppin’s six-year graduation rates have slipped from 28.3 percent in 2004 to 21.7 percent in 2005 for all students, from 28.1 percent in 2004 to 21.5 percent in 2005 for minority students, and from 28.1 percent in 2004 to 21.8 percent in 2005 for African American students, while its peers have not progressed in this area. The university added five institution-specific indicators: percent of full-time faculty with terminal degrees, acceptance rate, yield rate, student to faculty ratio, and the state appropriation per full-time equivalent student. Although these are primarily descriptive measures, they provide an indication of the type of student population attending the institution. For example, approximately 58 percent of full-time faculty at Coppin hold terminal degrees, which is below the peer average. Furthermore, the acceptance and yield rates are both lower than the respective peer averages. Coppin has a higher student to faculty ratio than the majority of its peers. Compared to its peers, Coppin has a lower state appropriation per FTE student. Coppin has done an excellent job in eliminating missing data from its submission. For example, Coppin only has a maximum of four missing data in one measure, SAT scores. However, for the percentage of students passing the nursing exam, data are available for only four of Coppin’s peer institutions while five peer institutions have no nursing program at all. Institution’s Response The 2005 Peer Performance Report contains ten core performance measures common to all 11 peer institutions. Given the uniqueness of urban education, it is difficult to obtain common performance measures in this area from the University’s institutional peers. In addition to the ten common core performance measures, CSU selected an additional five supplementary measures. Overall, among the common core performance measures, the University has made incredible progress academically in these performance measures and will continue to maintain high standards of academic excellence in teaching, urban research, and public service. Coppin’s performance meets or exceeds its institutional peers in six out of the
16
ten performance measures. Coppin State is close to meeting the peer average in the remaining four measures. Most striking, Coppin ranks first in passing rate in teacher licensure exams, ranks second in alumni giving rate and percentage of African American undergraduates, and ranks third in percentage of minority undergraduates, second-year retention rate, and passing rate on nursing licensing exam. Perhaps most significant, while Coppin ranks second in FTE students per FT faculty, Coppin ranks ninth among its institutional peers in State appropriation per FTE student, about $2,000 below the institutional peer average, and almost $5,000 difference between Coppin and the highest state funded institution.
Coppin State U
niversityPeer Perform
ance Data: 2005
% m
inority %
African
Average (4-yr.)
Six-yearSix-year
Six-yearPassing rate
Passing rateSA
Tof all
Am
erican of allsecond-year
graduation graduation rate
graduation rate on teacher
in nursingU
niversity25th/75th %
ileundergraduates
undergraduatesretention rate
rateall m
inoritiesA
frican Am
ericanslicensure exam
slicensing exam
Coppin U
.750-1000
95.0%94.4%
70%21.7%
21.5%21.8%
100%89%
Alabam
a State U.
680-87595.8%
95.5%64%
21.2%21.6%
21.6%N
AN
PA
lcorn State U.
780-95591.2%
90.7%72%
47.9%47.8%
48.0%100%
100%C
hicago State U.
830-91593.6%
86.6%N
A15.2%
15.2%15.0%
100%69%
Colum
bus State U.
870-109037.3%
31.3%68%
24.5%24.6%
23.7%95%
82%Fort V
alley State U.
660-120095.1%
94.4%73%
30.0%30.0%
29.9%78%
NP
New
Jersey City U
.830-1000
61.7%19.6%
72%36.5%
30.8%33.8%
98%N
PN
ew M
exico Highlands U
.N
A68.6%
4.2%58%
18.3%18.7%
25.0%93%
NP
North C
arolina, U. of, Pem
broke850-1030
48.7%23.6%
69%38.1%
38.9%44.6%
88%N
PSul R
oss State U.
NA
64.6%4.4%
51%17.5%
16.3%22.7%
69%93%
Western N
ew M
exico U.
NA
51.3%2.8%
55%14.7%
12.1%0.0%
98%N
P
Average of Peers
786-100970.8%
45.3%65%
26.4%25.6%
26.4%91%
86%
Average (2-yr.)
undergraduate%
ofFTE students
Statealum
niF-T faculty w
ithper F-T
appropriation perU
niversitygiving rate
terminal degrees
Acceptance rate
Yield rate
facultyFTE student
Coppin U
.17%
58%56%
39.3%24.0
$6,569A
labama State U
.N
A61%
37%21.6%
20.9$5,824
Alcorn State U
.5%
59%22%
23.5%18.0
$8,285C
hicago State U.
NA
NA
56%26.3%
15.3$10,955
Colum
bus State U.
11%69%
71%64.3%
26.5$5,687
Fort Valley State U
.42%
66%48%
58.1%17.9
$10,092N
ew Jersey C
ity U.
NA
79%52%
48.9%23.3
$7,517N
ew M
exico Highlands U
.11%
88%100%
NA
20.3$9,586
North C
arolina, U. of, Pem
broke6%
72%86%
49.5%18.1
$8,888Sul R
oss State U.
5%N
A73%
NA
18.2$11,505
Western N
ew M
exico U.
NA
88%100%
NA
18.8$7,870
Average of Peers
13.3%73%
64.5%41.7%
19.7$8,621
NA
- Data not available
NP - N
o programN
R - N
o requirement
CSU
institution-specific indicators
17

18
19
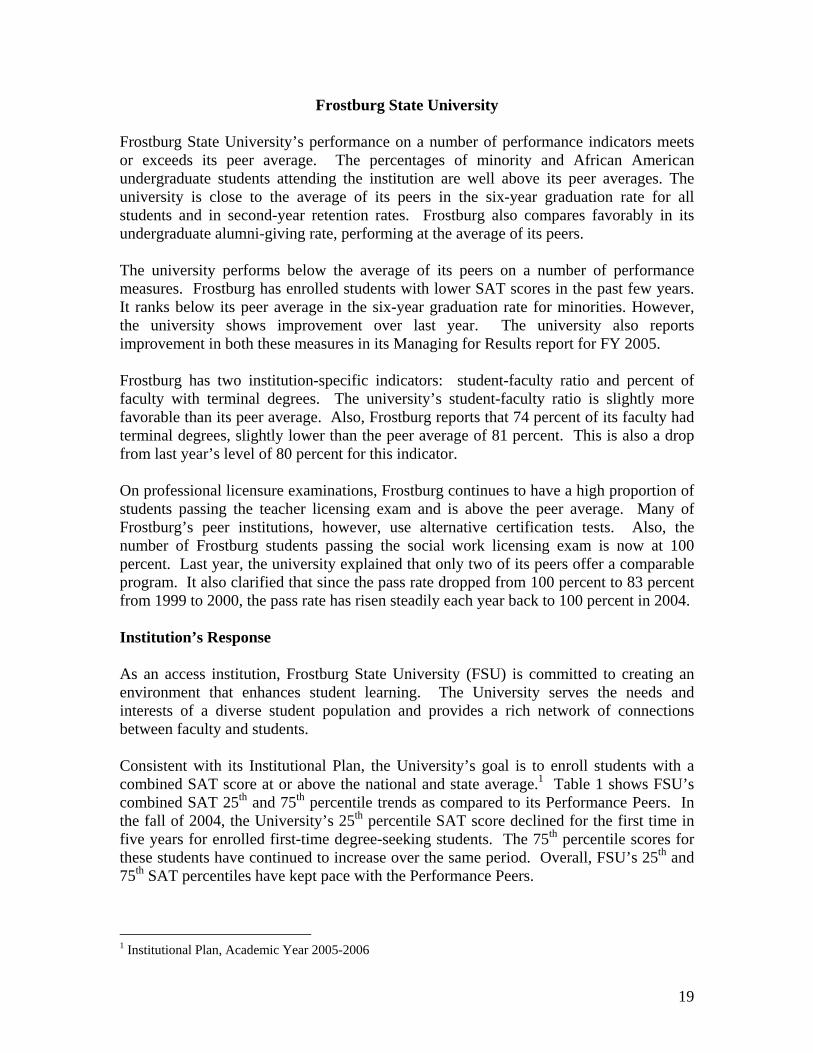
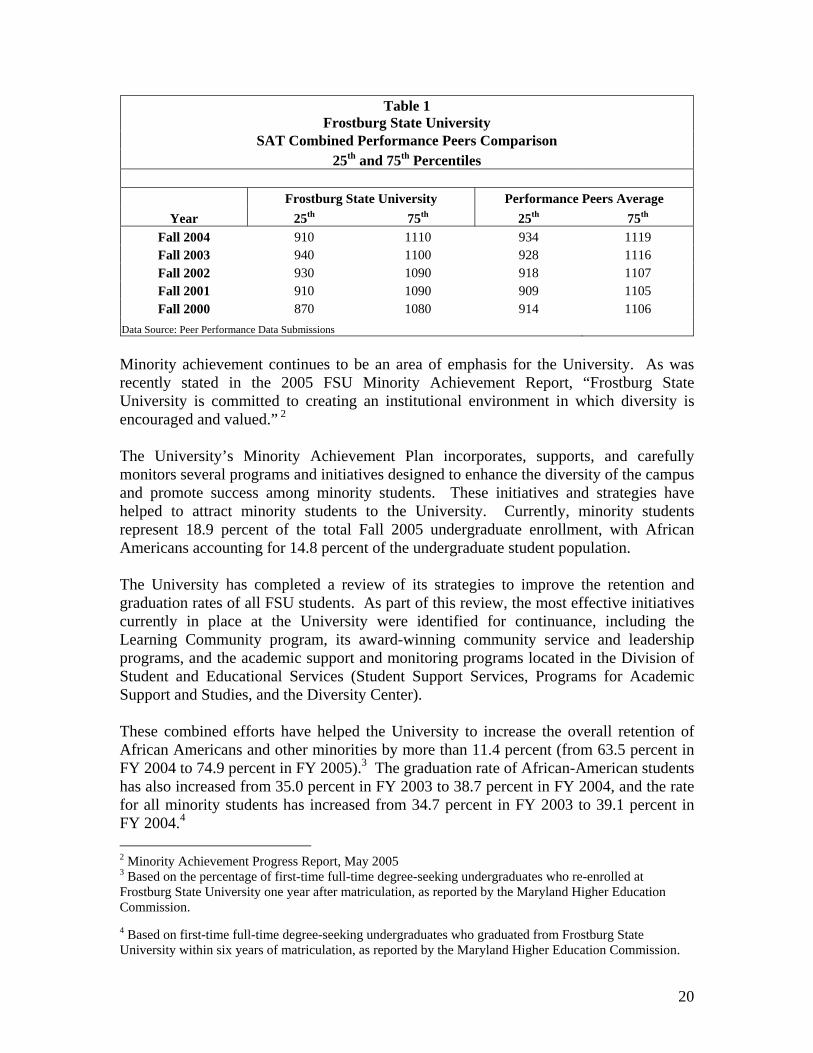
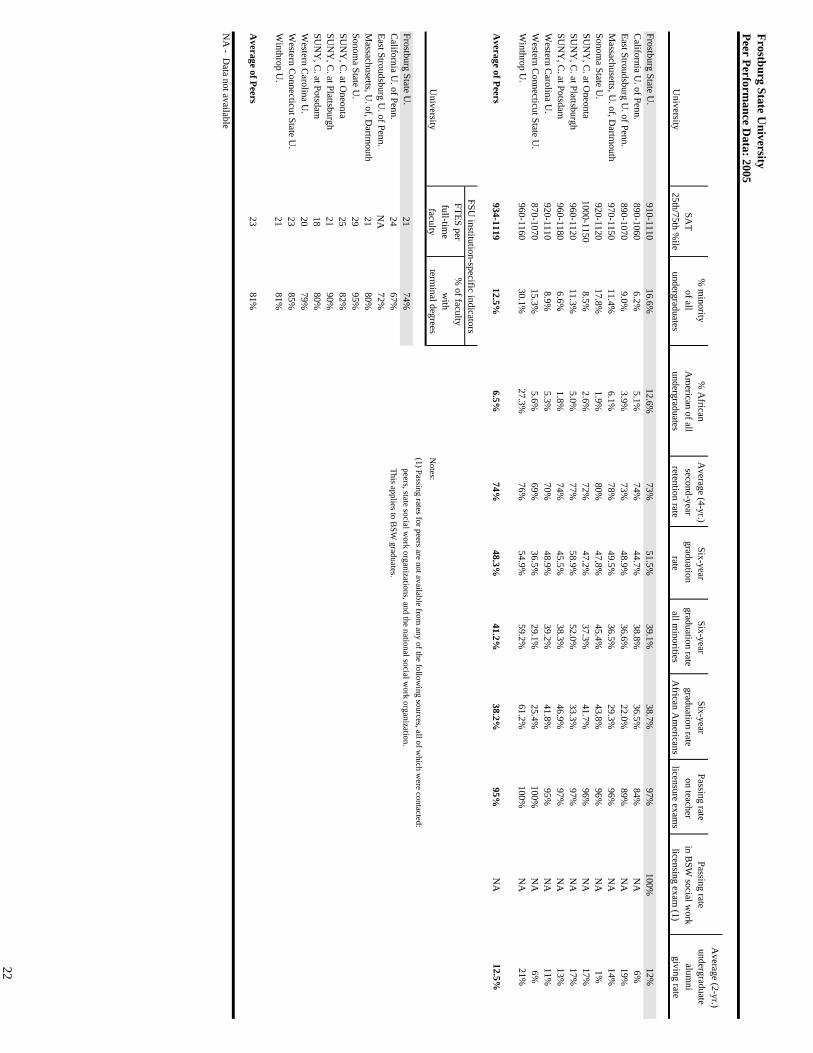
Frostburg State University Frostburg State University’s performance on a number of performance indicators meets or exceeds its peer average. The percentages of minority and African American undergraduate students attending the institution are well above its peer averages. The university is close to the average of its peers in the six-year graduation rate for all students and in second-year retention rates. Frostburg also compares favorably in its undergraduate alumni-giving rate, performing at the average of its peers. The university performs below the average of its peers on a number of performance measures. Frostburg has enrolled students with lower SAT scores in the past few years. It ranks below its peer average in the six-year graduation rate for minorities. However, the university shows improvement over last year. The university also reports improvement in both these measures in its Managing for Results report for FY 2005. Frostburg has two institution-specific indicators: student-faculty ratio and percent of faculty with terminal degrees. The university’s student-faculty ratio is slightly more favorable than its peer average. Also, Frostburg reports that 74 percent of its faculty had terminal degrees, slightly lower than the peer average of 81 percent. This is also a drop from last year’s level of 80 percent for this indicator. On professional licensure examinations, Frostburg continues to have a high proportion of students passing the teacher licensing exam and is above the peer average. Many of Frostburg’s peer institutions, however, use alternative certification tests. Also, the number of Frostburg students passing the social work licensing exam is now at 100 percent. Last year, the university explained that only two of its peers offer a comparable program. It also clarified that since the pass rate dropped from 100 percent to 83 percent from 1999 to 2000, the pass rate has risen steadily each year back to 100 percent in 2004. Institution’s Response As an access institution, Frostburg State University (FSU) is committed to creating an environment that enhances student learning. The University serves the needs and interests of a diverse student population and provides a rich network of connections between faculty and students. Consistent with its Institutional Plan, the University’s goal is to enroll students with a combined SAT score at or above the national and state average.1 Table 1 shows FSU’s combined SAT 25th and 75th percentile trends as compared to its Performance Peers. In the fall of 2004, the University’s 25th percentile SAT score declined for the first time in five years for enrolled first-time degree-seeking students. The 75th percentile scores for these students have continued to increase over the same period. Overall, FSU’s 25th and 75th SAT percentiles have kept pace with the Performance Peers. 1 Institutional Plan, Academic Year 2005-2006
20
Table 1 Frostburg State University
SAT Combined Performance Peers Comparison 25th and 75th Percentiles
Frostburg State University Performance Peers Average
Year 25th 75th 25th 75th Fall 2004 910 1110 934 1119 Fall 2003 940 1100 928 1116 Fall 2002 930 1090 918 1107 Fall 2001 910 1090 909 1105 Fall 2000 870 1080 914 1106
Data Source: Peer Performance Data Submissions
Minority achievement continues to be an area of emphasis for the University. As was recently stated in the 2005 FSU Minority Achievement Report, “Frostburg State University is committed to creating an institutional environment in which diversity is encouraged and valued.” 2 The University’s Minority Achievement Plan incorporates, supports, and carefully monitors several programs and initiatives designed to enhance the diversity of the campus and promote success among minority students. These initiatives and strategies have helped to attract minority students to the University. Currently, minority students represent 18.9 percent of the total Fall 2005 undergraduate enrollment, with African Americans accounting for 14.8 percent of the undergraduate student population. The University has completed a review of its strategies to improve the retention and graduation rates of all FSU students. As part of this review, the most effective initiatives currently in place at the University were identified for continuance, including the Learning Community program, its award-winning community service and leadership programs, and the academic support and monitoring programs located in the Division of Student and Educational Services (Student Support Services, Programs for Academic Support and Studies, and the Diversity Center). These combined efforts have helped the University to increase the overall retention of African Americans and other minorities by more than 11.4 percent (from 63.5 percent in FY 2004 to 74.9 percent in FY 2005).3 The graduation rate of African-American students has also increased from 35.0 percent in FY 2003 to 38.7 percent in FY 2004, and the rate for all minority students has increased from 34.7 percent in FY 2003 to 39.1 percent in FY 2004.4 2 Minority Achievement Progress Report, May 2005 3 Based on the percentage of first-time full-time degree-seeking undergraduates who re-enrolled at Frostburg State University one year after matriculation, as reported by the Maryland Higher Education Commission. 4 Based on first-time full-time degree-seeking undergraduates who graduated from Frostburg State University within six years of matriculation, as reported by the Maryland Higher Education Commission.

21
The Fall 2003 percentage of faculty with terminal degrees is a reflection of faculty attrition and a reduction in state appropriations. In FY 2004, state appropriations to the University were significantly reduced, resulting in the need to hire full-time non-tenure track faculty to replace core faculty who had left the institution. Most of these full-time non-tenure track faculty did not hold terminal degrees. The percentage of faculty with terminal degrees for Fall 2004 has increased to 85.1 percent, which will be reflected in the next reporting period.
Frostburg State University
Peer Performance D
ata: 2005
Average (2-yr.)
% m
inority %
African
Average (4-yr.)
Six-yearSix-year
Six-yearPassing rate
Passing rateundergraduate
SAT
of all A
merican of all
second-yeargraduation
graduation rategraduation rate
on teacherin B
SW social w
orkalum
niU
niversity25th/75th %
ileundergraduates
undergraduatesretention rate
rateall m
inoritiesA
frican Am
ericanslicensure exam
slicensing exam
(1)giving rate
Frostburg State U.
910-111016.6%
12.6%73%
51.5%39.1%
38.7%97%
100%12%
California U
. of Penn.890-1060
6.2%5.1%
74%44.7%
38.8%36.5%
84%N
A6%
East Stroudsburg U. of Penn.
890-10709.0%
3.9%73%
48.9%36.6%
22.0%89%
NA
19%M
assachusetts, U. of, D
artmout h
970-115011.4%
6.1%78%
49.5%36.5%
29.3%96%
NA
14%Sonom
a State U.
920-112017.8%
1.9%80%
47.8%45.4%
43.8%96%
NA
1%SU
NY
, C. at O
neonta1000-1150
8.5%2.6%
72%47.2%
37.3%41.7%
96%N
A17%
SUN
Y, C
. at Plattsburgh960-1120
11.3%5.0%
77%58.9%
52.0%33.3%
97%N
A17%
SUN
Y, C
. at Potsdam960-1180
6.6%1.8%
74%45.5%
38.3%46.9%
97%N
A13%
Western C
arolina U.
920-11108.9%
5.3%70%
48.9%39.2%
41.8%95%
NA
11%W
estern Connecticut State U
.870-1070
15.3%5.6%
69%36.5%
29.1%25.4%
100%N
A6%
Winthrop U
.960-1160
30.1%27.3%
76%54.9%
59.2%61.2%
100%N
A21%
Average of Peers
934-111912.5%
6.5%74%
48.3%41.2%
38.2%95%
NA
12.5%
FTES per%
of facultyfull-tim
ew
ithU
niversityfaculty
terminal degrees
Notes:
(1) Passing rates for peers are not available from any of the follow
ing sources, all of which w
ere contacted:Frostburg State U
.21
74% peers, state social w
ork organizations, and the national social work organization.
California U
. of Penn.24
67% This applies to B
SW graduates.
East Stroudsburg U. of Penn.
NA
72%M
assachusetts, U. of, D
artmout h
2180%
Sonoma State U
.29
95%SU
NY
, C. at O
neonta25
82%SU
NY
, C. at Plattsburgh
2190%
SUN
Y, C
. at Potsdam18
80%W
estern Carolina U
.20
79%W
estern Connecticut State U
.23
85%W
inthrop U.
2181%
Average of Peers
2381%
NA
- Data not available
FSU institution-specific indicators
22
23
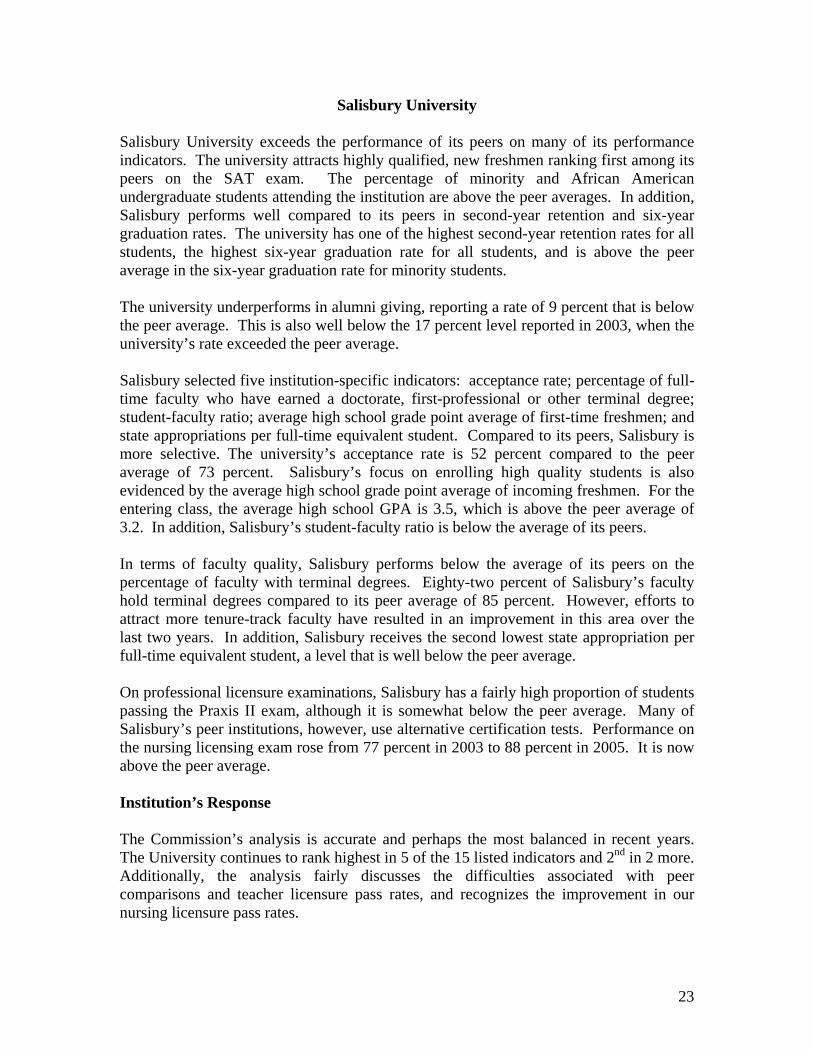
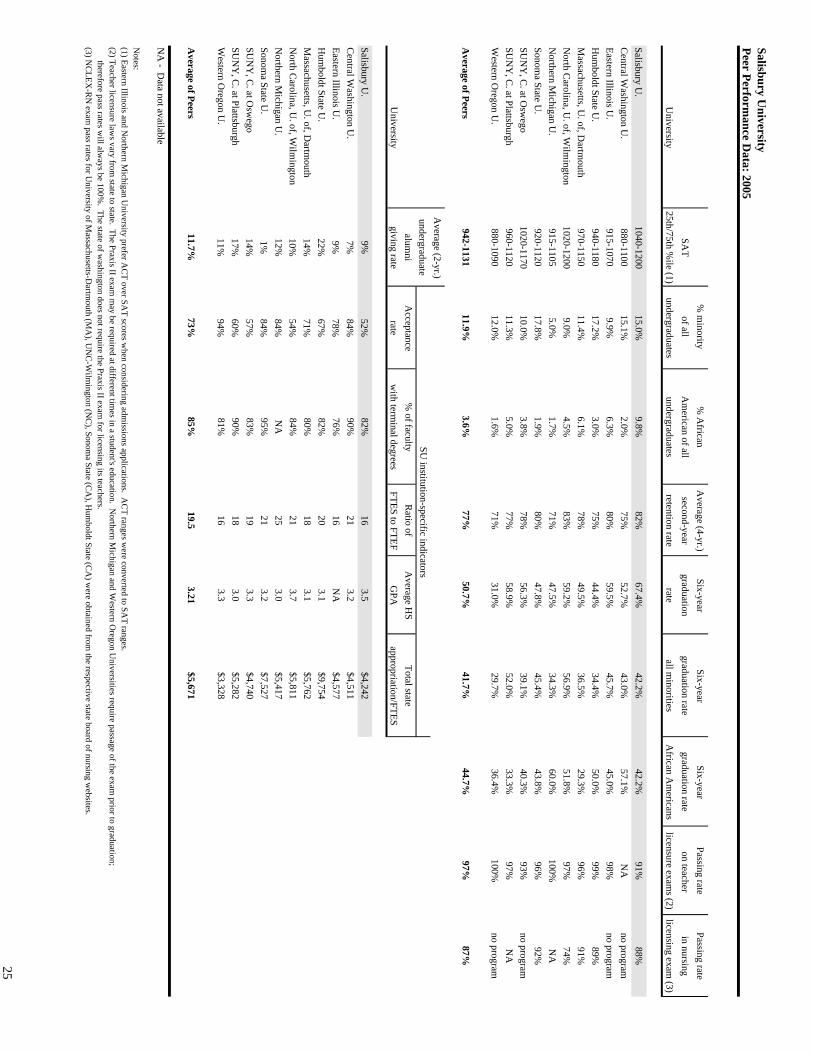
Salisbury University Salisbury University exceeds the performance of its peers on many of its performance indicators. The university attracts highly qualified, new freshmen ranking first among its peers on the SAT exam. The percentage of minority and African American undergraduate students attending the institution are above the peer averages. In addition, Salisbury performs well compared to its peers in second-year retention and six-year graduation rates. The university has one of the highest second-year retention rates for all students, the highest six-year graduation rate for all students, and is above the peer average in the six-year graduation rate for minority students. The university underperforms in alumni giving, reporting a rate of 9 percent that is below the peer average. This is also well below the 17 percent level reported in 2003, when the university’s rate exceeded the peer average. Salisbury selected five institution-specific indicators: acceptance rate; percentage of full-time faculty who have earned a doctorate, first-professional or other terminal degree; student-faculty ratio; average high school grade point average of first-time freshmen; and state appropriations per full-time equivalent student. Compared to its peers, Salisbury is more selective. The university’s acceptance rate is 52 percent compared to the peer average of 73 percent. Salisbury’s focus on enrolling high quality students is also evidenced by the average high school grade point average of incoming freshmen. For the entering class, the average high school GPA is 3.5, which is above the peer average of 3.2. In addition, Salisbury’s student-faculty ratio is below the average of its peers. In terms of faculty quality, Salisbury performs below the average of its peers on the percentage of faculty with terminal degrees. Eighty-two percent of Salisbury’s faculty hold terminal degrees compared to its peer average of 85 percent. However, efforts to attract more tenure-track faculty have resulted in an improvement in this area over the last two years. In addition, Salisbury receives the second lowest state appropriation per full-time equivalent student, a level that is well below the peer average. On professional licensure examinations, Salisbury has a fairly high proportion of students passing the Praxis II exam, although it is somewhat below the peer average. Many of Salisbury’s peer institutions, however, use alternative certification tests. Performance on the nursing licensing exam rose from 77 percent in 2003 to 88 percent in 2005. It is now above the peer average. Institution’s Response The Commission’s analysis is accurate and perhaps the most balanced in recent years. The University continues to rank highest in 5 of the 15 listed indicators and 2nd in 2 more. Additionally, the analysis fairly discusses the difficulties associated with peer comparisons and teacher licensure pass rates, and recognizes the improvement in our nursing licensure pass rates.
24
The percentage of faculty with terminal degrees remains our most pressing concern and is intricately linked to our next-to-last ranking in state appropriations per full-time equivalent student—a rate that indicates funding at $1,400 less per full-time equivalent student (FTES) than the average of our peers. This deficit directly impacts our ability to hire and retain, among other critical initiatives, full-time, tenured/tenured-track faculty. The rate per full-time equivalent student disguises the true impact of our funding—a level when calculated by our FTES indicates that our funding is more than $8 million below that of the average of our peers. These are annual deficits that, like deferred maintenance, tend to have a cascading negative impact on performance. As a result, our ability to attract and retain the highest qualified faculty is challenged by resource limitations. The University has responded with a strategic plan that places the highest priority into hiring terminally degreed faculty exclusively into the tenured/tenure-track ranks, increasing faculty salaries to improve our AAUP peer comparisons while simultaneously improving faculty retention, and decreasing the number of non-tenured track faculty positions. Currently, the percentage of tenured or tenure-track faculty who are terminally degreed is well over 90 percent. The University’s target is to increase the overall percentage of terminally degreed faculty to at least 90 percent.
Salisbury University
Peer Performance D
ata: 2005
% m
inority %
African
Average (4-yr.)
Six-yearSix-year
Six-yearPassing rate
Passing rateSA
Tof all
Am
erican of allsecond-year
graduationgraduation rate
graduation rate on teacher
in nursingU
niversity25th/75th %
ile (1)undergraduates
undergraduatesretention rate
rateall m
inoritiesA
frican Am
ericanslicensure exam
s (2)licensing exam
(3)
Salisbury U.
1040-120015.0%
9.8%82%
67.4%42.2%
42.2%91%
88%C
entral Washington U
.880-1100
15.1%2.0%
75%52.7%
43.0%57.1%
NA
no programEastern Illinois U
.915-1070
9.9%6.3%
80%59.5%
45.7%45.0%
98%no program
Hum
boldt State U.
940-118017.2%
3.0%75%
44.4%34.4%
50.0%99%
89%M
assachusetts, U. of, D
artmouth
970-115011.4%
6.1%78%
49.5%36.5%
29.3%96%
91%N
orth Carolina, U
. of, Wilm
ington1020-1200
9.0%4.5%
83%59.2%
56.9%51.8%
97%74%
Northern M
ichigan U.
915-11055.0%
1.7%71%
47.5%34.3%
60.0%100%
NA
Sonoma State U
.920-1120
17.8%1.9%
80%47.8%
45.4%43.8%
96%92%
SUN
Y, C
. at Osw
ego1020-1170
10.0%3.8%
78%56.3%
39.1%40.3%
93%no program
SUN
Y, C
. at Plattsburgh960-1120
11.3%5.0%
77%58.9%
52.0%33.3%
97%N
AW
estern Oregon U
.880-1090
12.0%1.6%
71%31.0%
29.7%36.4%
100%no program
Average of Peers
942-113111.9%
3.6%77%
50.7%41.7%
44.7%97%
87%
Average (2-yr.)
undergraduatealum
niA
cceptance%
of facultyR
atio ofA
verage HS
Total stateU
niversitygiving rate
ratew
ith terminal degrees
FTES to FTEFG
PAappropriation/FTES
Salisbury U.
9%52%
82%16
3.5$4,242
Central W
ashington U.
7%84%
90%21
3.2$4,511
Eastern Illinois U.
9%78%
76%16
NA
$4,577H
umboldt State U
.22%
67%82%
203.1
$9,754M
assachusetts, U. of, D
artmouth
14%71%
80%18
3.1$5,762
North C
arolina, U. of, W
ilmington
10%54%
84%21
3.7$5,811
Northern M
ichigan U.
12%84%
NA
253.0
$5,417Sonom
a State U.
1%84%
95%21
3.2$7,527
SUN
Y, C
. at Osw
ego14%
57%83%
193.3
$4,740SU
NY
, C. at Plattsburgh
17%60%
90%18
3.0$5,282
Western O
regon U.
11%94%
81%16
3.3$3,328
Average of Peers
11.7%73%
85%19.5
3.21$5,671
NA
- Data not available
Notes:
(1) Eastern Illinois and Northern M
ichigan University prefer A
CT over SA
T scores when considering adm
issions applications. AC
T ranges were converted to SA
T ranges.(2) Teacher licensure law
s vary from state to state. The Praxis II exam
may be required at different tim
es in a student's education. Northern M
ichigan and Western O
regon Universities require passage of the exam
prior to graduation; therefore pass rates w
ill always be 100%
. The state of washington does not require the Praxis II exam
for licensing its teachers.(3) N
CLEX
-RN
exam pass rates for U
niversity of Massachusetts-D
artmouth (M
A), U
NC
-Wilm
ington (NC
), Sonoma State (C
A), H
umboldt State (C
A) w
ere obtained from the respective state board of nursing w
ebsites.
SU institution-specific indicators
25

26
27
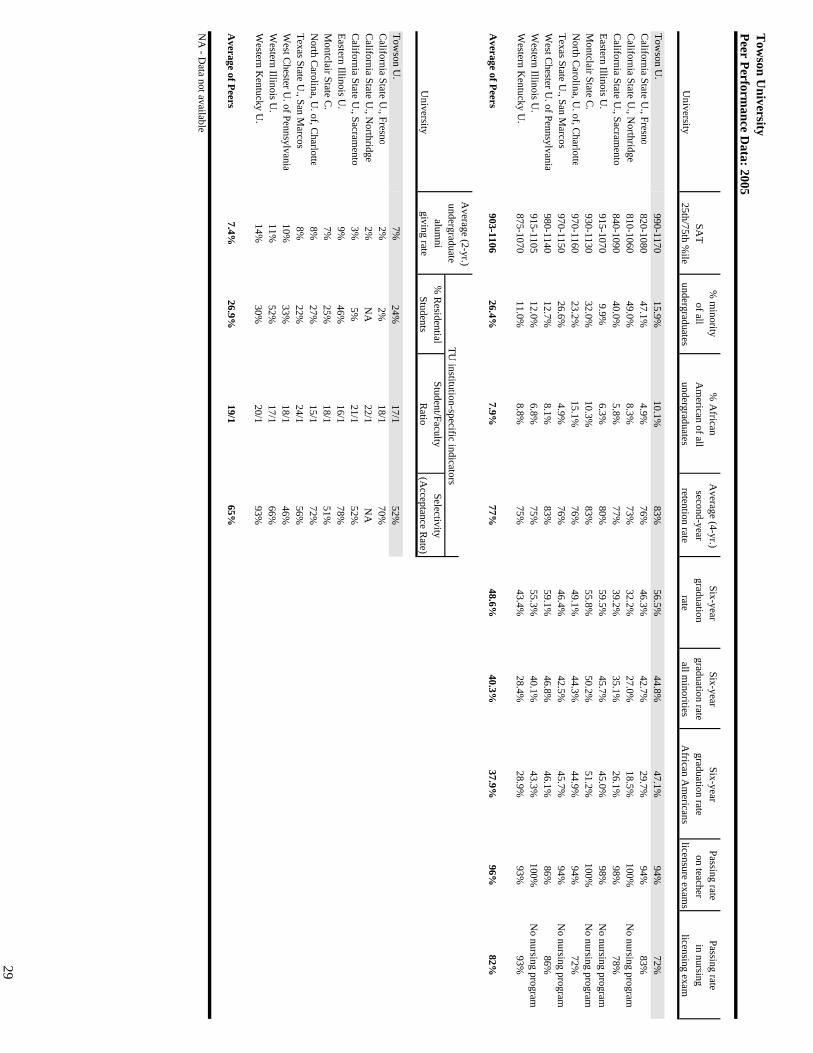
Towson University Towson University compares favorably to its peers on the majority of its performance indicators. The university ranks first among its peers for the SAT 25th percentile and tied for first for the 75th percentile. The percentage of African American undergraduate students attending the institution is above the peer average. In addition, Towson performs well compared to its peers in second-year retention and six-year graduation rates for all groups, including minority and African American students. The university is first in six-year graduation rate for all minorities, tied for first in average second-year retention rate, second in six-year graduation rate for African Americans, and third in overall six-year graduation rate. The university performs below the average of its peers on the percentage of minorities enrolled as undergraduate students. However, according to the MFR, this percentage has increased slightly over the last six years, from 14.4 percent in 1998 to 15.9 percent in 2005. Furthermore, a closer analysis of Towson’s peer institutions reveals that five of these institutions enroll a high proportion of Hispanic students, somewhat skewing the average. Towson’s pass rate for the nursing exam is 72 percent in 2005. However, most of the peer rates declined in this indicator. Nevertheless, Towson is still below the peer average of those few peers with nursing programs. The university is slightly below the average of its peers in the pass rate for the Praxis II exam. The institution reports a 94 percent pass rate, while the peer average is 96 percent. Towson selected three institution-specific indicators: percent of undergraduates who live on campus; student-faculty ratio; and acceptance rate. Compared to its peers, Towson is more selective. Towson’s acceptance rate is 52 percent in 2005, which is lower than the peer average of 65 percent. In addition, roughly a quarter of Towson’s undergraduate students reside on campus and Towson’s student-faculty ratio is slightly lower than the peer average. Institution’s Response The percent minority among undergraduates at Towson University has improved in each of the last three years and increased by a whole percentage point, from 15.9 percent to 16.9 percent, between fall 2004 and fall 2005. We expect continued increases in representation of minority students among undergraduates as we continue to emphasize achievement (high school and transfer grade-point-averages) over test scores in the admissions process and as we implement new admissions and financial aid initiatives. Our research shows that financial aid increases retention and graduation rates of minority students. We have significantly increased spending on institutional need-based financial aid and we are confident that this too will have a positive impact on access and retention.
28
The acceptance rates included in the 2005 Peer performance Analysis are fall 2003 data. Towson University’s acceptance rates for fall 2004 and fall 2005 were 67 percent and 65 percent respectively. Towson’s small class sizes are part of its appeal to students who look for “large school choices … and small school personal attention.“ The university seeks to maintain an optimum student-faculty ratio that will maintain efficiency and cost-effectiveness while ensuring a quality classroom experience. Accordingly, Towson’s student-faculty ratio may increase but it is not necessarily the university’s intention to raise it above the peer average. The Towson University Department of Nursing implemented an Action Plan in response to the 72 percent pass rate on the NCLEX-RN in the year 2003-2004. The plan, which includes a comprehensive testing program offered by Educational Resources Incorporated (ERI), is designed to identify students who need remediation or extra attention in coursework. Once identified, a remediation plan is developed for the student and must be completed before the student is allowed to progress. The Action Plan is working. The pass rate for first time candidates increased to 87 percent for the 2004-2005 academic year. The required pass rate for Maryland RN Schools was 77.60 percent and the average pass rate for all U.S. schools was 86.15 percent. Towson achieved the 2nd highest pass rate in Maryland for baccalaureate degree programs. We will continue to collect data on factors believed to influence pass rates. As part of an annual assessment system, the university now provides Praxis II results to each academic program for which a Praxis II test is required (Biology, History, English, etc.). The departments review their curriculum and course content in light of student performance in the subject-area sections of the Praxis II exam and make adjustments to improve student preparation. About 25 percent to 30 percent of Praxis II test-takers, whose scores are included in the Towson University percentage, earned their bachelors degrees elsewhere and attended Towson only to complete the state teacher certification requirements. The subject area sections of the Praxis II measure competency in material covered in courses taken at their baccalaureate institutions. These sections do not evaluate the effectiveness of the educational experience at Towson. The university now informs these students of the areas of content covered on the various Praxis II tests so that they can review. As a result of these changes, we expect Towson’s pass rate on the 2004-2005 Praxis II to exceed the average of its peers.
Tow
son University
Peer Performance D
ata: 2005
% m
inority %
African
Average (4-yr.)
Six-yearSix-year
Six-yearPassing rate
Passing rateSA
Tof all
Am
erican of allsecond-year
graduation graduation rate
graduation rate on teacher
in nursingU
niversity25th/75th %
ileundergraduates
undergraduatesretention rate
rateall m
inoritiesA
frican Am
ericanslicensure exam
slicensing exam
Towson U
.990-1170
15.9%10.1%
83%56.5%
44.8%47.1%
94%72%
California State U
., Fresno820-1080
47.1%4.9%
76%46.3%
42.7%29.7%
94%83%
California State U
., Northridg e
810-106049.0%
8.3%73%
32.2%27.0%
18.5%100%
No nursing program
California State U
., Sacrament o
840-109040.0%
5.8%77%
39.2%35.1%
26.1%98%
78%Eastern Illinois U
.915-1070
9.9%6.3%
80%59.5%
45.7%45.0%
98%N
o nursing programM
ontclair State C.
930-113032.0%
10.3%83%
55.8%50.2%
51.2%100%
No nursing program
North C
arolina, U. of, C
harlott e970-1160
23.2%15.1%
76%49.1%
44.3%44.9%
94%72%
Texas State U., San M
arcos970-1150
26.6%4.9%
76%46.4%
42.5%45.7%
94%N
o nursing programW
est Chester U
. of Pennsylvani a980-1140
12.7%8.1%
83%59.1%
46.8%46.1%
86%86%
Western Illinois U
.915-1105
12.0%6.8%
75%55.3%
40.1%43.3%
100%N
o nursing programW
estern Kentucky U
.875-1070
11.0%8.8%
75%43.4%
28.4%28.9%
93%93%
Average of Peers
903-110626.4%
7.9%77%
48.6%40.3%
37.9%96%
82%
Average (2-yr.)
undergraduatealum
ni%
Residential
Student/FacultySelectivity
University
giving rateStudents
Ratio
(Acceptance R
ate)
Towson U
.7%
24%17/1
52%C
alifornia State U., Fresn o
2%2%
18/170%
California State U
., Northridg e
2%N
A22/1
NA
California State U
., Sacrament o
3%5%
21/152%
Eastern Illinois U.
9%46%
16/178%
Montclair State C
.7%
25%18/1
51%N
orth Carolina, U
. of, Charlott e
8%27%
15/172%
Texas State U., San M
arcos8%
22%24/1
56%W
est Chester U
. of Pennsylvani a10%
33%18/1
46%W
estern Illinois U.
11%52%
17/166%
Western K
entucky U.
14%30%
20/193%
Average of Peers
7.4%26.9%
19/165%
NA
- Data not available
TU institution-specific indicators
29

30
31
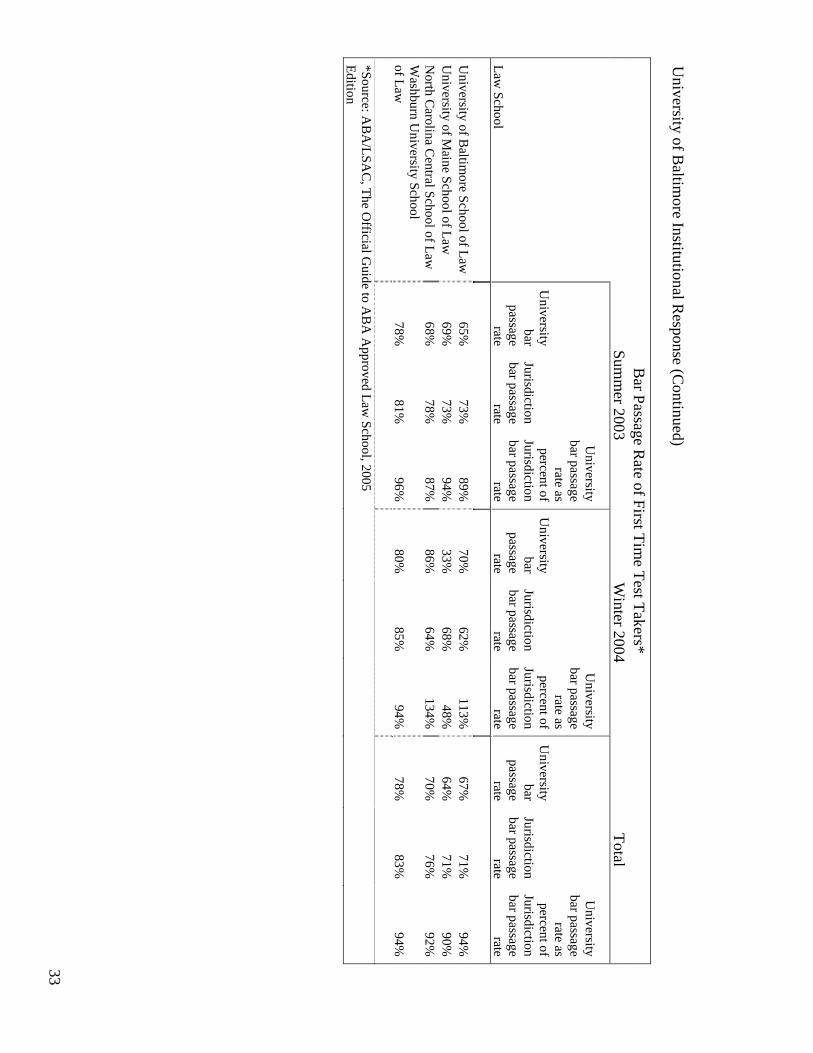
University of Baltimore Due to the University of Baltimore’s (UB) mission to provide upper division bachelor’s, master’s, and professional degrees, the university does not have traditional performance measures such as SAT scores, acceptance rates, and average high school grade point averages for incoming freshmen. Instead, it focuses on graduate student achievement and faculty quality. Overall, the university exceeds the performance of its peers on every indicator. The percentages of African American and minority undergraduate students attending the institution are above the peer averages. The university reports an improved undergraduate alumni-giving rate in 2005. Compared to its peers, the institution exceeds the peer average on this indicator. It should be noted however, that only half of the peer institutions provide data for alumni giving. In addition, the university is strong in the number of awards per full-time instructional faculty. It significantly exceeds the average of its peers in this indicator. The university selected two institution-specific indicators: expenditures for research and the proportion of part-time faculty. For both indicators, the university’s performance exceeds its peer averages. UB reports the second highest expenditures for research and ranks seventh in the percentage of part-time faculty with a level below the peer average. The university reports a 67 percent passing rate on the law-licensing exam, a slight decrease from the prior year rate of 71 percent. Unfortunately, peer comparisons for this indicator are impossible, as the university has no performance peers that have a law school. However, there are three institutions within the university’s funding peer group that do have law schools, Washburn University of Topeka, North Carolina Central University, and University of Southern Maine. UB should amend its report with the law exam pass rates of these three institutions. It is also worth comparing the bar exam pass rate to Maryland’s other public law school at the University of Maryland, Baltimore (UMB). UB’s pass rate trails UMB’s significantly as UMB reports a pass rate of 78 percent in 2005. In its annual publication, America’s Best Graduate Schools, U.S. News & World Report compares an institution’s bar exam pass rate to that of the jurisdiction’s overall passage rate. The jurisdiction listed is the state where the largest number of 2003 graduates took the state bar exam. Under this measure, UB’s pass rate of 67 percent is slightly below the Maryland pass rate of 71 percent. Institution’s Response In UB’s original submission there was no comparable data available for the peer performance indicator “Passing rate in Law Licensing exam” because none of the university’s current peers have law schools. In lieu of this data the commission requested that university report on the bar passage rate of first-time takers of the exam from three schools that are not current peers but who are in UB’s peer funding group. In addition the commission suggested that the UB’s first-time passage rate should be compared to that of all who took the exam in Maryland at same time. The table below presents that

32
comparison for UB and the three institutions that not current peers but who are in the university’s peer funding group. The data is presented in the following table.
33
University of B
altimore Institutional R
esponse (Continued)
B
ar Passage Rate of First Tim
e Test Takers*
Summ
er 2003 W
inter 2004 Total
Law School
University
bar passage
rate
Jurisdiction bar passage
rate
University
bar passage rate as
percent of Jurisdiction bar passage
rate
University
bar passage
rate
Jurisdiction bar passage
rate
University
bar passage rate as
percent of Jurisdiction bar passage
rate
University
bar passage
rate
Jurisdiction bar passage
rate
University
bar passage rate as
percent of Jurisdiction bar passage
rate
U
niversity of Baltim
ore School of Law
65%
73%
89%
70%
62%
113%
67%
71%
94%
University of M
aine School of Law
69%
73%
94%
33%
68%
48%
64%
71%
90%
North C
arolina Central School of Law
68%
78%
87%
86%
64%
134%
70%
76%
92%
W
ashburn University School
of Law
78%
81%
96%
80%
85%
94%
78%
83%
94%
*Source: AB
A/LSA
C, The O
fficial Guide to A
BA
Approved Law
School, 2005 Edition

University of B
altimore
Peer Performance D
ata: 2005
Average (2-yr.)
% m
inority %
African
Passing rateundergraduate
Aw
ards perof all
Am
erican of allin LA
Walum
ni100 F-T faculty
University
undergraduatesundergraduates
licensing examgiving rate
(5 yrs.)
Baltim
ore, U. of
38.0%32.8%
67%10%
3.14C
alifornia State U., B
akersfield48.6%
7.1%no law
school7%
1.84C
alifornia State U., San M
arcos34.7%
3.0%no law
school3%
1.04G
overnors State U.
42.9%36.2%
no law school
NA
0.00H
ouston, U. of, C
lear Lake29.5%
7.2%no law
schoolN
A1.92
Illinois, U. of, Springfield
12.8%8.4%
no law school
NA
1.39M
ichigan, U. of, D
earborn17.7%
7.9%no law
school5%
1.67N
ew Jersey C
ity U.
61.7%19.6%
no law school
NA
0.43Penn State U
, Harrisburg,C
apital C.
15.0%6.4%
no law school
NA
NA
Texas A&
M U
., Corpus C
hristi42.3%
2.8%no law
school6%
2.33W
isconsin, U. of, W
hitewater
9.9%4.3%
no law school
14%1.67
Average of Peers
31.5%10.3%
7.0%1.37
Expendituresfor research
% part-tim
e faculty
Baltim
ore, U. of
$4,933,40054.2%
California State U
., Bakersfield
$62,29461.1%
California State U
., San Marcos
$53,26689.9%
Governors State U
.$1,122,751
100.0%H
ouston, U. of, C
lear Lake$1,134,437
59.4%Illinois, U
. of, Springfield$1,480,112
89.3%M
ichigan, U. of, D
earborn$2,145,000
42.3%N
ew Jersey C
ity U.
$7,85362.1%
Penn State U, H
arrisburg,Capital C
.N
A39.2%
Texas A&
M U
., Corpus C
hristi$6,562,097
13.7%W
isconsin, U. of, W
hitewater
$461,35317.2%
Average of Peers
$1,447,68557.4%
NA
- Data not available
Note: B
ar exam passage rates vary considerably from
state to state. Num
ber reported for each school is for the state in which that school had the largest num
ber had the largest num
ber of first-time takers.
UB
institution-specific indicators
34
35
University of Maryland, Baltimore The University of Maryland, Baltimore’s (UMB) peer institutions reflect the university’s status as the State’s public academic health and law university with six professional schools. UMB’s peers include institutions classified by the Carnegie Foundation as ‘specialized’ and institutions classified as ‘Research I’ institutions. Compared to its peer institutions, the university shows a wide range of performance. The university’s unique structure permits only a few generalizations. The percentage of minority and African American undergraduate students attending the institution are above the peer averages. Using available data, it appears that UMB has slipped in performance of its students that pass licensing exams. Approximately 84 percent of nursing students passed their licensing exam, dropping from 91 percent in 2004. This falls short of University of North Carolina, Chapel Hill’s and the University of Illinois, Chicago’s reported pass rates of 92 percent respectively. UMB reports a 93 percent pass rate for the medical exam, the same level as in 2004, but slightly below the 2003 rate of 96 percent. The institution reports that 78 percent of law students passed their exam, down from 85 percent in the previous year. Peer institutions, plus the University of Connecticut, the University of Texas at Austin, and the University of Virginia that were added for comparison, report a 91 percent average pass rate on this particular exam. UMB’s pass rate of 78 percent is also higher than the jurisdictional pass rate of 71 percent for Maryland as reported in America’s Best Graduate Schools 2006, published by U.S. News & World Report. The university’s pass rate for the dental examination is 80 percent for 2005, a significant drop from 99 percent in 2004 and the 100 percent rate that was reported for 2003. Finally, UMB reports a pass rate of 64 percent for Social Work for 2005. This is above the national rate of 62 percent, but below the rates of 66 percent and 86 percent reported in 2004 and 2003, respectively. The university selected six institution-specific indicators: total medicine R&D expenditures; medicine research grants per basic research faculty; medicine research grants per clinical faculty; percent of minority students enrolled; total headcount enrollment; and percentage of graduate and professional students enrolled. These data show that UMB’s school of medicine has the second highest level of research grants per basic research faculty and research grants per clinical faculty. Although the remaining institution-specific indicators are primarily descriptive indicators, they provide an indication of the type of student population attending the institution. Compared to its peers, UMB has the second lowest total headcount enrollment and ranks second in the percentage of graduate and professional student enrollment. In addition, the university has the third highest percent of minorities of total enrollment and is above the peer average. UMB has the third highest medicine R&D spending and second highest medicine research grants per FTE faculty. The level for 2005 is $24.3 million higher than in 2004.
36
Institution’s Response Using measures of research activity, UMB's performance compared to peer institutions has improved in many areas. In terms of total medicine R&D spending reported through the Association of American Medical Colleges, UMB ranked 3rd in 2005, up from 5th in 2004. In terms of grants per basic research faculty in medicine, UMB moved from 4th to 2nd, and now surpasses the peer average. The average annual rate of growth in federal research expenditures at UMB continues to be double-digit, and was second only to the University of Illinois, Chicago, a school with a much smaller funding base for 2005. The National Council of State Boards of Nursing raised the passing score for the NCLEX, resulting in a decreased passing rate for many schools including the University of North Carolina, Chapel Hill. The required passing rate for Maryland schools for the reported time frame was 77.6 percent, so the UMB School of Nursing was above the required rate. The pass rates for UMB students taking licensing exams in medicine and social work are above the national averages. Although the exam score for UMB dentistry students is less than the score for the University of Alabama, Birmingham, it should be noted that Alabama's score was the highest among all dental schools for this year.

University of M
aryland, Baltim
orePeer Perform
ance Data: 2005
Average annual
Average (2-yr.)
Total R&
DTotal R
&D
% grow
th (5-yr.)%
minority
% A
fricanundergraduate
expendituresexpenditures
in federal R&
Dof all
Am
erican of allalum
niin m
edicinein m
edicine perexpenditures
University
undergraduatesundergraduates
Nursing
Medical
LawD
entalSocial W
orkgiving rate
(000s)FT m
ed. facultyin m
edicine
Maryland, U
. of, Baltim
ore40.2%
26.3%84%
93%78%
80%64%
37%$237,817
$249,80812.3%
Alabam
a, U. of, B
irmingham
36.9%32.2%
88%no law
school85%
5%$179,415
$157,5208.0%
California, U
. of, San FranciscoN
AN
AN
Ano law
schoolN
o social work prog.
21%$581,024
$367,5048.1%
Illinois, U. of, C
hicago50.3%
8.9%92%
no law school
3%$145,433
$165,45324.0%
Michigan, U
. of, Ann A
rbor25.2%
7.6%N
A95%
14%$244,181
$163,11410.2%
North C
arolina, U. of, C
hapel Hill
20.7%10.9%
92%85%
25%$145,126
$120,33711.6%
Connecticut, U
. of88%
Texas, U. of, A
ustin93%
Virginia, U
. of93%
Average of Peers
33.3%14.9%
91%N
atl. rate = 92%91%
Natl. rate = 80%
Natl. rate = 62%
13.6%$259,036
$194,78612.4%
TotalM
edicineM
edicine%
minorities
Total G
rad. & 1st prof.
medicine R
&D
research grants perresearch grants per
of totalheadcount
as % of
University
spending (thousands) Basic R
esearch facultyC
linical facultyenrollm
entenrollm
enttotal headcount
Maryland, U
. of, Baltim
ore$171,387
$235,033$172,171
33.2%5,602
83.1%A
labama, U
. of, Birm
ingham$143,334
$132,658$123,886
31.4%16,693
31.5%C
alifornia, U. of, San Francisco
$354,247$508,430
$193,81844.9%
2,75499.7%
Illinois, U. of, C
hicago$69,412
$136,159$60,563
42.1%24,865
37.8%M
ichigan, U. of, A
nn Arbor
$184,135$219,776
$111,90523.9%
39,53337.2%
North C
arolina, U. of, C
hapel Hill
$76,752$148,292
$45,69119.1%
26,87838.5%
Average of Peers
$165,576$229,063
$107,17332.3%
22,14548.9%
NA
- Data not available
Note: B
ar exam passage rates vary considerably from
state to state. Num
ber reported for each school is for the state in which that school had the largest num
ber of first-time takers.
The following universities are added for com
parison with bar passing rates only: C
onnecticut; Texas, Austin; and V
irginia.
UM
B institution-specific indicators Passing rate in licensure exam
s
37

38
39
University of Maryland Baltimore County The University of Maryland Baltimore County (UMBC) exceeds the performance of its peers on the majority of its indicators. In terms of quality of new freshmen, the University ranks first among its peers for the SAT 25th percentile and 75th percentile. The percentage of minority and African American undergraduate students attending the institution are far above the peer averages. Furthermore, the university’s six-year graduation rates for minority and African American students exceed the peer averages. Comparisons of faculty quality and research are favorable for the university. It ranks first in the total number of awards per full-time instructional faculty and, over the last five years, had the highest average annual percent growth in federally financed research and development expenditures. The university, however, performs below the average of its peers on several performance measures. UMBC’s second-year retention rate is slightly below the peer average. The university is also below the average of its peers in the six-year graduation rate. Despite efforts by the university to improve this indicator, it has improved only slightly over the past three years. The university has the lowest total amount of research and development expenditures received from federal, state, industry and other sources, but this level has risen by 18 percent in 2005. UMBC has shown improvement in total research and development (R&D) expenditures per full-time faculty, moving from tenth place in 2003 to eighth in 2005. In both instances, the university falls below the average of its peers on these indicators. However, the university has increased its R&D expenditures from $19.8 million in FY 1998 to $42.9 million in the most recent year. UMBC reports the second lowest percentage of alumni giving among its peers. The university’s 7 percent alumni giving rate is substantially lower than its peer average, and has remained flat from the last year. The university selected three institution-specific indicators: rank in the number of bachelor’s degrees awarded in information technology, rank in the ratio of invention disclosures per $100 million in total R&D expenditures, and student-to-faculty ratio. Among the university’s institution-specific indicators, UMBC ranks first in the number of bachelor’s degrees awarded in information technology and ranks first in the ratio of invention disclosures to research and development expenditures. The university has the fifth highest student-to-faculty ratio, and is above the peer average. Finally, the university has improved in terms of teacher preparation, reporting a pass rate on teacher licensing exams of 94 percent in 2005, up from 86 percent in 2004. Institution’s Response Student retention and graduation rates are important indicators that UMBC takes very seriously and that the institution is working vigorously to improve. The university has expanded the number of certificate and degree programs available and has undertaken several academic initiatives designed to increase student engagement, which is known to
40
affect student persistence. Among the latter are First Year Seminars, student “success” seminars, the Faculty Mentor Program, the Make UMBC Yours campaign, the First Year Council (a peer mentor model initiated by student leaders), the New Student Book Experience, and the First Year Leaders program, which places upperclassmen in residence halls as a resource for first year students. UMBC has continued its considerable growth in R&D expenditures and ranks very favorably among its peers on the measures that take the university’s size into account. For example, UMBC ranks lowest on Total R&D expenditures, but 8th in Total R&D expenditures per full-time faculty member. Particularly noteworthy is the university’s performance on federal R&D expenditures. Average annual percent growth over 5 years is the highest of our peers, and UMBC ranks 3rd on its institution-specific indicator of Federal R&D Expenditures per full-time faculty member. The university also ranks 1st among its peers on another institution-specific indicator: the ratio of license agreements to millions of dollars in R&D. UMBC is a young institution and, until recently, campus efforts in, and resources for, fundraising have focused more on maximizing funds through corporate and foundation philanthropy rather than through alumni giving. These efforts have been successful in generating substantial restricted funding sources: UMBC’s first capital campaign raised $66 million, exceeding our $50 million goal. UMBC lacks the staffing and resources to significantly increase efforts to cultivate alumni. New initiatives, such as starting an alumni magazine and creating departmental clusters of alumni professionals and faculty to cultivate alumni support, will depend on the availability of new resources. Nevertheless, the UMBC Alumni Association, in partnership with the Office of Institutional Advancement, is developing new approaches to engagement of alumni and is fostering the university’s relationship with them.
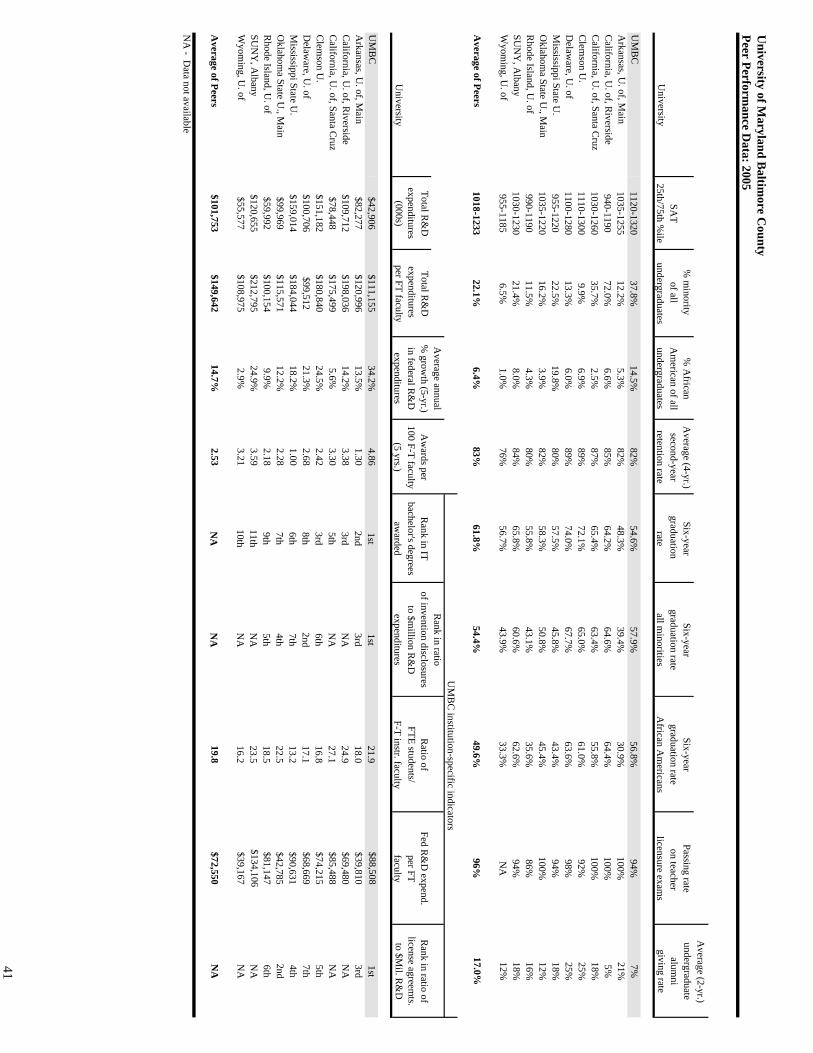
University of M
aryland Baltim
ore County
Peer Performance D
ata: 2005
Average (2-yr.)
% m
inority %
African
Average (4-yr.)
Six-yearSix-year
Six-yearPassing rate
undergraduateSA
Tof all
Am
erican of allsecond-year
graduation graduation rate
graduation rate on teacher
alumni
University
25th/75th %ile
undergraduatesundergraduates
retention raterate
all minorities
African A
mericans
licensure exams
giving rate
UM
BC
1120-132037.8%
14.5%82%
54.6%57.9%
56.8%94%
7%A
rkansas, U. of, M
ain 1035-1255
12.2%5.3%
82%48.3%
39.4%30.9%
100%21%
California, U
. of, Riverside
940-119072.0%
6.6%85%
64.2%64.6%
64.4%100%
5%C
alifornia, U. of, Santa C
ruz1030-1260
35.7%2.5%
87%65.4%
63.4%55.8%
100%18%
Clem
son U.
1110-13009.9%
6.9%89%
72.1%65.0%
61.0%92%
25%D
elaware, U
. o f1100-1280
13.3%6.0%
89%74.0%
67.7%63.6%
98%25%
Mississippi State U
.955-1220
22.5%19.8%
80%57.5%
45.8%43.4%
94%18%
Oklahom
a State U., M
ain1035-1220
16.2%3.9%
82%58.3%
50.8%45.4%
100%12%
Rhode Island, U
. of990-1190
11.5%4.3%
80%55.8%
43.1%35.6%
86%16%
SUN
Y, A
lban y1030-1230
21.4%8.0%
84%65.8%
60.6%62.6%
94%18%
Wyom
ing, U. o f
955-11856.5%
1.0%76%
56.7%43.9%
33.3%N
A12%
Average of Peers
1018-123322.1%
6.4%83%
61.8%54.4%
49.6%96%
17.0%
Average annual
Rank in ratio
Total R&
DTotal R
&D
% grow
th (5-yr.)A
wards per
Rank in IT
of invention disclosuresR
atio ofFed R
&D
expend.R
ank in ratio ofexpenditures
expenditures in federal R
&D
100 F-T facultybachelor's degrees
to $million R
&D
FTE students/per FT
license agreemts.
University
(000s)per FT faculty
expenditures(5 yrs.)
awarded
expendituresF-T instr. faculty
facultyto $M
il. R&
D
UM
BC
$42,906$111,155
34.2%4.86
1st1st
21.9$88,508
1stA
rkansas, U. of, M
ain $82,277
$120,99613.5%
1.302nd
3rd18.0
$39,8103rd
California, U
. of, Riverside
$109,712$198,036
14.2%3.38
3rdN
A24.9
$69,480N
AC
alifornia, U. of, Santa C
ruz$78,448
$175,4995.6%
3.305th
NA
27.1$85,488
NA
Clem
son U.
$151,182$180,840
24.5%2.42
3rd6th
16.8$74,215
5thD
elaware, U
. o f$100,706
$99,51221.3%
2.688th
2nd17.1
$68,6697th
Mississippi State U
.$159,014
$184,04418.2%
1.006th
7th13.2
$90,6314th
Oklahom
a State U., M
ain$99,969
$115,57112.2%
2.287th
4th22.5
$42,7852nd
Rhode Island, U
. of$59,992
$100,1549.9%
2.189th
5th18.5
$81,1476th
SUN
Y, A
lban y$120,655
$212,79524.9%
3.5911th
NA
23.5$134,106
NA
Wyom
ing, U. o f
$55,577$108,975
2.9%3.21
10thN
A16.2
$39,167N
A
Average of Peers
$101,753$149,642
14.7%2.53
NA
NA
19.8$72,550
NA
NA
- Data not available
UM
BC
institution-specific indicators
41

42
43
University of Maryland, College Park The University of Maryland, College Park is measured against its aspirational peers - those institutions that College Park aspires to emulate in performance and reputation. Therefore, College Park is not yet performing at the peer level on many indicators. One indicator where it compares favorably is in the SAT 25th to 75th percentile, one of the highest among its peers. The university is in the middle of its peers, but still below average, in the proportion of minority undergraduate students. According to the MFR, College Park’s goal was to increase the proportion of minority undergraduate students to 35 percent in 2004. However, the proportion is only 32 percent as reported for 2005. It should be noted however, that the percentage of minorities enrolled at College Park is higher than the non-California institutions and the university has the highest percentage of African American undergraduate students enrolled. Compared to its peers, the university has the lowest retention and graduation rates. The university has shown steady improvement in all areas except the six-year graduation rate of African Americans. In preparing teacher candidates, the university reports a pass rate of 96 percent. This represents an improvement from last year’s rate of 91 percent, but is lower than the average of the peer group. The university’s 16 percent alumni-giving rate is equal to its peer average for 2005, but lower than the level attained in 2004. College Park has lost some ground compared to its peers in research and development (R&D) expenditures in 2005. The university’s annual percent growth of federal R&D expenditures has slipped from 17.7 percent in 2004 to 8.4 percent in 2005. Although College Park’s total R&D expenditures are slightly below the peer average, this level is higher than R&D expenditures at the University of North Carolina, Chapel Hill and the University of California, Los Angeles. College Park has five institution-specific indicators: the number of graduate-level colleges, programs or specialty areas ranked among the top 25 in the nation; the number of graduate-level colleges, programs or specialty areas ranked among the top 15 in the nation; the percent change over five years in the number of faculty holding membership in one of three national academies; the number of invention disclosures reported per $100 million in total research and development expenditures; and the number of degrees awarded to African American students. College Park has improved in the number of graduate-level programs ranked among the top 25 from 62 programs in 2004 to 67 programs ranked in 2005. The university also improved the number of programs ranked in the top 15 in the nation from 43 in 2004 to 49 in 2005. The university continues to report the highest number of degrees awarded to African American students. As further evidence of its aspiration to reach its peers, College Park ranks first in the percentage increase in the number of Maryland faculty members holding membership in one of the national academies. The university improved in the number of invention disclosures per $100 million in total R&D expenditures and is above the peer average.
44
Institution’s Response The University has made significant improvements in graduation rates. While our peers have increased graduation rates over the past 5 years by 5 percentage points, the University of Maryland has increased rates by 10 percentage points over the same time period. University-wide graduation rate is expected to exceed 80 percent by 2008. The University implemented an undergraduate retention program with the goal of enhancing student success. This multifaceted program includes a statement of expectations of progress toward a degree, a change in classification of students to reflect raised expectations, new policies on withdrawal and leave of absence, and a new policy on academic probation and dismissal. Across the board, these policies were devised to increase expectations of student performance. Further efforts were directed to developing new advising and program planning models intended to complement the 2002 actions. These new initiatives call for each degree program to build four-year graduation templates and plans for advising interventions in order to assure that students are on track to timely graduation. We are seeing the impact of our earlier actions and expect even more improvement as later actions take effect. The University has established an objective to narrow the gap between the overall graduation rate and the graduation rates for African-American students. We are improving our graduation rates for minorities and African American students at a faster rate than our peers. More recent data are reported in the MFR, which shows that UM has increased the minority graduation rate from 65 percent to 70 percent, while the graduation rate of African American students has increased from 57 percent to 67 percent. These data will be reported in the 2006 Peer Performance Report. The five-year average of the annual percentage growth in federal R&D expenditures for the University has been above all of its peers for several years. In 2004, the University had an unusually high year with 7 percentage points above the peer average. In 2005, the University reported being 2 percentage points below the peer average. This recent drop can be attributed to changes in federal funding patterns. As a result, the University will move to broaden funding options. There is a national trend for teacher-training programs to require students to pass teacher licensure examinations as part of the program graduation requirements. These policies are being phased in at UM and take effect as students enter the programs. The results of these policies will become evident as students under the old policies graduate. Once all students admitted to the program under the old graduation requirements have cleared the system, the pass rate will increase to 100 percent.
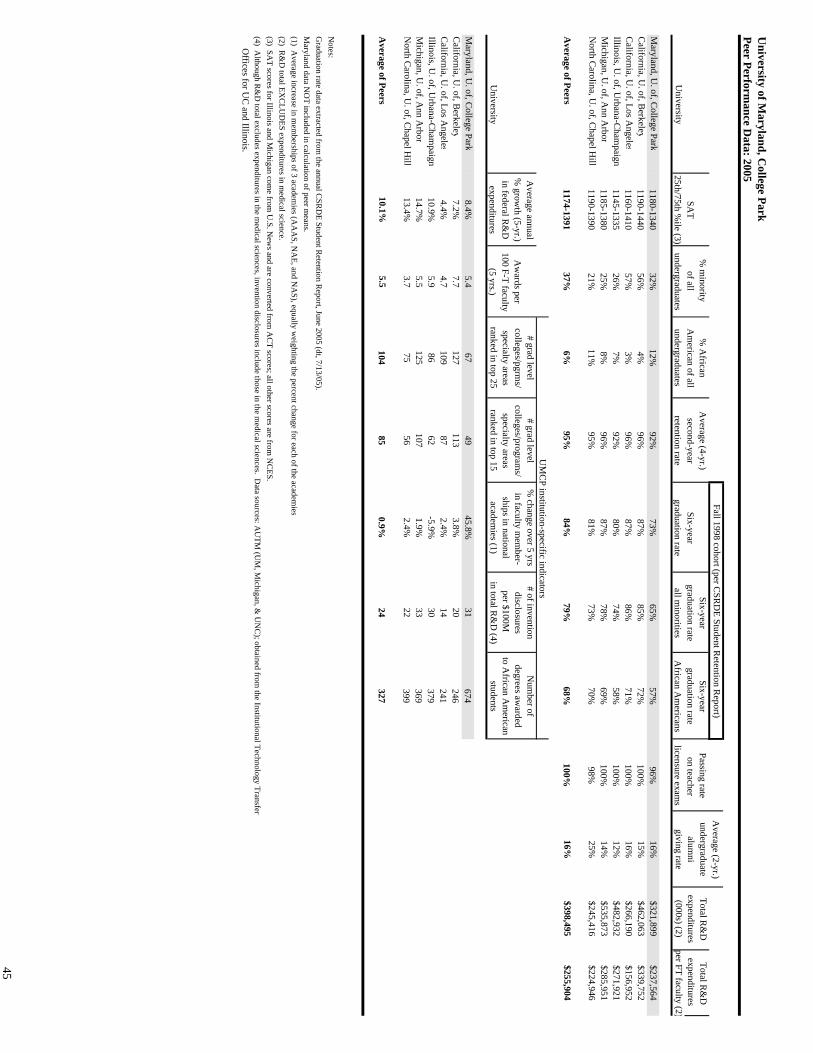
University of M
aryland, College Park
Peer Performance D
ata: 2005
Average (2-yr.)
% m
inority %
African
Average (4-yr.)
Six-yearSix-year
Passing rateundergraduate
Total R&
DTotal R
&D
SAT
of all A
merican of all
second-yearSix-year
graduation rategraduation rate
on teacheralum
niexpenditures
expenditures U
niversity25th/75th %
ile (3)undergraduates
undergraduatesretention rate
graduation rateall m
inoritiesA
frican Am
ericanslicensure exam
sgiving rat e
(000s) (2)per FT faculty (2)
Maryland, U
. of, College Park
1180-134032%
12%92%
73%65%
57%96%
16%$321,899
$237,564C
alifornia, U. of, B
erkele y1190-1440
56%4%
96%87%
85%72%
100%15%
$462,063$339,752
California, U
. of, Los Angele s
1160-141057%
3%96%
87%86%
71%100%
16%$266,190
$156,952Illinois, U
. of, Urbana-C
hampaig n
1145-133526%
7%92%
80%74%
58%100%
12%$482,932
$271,921M
ichigan, U. of, A
nn Arbo r
1185-138025%
8%96%
87%78%
69%100%
14%$535,873
$285,951N
orth Carolina, U
. of, Chapel H
il l1190-1390
21%11%
95%81%
73%70%
98%25%
$245,416$224,946
Average of Peers
1174-139137%
6%95%
84%79%
68%100%
16%$398,495
$255,904
Average annual
# grad level# grad level
% change over 5 yrs
# of inventionN
umber of
% grow
th (5-yr.)A
wards per
colleges/pgrms/
colleges/programs/
in faculty mem
ber-disclosures
degrees awarded
in federal R&
D100 F-T faculty
specialty areasspecialty areas
ships in nationalper $100M
to A
frican Am
ericanU
niversit yexpenditures
(5 yrs.)ranked in top 25
ranked in top 15academ
ies (1)in total R
&D
(4)students
Maryland, U
. of, College Par k
8.4%5.4
6749
45.8%31
674C
alifornia, U. of, B
erkeley7.2%
7.7127
1133.8%
20246
California, U
. of, Los Angeles
4.4%4.7
10987
2.4%14
241Illinois, U
. of, Urbana-C
hampaign
10.9%5.9
8662
-5.9%30
379M
ichigan, U. of, A
nn Arbor
14.7%5.5
125107
1.9%33
369N
orth Carolina, U
. of, Chapel H
ill13.4%
3.775
562.4%
22399
Average of Peers
10.1%5.5
10485
0.9%24
327
Notes:
Graduation rate data extracted from
the annual CSR
DE Student R
etention Report, June 2005 (dt, 7/13/05).
Maryland data N
OT included in calculation of peer m
eans.(1) A
verage increase in mem
berships of 3 academies (A
AA
S, NA
E, and NA
S), equally weighting the percent change for each of the academ
ies
Offices for U
C and Illinois.
Fall 1998 cohort (per CSR
DE Student R
etention Report)
(4) Although R
&D
total excludes expenditures in the medical sciences, invention disclosures include those in the m
edical sciences. Data sources: A
UTM
(UM
, Michigan, &
UN
C); obtained from
the Institutional Technology Transfer
UM
CP institution-specific indicators
(2) R&
D total EX
CLU
DES expenditures in m
edical science.(3) SA
T scores for Illinois and Michigan com
e from U
.S. New
s and are converted from A
CT scores; all other scores are from
NC
ES.
45

46
47
University of Maryland Eastern Shore In many cases, the University of Maryland Eastern Shore (UMES) compares favorably to its peers. The university’s six-year graduation rate for all students and the six-year graduation rates for all minorities and for African Americans exceed the peer averages and have risen since 2004. However, UMES’s second-year retention rate remains at a level below the peer average. The university is below the peer average in 25th and 75th percentile on the SAT. It should also be noted that because its peers also have large minority populations, UMES currently is close to the average of its peers in the percentage of minority and African American undergraduates attending the institution. In terms of faculty and research efforts, UMES reports a slightly lower, but still positive, average annual percent growth in federally financed research and development expenditures than last year and is above the peer average. However, it reports lower levels of total research and development expenditures and total research and development expenditures per full-time faculty over last year. The university reports an improved performance in teacher preparation. The university’s passing rate on the Praxis II exam rose from 31 percent in 2004 last year to 45 percent this year. However, this level is only one-half of the level of the peer average. The university’s alumni giving rate is not only significantly below the peer average, but is lower than the eight institutions reporting this indicator. The university reports three institution-specific indicators: percent of full-time faculty with terminal degrees, information technology degrees as a percent of total bachelor degrees, and loan default rate. UMES reports a level of full-time faculty with terminal degrees that is below the peer average. The university is above the peer average in level of undergraduate IT degrees awarded. The university is below the average peer loan default rate. The university reports almost 100 percent of data in this report, as it did last year. This is a significant improvement over past years. Institution’s Response The analysis is a fair representation of the performance of the University of Maryland Eastern Shore (UMES) based upon the peer performance data for 2005. UMES’ performance in terms of the graduation rate continues to be strong and its six-year graduation rate is surpassed slightly by only two of its 10 peers. Its Research and Development expenditure annual growth rate of 22.9 percent, though lower than the last reporting year’s, continues to be strong, surpassing the average growth rate for its peers and exceeding the average rates of six of them. UMES’ performance is particularly strong in the number of IT graduates where it is a leader among its peers. In addition, UMES has a lower loan default rate than the average of its peers. Strength is also evident in the area of access and diversity in higher education. UMES continues to make a significant contribution to the state in these areas and continues to
48
reach out to first- generation college students, maintaining a commitment to representation of this group. Based on a recent quick survey of entering freshmen for the fall of 2005, over 50 percent of these students are first generation students. A significant number of such students may be under-prepared and may enter college with lower SAT scores compared to their peers. However, because of its commitment to providing opportunities to high quality education to diverse populations, UMES nurtures these students and provides support for them to succeed. The analysis reveals a number of areas in which the University has faced or continues to face some challenges. First, in the area of alumni giving the low rate of 3.0 percent for the reporting year is indeed low compared to the rates by UMES’ peers. UMES recently instituted a more effective way of tracking alumni and, with improved staffing and communication with alumni, as well as making use of a regularly updated alumni database; UMES is beginning to see positive changes in alumni giving. For example, the rate of alumni giving for fiscal year 2005 was 15 percent. UMES plans to continue to increase alumni giving in the future through use of innovative strategies for fundraising including improved and regular communication. Second, the analysis shows that UMES’ passing rate in the PRAXIS II exam was low in two successive years of 2004 (31 percent) and 2005 (45 percent). When it was realized that students were experiencing difficulties in meeting certification requirements for PRAXIS II, UMES instituted more sound screening procedures for entry into the teacher preparation program. In addition, more effective academic support services including advising and tutoring to enhance student success as well as financial support for students who need such support have been implemented. These improvements will result in an increase in the pass rate in PRAXIS II to 83 percent for the 2006 peer performance reporting period. Third, UMES is paying a great deal of attention to the retention issue. It is using Access and Success funds to strengthen the role of counselors and mentors to provide tutorial assistance to help students. In part, the retention problem is aggravated by financial limitations. The declining trend in retention is related to the 30 percent increase in tuition over the last two years. In addition, the decrease in out-of-state enrollment from 30 percent to 24 percent has significant adverse impact on tuition revenue and enrollments. A committee of Vice Presidents has been set up to conduct a thorough investigation of the retention problem and to recommend long-term solutions to turn the trend around. This investigation will include a reexamination of the minimum composite SAT score for admission and thus also address the question of UMES’ less favorable average in 25th and 75th percentile scores on the SAT in comparison to its peers. UMES is also taking interim remedial steps to improve student retention. These steps include monitoring student mid-term performance and requiring students with grades of “D” and “F” to participate in mandatory mentoring and tutoring. In addition, area directors are providing mentoring and tutoring services in all student dormitories. A combined freshman seminar is also provided twice each semester by faculty and staff to provide advising services to students. It is hoped that these short-term interventions and

49
recommended strategies by the Committee of Vice Presidents will transform the retention challenge into an opportunity for improving student learning and success. Fourth, UMES has instituted a policy to ensure that in the future all vacant faculty positions will be filled by persons who hold terminal degrees. This will ensure an increased percentage of full-time faculty with terminal degrees.
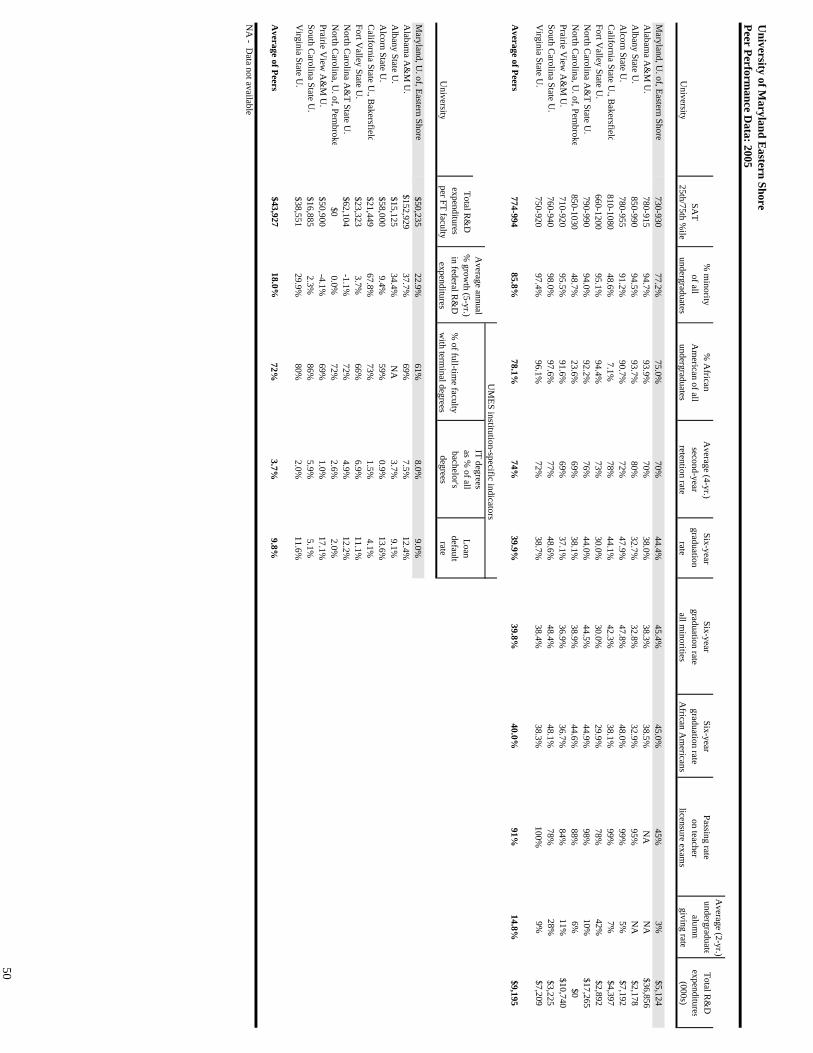
University of M
aryland Eastern Shore
Peer Performance D
ata: 2005
Average (2-yr.)
% m
inority %
African
Average (4-yr.)
Six-yearSix-year
Six-yearPassing rate
undergraduat eTotal R
&D
SAT
of all A
merican of all
second-yeargraduation
graduation rategraduation rate
on teacheralum
niexpenditures
University
25th/75th %ile
undergraduatesundergraduates
retention raterate
all minorities
African A
mericans
licensure exams
giving rat e(000s)
Maryland, U
. of, Eastern Shore730-930
77.2%75.0%
70%44.4%
45.4%45.0%
45%3%
$5,124A
labama A
&M
U.
780-91594.7%
93.9%70%
38.0%38.3%
38.5%N
AN
A$36,856
Albany State U
.850-990
94.5%93.7%
80%32.7%
32.8%32.9%
95%N
A$2,178
Alcorn State U
.780-955
91.2%90.7%
72%47.9%
47.8%48.0%
99%5%
$7,192C
alifornia State U., B
akersfiel d810-1080
48.6%7.1%
78%44.1%
42.3%38.1%
99%7%
$4,397Fort V
alley State U.
660-120095.1%
94.4%73%
30.0%30.0%
29.9%78%
42%$2,892
North C
arolina A&
T State U.
790-99094.0%
92.2%76%
44.0%44.5%
44.9%98%
10%$17,265
North C
arolina, U. of, Pem
brok e850-1030
48.7%23.6%
69%38.1%
38.9%44.6%
88%6%
$0Prairie V
iew A
&M
U.
710-92095.5%
91.6%69%
37.1%36.9%
36.7%84%
11%$10,740
South Carolina State U
.760-940
98.0%97.6%
77%48.6%
48.4%48.1%
78%28%
$3,225V
irginia State U.
750-92097.4%
96.1%72%
38.7%38.4%
38.3%100%
9%$7,209
Average of Peers
774-99485.8%
78.1%74%
39.9%39.8%
40.0%91%
14.8%$9,195
Average annual
IT degreesTotal R
&D
% grow
th (5-yr.)as %
of al lLoan
expenditures in federal R
&D
% of full-tim
e facultybachelor's
defaultU
niversityper FT faculty
expendituresw
ith terminal degrees
degreesrate
Maryland, U
. of, Eastern Shor e$50,235
22.9%61%
8.0%9.0%
Alabam
a A&
M U
.$152,929
37.7%69%
7.5%12.4%
Albany State U
.$15,125
34.4%N
A3.7%
9.1%A
lcorn State U.
$58,0009.4%
59%0.9%
13.6%C
alifornia State U., B
akersfiel d$21,449
67.8%73%
1.5%4.1%
Fort Valley State U
.$23,323
3.7%66%
6.9%11.1%
North C
arolina A&
T State U.
$62,104-1.1%
72%4.9%
12.2%N
orth Carolina, U
. of, Pembrok e
$00.0%
72%2.6%
2.0%Prairie V
iew A
&M
U.
$50,900-4.1%
69%1.0%
17.1%South C
arolina State U.
$16,8852.3%
86%5.9%
5.1%V
irginia State U.
$38,55129.9%
80%2.0%
11.6%
Average of Peers
$43,92718.0%
72%3.7%
9.8%
NA
- Data not available
UM
ES institution-specific indicators
50

51
University of Maryland University College There are very few peer indicators for the University of Maryland University College (UMUC) due to the unique nature of this institution. For example, the majority of students attending UMUC attend part-time which reflects the university’s target population: working adults. In addition, the university’s indicators reflect other unique characteristics such as the university's goal to serve students through distance education. Therefore, the university does not have traditional performance measures such as SAT scores, acceptance rate, and average high school grade point average for incoming freshmen. Overall, the university compares favorably to its peers. The percentage of African American undergraduate students attending the institution is far above the peer average. The university is at the peer average in the proportion of minority undergraduate students. The university’s alumni-giving rate is lower than the peer average for 2005. The university selected five institution-specific indicators: the percentage of African American graduates in information technology; the percentage of undergraduate students over the age of 25; the number of post-baccalaureate degrees awarded in technology and business; the number of worldwide online courses; and the number of worldwide online enrollments. The university significantly exceeds the performance of its peers on all of these indicators. Unique among these institution-specific indicators is the number of worldwide online courses and enrollments. Enrollments in these areas has increased significantly, by almost 17,000, from 2004 to 2005. Institution’s Response University College is revising its peer data to reflect its new definition of alumni giving rate (now 11 percent) and changing the worldwide online course indicator to stateside (consistent with the MFR). UMUC has no additional institutional response to this report.
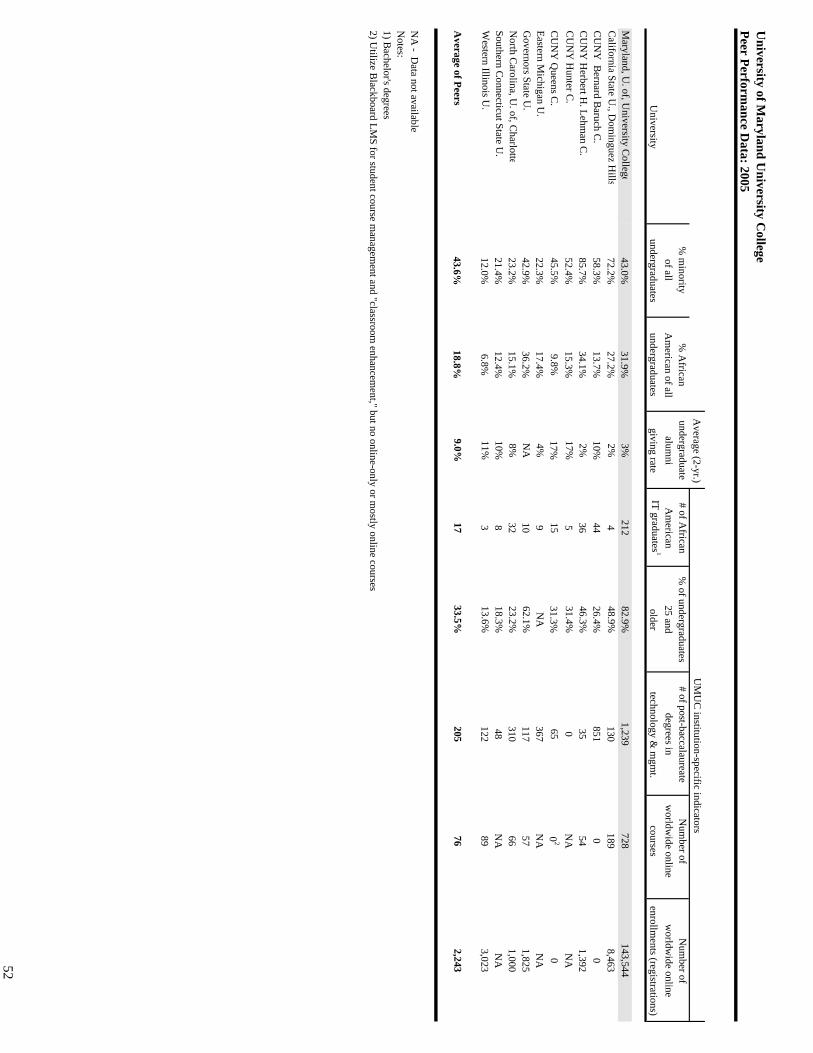
University of M
aryland University C
ollegePeer Perform
ance Data: 2005
Average (2-yr.)
% m
inority %
African
undergraduate# of A
frican%
of undergraduates# of post-baccalaureate
Num
ber ofN
umber of
of all A
merican of all
alumni
Am
erican25 and
degrees inw
orldwide online
worldw
ide onlineU
niversityundergraduates
undergraduatesgiving rate
IT graduates 1older
technology & m
gmt.
coursesenrollm
ents (registrations)
Maryland, U
. of, University C
ollege43.0%
31.9%3%
21282.9%
1,239728
143,544C
alifornia State U., D
ominguez H
ills72.2%
27.2%2%
448.9%
130189
8,463C
UN
Y B
ernard Baruch C
.58.3%
13.7%10%
4426.4%
8510
0C
UN
Y H
erbert H. Lehm
an C.
85.7%34.1%
2%36
46.3%35
541,392
CU
NY
Hunter C
.52.4%
15.3%17%
531.4%
0N
AN
AC
UN
Y Q
ueens C.
45.5%9.8%
17%15
31.3%65
02
0Eastern M
ichigan U.
22.3%17.4%
4%9
NA
367N
AN
AG
overnors State U.
42.9%36.2%
NA
1062.1%
11757
1,825N
orth Carolina, U
. of, Charlott e
23.2%15.1%
8%32
23.2%310
661,000
Southern Connecticut State U
.21.4%
12.4%10%
818.3%
48N
AN
AW
estern Illinois U.
12.0%6.8%
11%3
13.6%122
893,023
Average of Peers
43.6%18.8%
9.0%17
33.5%205
762,243
NA
- Data not available
Notes:
1) Bachelor's degrees
2) Utilize B
lackboard LMS for student course m
anagement and "classroom
enhancement," but no online-only or m
ostly online courses
UM
UC
institution-specific indicators
52
53
Morgan State University Morgan State University exceeds the performance of its peers on many of its indicators. The university’s six-year graduation rate for African American students is above the peer average. Moreover, the university’s pass rate on the teacher certification examination is 100 percent. The rate has steadily risen over the past four years, marking an improvement in teacher preparation. It should be noted, however, that only three of Morgan’s peers provide data for this indicator. Morgan also reports the highest graduate and professional school going rate and student satisfaction with job preparation. Furthermore, Morgan reports a small increase in research grant and contract activity over the prior year. Those peers reporting show an average decrease of 3 percent for this indicator. Conversely, the university performs below the average of its peers on a number of performance measures. Although they show improvement over 2004, the second-year retention rates for all students, minority students, and African American students are all below the peer averages. The six-year graduation rates for all students and minority students, while improving at Morgan in 2005, also lag behind the peer averages. Because Morgan’s retention and graduation rates are improving, it indicates that their comprehensive campus-wide policies aimed at strengthening retention and graduation rates are beginning to show results. Morgan’s astronomical growth in doctoral production has dropped now that the institution has been awarding doctoral degrees for a few years. Morgan reports an increase of 13 percent in doctorates awarded from the prior year. This figure is lower than the peer average and represents a significant decrease from the previous year’s level of 77 percent. However, this represents an actual level of 6 additional doctorate degrees awarded in 2004. Morgan performs below the peer average for percent of alumni giving for 2005 with only four peers reporting. Morgan has several indicators that are subject to survey results, including student satisfaction with advanced studies and employment preparation. However, these surveys are not performed on a regular basis, therefore data are not available annually for review. Nevertheless, Morgan reports that 37 percent of its 2004 graduates moved on to postgraduate programs. The university also reports that 98 percent of graduates reported satisfaction with their preparation for graduate school, and 85 percent were satisfied with preparation for jobs. Furthermore, the university reports 100 percent employer satisfaction with Morgan 2004 graduates. The university should consider choosing new indicators of institution specific performance that would allow for readily available data and for a complete evaluation. Likewise, it is difficult to compare the performance of Morgan relative to its peers due to the large number of missing data from its peers.
54
Institution’s Response Morgan collects more data to evaluate its performance than its peers and it probably will continue to be the case that it will have more data than the institutions to which it is being compared. However, if it is able to identify appropriate indicators for which more peer data is available, Morgan will utilize them in the future. With respect to graduation rates, it should be stressed that for the most part its peer institutions do not have students with academic or demographic characteristics comparable to those of Morgan students. Morgan students are much more at risk than its average peer. However, because access for African-Americans of college age has lagged well behind population growth in Maryland, Morgan is one of the relatively few options in the state that is available for this large and growing segment of Maryland’s population. A more appropriate metric is public urban universities in general. On this measure Morgan is well above average for students of all races and in the top tier for African-American students. Morgan now ranks among the top twenty traditional campuses nationwide in the number of doctorates awarded to African Americans. In engineering doctorates, Morgan ranks fourth nationally. It ranks eighth in education and eleventh in health sciences. Maryland historically has awarded on average less than 5 percent of its doctorates statewide to African Americans. Due largely to Morgan’s increased degree production, doctoral degrees awarded to African Americans were 60 percent higher in 2004 than just two years earlier. This represents the first progress the state has made on this measure in many years.
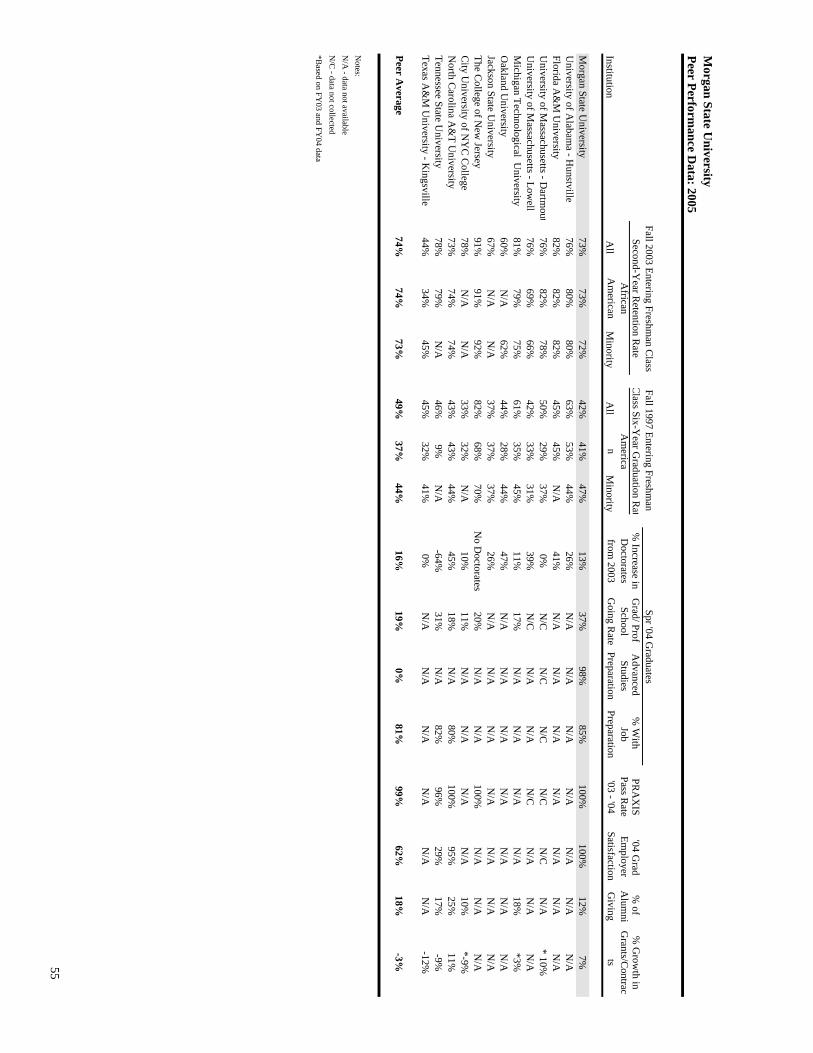
Morgan State U
niversityPeer Perform
ance Data: 2005
% Increase in
Grad/ Prof
Advanced
% W
ith PR
AX
IS '04 G
rad%
of %
Grow
th in
InstitutionA
llA
frican A
merican
Minority
All
Am
erican
Minority
Doctorates
from 2003
School G
oing Rate
Studies Preparation
Job Preparation
Pass Rate
'03 - '04Em
ployer Satisfaction
Alum
ni G
ivingG
rants/Contrac
ts
Morgan State U
niversity73%
73%72%
42%41%
47%13%
37%98%
85%100%
100%12%
7%U
niversity of Alabam
a - Hunstville
76%80%
80%63%
53%44%
26%N
/AN
/AN
/AN
/AN
/AN
/AN
/AFlorida A
&M
University
82%82%
82%45%
45%N
/A41%
N/A
N/A
N/A
N/A
N/A
N/A
N/A
University of M
assachusetts - Dartm
ou t76%
82%78%
50%29%
37%0%
N/C
N/C
N/C
N/C
N/C
N/A
* 10%U
niversity of Massachusetts - Low
ell76%
69%66%
42%33%
31%39%
N/C
N/A
N/A
N/C
N/A
N/A
N/A
Michigan Technological U
niversity81%
79%75%
61%35%
45%11%
17%N
/AN
/AN
/AN
/A18%
*3%O
akland University
60%N
/A62%
44%28%
44%47%
N/A
N/A
N/A
N/A
N/A
N/A
N/A
Jackson State University
67%N
/AN
/A37%
37%37%
26%N
/AN
/AN
/AN
/AN
/AN
/AN
/AThe C
ollege of New
Jersey91%
91%92%
82%68%
70%N
o Doctorates
20%N
/AN
/A100%
N/A
N/A
N/A
City U
niversity of NY
C C
ollege78%
N/A
N/A
33%32%
N/A
10%11%
N/A
N/A
N/A
N/A
10%*-9%
North C
arolina A&
T University
73%74%
74%43%
43%44%
45%18%
N/A
80%100%
95%25%
11%Tennessee State U
niversity78%
79%N
/A46%
9%N
/A-64%
31%N
/A82%
96%29%
17%-9%
Texas A&
M U
niversity - Kingsville
44%34%
45%45%
32%41%
0%N
/AN
/AN
/AN
/AN
/AN
/A-12%
Peer Avera ge
74%74%
73%49%
37%44%
16%19%
0%81%
99%62%
18%-3%
Notes:
N/A
- data not availableN
/C - data not collected
*Based on FY
03 and FY04 data
Spr '04 Graduates
Fall 2003 Entering Freshman C
lassFall 1997 Entering Freshm
an Second-Y
ear Retention R
ateC
lass Six-Year G
raduation Rat
55

56

57
St. Mary’s College of Maryland As previously described, St. Mary’s College of Maryland (St. Mary’s) has two sets of peers: one set that reflects the college’s current mission and one set that reflects the aspirations of the college. The college exceeds its current peers in a number of indicators. It surpasses the average of its current peers in both second-year retention rate and six-year graduation rate. St. Mary’s is near or above the peer average for full-time faculty salaries. Further, St. Mary’s students have higher SAT scores than the students of most of its peers. It also exceeds the average of both current and aspirant peers for percent of minorities in its student population, and African Americans in the first-year class. Additionally, St. Mary’s has a higher percent of faculty with terminal degrees, surpassing the averages of both its current and aspirant peers. St. Mary’s has a selectivity rating of more selective in the current U.S. News and World Report America’s Best Colleges 2006 report, accepting a lower percentage of its applicants than the average of its current peers, and its yield rate is also greater. It should also be noted that St. Mary’s tuition is less than half of the average of its peers for resident undergraduates, reflecting its public school status. Of the twelve current peers, four are public institutions. In a comparison of St. Mary’s data to that of the public institutions only, St. Mary’s ranks first in the majority of indicators, including: faculty salaries, percentage of full-time faculty, average SAT scores, and six-year graduation rates. Not surprisingly, St. Mary’s does not yet reach the average of its aspirant peers on most of its qualitative indicators. In a few instances, however, St. Mary’s does exceed its aspirant peers. St. Mary’s yield rate is equal to the average of its aspirant peers. It has the highest percentage of African Americans of entering first-year students and the lowest tuition. Compared to its peers, the college also has one of the highest proportion of full-time freshmen receiving federal financial aid, which suggests that St. Mary’s serves a large percentage of students from economically disadvantaged backgrounds. St. Mary’s fails to meet the averages of both its current and aspirant peers in a few categories. The institution lags behind its peers in the rate of alumni giving, ranking the third lowest among all 18 peers. Similarly, only four other institutions have lower E&G expenditures per full-time student. Only three peers have higher ratios of full-time students to full-time faculty.
58
Institution’s Response St. Mary’s College of Maryland is pleased that MHEC has recognized the College’s success in meeting or exceeding our peers on a number of measures. In particular, the College takes pride in its talented students, minority enrollment, retention and graduation rates, high proportion of graduating minority students, and superb faculty. That the College continues to offer a preeminent liberal arts education at a tuition substantially less than that of our private peers demonstrates the success of the College’s mission in providing quality education to benefit the residents of Maryland. We will continue to actively promote scholarship and creativity by challenging our students to achieve academic excellence through close relationships with faculty, classroom activities, and experiential learning. Our faculty and staff understand and act to support diversity and access across the campus. The average alumni giving rate of the College’s private peers is higher than that of its public peers. It may be that alumni of public institutions need to become more aware of the critical role that private donations make in support of their alma maters, and the graduates of St. Mary’s College are no exception. While the alumni giving rate at St. Mary’s is lower than that of its private peers, it is typical (occurring at the median) of its public peer institutions. With increased efforts to inform our alumni about the importance of such donations and as our alumni continue to experience success resulting from an honors education, we expect continued and increased loyalty to St. Mary’s College to be reflected in higher alumni giving rates. The College is proud of the successes described by MHEC in providing a high quality education while keeping expenses at a minimum. During the past ten years, enrollment at St. Mary’s has increased by 24 percent whereas the state grant per FTE student has fallen 3.3 percent on an unadjusted basis. If adjusted for inflation, the loss of purchasing power over this same period was 32.2 percent. Hence, in terms of actual purchasing power, the state grant per FTE student has decreased by 35.5 percent during the past 10 years. During these same years, a number of our fixed expenses have continued to rise at rates much higher than those of the College’s inflator. Medical insurance and utility expenses, in particular, have squeezed spending away from core academic programs. The College eagerly anticipates building upon its records of success in serving the citizens of Maryland as additional funding becomes available. The growth in student body experienced in recent years has not been matched by a similar growth in faculty lines. As a result, the College has hired additional part-time faculty in an effort to maintain the quality of its offerings. We are also attempting to use resources to create full-time visiting faculty lines where possible to avoid the use of adjuncts. It is our plan to move as quickly as possible toward having 90 percent of our courses taught by full-time faculty, as is the practice of our peers. The College has hired an additional three full-time faculty for the current, 2005-2006, academic year. In addition, our draft strategic plan envisions the hiring of five additional full-time faculty for the 2006-2007 academic year. In this way, the College hopes to reduce its Student / Faculty ratio to the overall level of its peer institutions.
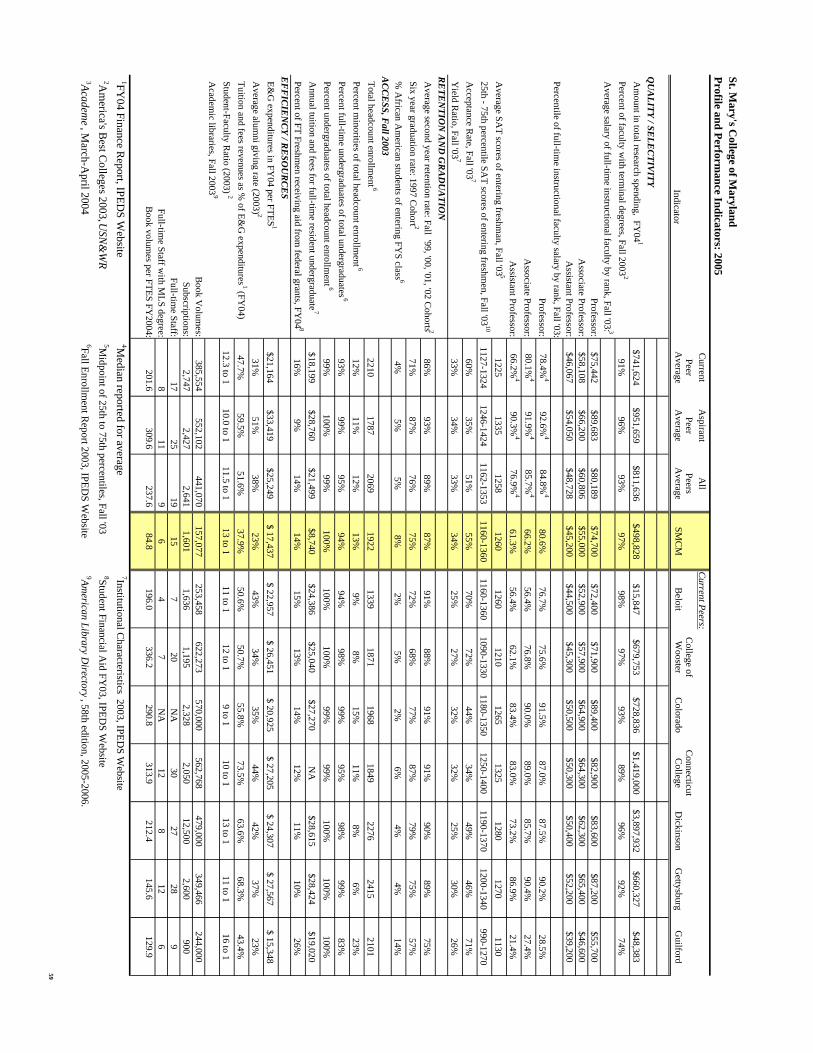
St. Mary's C
ollege of Maryland
Profile and Performance Indicators: 2005
Current
Aspirant
All
Current Peers:
PeerPeer
PeersC
ollege ofC
onnecticutIndicator
Average
Average
Average
SMC
M
Beloit
Wooster
Colorado
College
Dickinson
Gettysburg
Guilford
QU
ALITY / SE
LEC
TIVITY
Am
ount in total research spending, FY04
1$741,624
$951,659$811,636
$498,828$15,847
$679,753$728,836
$1,419,000$3,897,932
$660,327$48,383
Percent of faculty with term
inal degrees, Fall 20032
91%96%
93%97%
98%97%
93%89%
96%92%
74%A
verage salary of full-time instructional faculty by rank, Fall '03: 3
Professor:$75,442
$89,683$80,189
$74,700$72,400
$71,900$89,400
$82,900$83,600
$87,200$55,700
Associate Professor:
$58,108$66,200
$60,806$55,000
$52,900$57,900
$64,900$64,300
$62,300$65,400
$46,600A
ssistant Professor:$46,067
$54,050$48,728
$45,200$44,500
$45,300$50,500
$50,300$50,400
$52,200$39,200
Percentile of full-time instructional faculty salary by rank, Fall '03:
Professor:78.4%
492.6%
484.8%
480.6%
76.7%75.6%
91.5%87.0%
87.5%90.2%
28.5%A
ssociate Professor:80.1%
491.9%
485.7%
466.2%
56.4%76.8%
90.0%89.0%
85.7%90.4%
27.4%A
ssistant Professor:66.2%
490.3%
476.9%
461.3%
56.4%62.1%
83.4%83.0%
73.2%86.9%
21.4%A
verage SAT scores of entering freshm
an, Fall '03 51225
13351258
12601260
12101265
13251280
12701130
25th - 75th percentile SAT scores of entering freshm
en, Fall '0310
1127-13241246-1424
1162-13531160-1360
1160-13601090-1330
1180-13501250-1400
1190-13701200-1340
990-1270A
cceptance Rate, Fall '03
760%
35%51%
55%70%
72%44%
34%49%
46%71%
Yield R
atio, Fall '037
33%34%
33%34%
25%27%
32%32%
25%30%
26%R
ETE
NTIO
N A
ND
GR
AD
UA
TION
Average second year retention rate: Fall '99, '00, '01, '02 C
ohorts 286%
93%89%
87%91%
88%91%
91%90%
89%75%
Six year graduation rate: 1997 Cohort 2
71%87%
76%75%
72%68%
77%87%
79%75%
57%%
African A
merican students of entering FY
S class 64%
5%5%
8%2%
5%2%
6%4%
4%14%
AC
CE
SS, Fall 2003
Total headcount enrollment 6
22101787
20691922
13391871
19681849
22762415
2101Percent m
inorities of total headcount enrollment 6
12%11%
12%13%
9%8%
15%11%
8%6%
23%Percent full-tim
e undergraduates of total undergraduates6
93%99%
95%94%
94%98%
99%95%
98%99%
83%Percent undergraduates of total headcount enrollm
ent 699%
100%99%
100%100%
100%99%
99%100%
100%100%
Annual tuition and fees for full-tim
e resident undergraduate7
$18,199$28,760
$21,499$8,740
$24,386$25,040
$27,270N
A$28,615
$28,424$19,020
Percent of FT Freshmen receiving aid from
federal grants, FY04
816%
9%14%
14%15%
13%14%
12%11%
10%26%
EF
FIC
IEN
CY / R
ESO
UR
CE
SE&
G expenditures in FY
04 per FTES1
$21,164$33,419
$25,249$ 17,437
$ 22,957$ 26,451
$ 20,925$ 27,205
$ 24,307$ 27,567
$ 15,348A
verage alumni giving rate (2003) 2
31%51%
38%23%
43%34%
35%44%
42%37%
23%Tuition and fees revenues as %
of E&G
expenditures 1 (FY04)
47.7%59.5%
51.6%37.9%
50.6%50.7%
55.8%73.5%
63.6%68.3%
43.4%Student-Faculty R
atio (2003) 212.3 to 1
10.0 to 111.5 to 1
13 to 111 to 1
12 to 19 to 1
10 to 113 to 1
11 to 116 to 1
Academ
ic libraries, Fall 20039
Book V
olumes:
385,554
552,102
441,070
157,077253,458
622,273570,000
562,768479,000
349,466244,000
Subscriptions:2,747
2,427
2,641
1,601
1,6361,195
2,3282,050
12,5002,600
900Full-tim
e Staff:17
25
19
15
720
NA
3027
289
Full-time Staff w
ith MLS degree:
8
11
9
64
7N
A12
812
6B
ook volumes per FTES FY
2004:201.6
309.6
237.6
84.8
196.0336.2
290.8313.9
212.4145.6
129.9
1FY04 Finance R
eport, IPEDS W
ebsite 4M
edian reported for average 7Institutional C
haracteristics 2003, IPEDS W
ebsite 2A
merica's B
est Colleges 2003, U
SN&
WR
5Midpoint of 25th to 75th percentiles, Fall '03
8Student Financial Aid FY
03, IPEDS W
ebsite3Academ
e, March-A
pril 2004 6Fall Enrollm
ent Report 2003, IPED
S Website
9American Library D
irectory, 58th edition, 2005-2006.
59
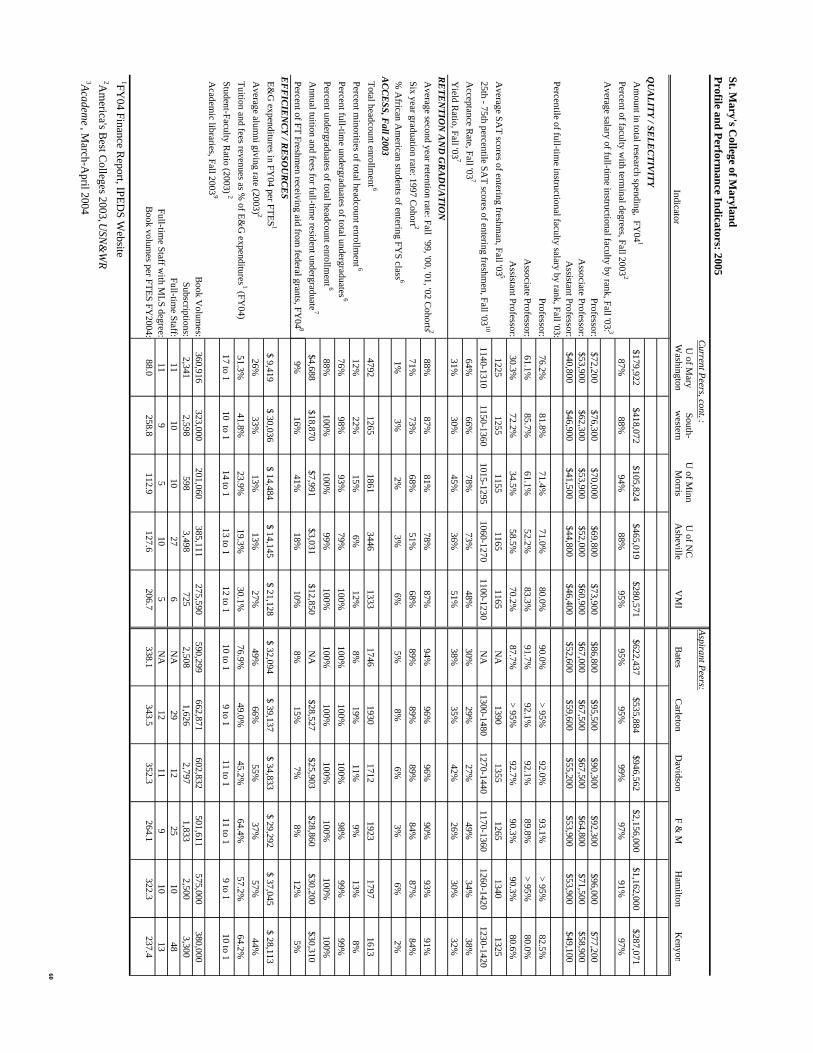
St. Mary's C
ollege of Maryland
Profile and Performance Indicators: 2005
Indicator
QU
ALITY / SE
LEC
TIVITY
Am
ount in total research spending, FY04
1
Percent of faculty with term
inal degrees, Fall 20032
Average salary of full-tim
e instructional faculty by rank, Fall '03: 3
Professor:A
ssociate Professor:A
ssistant Professor:Percentile of full-tim
e instructional faculty salary by rank, Fall '03:Professor:
Associate Professor:
Assistant Professor:
Average SA
T scores of entering freshman, Fall '03 5
25th - 75th percentile SAT scores of entering freshm
en, Fall '0310
Acceptance R
ate, Fall '037
Yield R
atio, Fall '037
RE
TEN
TION
AN
D G
RA
DU
ATIO
NA
verage second year retention rate: Fall '99, '00, '01, '02 Cohorts 2
Six year graduation rate: 1997 Cohort 2
% A
frican Am
erican students of entering FYS class 6
AC
CE
SS, Fall 2003
Total headcount enrollment 6
Percent minorities of total headcount enrollm
ent 6
Percent full-time undergraduates of total undergraduates
6
Percent undergraduates of total headcount enrollment 6
Annual tuition and fees for full-tim
e resident undergraduate7
Percent of FT Freshmen receiving aid from
federal grants, FY04
8
EF
FIC
IEN
CY / R
ESO
UR
CE
SE&
G expenditures in FY
04 per FTES1
Average alum
ni giving rate (2003) 2
Tuition and fees revenues as % of E&
G expenditures 1 (FY
04)Student-Faculty R
atio (2003) 2
Academ
ic libraries, Fall 20039
Book V
olumes:
Subscriptions:Full-tim
e Staff:Full-tim
e Staff with M
LS degree:B
ook volumes per FTES FY
2004:
1FY04 Finance R
eport, IPEDS W
ebsite 2A
merica's B
est Colleges 2003, U
SN&
WR
3Academe, M
arch-April 2004 C
urrent Peers, cont.:Aspirant Peers:
U of M
arySouth-
U of M
inn U
of NC
Washington
western
Morris
Asheville
VM
IB
atesC
arletonD
avidsonF &
MH
amilton
Kenyon
$179,922$418,072
$105,824$465,019
$280,571$622,437
$535,884$946,562
$2,156,000$1,162,000
$287,07187%
88%94%
88%95%
95%95%
99%97%
91%97%
$72,200$76,300
$70,000$69,800
$73,900$86,800
$95,500$90,300
$92,300$96,000
$77,200$53,900
$62,300$53,900
$52,000$60,900
$67,000$67,500
$67,500$64,800
$71,500$58,900
$40,800$46,900
$41,500$44,800
$46,400$52,600
$59,600$55,200
$53,900$53,900
$49,100
76.2%81.8%
71.4%71.0%
80.0%90.0%
> 95%92.0%
93.1%> 95%
82.5%61.1%
85.7%61.1%
52.2%83.3%
91.7%92.1%
92.1%89.8%
> 95%80.0%
30.3%72.2%
34.5%58.5%
70.2%87.7%
> 95%92.7%
90.3%90.3%
80.6%1225
12551155
11651165
NA
13901355
12651340
13251140-1310
1150-13601015-1295
1060-12701100-1230
NA
1300-14801270-1440
1170-13601260-1420
1230-142064%
66%78%
73%48%
30%29%
27%49%
34%38%
31%30%
45%36%
51%38%
35%42%
26%30%
32%
88%87%
81%78%
87%94%
96%96%
90%93%
91%71%
73%68%
51%68%
89%89%
89%84%
87%84%
1%3%
2%3%
6%5%
8%6%
3%6%
2%
47921265
18613446
13331746
19301712
19231797
161312%
22%15%
6%12%
8%19%
11%9%
13%8%
76%98%
93%79%
100%100%
100%100%
98%99%
99%88%
100%100%
99%100%
100%100%
100%100%
100%100%
$4,688$18,870
$7,991$3,031
$12,850N
A$28,527
$25,903$28,860
$30,200$30,310
9%16%
41%18%
10%8%
15%7%
8%12%
5%
$ 9,419$ 30,036
$ 14,484$ 14,145
$ 21,128$ 32,094
$ 39,137$ 34,833
$ 29,292$ 37,045
$ 28,11326%
33%13%
13%27%
49%66%
55%37%
57%44%
51.3%41.8%
23.9%19.3%
30.1%76.9%
49.0%45.2%
64.4%57.2%
64.2%17 to 1
10 to 114 to 1
13 to 112 to 1
10 to 19 to 1
11 to 111 to 1
9 to 110 to 1
360,916323,000
201,060385,111
275,590590,299
662,871602,832
501,611575,000
380,0002,341
2,598598
3,498725
2,5081,626
2,7971,833
2,5003,300
1110
1027
6N
A29
1225
1048
119
510
5N
A12
119
1013
88.0258.8
112.9127.6
206.7338.1
343.5352.3
264.1322.3
237.4
60

61
Appendices

62

63
Appendix A. Methodology For Selecting Performance Peers At The University System Of Maryland Institutions
The process of selecting peers involved narrowing a long list of colleges and universities (approximately 3,600) to a medium-sized list (fewer than 250), then to a small group with key characteristics like those of the home institution (between 22 and 60). The institutions in the smaller group are termed funding peers. Ultimately, USM institutions were asked to choose 10 performance peers from their lists. The narrowing process proceeded as follows:
1. Only public universities were considered. 2. Institutions were categorized by Carnegie classification. 3. Six sets of variables were mathematically analyzed for each institution. Examples
of these variables include: • Size • Student mix • Non-state revenues • Program mix • Location (urban vs. rural)
The analysis provided a comparatively short list of institutions, which are most like each USM institution. From the narrowed list, each USM institution then selected 10 performance peers based on criteria relevant to their specific institutional objectives. Below is a list of top criteria used by each institution to select their performance peers. Bowie
• SATs and/or ACT profiles • Academic mission • Types of programs • General academic reputation • Comparable student communities served
Coppin
• Program mix, especially teacher preparation • Size • Geographic location
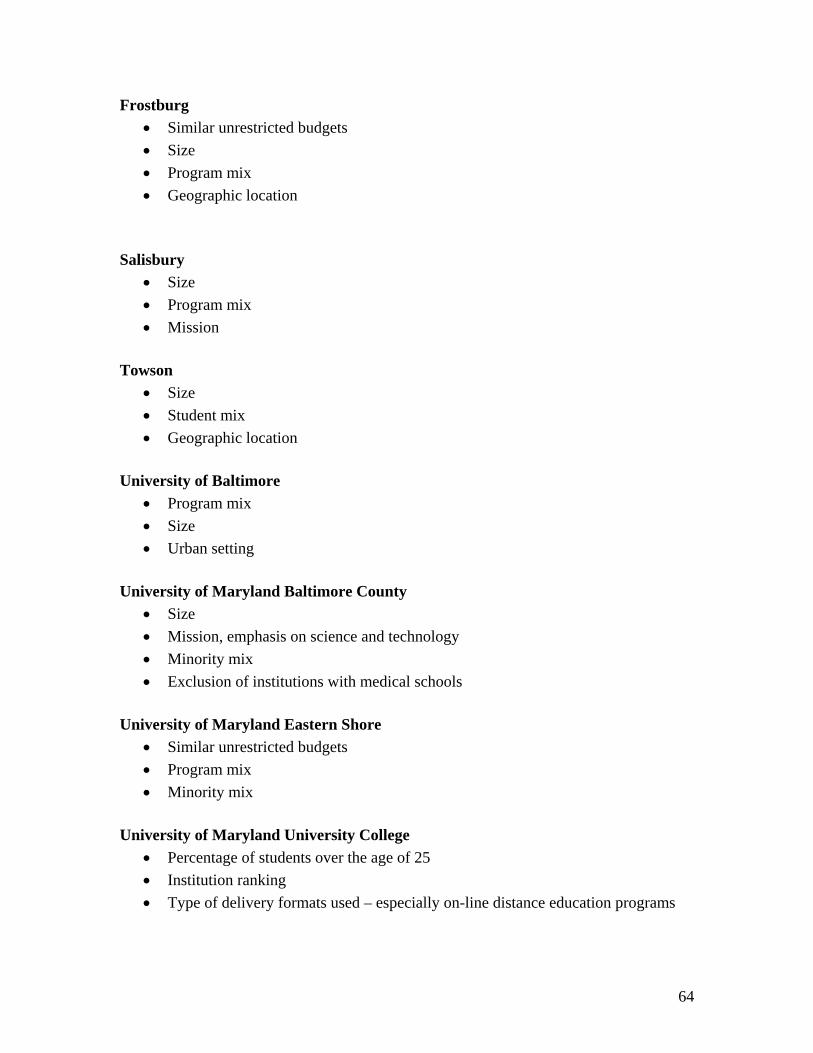
64
Frostburg • Similar unrestricted budgets • Size • Program mix • Geographic location
Salisbury • Size • Program mix • Mission
Towson
• Size • Student mix • Geographic location
University of Baltimore
• Program mix • Size • Urban setting
University of Maryland Baltimore County
• Size • Mission, emphasis on science and technology • Minority mix • Exclusion of institutions with medical schools
University of Maryland Eastern Shore
• Similar unrestricted budgets • Program mix • Minority mix
University of Maryland University College
• Percentage of students over the age of 25 • Institution ranking • Type of delivery formats used – especially on-line distance education programs
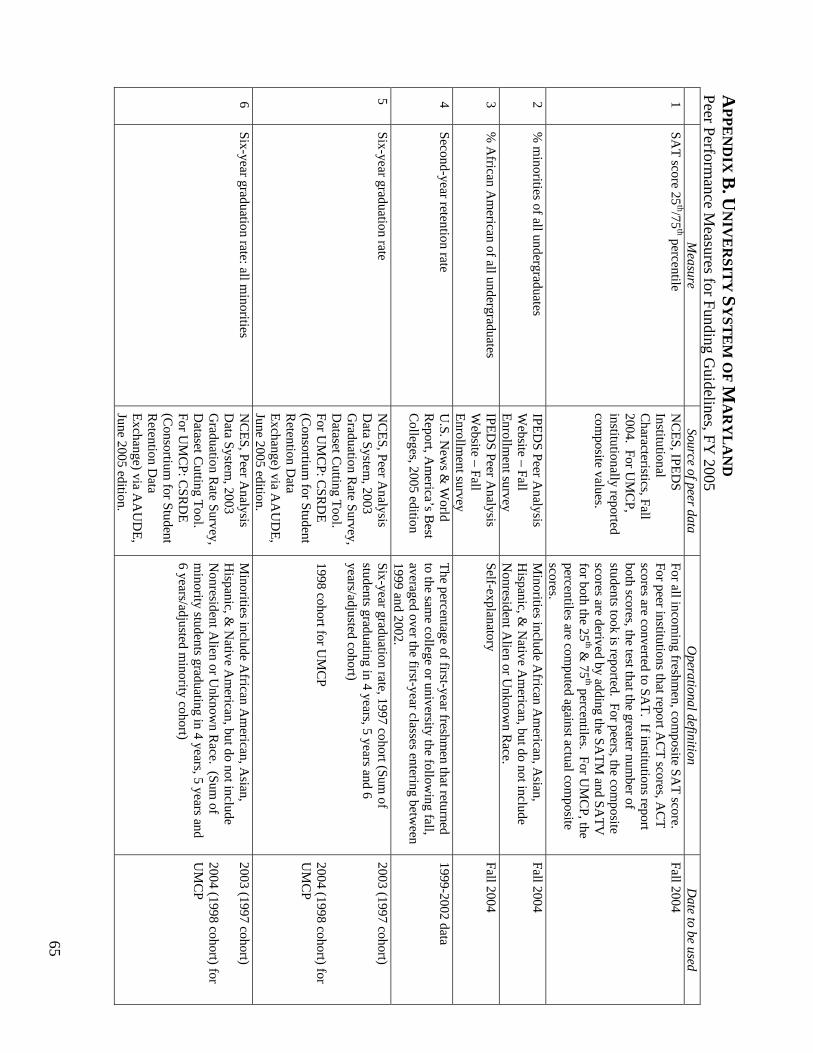
65
APPE
ND
IX B
. UN
IVE
RSIT
Y S
YST
EM
OF M
AR
YL
AN
D Peer Perform
ance Measures for Funding G
uidelines, FY 2005
M
easure Source of peer data
Operational definition
Date to be used
1 SA
T score 25th/75
th percentile N
CES, IPED
S Institutional C
haracteristics, Fall 2004. For U
MC
P, institutionally reported com
posite values.
For all incoming freshm
en, composite SA
T score. For peer institutions that report A
CT scores, A
CT
scores are converted to SAT. If institutions report
both scores, the test that the greater number of
students took is reported. For peers, the composite
scores are derived by adding the SATM
and SATV
for both the 25
th & 75
th percentiles. For UM
CP, the
percentiles are computed against actual com
posite scores.
Fall 2004
2 %
minorities of all undergraduates
IPEDS Peer A
nalysis W
ebsite – Fall Enrollm
ent survey
Minorities include A
frican Am
erican, Asian,
Hispanic, &
Native A
merican, but do not include
Nonresident A
lien or Unknow
n Race.
Fall 2004
3 %
African A
merican of all undergraduates
IPEDS Peer A
nalysis W
ebsite – Fall Enrollm
ent survey
Self-explanatory Fall 2004
4 Second-year retention rate
U.S. N
ews &
World
Report, A
merica’s B
est C
olleges, 2005 edition
The percentage of first-year freshmen that returned
to the same college or university the follow
ing fall, averaged over the first-year classes entering betw
een 1999 and 2002.
1999-2002 data
5 Six-year graduation rate
NC
ES, Peer Analysis
Data System
, 2003 G
raduation Rate Survey,
Dataset C
utting Tool. For U
MC
P: CSR
DE
(Consortium
for Student R
etention Data
Exchange) via AA
UD
E, June 2005 edition.
Six-year graduation rate, 1997 cohort (Sum of
students graduating in 4 years, 5 years and 6 years/adjusted cohort) 1998 cohort for U
MC
P
2003 (1997 cohort) 2004 (1998 cohort) for U
MC
P
6 Six-year graduation rate: all m
inorities N
CES, Peer A
nalysis D
ata System, 2003
Graduation R
ate Survey, D
ataset Cutting Tool.
For UM
CP: C
SRD
E (C
onsortium for Student
Retention D
ata Exchange) via A
AU
DE,
June 2005 edition.
Minorities include A
frican Am
erican, Asian,
Hispanic, &
Native A
merican, but do not include
Nonresident A
lien or Unknow
n Race. (Sum
of m
inority students graduating in 4 years, 5 years and 6 years/adjusted m
inority cohort)
2003 (1997 cohort) 2004 (1998 cohort) for U
MC
P
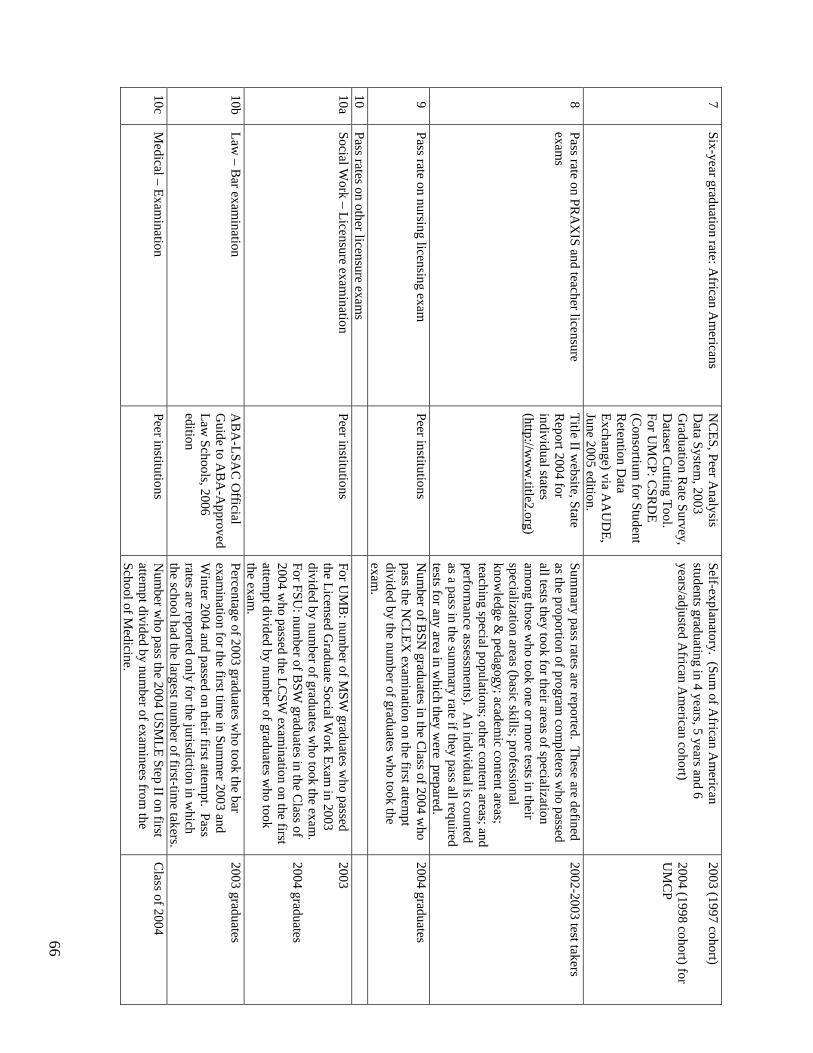
66
7 Six-year graduation rate: A
frican Am
ericans N
CES, Peer A
nalysis D
ata System, 2003
Graduation R
ate Survey, D
ataset Cutting Tool.
For UM
CP: C
SRD
E (C
onsortium for Student
Retention D
ata Exchange) via A
AU
DE,
June 2005 edition.
Self-explanatory. (Sum of A
frican Am
erican students graduating in 4 years, 5 years and 6 years/adjusted A
frican Am
erican cohort)
2003 (1997 cohort) 2004 (1998 cohort) for U
MC
P
8 Pass rate on PR
AX
IS and teacher licensure exam
s Title II w
ebsite, State R
eport 2004 for individual states (http://w
ww
.title2.org)
Summ
ary pass rates are reported. These are defined as the proportion of program
completers w
ho passed all tests they took for their areas of specialization am
ong those who took one or m
ore tests in their specialization areas (basic skills; professional know
ledge & pedagogy; academ
ic content areas; teaching special populations; other content areas; and perform
ance assessments). A
n individual is counted as a pass in the sum
mary rate if they pass all required
tests for any area in which they w
ere prepared.
2002-2003 test takers
9 Pass rate on nursing licensing exam
Peer institutions
Num
ber of BSN
graduates in the Class of 2004 w
ho pass the N
CLEX
examination on the first attem
pt divided by the num
ber of graduates who took the
exam.
2004 graduates
10 Pass rates on other licensure exam
s
10a Social W
ork – Licensure examination
Peer institutions For U
MB
: number of M
SW graduates w
ho passed the Licensed G
raduate Social Work Exam
in 2003 divided by num
ber of graduates who took the exam
. For FSU
: number of B
SW graduates in the C
lass of 2004 w
ho passed the LCSW
examination on the first
attempt divided by num
ber of graduates who took
the exam.
2003 2004 graduates
10b Law
– Bar exam
ination A
BA
-LSAC
Official
Guide to A
BA
-Approved
Law Schools, 2006
edition
Percentage of 2003 graduates who took the bar
examination for the first tim
e in Summ
er 2003 and W
inter 2004 and passed on their first attempt. Pass
rates are reported only for the jurisdiction in which
the school had the largest number of first-tim
e takers.
2003 graduates
10c M
edical – Examination
Peer institutions N
umber w
ho pass the 2004 USM
LE Step II on first attem
pt divided by number of exam
inees from the
School of Medicine.
Class of 2004
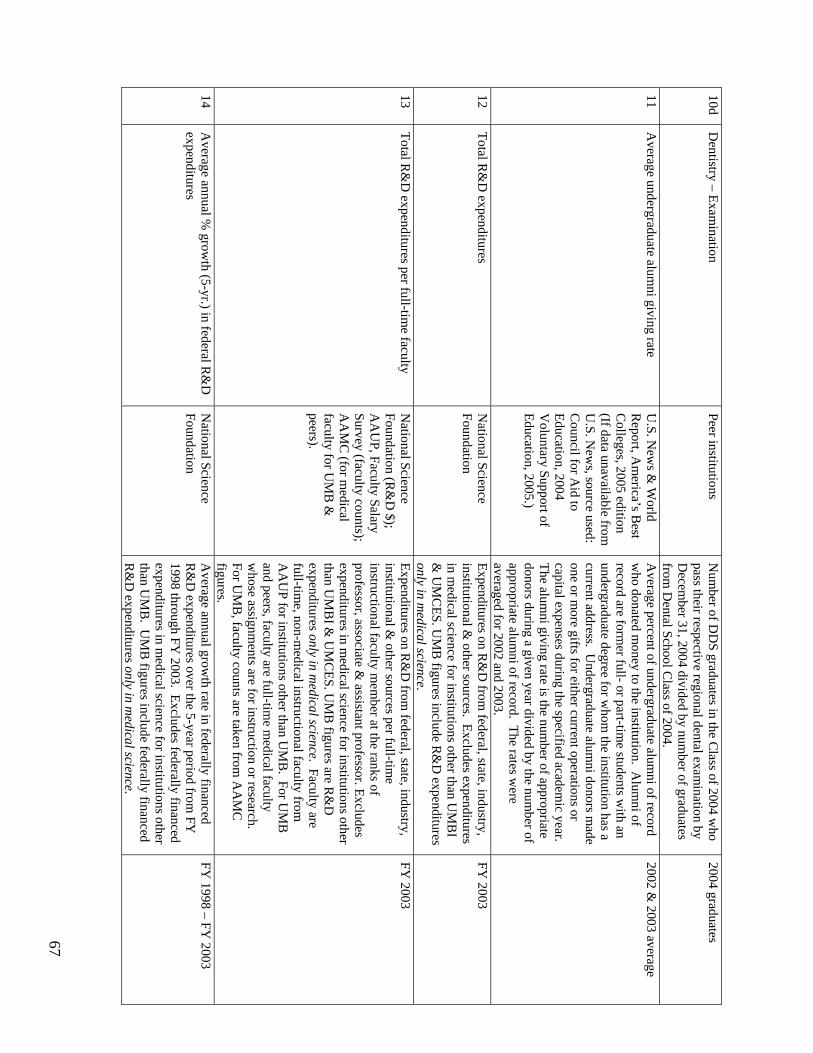
67
10d D
entistry – Examination
Peer institutions N
umber of D
DS graduates in the C
lass of 2004 who
pass their respective regional dental examination by
Decem
ber 31, 2004 divided by number of graduates
from D
ental School Class of 2004.
2004 graduates
11 A
verage undergraduate alumni giving rate
U.S. N
ews &
World
Report, A
merica’s B
est C
olleges, 2005 edition (If data unavailable from
U
.S. New
s, source used: C
ouncil for Aid to
Education, 2004 V
oluntary Support of Education, 2005.)
Average percent of undergraduate alum
ni of record w
ho donated money to the institution. A
lumni of
record are former full- or part-tim
e students with an
undergraduate degree for whom
the institution has a current address. U
ndergraduate alumni donors m
ade one or m
ore gifts for either current operations or capital expenses during the specified academ
ic year. The alum
ni giving rate is the number of appropriate
donors during a given year divided by the number of
appropriate alumni of record. The rates w
ere averaged for 2002 and 2003.
2002 & 2003 average
12 Total R
&D
expenditures N
ational Science Foundation
Expenditures on R&
D from
federal, state, industry, institutional &
other sources. Excludes expenditures in m
edical science for institutions other than UM
BI
& U
MC
ES. UM
B figures include R
&D
expenditures only in m
edical science.
FY 2003
13 Total R
&D
expenditures per full-time faculty
National Science
Foundation (R&
D $);
AA
UP, Faculty Salary
Survey (faculty counts); A
AM
C (for m
edical faculty for U
MB
&
peers).
Expenditures on R&
D from
federal, state, industry, institutional &
other sources per full-time
instructional faculty mem
ber at the ranks of professor, associate &
assistant professor. Excludes expenditures in m
edical science for institutions other than U
MB
I & U
MC
ES. UM
B figures are R
&D
expenditures only in m
edical science. Faculty are full-tim
e, non-medical instructional faculty from
A
AU
P for institutions other than UM
B. For U
MB
and peers, faculty are full-tim
e medical faculty
whose assignm
ents are for instruction or research. For U
MB
, faculty counts are taken from A
AM
C
figures.
FY 2003
14 A
verage annual % grow
th (5-yr.) in federal R&
D
expenditures N
ational Science Foundation
Average annual grow
th rate in federally financed R
&D
expenditures over the 5-year period from FY
1998 through FY
2003. Excludes federally financed expenditures in m
edical science for institutions other than U
MB
. UM
B figures include federally financed
R&
D expenditures only in m
edical science.
FY 1998 – FY
2003
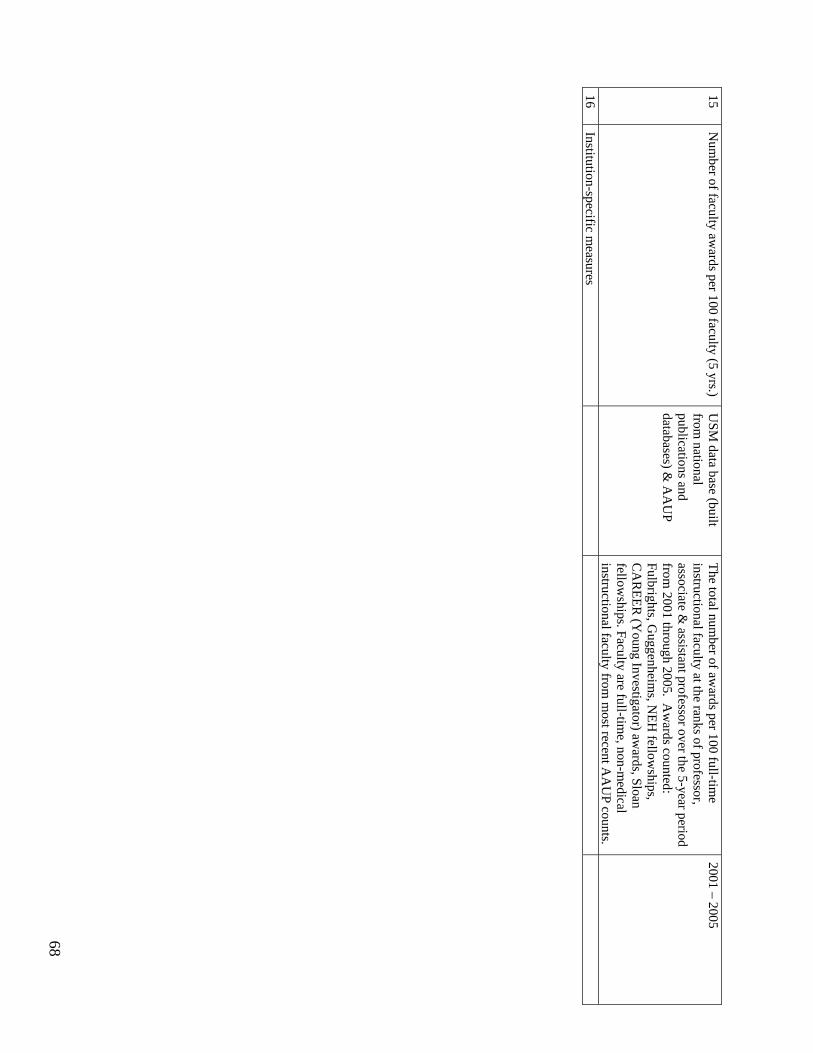
68
15 N
umber of faculty aw
ards per 100 faculty (5 yrs.) U
SM data base (built
from national
publications and databases) &
AA
UP
The total number of aw
ards per 100 full-time
instructional faculty at the ranks of professor, associate &
assistant professor over the 5-year period from
2001 through 2005. Aw
ards counted: Fulbrights, G
uggenheims, N
EH fellow
ships, C
AR
EER (Y
oung Investigator) awards, Sloan
fellowships. Faculty are full-tim
e, non-medical
instructional faculty from m
ost recent AA
UP counts.
2001 – 2005
16 Institution-specific m
easures
E:\PERFO
RM
AN
CE\2005\M
EASU
RESD
EFIN05.D
OC
, 8-23-05 CB
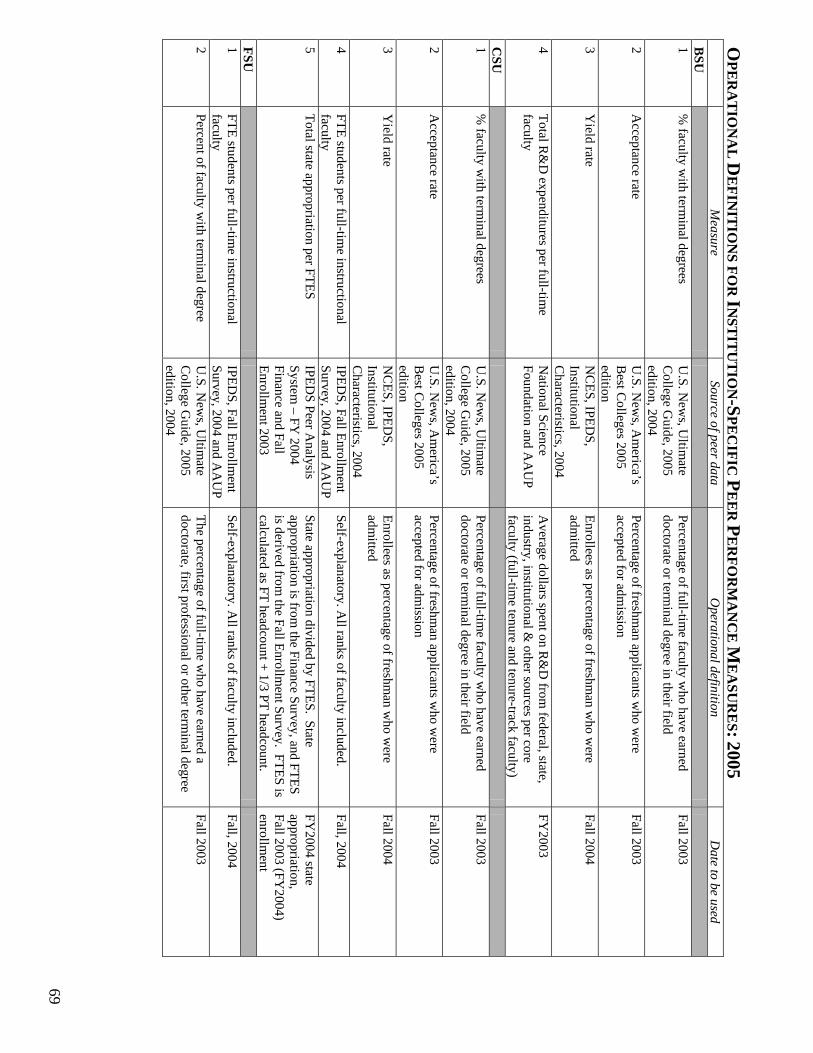
69
OPE
RA
TIO
NA
L D
EFIN
ITIO
NS FO
R IN
STIT
UT
ION-S
PEC
IFIC P
EE
R P
ER
FOR
MA
NC
E M
EA
SUR
ES: 2005
Measure
Source of peer data O
perational definition D
ate to be used B
SU
1 %
faculty with term
inal degrees U
.S. New
s, Ultim
ate C
ollege Guide, 2005
edition, 2004
Percentage of full-time faculty w
ho have earned doctorate or term
inal degree in their field Fall 2003
2 A
cceptance rate U
.S. New
s, Am
erica’s B
est Colleges 2005
edition
Percentage of freshman applicants w
ho were
accepted for admission
Fall 2003
3 Y
ield rate N
CES, IPED
S, Institutional C
haracteristics, 2004
Enrollees as percentage of freshman w
ho were
admitted
Fall 2004
4 Total R
&D
expenditures per full-time
faculty N
ational Science Foundation and A
AU
P A
verage dollars spent on R&
D from
federal, state, industry, institutional &
other sources per core faculty (full-tim
e tenure and tenure-track faculty)
FY2003
CSU
1
% faculty w
ith terminal degrees
U.S. N
ews, U
ltimate
College G
uide, 2005 edition, 2004
Percentage of full-time faculty w
ho have earned doctorate or term
inal degree in their field Fall 2003
2 A
cceptance rate U
.S. New
s, Am
erica’s B
est Colleges 2005
edition
Percentage of freshman applicants w
ho were
accepted for admission
Fall 2003
3 Y
ield rate N
CES, IPED
S, Institutional C
haracteristics, 2004
Enrollees as percentage of freshman w
ho were
admitted
Fall 2004
4 FTE students per full-tim
e instructional faculty
IPEDS, Fall Enrollm
ent Survey, 2004 and A
AU
P Self-explanatory. A
ll ranks of faculty included. Fall, 2004
5 Total state appropriation per FTES
IPEDS Peer A
nalysis System
– FY 2004
Finance and Fall Enrollm
ent 2003
State appropriation divided by FTES. State appropriation is from
the Finance Survey, and FTES is derived from
the Fall Enrollment Survey. FTES is
calculated as FT headcount + 1/3 PT headcount.
FY2004 state
appropriation, Fall 2003 (FY
2004) enrollm
ent FSU
1
FTE students per full-time instructional
faculty IPED
S, Fall Enrollment
Survey, 2004 and AA
UP
Self-explanatory. All ranks of faculty included.
Fall, 2004
2 Percent of faculty w
ith terminal degree
U.S. N
ews, U
ltimate
College G
uide, 2005 edition, 2004
The percentage of full-time w
ho have earned a doctorate, first professional or other term
inal degree Fall 2003
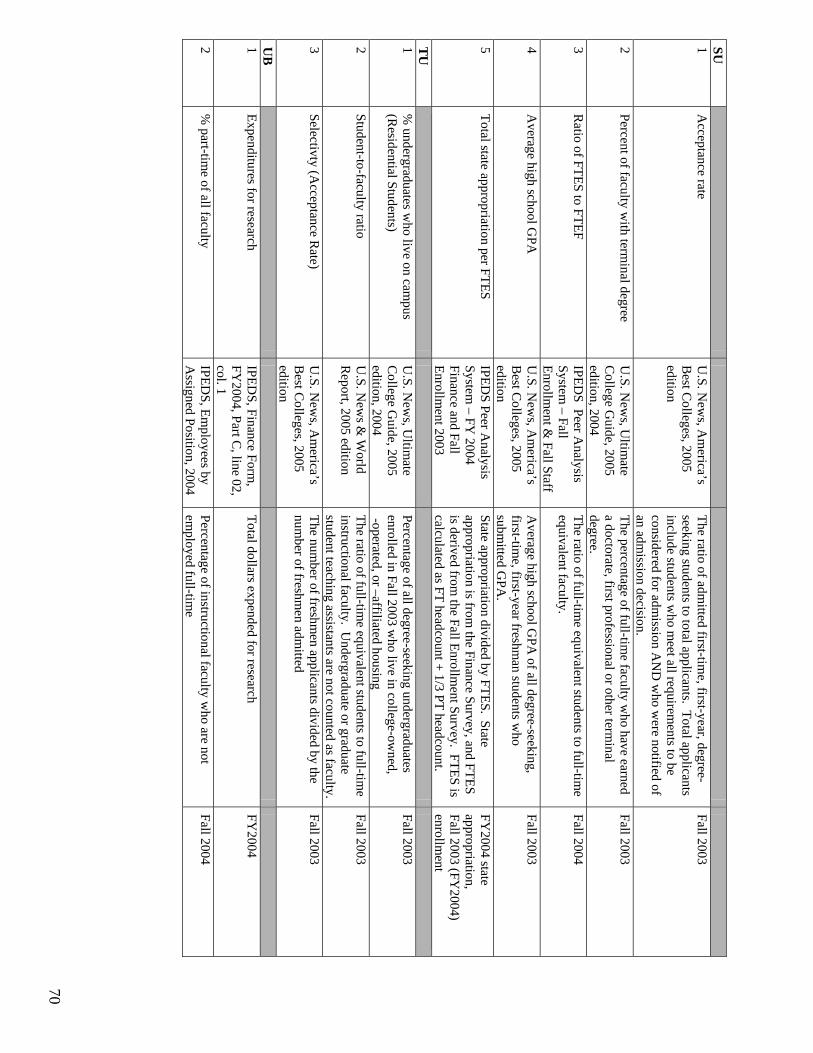
70
SU
1 A
cceptance rate U
.S. New
s, Am
erica’s B
est Colleges, 2005
edition
The ratio of admitted first-tim
e, first-year, degree-seeking students to total applicants. Total applicants include students w
ho meet all requirem
ents to be considered for adm
ission AN
D w
ho were notified of
an admission decision.
Fall 2003
2 Percent of faculty w
ith terminal degree
U.S. N
ews, U
ltimate
College G
uide, 2005 edition, 2004
The percentage of full-time faculty w
ho have earned a doctorate, first professional or other term
inal degree.
Fall 2003
3 R
atio of FTES to FTEF IPED
S Peer Analysis
System – Fall
Enrollment &
Fall Staff
The ratio of full-time equivalent students to full-tim
e equivalent faculty.
Fall 2004
4 A
verage high school GPA
U
.S. New
s, Am
erica’s B
est Colleges, 2005
edition
Average high school G
PA of all degree-seeking,
first-time, first-year freshm
an students who
submitted G
PA.
Fall 2003
5 Total state appropriation per FTES
IPEDS Peer A
nalysis System
– FY 2004
Finance and Fall Enrollm
ent 2003
State appropriation divided by FTES. State appropriation is from
the Finance Survey, and FTES is derived from
the Fall Enrollment Survey. FTES is
calculated as FT headcount + 1/3 PT headcount.
FY2004 state
appropriation, Fall 2003 (FY
2004) enrollm
ent T
U
1 %
undergraduates who live on cam
pus (R
esidential Students) U
.S. New
s, Ultim
ate C
ollege Guide, 2005
edition, 2004
Percentage of all degree-seeking undergraduates enrolled in Fall 2003 w
ho live in college-owned,
-operated, or –affiliated housing
Fall 2003
2 Student-to-faculty ratio
U.S. N
ews &
World
Report, 2005 edition
The ratio of full-time equivalent students to full-tim
e instructional faculty. U
ndergraduate or graduate student teaching assistants are not counted as faculty.
Fall 2003
3 Selectivty (A
cceptance Rate)
U.S. N
ews, A
merica’s
Best C
olleges, 2005 edition
The number of freshm
en applicants divided by the num
ber of freshmen adm
itted Fall 2003
UB
1
Expenditures for research IPED
S, Finance Form,
FY2004, Part C
, line 02, col. 1
Total dollars expended for research FY
2004
2 %
part-time of all faculty
IPEDS, Em
ployees by A
ssigned Position, 2004 Percentage of instructional faculty w
ho are not em
ployed full-time
Fall 2004
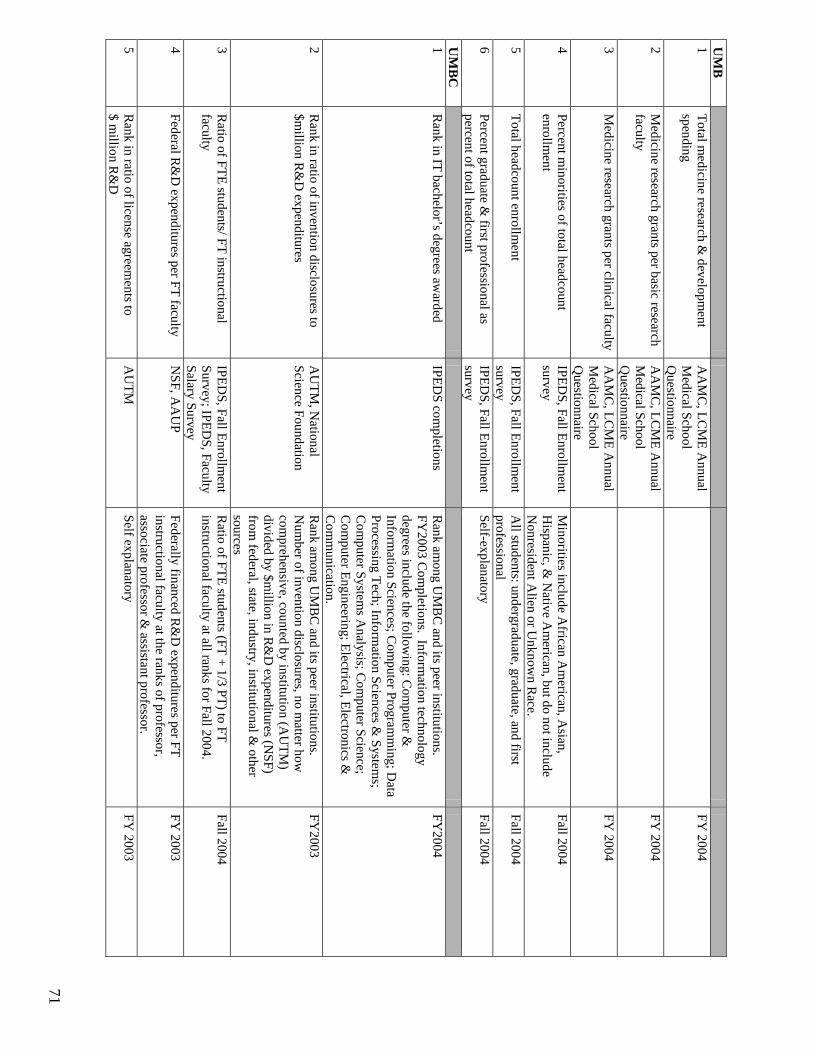
71
UM
B
1 Total m
edicine research & developm
ent spending
AA
MC
, LCM
E Annual
Medical School
Questionnaire
FY
2004
2 M
edicine research grants per basic research faculty
AA
MC
, LCM
E Annual
Medical School
Questionnaire
FY
2004
3 M
edicine research grants per clinical faculty A
AM
C, LC
ME A
nnual M
edical School Q
uestionnaire
FY
2004
4 Percent m
inorities of total headcount enrollm
ent IPED
S, Fall Enrollment
survey M
inorities include African A
merican, A
sian, H
ispanic, & N
ative Am
erican, but do not include N
onresident Alien or U
nknown R
ace.
Fall 2004
5 Total headcount enrollm
ent IPED
S, Fall Enrollment
survey A
ll students: undergraduate, graduate, and first professional
Fall 2004
6 Percent graduate &
first professional as percent of total headcount
IPEDS, Fall Enrollm
ent survey
Self-explanatory Fall 2004
UM
BC
1
Rank in IT bachelor’s degrees aw
arded IPED
S completions
Rank am
ong UM
BC
and its peer institutions. FY
2003 Com
pletions. Information technology
degrees include the following: C
omputer &
Inform
ation Sciences; Com
puter Programm
ing; Data
Processing Tech; Information Sciences &
Systems;
Com
puter Systems A
nalysis; Com
puter Science; C
omputer Engineering; Electrical, Electronics &
C
omm
unication.
FY2004
2 R
ank in ratio of invention disclosures to $m
illion R&
D expenditures
AU
TM, N
ational Science Foundation
Rank am
ong UM
BC
and its peer institutions. N
umber of invention disclosures, no m
atter how
comprehensive, counted by institution (A
UTM
) divided by $m
illion in R&
D expenditures (N
SF) from
federal, state, industry, institutional & other
sources
FY2003
3 R
atio of FTE students/ FT instructional faculty
IPEDS, Fall Enrollm
ent Survey; IPED
S, Faculty Salary Survey
Ratio of FTE students (FT + 1/3 PT) to FT
instructional faculty at all ranks for Fall 2004. Fall 2004
4 Federal R
&D
expenditures per FT faculty N
SF, AA
UP
Federally financed R&
D expenditures per FT
instructional faculty at the ranks of professor, associate professor &
assistant professor.
FY 2003
5 R
ank in ratio of license agreements to
$ million R
&D
A
UTM
Self explanatory
FY 2003
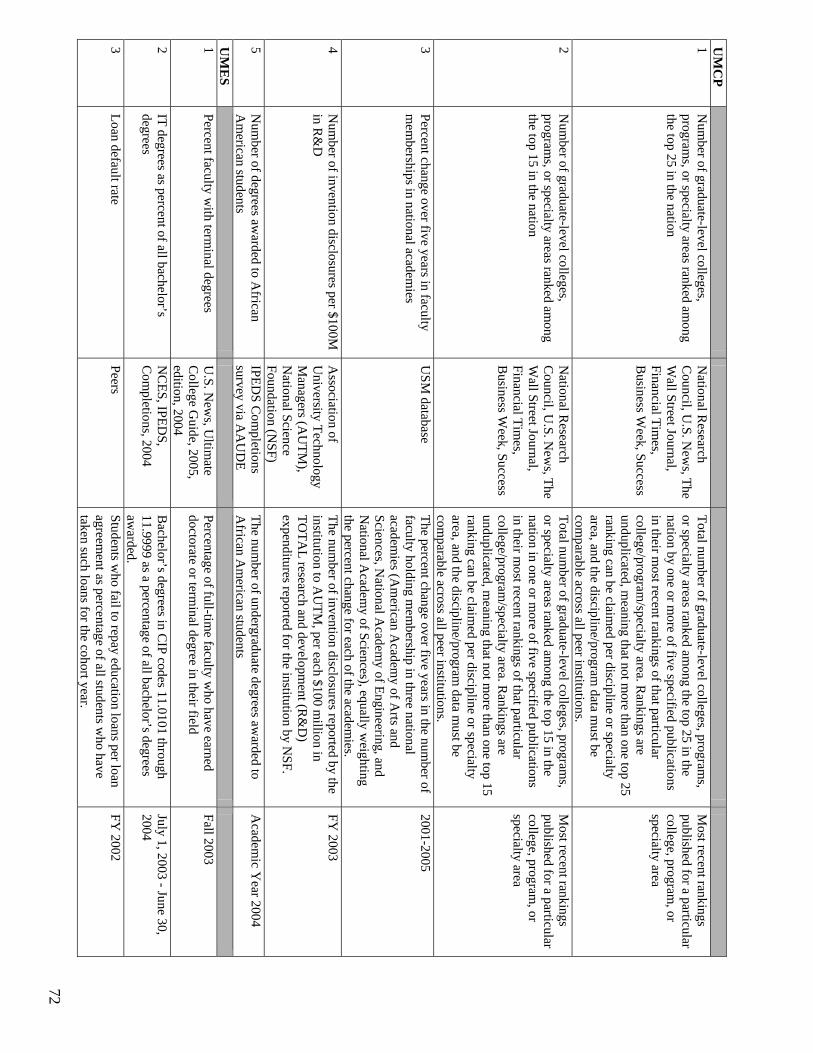
72
UM
CP
1 N
umber of graduate-level colleges,
programs, or specialty areas ranked am
ong the top 25 in the nation
National R
esearch C
ouncil, U.S. N
ews, The
Wall Street Journal,
Financial Times,
Business W
eek, Success
Total number of graduate-level colleges, program
s, or specialty areas ranked am
ong the top 25 in the nation by one or m
ore of five specified publications in their m
ost recent rankings of that particular college/program
/specialty area. Rankings are
unduplicated, meaning that not m
ore than one top 25 ranking can be claim
ed per discipline or specialty area, and the discipline/program
data must be
comparable across all peer institutions.
Most recent rankings
published for a particular college, program
, or specialty area
2 N
umber of graduate-level colleges,
programs, or specialty areas ranked am
ong the top 15 in the nation
National R
esearch C
ouncil, U.S. N
ews, The
Wall Street Journal,
Financial Times,
Business W
eek, Success
Total number of graduate-level colleges, program
s, or specialty areas ranked am
ong the top 15 in the nation in one or m
ore of five specified publications in their m
ost recent rankings of that particular college/program
/specialty area. Rankings are
unduplicated, meaning that not m
ore than one top 15 ranking can be claim
ed per discipline or specialty area, and the discipline/program
data must be
comparable across all peer institutions.
Most recent rankings
published for a particular college, program
, or specialty area
3 Percent change over five years in faculty m
emberships in national academ
ies U
SM database
The percent change over five years in the number of
faculty holding mem
bership in three national academ
ies (Am
erican Academ
y of Arts and
Sciences, National A
cademy of Engineering, and
National A
cademy of Sciences), equally w
eighting the percent change for each of the academ
ies.
2001-2005
4 N
umber of invention disclosures per $100M
in R
&D
A
ssociation of U
niversity Technology M
anagers (AU
TM),
National Science
Foundation (NSF)
The number of invention disclosures reported by the
institution to AU
TM, per each $100 m
illion in TO
TAL research and developm
ent (R&
D)
expenditures reported for the institution by NSF.
FY 2003
5 N
umber of degrees aw
arded to African
Am
erican students IPED
S Com
pletions survey via A
AU
DE
The number of undergraduate degrees aw
arded to A
frican Am
erican students A
cademic Y
ear 2004
UM
ES
1 Percent faculty w
ith terminal degrees
U.S. N
ews, U
ltimate
College G
uide, 2005, edition, 2004
Percentage of full-time faculty w
ho have earned doctorate or term
inal degree in their field Fall 2003
2 IT degrees as percent of all bachelor’s degrees
NC
ES, IPEDS,
Com
pletions, 2004 B
achelor’s degrees in CIP codes 11.0101 through
11.9999 as a percentage of all bachelor’s degrees aw
arded.
July 1, 2003 - June 30, 2004
3 Loan default rate
Peers Students w
ho fail to repay education loans per loan agreem
ent as percentage of all students who have
taken such loans for the cohort year.
FY 2002
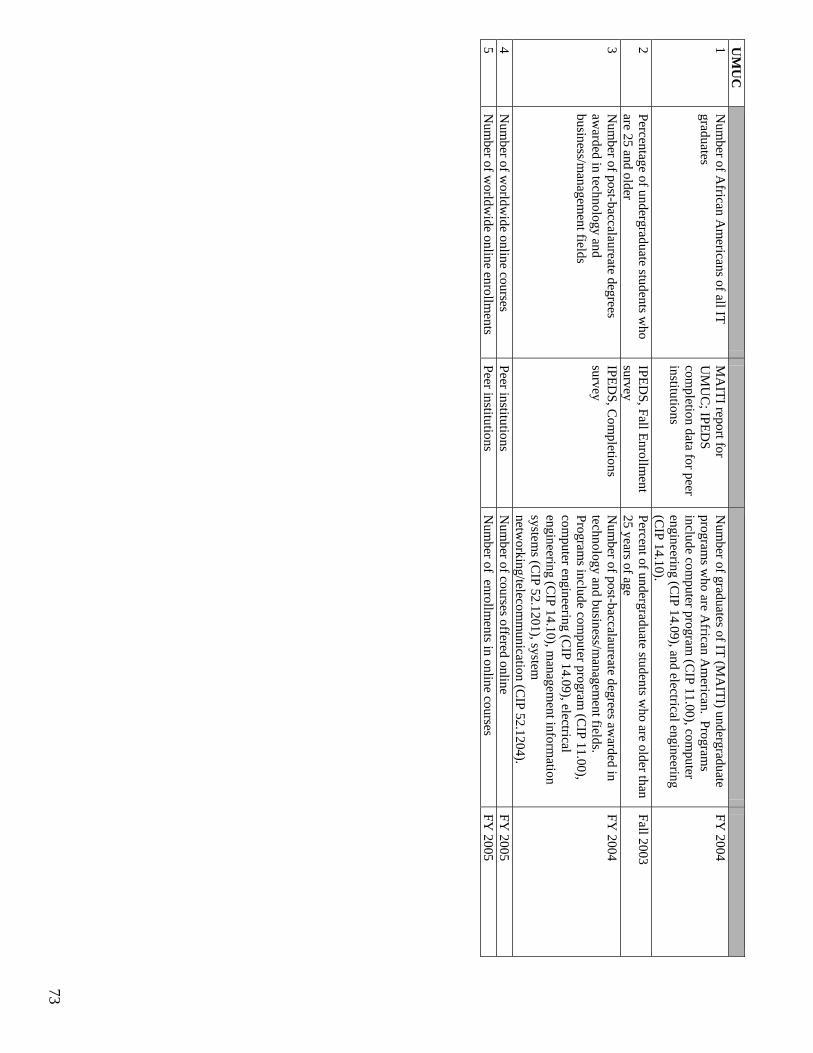
73
UM
UC
1
Num
ber of African A
mericans of all IT
graduates M
AITI report for
UM
UC
; IPEDS
completion data for peer
institutions
Num
ber of graduates of IT (MA
ITI) undergraduate program
s who are A
frican Am
erican. Programs
include computer program
(CIP 11.00), com
puter engineering (C
IP 14.09), and electrical engineering (C
IP 14.10).
FY 2004
2 Percentage of undergraduate students w
ho are 25 and older
IPEDS, Fall Enrollm
ent survey
Percent of undergraduate students who are older than
25 years of age Fall 2003
3 N
umber of post-baccalaureate degrees
awarded in technology and
business/managem
ent fields
IPEDS, C
ompletions
survey N
umber of post-baccalaureate degrees aw
arded in technology and business/m
anagement fields.
Programs include com
puter program (C
IP 11.00), com
puter engineering (CIP 14.09), electrical
engineering (CIP 14.10), m
anagement inform
ation system
s (CIP 52.1201), system
netw
orking/telecomm
unication (CIP 52.1204).
FY 2004
4 N
umber of w
orldwide online courses
Peer institutions N
umber of courses offered online
FY 2005
5 N
umber of w
orldwide online enrollm
ents Peer institutions
Num
ber of enrollments in online courses
FY 2005
E:\PERFO
RM
AN
CE\2005\SPEC
IFIND
ICA
TOR
S05.DO
C, 8-23-05 C
B

74

75
APPE
ND
IX C
. MO
RG
AN
ST
AT
E U
NIV
ER
SITY
OPE
RA
TIO
NA
L D
EFIN
ITIO
NS F
OR
PE
RFO
RM
AN
CE
IND
ICA
TO
RS
M
easure Source of peer data
Operational definition
Date U
sed 1
Second-year retention rate M
aryland Higher Education
Com
mission (M
HEC
) – Enrollm
ent Information
System (EIS), D
egree Inform
ation System (D
IS).
The percentage of first-time, full-tim
e degree seeking undergraduates that re-enrolled at the original institution one year after m
atriculation.
Fall 2004 cohort
2 Second-year retention rate of A
frican A
mericans
MH
EC – EIS, D
IS. Peer institutions.
The percentage of first-time, full-tim
e degree seeking A
frican Am
erican undergraduates that re-enrolled at the original institution one year after m
atriculation.
Fall 2004 cohort
3 Second-year retention rate of m
inorities M
HEC
– EIS, DIS.
Peer institutions. In this context, the term
“minorities” refers to
mem
bers of the African American, N
ative American,
Asian, and Hispanic student groups.
The percentage of first-time, full-tim
e degree seeking A
frican Am
erican, Native A
merican, A
sian, and H
ispanic undergraduates that re-enrolled at the original institution one year after m
atriculation.
Fall 2004 cohort
4 Six-year graduation rate
MH
EC – EIS, D
IS. IPED
S, Graduation R
ate Survey; N
CA
A.
The percentage of first-time, full-tim
e degree seeking undergraduates that graduated from
the original institution w
ithin six years of matriculation.
Fall 1999 cohort
5 Six-year graduation rate of A
frican A
mericans
MH
EC – EIS, D
IS. IPED
S, Graduation R
ate Survey; N
CA
A.
The percentage of first-time, full-tim
e degree seeking A
frican Am
erican undergraduates who graduated
from the original institution w
ithin six years of m
atriculation.
Fall 1999 cohort
6 Six-year graduation rate of m
inorities M
HEC
– EIS, DIS.
IPEDS, G
raduation Rate
Survey; NC
AA
.
In this context, the term “m
inorities” refers to m
embers of the African Am
erican, Native Am
erican, Asian, and H
ispanic student groups. The percentage of first-tim
e, full-time degree seeking
African A
merican, N
ative Am
erican, Asian, and
Hispanic undergraduates w
ho graduated from the
original institution within six years of m
atriculation.
Fall 1999 cohort
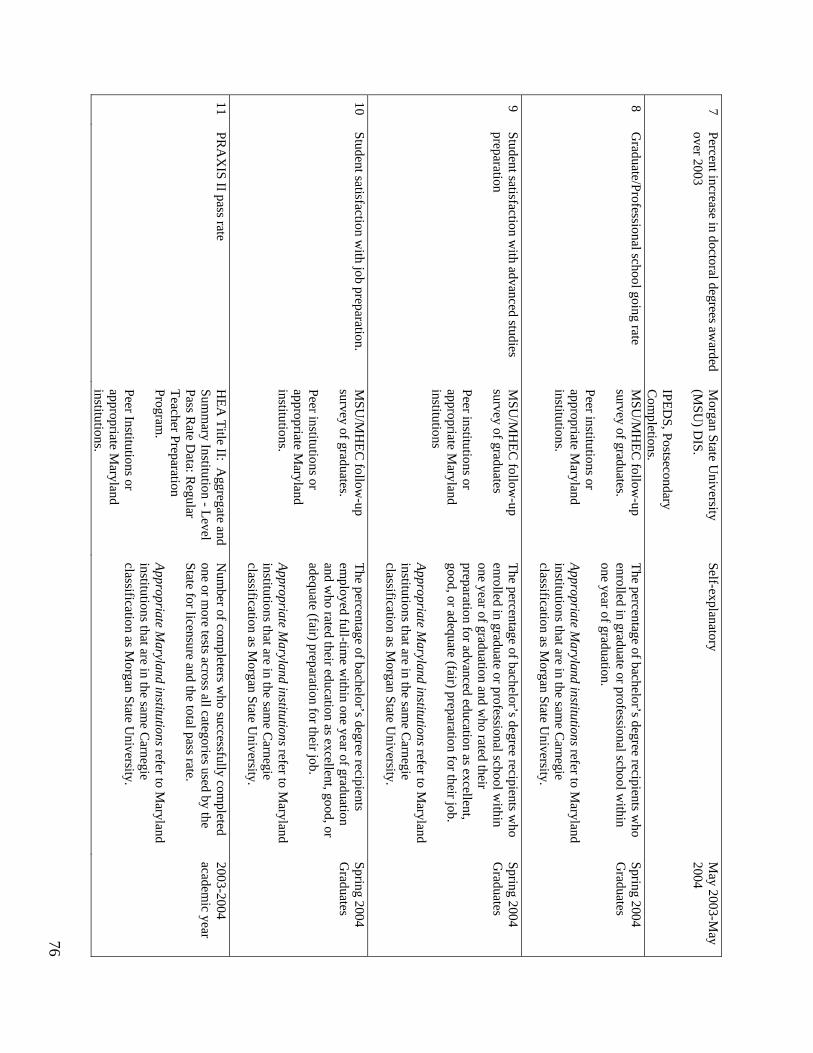
76
7 Percent increase in doctoral degrees aw
arded over 2003
Morgan State U
niversity (M
SU) D
IS. IPED
S, Postsecondary C
ompletions.
Self-explanatory M
ay 2003-May
2004
8 G
raduate/Professional school going rate M
SU/M
HEC
follow-up
survey of graduates. Peer institutions or appropriate M
aryland institutions.
The percentage of bachelor’s degree recipients who
enrolled in graduate or professional school within
one year of graduation. Appropriate M
aryland institutions refer to Maryland
institutions that are in the same C
arnegie classification as M
organ State University.
Spring 2004 G
raduates
9 Student satisfaction w
ith advanced studies preparation
MSU
/MH
EC follow
-up survey of graduates Peer institutions or appropriate M
aryland institutions
The percentage of bachelor’s degree recipients who
enrolled in graduate or professional school within
one year of graduation and who rated their
preparation for advanced education as excellent, good, or adequate (fair) preparation for their job. Appropriate M
aryland institutions refer to Maryland
institutions that are in the same C
arnegie classification as M
organ State University.
Spring 2004 G
raduates
10 Student satisfaction w
ith job preparation. M
SU/M
HEC
follow-up
survey of graduates. Peer institutions or appropriate M
aryland institutions.
The percentage of bachelor’s degree recipients em
ployed full-time w
ithin one year of graduation and w
ho rated their education as excellent, good, or adequate (fair) preparation for their job. Appropriate M
aryland institutions refer to Maryland
institutions that are in the same C
arnegie classification as M
organ State University.
Spring 2004 G
raduates
11 PR
AX
IS II pass rate H
EA Title II: A
ggregate and Sum
mary Institution - Level
Pass Rate D
ata: Regular
Teacher Preparation Program
. Peer Institutions or appropriate M
aryland institutions.
Num
ber of completers w
ho successfully completed
one or more tests across all categories used by the
State for licensure and the total pass rate. Appropriate M
aryland institutions refer to Maryland
institutions that are in the same C
arnegie classification as M
organ State University.
2003-2004 academ
ic year
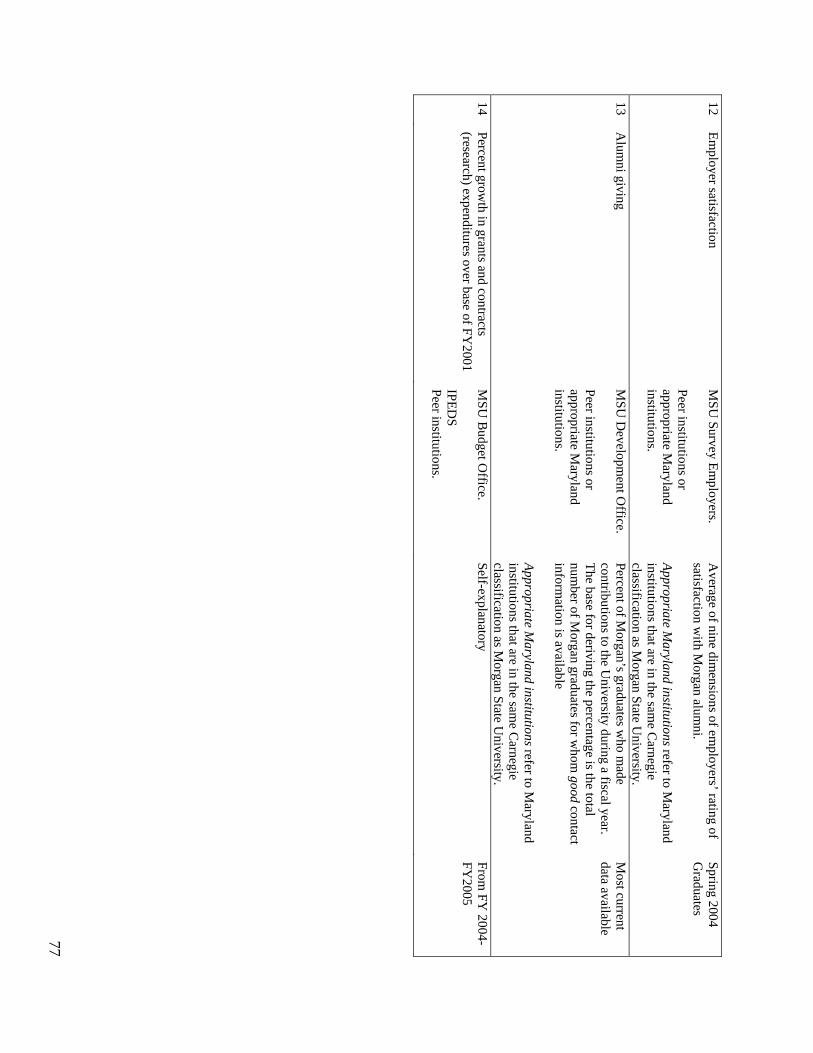
77
12 Em
ployer satisfaction M
SU Survey Em
ployers. Peer institutions or appropriate M
aryland institutions.
Average of nine dim
ensions of employers’ rating of
satisfaction with M
organ alumni.
Appropriate Maryland institutions refer to M
aryland institutions that are in the sam
e Carnegie
classification as Morgan State U
niversity.
Spring 2004 G
raduates
13 A
lumni giving
MSU
Developm
ent Office.
Peer institutions or appropriate M
aryland institutions.
Percent of Morgan’s graduates w
ho made
contributions to the University during a fiscal year.
The base for deriving the percentage is the total num
ber of Morgan graduates for w
hom good contact
information is available
Appropriate Maryland institutions refer to M
aryland institutions that are in the sam
e Carnegie
classification as Morgan State U
niversity.
Most current
data available
14 Percent grow
th in grants and contracts (research) expenditures over base of FY
2001 M
SU B
udget Office.
IPEDS
Peer institutions.
Self-explanatory From
FY 2004-
FY2005

78
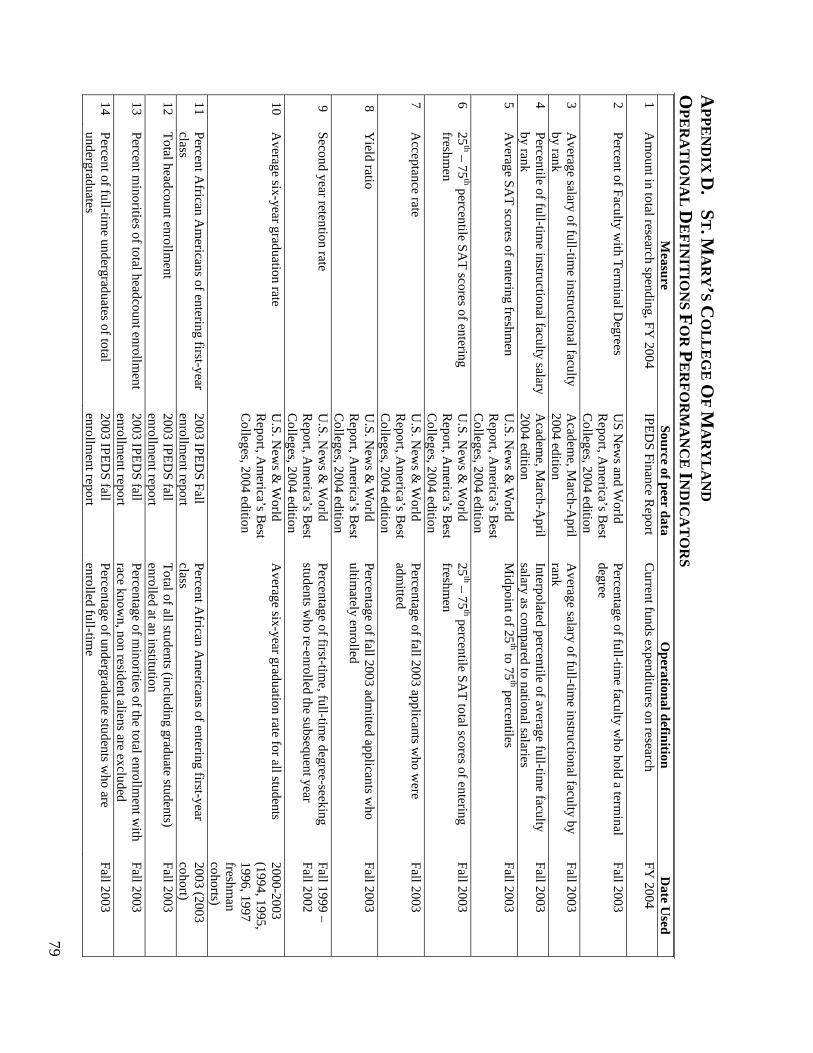
79
APPE
ND
IX D
. ST. M
AR
Y’S CO
LL
EG
E O
F MA
RY
LA
ND
OPE
RA
TIO
NA
L D
EFIN
ITIO
NS F
OR
PE
RFO
RM
AN
CE
IND
ICA
TO
RS
M
easure Source of peer data
Operational definition
Date U
sed 1
Am
ount in total research spending, FY 2004
IPEDS Finance R
eport
Current funds expenditures on research
FY 2004
2 Percent of Faculty w
ith Terminal D
egrees U
S New
s and World
Report, A
merica’s B
est C
olleges, 2004 edition
Percentage of full-time faculty w
ho hold a terminal
degree Fall 2003
3 A
verage salary of full-time instructional faculty
by rank A
cademe, M
arch-April
2004 edition A
verage salary of full-time instructional faculty by
rank Fall 2003
4 Percentile of full-tim
e instructional faculty salary by rank
Academ
e, March-A
pril 2004 edition
Interpolated percentile of average full-time faculty
salary as compared to national salaries
Fall 2003
5 A
verage SAT scores of entering freshm
en U
.S. New
s & W
orld R
eport, Am
erica’s Best
Colleges, 2004 edition
Midpoint of 25
th to 75th percentiles
Fall 2003
6 25
th – 75th percentile SA
T scores of entering freshm
en U
.S. New
s & W
orld R
eport, Am
erica’s Best
Colleges, 2004 edition
25th – 75
th percentile SAT total scores of entering
freshmen
Fall 2003
7 A
cceptance rate U
.S. New
s & W
orld R
eport, Am
erica’s Best
Colleges, 2004 edition
Percentage of fall 2003 applicants who w
ere adm
itted Fall 2003
8 Y
ield ratio U
.S. New
s & W
orld R
eport, Am
erica’s Best
Colleges, 2004 edition
Percentage of fall 2003 admitted applicants w
ho ultim
ately enrolled Fall 2003
9 Second year retention rate
U.S. N
ews &
World
Report, A
merica’s B
est C
olleges, 2004 edition
Percentage of first-time, full-tim
e degree-seeking students w
ho re-enrolled the subsequent year Fall 1999 – Fall 2002
10 A
verage six-year graduation rate U
.S. New
s & W
orld R
eport, Am
erica’s Best
Colleges, 2004 edition
Average six-year graduation rate for all students
2000-2003 (1994, 1995, 1996, 1997 freshm
an cohorts)
11 Percent A
frican Am
ericans of entering first-year class
2003 IPEDS Fall
enrollment report
Percent African A
mericans of entering first-year
class 2003 (2003 cohort)
12 Total headcount enrollm
ent 2003 IPED
S fall enrollm
ent report Total of all students (including graduate students) enrolled at an institution
Fall 2003
13 Percent m
inorities of total headcount enrollment
2003 IPEDS fall
enrollment report
Percentage of minorities of the total enrollm
ent with
race known, non resident aliens are excluded
Fall 2003
14 Percent of full-tim
e undergraduates of total undergraduates
2003 IPEDS fall
enrollment report
Percentage of undergraduate students who are
enrolled full-time
Fall 2003
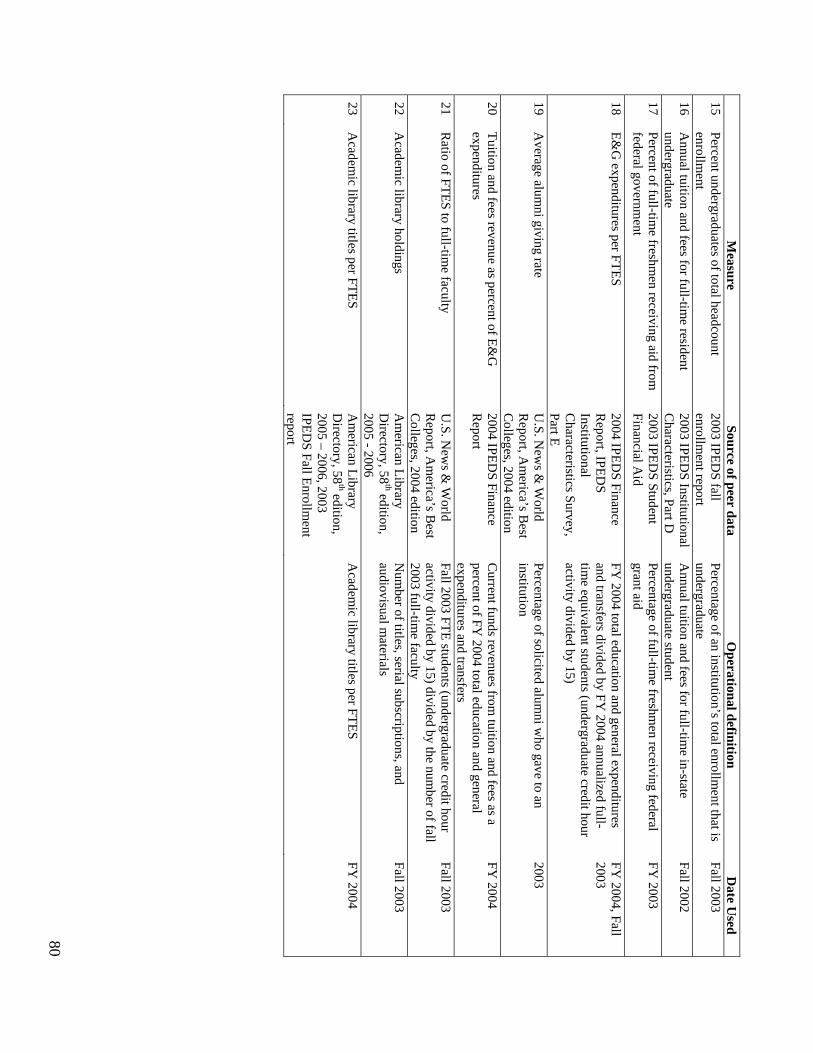
80
M
easure Source of peer data
Operational definition
Date U
sed 15
Percent undergraduates of total headcount enrollm
ent 2003 IPED
S fall enrollm
ent report Percentage of an institution’s total enrollm
ent that is undergraduate
Fall 2003
16 A
nnual tuition and fees for full-time resident
undergraduate 2003 IPED
S Institutional C
haracteristics, Part D
Annual tuition and fees for full-tim
e in-state undergraduate student
Fall 2002
17 Percent of full-tim
e freshmen receiving aid from
federal governm
ent 2003 IPED
S Student Financial A
id Percentage of full-tim
e freshmen receiving federal
grant aid FY
2003
18 E&
G expenditures per FTES
2004 IPEDS Finance
Report, IPED
S Institutional C
haracteristics Survey, Part E
FY 2004 total education and general expenditures
and transfers divided by FY 2004 annualized full-
time equivalent students (undergraduate credit hour
activity divided by 15)
FY 2004, Fall
2003
19 A
verage alumni giving rate
U.S. N
ews &
World
Report, A
merica’s B
est C
olleges, 2004 edition
Percentage of solicited alumni w
ho gave to an institution
2003
20 Tuition and fees revenue as percent of E&
G
expenditures 2004 IPED
S Finance R
eport C
urrent funds revenues from tuition and fees as a
percent of FY 2004 total education and general
expenditures and transfers
FY 2004
21 R
atio of FTES to full-time faculty
U.S. N
ews &
World
Report, A
merica’s B
est C
olleges, 2004 edition
Fall 2003 FTE students (undergraduate credit hour activity divided by 15) divided by the num
ber of fall 2003 full-tim
e faculty
Fall 2003
22 A
cademic library holdings
Am
erican Library D
irectory, 58th edition,
2005 - 2006
Num
ber of titles, serial subscriptions, and audiovisual m
aterials Fall 2003
23 A
cademic library titles per FTES
Am
erican Library D
irectory, 58th edition,
2005 – 2006, 2003 IPED
S Fall Enrollment
report
Academ
ic library titles per FTES FY
2004