Embed Size (px)
Citation preview
Contact: Email: [email protected] Press office: 020 7783 8300 Public enquiries: 0370 000 2288
Further Education and Skills in England
March 2017
SFR13/2017, 23 March 2017 (revised 15 June 2017)
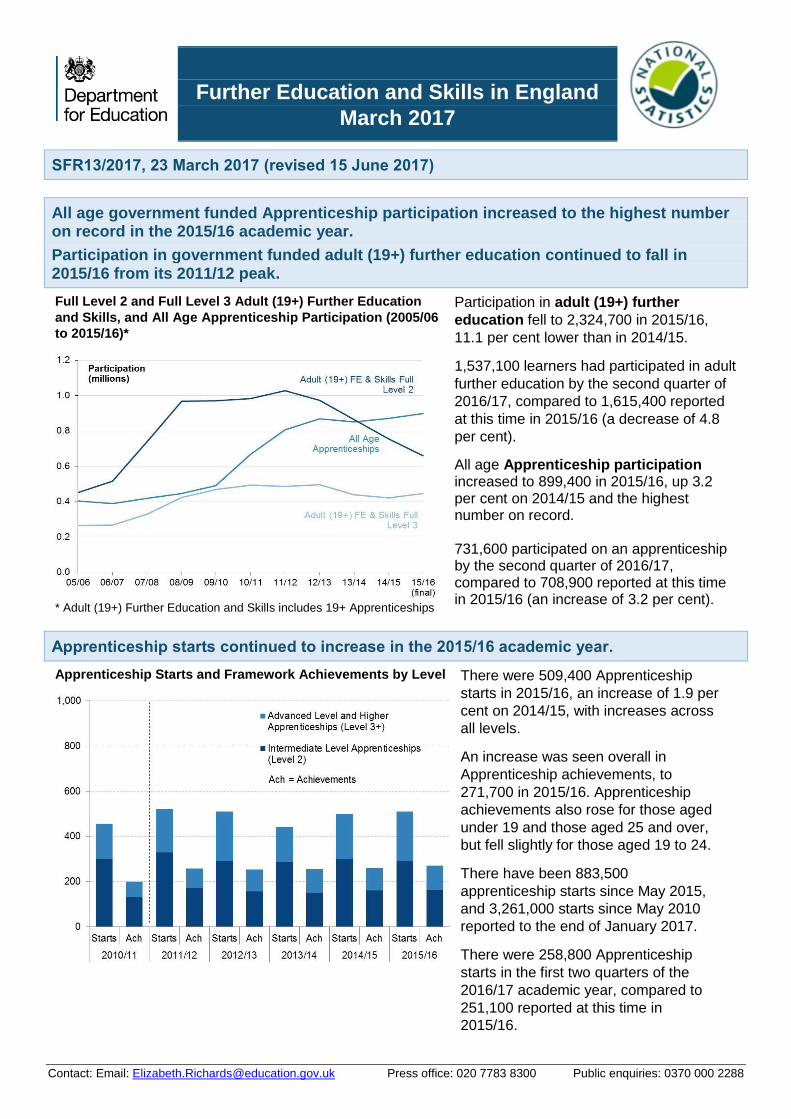
All age government funded Apprenticeship participation increased to the highest number on record in the 2015/16 academic year.
Participation in government funded adult (19+) further education continued to fall in 2015/16 from its 2011/12 peak.
Full Level 2 and Full Level 3 Adult (19+) Further Education
and Skills, and All Age Apprenticeship Participation (2005/06
to 2015/16)*
* Adult (19+) Further Education and Skills includes 19+ Apprenticeships
Participation in adult (19+) further
education fell to 2,324,700 in 2015/16,
11.1 per cent lower than in 2014/15.
1,537,100 learners had participated in adult
further education by the second quarter of
2016/17, compared to 1,615,400 reported
at this time in 2015/16 (a decrease of 4.8
per cent).
All age Apprenticeship participation increased to 899,400 in 2015/16, up 3.2 per cent on 2014/15 and the highest number on record. 731,600 participated on an apprenticeship by the second quarter of 2016/17, compared to 708,900 reported at this time in 2015/16 (an increase of 3.2 per cent).
Apprenticeship starts continued to increase in the 2015/16 academic year.
Apprenticeship Starts and Framework Achievements by Level
There were 509,400 Apprenticeship
starts in 2015/16, an increase of 1.9 per
cent on 2014/15, with increases across
all levels.
An increase was seen overall in
Apprenticeship achievements, to
271,700 in 2015/16. Apprenticeship
achievements also rose for those aged
under 19 and those aged 25 and over,
but fell slightly for those aged 19 to 24.
There have been 883,500
apprenticeship starts since May 2015,
and 3,261,000 starts since May 2010
reported to the end of January 2017.
There were 258,800 Apprenticeship
starts in the first two quarters of the
2016/17 academic year, compared to
251,100 reported at this time in
2015/16.
Contact: Email: [email protected] Press office: 020 7783 8300 Public enquiries: 0370 000 2288
Contents
Further Education Statistics for England, 2015/16 ......................................... 5
Summary and Key Headlines – 2015/16 Final Data .................................................................. 5
Adult Learner (19+) Participation and Achievement (Tables 1.1, 1.2 & 3) ................................. 6
Apprenticeships (Tables 2, 6 & 7) .............................................................................................. 9
Adult (19+) English and Maths (Table 4) ................................................................................. 12
Community Learning (Table 9) ................................................................................................ 13
Adult (18+) Offender Learning (Table 10.1 & 10.2) .................................................................. 14
24+ Advanced Learning Loans (Table 11) ............................................................................... 14
Traineeships (Tables 12.1, 12.2 & 12.3) .................................................................................. 14
Further Education Supplementary Tables ............................................................................... 14
Qualification Achievement Rates (QARs) (Tables 14.1 & 14.2) ............................................... 15
Adult Attainment in the Population (Table 15.1) ...................................................................... 19
In-Year Further Education Statistics for England, 2016/17 ........................... 20
New Full Level 2 and Full Level 3 methodology in 2016/17 ..................................................... 20
Adult Learner (19+) Participation (Table 18) ............................................................................ 21
Apprenticeships (Tables 21, 22.1, 22.2 & 23) .......................................................................... 21
Adult (19+) English and Maths (Table 19) ............................................................................... 22
Adult (19+) Education and Training (Table 20) ........................................................................ 23
Community Learning (Table 24) .............................................................................................. 23
Adult (18+) Offender Learners (Table 25) ................................................................................ 23
Advanced Learner Loans (Table 26) ....................................................................................... 24
Traineeships (Table 27.1, 27.2 & 27.3).................................................................................... 24
Accompanying tables ................................................................................... 25
Further information is available .................................................................... 26
National Statistics ........................................................................................ 26
Technical information ................................................................................... 27
Get in touch ................................................................................................. 27
Media enquiries ....................................................................................................................... 27
Other enquiries/feedback ......................................................................................................... 27
Contact: Email: [email protected] Press office: 020 7783 8300 Public enquiries: 0370 000 2288
About this release
This Statistical First Release (SFR) presents information on:
Adult (aged 19+) government-funded Further Education (excluding schools and Higher Education) comprising:
Education and training, including Offender Learning (18+)
Apprenticeships
English and Maths
Community Learning
Employer Ownership Pilots
24+ Advanced Learner Loans
Traineeships (16-24)
All age (16+) Apprenticeships in England.
The highest level of qualification held by adults (aged 19 to 64) in England calculated from Labour Force Survey
(LFS) data.
The SFR is presented in two main sections:
1. Final year data for 2015/16 (full-year)
2. In-year data for 2016/17 (first two quarters, as reported to date)
Final data are presented for Further Education and Apprenticeships between 2010/11 and 2015/16.
Highest levels of qualification data are presented from 2006 to 2015, although 2015 figures are provisional and subject to revisions.
The Employer Ownership Pilot (EOP) 2014/15 collection was affected by the move to an improved collection system between provisional and final return dates. While this move has put future collections on a better footing, issues resulting from the transfer remain. Rather than extend the considerable work with providers to reconcile remaining differences between returns we have decided to use the provisional data. The provisional data are almost complete and have passed full quality assurance.
The overall impact on the main FE tables will be negligible because EOP is very small in relation to the Individualised Learner Record collection, the main data source for this SFR. In 2014/15, just 1,500 apprenticeship starts of the 499,900 in total were EOP. The following tables include provisional 2014/15 EOP figures.
Tables 1.1, 1.2: Adult (19+) FE and Skills Participation/Achievement by Level
Table 2: All Age Apprenticeship Participation by Level and Age
Tables 4: Adult (19+) FE and Skills – English and Maths Participation and Achievement by Level
Table 5: Adult (19+) Demographic Summary of FE and Skills Participation
Table 6: All Age Demographic Summary of Apprenticeship Participation
Tables 7.1, 7.2: All Age Apprenticeship Programme Starts/Achievements by Level and Age
Tables 8.1, 8.2: Workplace Learning Starts/ Achievements by Level
Table 12.1 – 12.3: Traineeship Starts, Completions and Progressions by Age
Table 13: Employer Ownership Pilot Starts (2012/13 to 2015/16)
Note: there are no EOP starts in 2016/17.
Changes included in this SFR
This SFR includes figures for the first two quarters of 2016/17 based on information that has been reported to the Skills Funding Agency by further education colleges and providers in February 2017. The data will change as further data returns relating to the period are received later in the year.
In addition, from 2016/17 some people who would have previously been included in Full Level 2 and Full Level 3 figures in this SFR are no longer included following changes to funding rules on vocational qualifications, see section 2 of this SFR.
Further breakdowns of the data for the second quarter of 2016/17 are also presented in section 2.
Contact: Email: [email protected] Press office: 020 7783 8300 Public enquiries: 0370 000 2288
The highest level of qualification held by adults (aged 19 to 64) in England, calculated from Labour Force Survey (LFS) data, is also updated in this SFR in Table 15, along with Vocational Qualification Achievements in the UK by Qualification Type shown in Table 17.
Changes to the January SFR – 16 February 2017 update
Qualification Achievement Rates (QARs) data for 2015/16 were included in tables 14.1 and 14.2 on 16 February 2017. Pages 16 to 18 have been updated in this SFR, along with information in the accompanying medthodology document to describes changes made and the impact on the figures.
The 2015/16 data was due to be included in the January 2017 publication but was delayed as a result of additional quality assurance measures after a methodology change to ensure the most robust figures are provided and to undertake associated discontinuity analysis for the user.
Changes to the January SFR – 14 March 2017 update
Ofqual vocational qualification data shown in Table 17 of this release, and accompanying supplementary tables, were updated on 14 March 2017 as part of a formal cascade of this release. These tables were updated to include data for the first quarter of 2016/17 (October 2017 to December 2017) which will allow Ofqual to update their detailed bulletins that include these data.
Changes to the March SFR – 15 June 2017 update
Qualification Achievement Rates (QARs) data shown in Tables 14.1 and 14.2 of this release, and accompanying supplementary tables, were updated on 15 June 2017, to coincide with the publication of the National Achievement Rates Tables (https://www.gov.uk/government/collections/sfa-national-success-rates-tables). The QAR section from page 15 of this SFR has been updated.
Changes in the next SFR
The next SFR will be in July 2017 and will include provisional data for the first three quarters of the 2016/17 academic year (August 2016 to April 2017).
In this publication
The following tables are included in the SFR:
National tables (Excel .xls):
https://www.gov.uk/government/collections/further-education-and-skills-statistical-first-release-sfr
Supplementary tables (Excel .xls):
https://www.gov.uk/government/collections/fe-data-library
The accompanying technical document provides information on the data sources, their coverage and quality and explains the methodology used in producing the data, and further information on methodology changes impacting on the Full Level 2 and Full Level 3 data.
Feedback
We are changing how our releases look and welcome feedback on any aspect of this document, please contact: [email protected].
5
Further Education Statistics for England, 2015/16
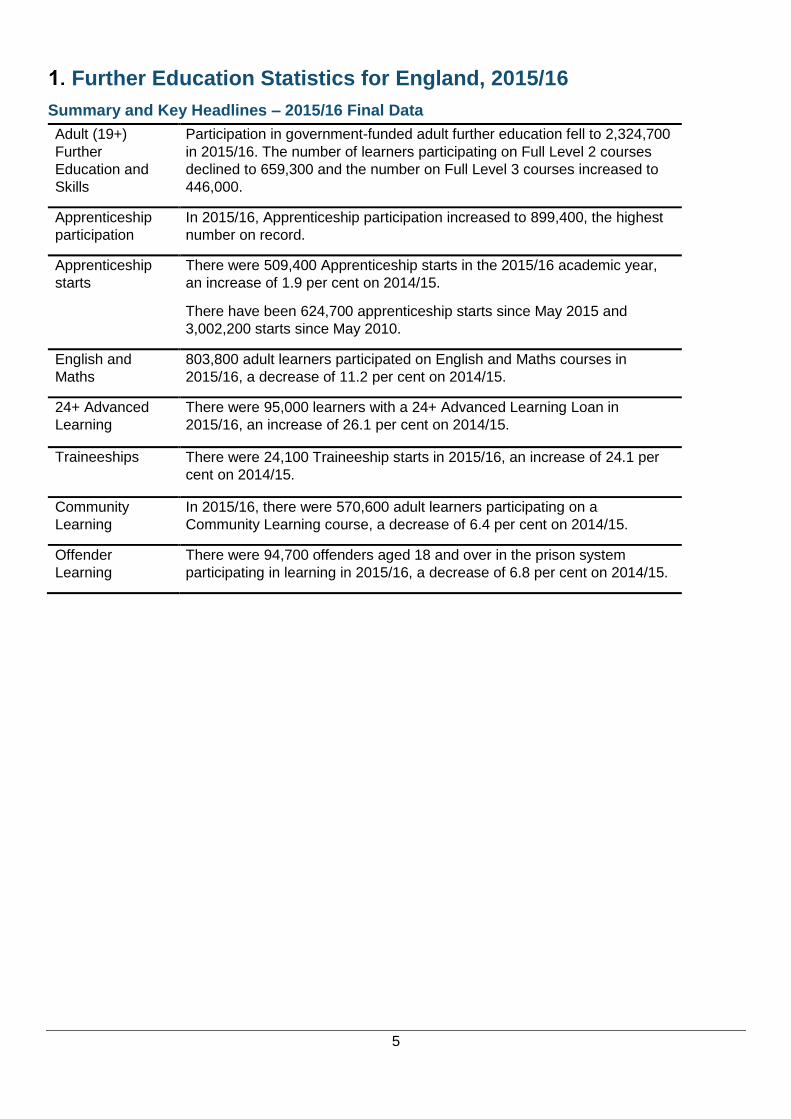
Summary and Key Headlines – 2015/16 Final Data
Adult (19+)
Further
Education and
Skills
Participation in government-funded adult further education fell to 2,324,700
in 2015/16. The number of learners participating on Full Level 2 courses
declined to 659,300 and the number on Full Level 3 courses increased to
446,000.
Apprenticeship
participation
In 2015/16, Apprenticeship participation increased to 899,400, the highest
number on record.
Apprenticeship
starts
There were 509,400 Apprenticeship starts in the 2015/16 academic year,
an increase of 1.9 per cent on 2014/15.
There have been 624,700 apprenticeship starts since May 2015 and
3,002,200 starts since May 2010.
English and
Maths
803,800 adult learners participated on English and Maths courses in
2015/16, a decrease of 11.2 per cent on 2014/15.
24+ Advanced
Learning
There were 95,000 learners with a 24+ Advanced Learning Loan in
2015/16, an increase of 26.1 per cent on 2014/15.
Traineeships There were 24,100 Traineeship starts in 2015/16, an increase of 24.1 per
cent on 2014/15.
Community
Learning
In 2015/16, there were 570,600 adult learners participating on a
Community Learning course, a decrease of 6.4 per cent on 2014/15.
Offender
Learning
There were 94,700 offenders aged 18 and over in the prison system
participating in learning in 2015/16, a decrease of 6.8 per cent on 2014/15.
6
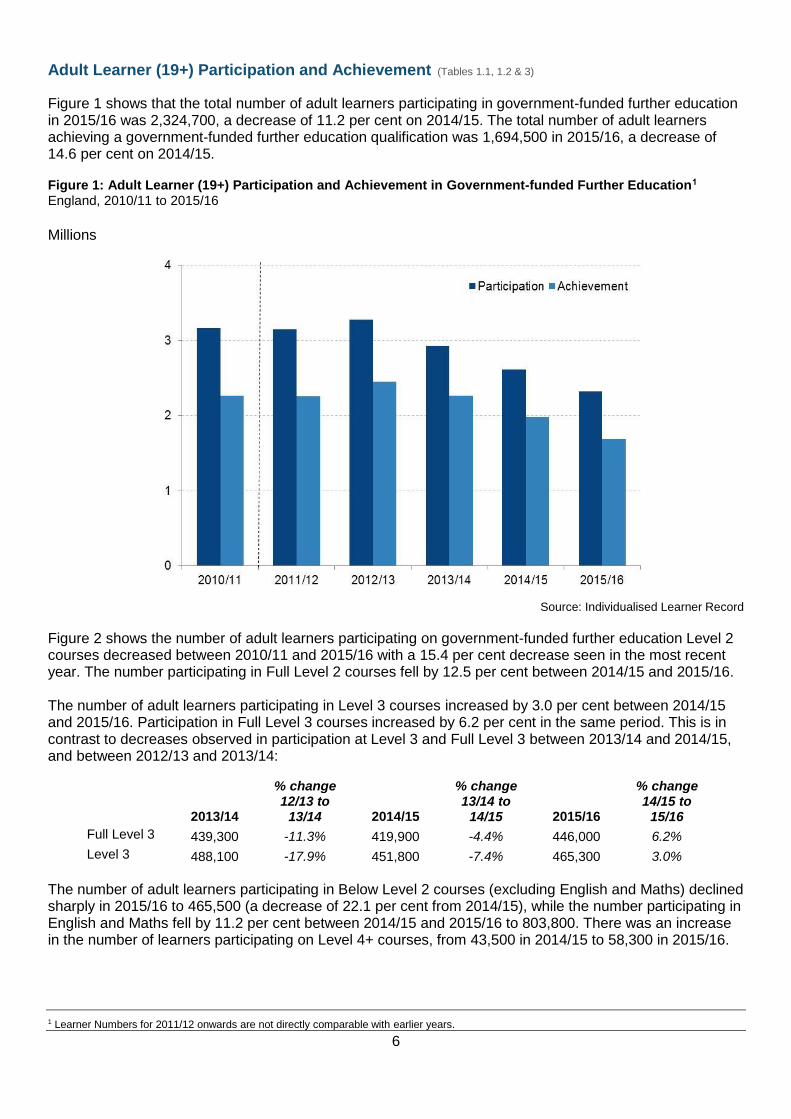
Adult Learner (19+) Participation and Achievement (Tables 1.1, 1.2 & 3)
Figure 1 shows that the total number of adult learners participating in government-funded further education in 2015/16 was 2,324,700, a decrease of 11.2 per cent on 2014/15. The total number of adult learners achieving a government-funded further education qualification was 1,694,500 in 2015/16, a decrease of 14.6 per cent on 2014/15. Figure 1: Adult Learner (19+) Participation and Achievement in Government-funded Further Education1 England, 2010/11 to 2015/16
Millions
Source: Individualised Learner Record
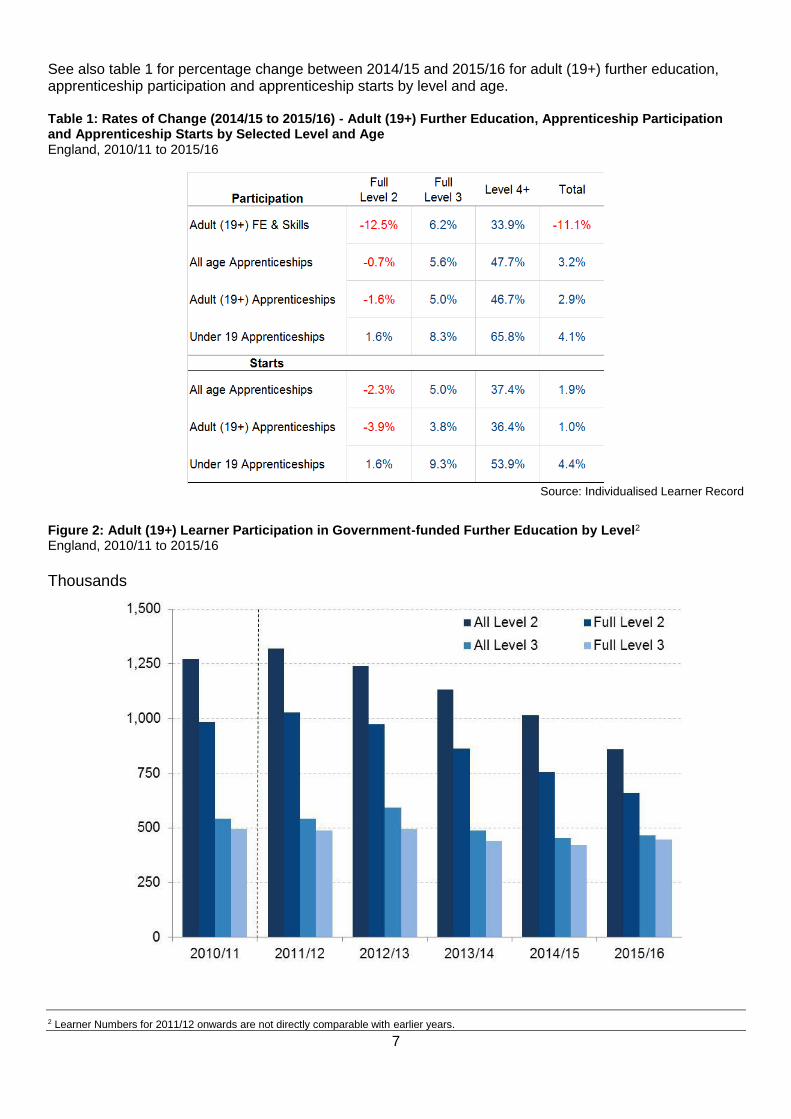
Figure 2 shows the number of adult learners participating on government-funded further education Level 2 courses decreased between 2010/11 and 2015/16 with a 15.4 per cent decrease seen in the most recent year. The number participating in Full Level 2 courses fell by 12.5 per cent between 2014/15 and 2015/16. The number of adult learners participating in Level 3 courses increased by 3.0 per cent between 2014/15 and 2015/16. Participation in Full Level 3 courses increased by 6.2 per cent in the same period. This is in contrast to decreases observed in participation at Level 3 and Full Level 3 between 2013/14 and 2014/15, and between 2012/13 and 2013/14:
2013/14
% change 12/13 to
13/14 2014/15
% change 13/14 to
14/15 2015/16
% change 14/15 to
15/16
Full Level 3 439,300 -11.3% 419,900 -4.4% 446,000 6.2%
Level 3 488,100 -17.9% 451,800 -7.4% 465,300 3.0%
The number of adult learners participating in Below Level 2 courses (excluding English and Maths) declined sharply in 2015/16 to 465,500 (a decrease of 22.1 per cent from 2014/15), while the number participating in English and Maths fell by 11.2 per cent between 2014/15 and 2015/16 to 803,800. There was an increase in the number of learners participating on Level 4+ courses, from 43,500 in 2014/15 to 58,300 in 2015/16.
1 Learner Numbers for 2011/12 onwards are not directly comparable with earlier years.
7
See also table 1 for percentage change between 2014/15 and 2015/16 for adult (19+) further education, apprenticeship participation and apprenticeship starts by level and age. Table 1: Rates of Change (2014/15 to 2015/16) - Adult (19+) Further Education, Apprenticeship Participation and Apprenticeship Starts by Selected Level and Age England, 2010/11 to 2015/16
Source: Individualised Learner Record
Figure 2: Adult (19+) Learner Participation in Government-funded Further Education by Level2 England, 2010/11 to 2015/16
Thousands
2 Learner Numbers for 2011/12 onwards are not directly comparable with earlier years.
8
Source: Individualised Learner Record
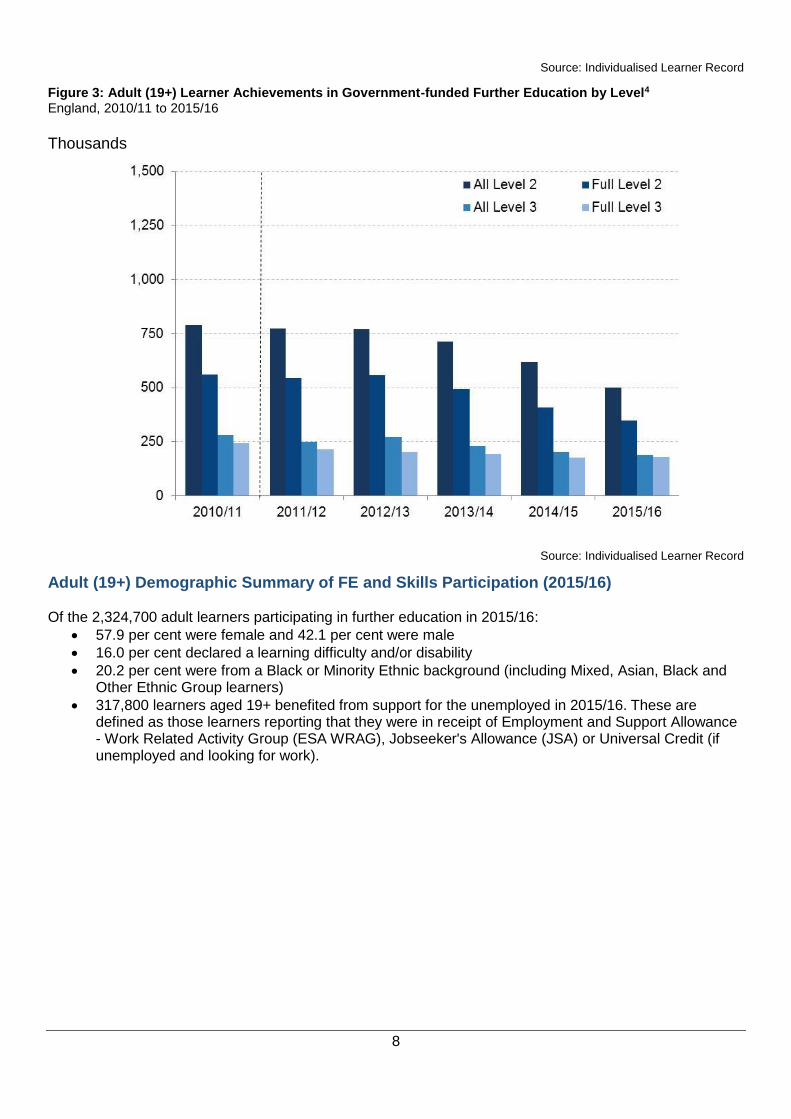
Figure 3: Adult (19+) Learner Achievements in Government-funded Further Education by Level4 England, 2010/11 to 2015/16
Thousands
Source: Individualised Learner Record
Adult (19+) Demographic Summary of FE and Skills Participation (2015/16)
Of the 2,324,700 adult learners participating in further education in 2015/16:
57.9 per cent were female and 42.1 per cent were male
16.0 per cent declared a learning difficulty and/or disability
20.2 per cent were from a Black or Minority Ethnic background (including Mixed, Asian, Black and Other Ethnic Group learners)
317,800 learners aged 19+ benefited from support for the unemployed in 2015/16. These are defined as those learners reporting that they were in receipt of Employment and Support Allowance - Work Related Activity Group (ESA WRAG), Jobseeker's Allowance (JSA) or Universal Credit (if unemployed and looking for work).
9
Apprenticeships (Tables 2, 6 & 7)
Measures of Apprenticeships
Two measures of Apprenticeships are presented to give a clearer view of the changes and trends in Apprenticeships in England:
Participation refers to the number of people who are undertaking an Apprenticeship in a given time period. This measure is helpful for quantifying the number of people on an Apprenticeship programme throughout the academic year. An Apprentice studying towards more than one Apprenticeship at the same level is counted once.
Starts refer to the number of programmes that begin in a given time period. This measure is helpful in determining the take-up of programmes. An Apprentice is counted for each Apprenticeship they start.
The Apprenticeship programme has expanded since 2010/11 as a result of increased government investment in adult Apprenticeships. More recently Apprenticeship policy has focused on raising standards, improving the quality and introducing minimum durations of Apprenticeships. This means some learners find it more difficult or take longer to complete their Apprenticeship.
24+ Advanced Learner Loans were introduced in August 2013, and withdrawn for Apprenticeships in March 2014. This appears to have affected learner numbers on Level 3 and above courses and Apprenticeships for ages 24 and over in 2013/14. This should be noted when comparing the 2014/15 volumes with 2013/14.
Participation
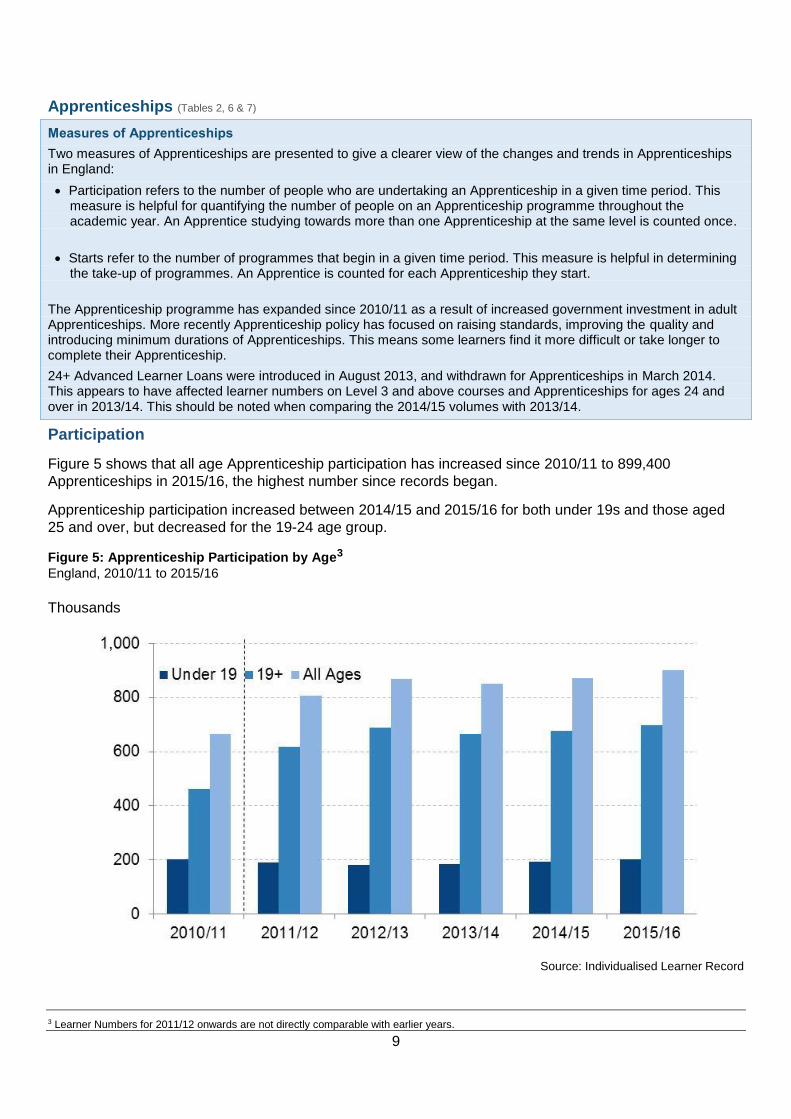
Figure 5 shows that all age Apprenticeship participation has increased since 2010/11 to 899,400
Apprenticeships in 2015/16, the highest number since records began.
Apprenticeship participation increased between 2014/15 and 2015/16 for both under 19s and those aged
25 and over, but decreased for the 19-24 age group.
Figure 5: Apprenticeship Participation by Age3
England, 2010/11 to 2015/16
Thousands
Source: Individualised Learner Record
3 Learner Numbers for 2011/12 onwards are not directly comparable with earlier years.
10
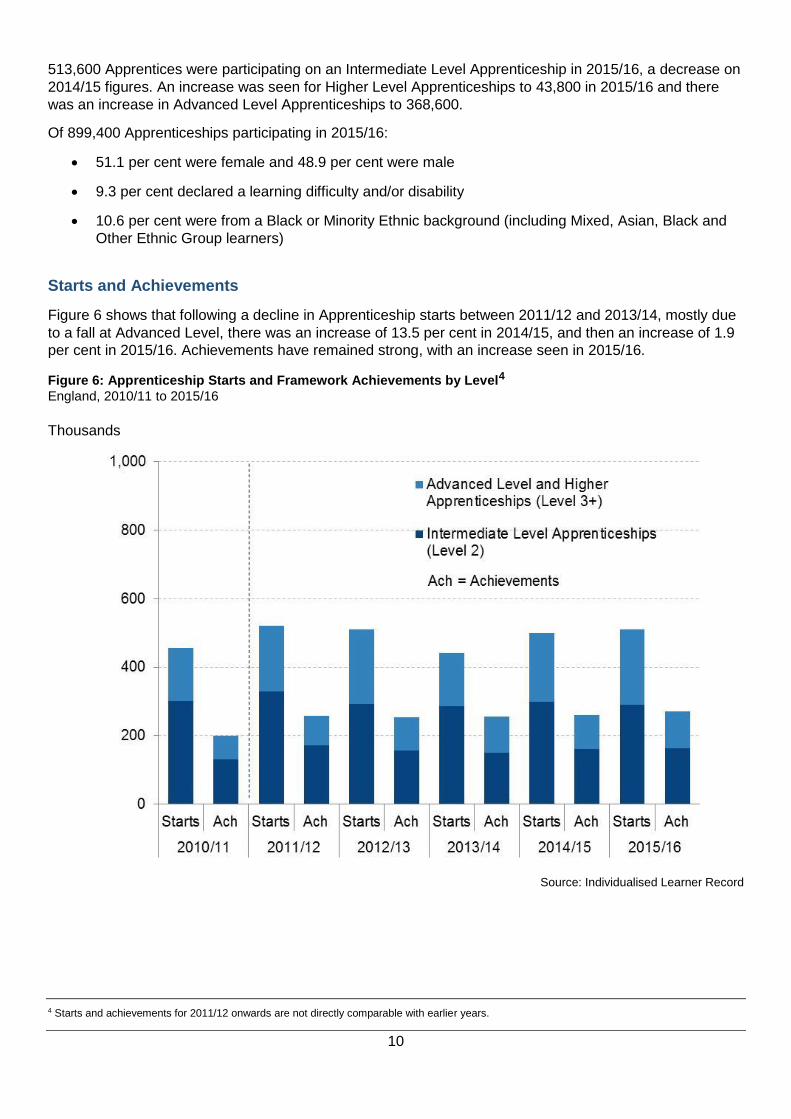
513,600 Apprentices were participating on an Intermediate Level Apprenticeship in 2015/16, a decrease on
2014/15 figures. An increase was seen for Higher Level Apprenticeships to 43,800 in 2015/16 and there
was an increase in Advanced Level Apprenticeships to 368,600.
Of 899,400 Apprenticeships participating in 2015/16:
51.1 per cent were female and 48.9 per cent were male
9.3 per cent declared a learning difficulty and/or disability
10.6 per cent were from a Black or Minority Ethnic background (including Mixed, Asian, Black and
Other Ethnic Group learners)
Starts and Achievements
Figure 6 shows that following a decline in Apprenticeship starts between 2011/12 and 2013/14, mostly due
to a fall at Advanced Level, there was an increase of 13.5 per cent in 2014/15, and then an increase of 1.9
per cent in 2015/16. Achievements have remained strong, with an increase seen in 2015/16.
Figure 6: Apprenticeship Starts and Framework Achievements by Level4
England, 2010/11 to 2015/16
Thousands
Source: Individualised Learner Record
4 Starts and achievements for 2011/12 onwards are not directly comparable with earlier years.
11
The length of an Apprenticeship is typically more than a year and Apprenticeship framework achievement is
recorded against the year it was achieved, not the year it was started.
There were 509,400 Apprenticeship starts in the 2015/16 academic year, an increase of 1.9 per cent on
2014/15, with increases across all levels. An increase was seen overall in Apprenticeship achievements, to
271,700 in 2015/16. Apprenticeship achievements rose for those aged under 19 and those aged 25 and
over, but fell slightly for those aged 19 to 24.
In 2015/16, there were 4,300 starts on Apprenticeship Standards (previously referred to as Trailblazers -
see the glossary for more information) – up from 400 in 2014/15.
The first starts on the new Apprenticeship Standards were in September 2014. The volume of starts on
Apprenticeship standards by Level can be found in a supplementary table.
Final data show that there were 212,900 apprenticeship starts for which a payment was made through the
Apprenticeship Grant for Employers (AGE 16 to 24) scheme between February 2012 and July 2016. A
further 7,200 were in the pipeline (started but not yet paid).
Starts since May 2010 and May 2015
The government has committed to reaching 3 million apprenticeships by 20205, from May 2015. With
115,300 apprenticeship starts in quarter 4 in 2014/15, there have been 780,300 starts reported to July 2016
since May 2015 (i.e. starts in the current parliament), and 3,157,800 starts reported to July 2016 since May
2010 (including 64,500 starts in quarter 4 2009/10).
Planned Length of Stay
Minimum durations have been in place for framework-based Apprenticeships since August 2012. For learners aged 16 to 18, Apprenticeships must last at least 12 months, but for learners aged 19 and over there is more flexibility, as some adults have prior learning / attainment and can complete more quickly (for example if the training provider can evidence prior learning the minimum duration is reduced to 6 months). For new Apprenticeship Standards the minimum duration is 12 months, with no exceptions.
Based on the planned end date, the number of Apprenticeship starts with a planned length of stay of less
than 12 months decreased sharply by 83.2 per cent between 2011/12 and 2012/13 to 34,300 and remained
low in 2015/16 at 40,300.
Apprenticeship starts by age and planned length of stay can be found in supplementary tables:
https://www.gov.uk/government/statistical-data-sets/fe-data-library-apprenticeships
5 https://www.gov.uk/government/news/government-kick-starts-plans-to-reach-3-million-apprenticeships
12
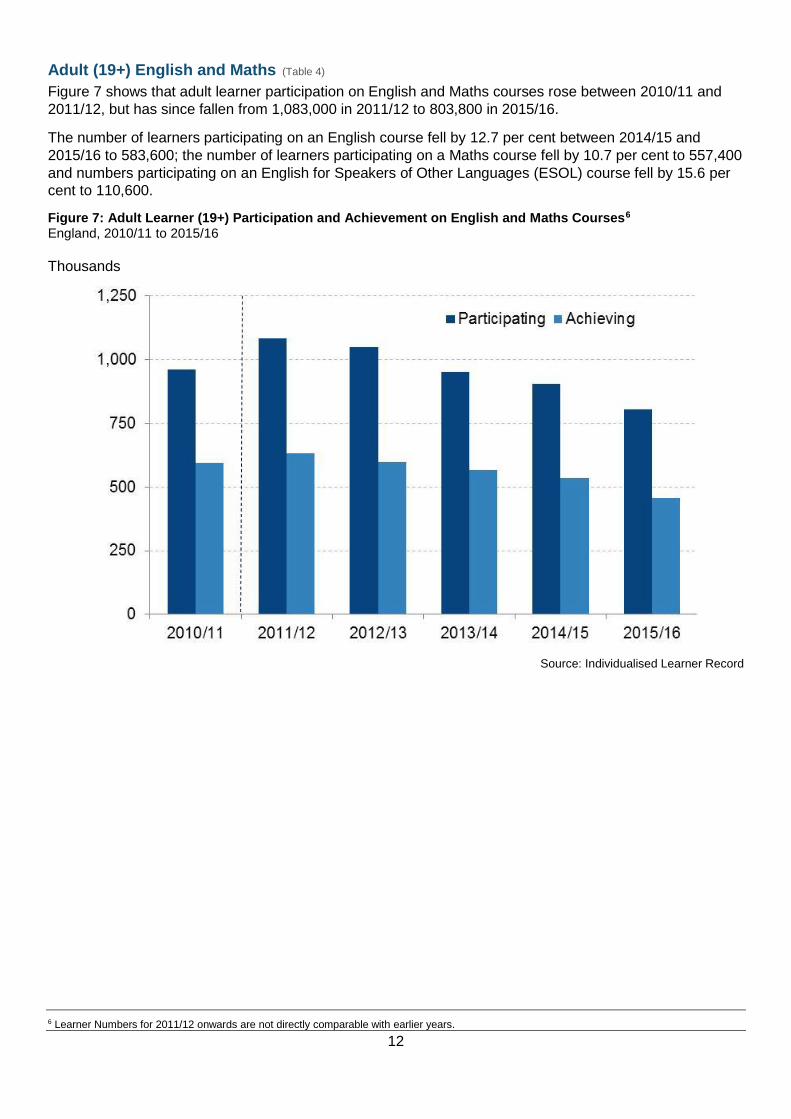
Adult (19+) English and Maths (Table 4) Figure 7 shows that adult learner participation on English and Maths courses rose between 2010/11 and
2011/12, but has since fallen from 1,083,000 in 2011/12 to 803,800 in 2015/16.
The number of learners participating on an English course fell by 12.7 per cent between 2014/15 and
2015/16 to 583,600; the number of learners participating on a Maths course fell by 10.7 per cent to 557,400
and numbers participating on an English for Speakers of Other Languages (ESOL) course fell by 15.6 per
cent to 110,600.
Figure 7: Adult Learner (19+) Participation and Achievement on English and Maths Courses6 England, 2010/11 to 2015/16
Thousands
Source: Individualised Learner Record
6 Learner Numbers for 2011/12 onwards are not directly comparable with earlier years.
13
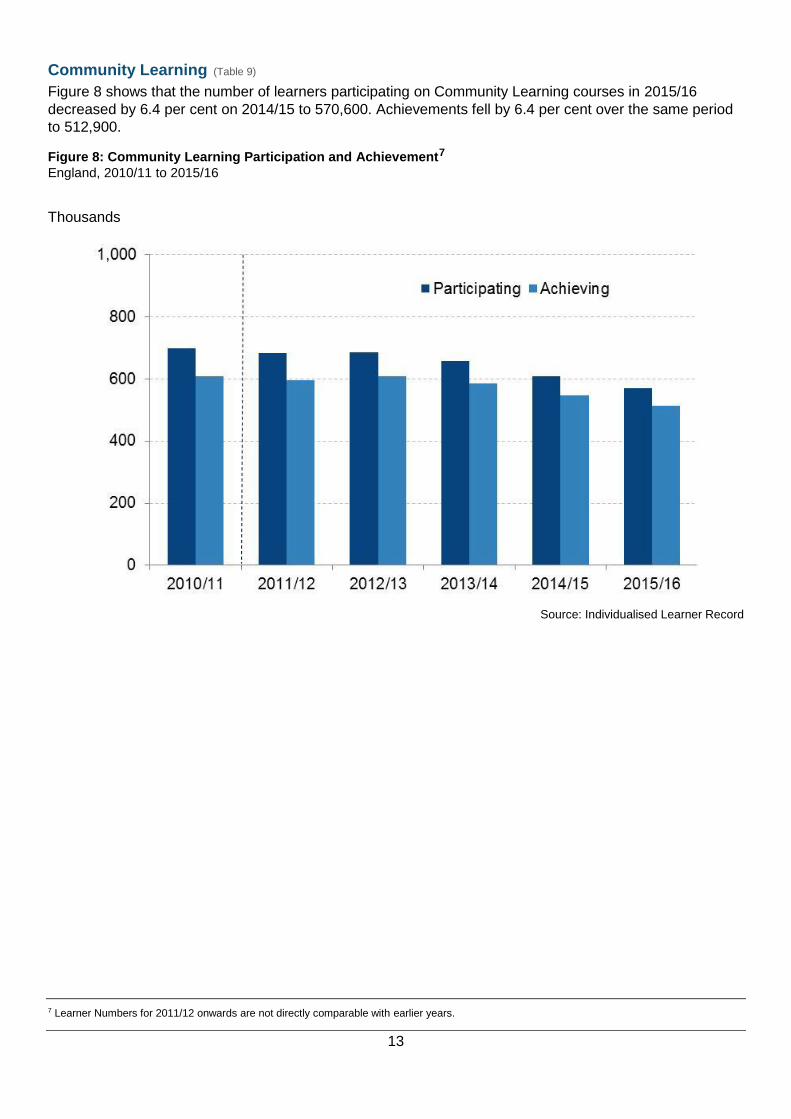
Community Learning (Table 9)
Figure 8 shows that the number of learners participating on Community Learning courses in 2015/16
decreased by 6.4 per cent on 2014/15 to 570,600. Achievements fell by 6.4 per cent over the same period
to 512,900.
Figure 8: Community Learning Participation and Achievement7
England, 2010/11 to 2015/16
Thousands
Source: Individualised Learner Record
7 Learner Numbers for 2011/12 onwards are not directly comparable with earlier years.
14
Adult (18+) Offender Learning (Table 10.1 & 10.2)
In 2015/16 there were 94,700 offenders aged 18 and over in the prison system participating in learning, a
decrease of 6.8 per cent on 2014/15. 82,700 achieved a learning outcome, an decrease of 2.6 per cent on
2014/15. These offenders were funded via the Offenders’ Learning and Skills Service (OLASS) budget.
24+ Advanced Learning Loans (Table 11)
The number of learners with an Advanced Learning Loan reported through the Individualised Learner Record (ILR) differ from data showing loan applications (https://www.gov.uk/government/collections/further-education) and loans paid (http://www.slc.co.uk/official-statistics/financial-support-awarded/england-further-education.aspx).
24+ Advanced Learning Loans Application Information is released monthly. This data relates to applications received for FE provision in the 2013/14, 2014/15 and 2015/16 academic years funded through 24+ Advanced Learning Loans. The data used to produce the publication are sourced from the Student Loans Company (SLC) application database. The data refer to received applications, including those not yet processed, and will therefore be different than actual number of learners participating on a course with a 24+ Advanced Learning Loan.
The SLC Advanced Learner Loans Paid in England data were released on 23 June 2016. These data refer to all payments made to FE providers on behalf of learners, and numbers of learners will be lower than the ILR numbers. Only payments made between August 2013 and April 2016 are captured, whilst the ILR captures learners on a course with an Advanced Learning Loan that started during this period, including some where the first scheduled payment date is beyond the end of April 2016.
Final data for the 2015/16 academic year show there were 95,000 learners with a 24+ Advanced Learning
Loan, an increase of 26.1 per cent on 2014/15. Of these there were:
89,000 learners with a 24+ Advanced Learning Loan participating at Level 3
6,300 learners with a 24+ Advanced Learning Loan participating at Level 4+
Traineeships (Tables 12.1, 12.2 & 12.3)
In the 2015/16 academic year show there were 24,100 Traineeship starts, an increase of 24.1 per cent on
the previous year. Of these there were:
14,700 Traineeship starts aged under 19
9,400 Traineeship starts aged 19 to 24
There were 17,400 traineeship completions in 2015/16, of which 10,500 were aged under 19 and 6,900
were aged 19 to 24.
There were 10,500 traineeship progressions in 2015/16. Of these, 7,000 were progressions to a job,
apprenticeship, further full time education or other training for those aged under 19, and 3,400 were
progressions to a job or apprenticeship for those aged 19-24.
Further Education Supplementary Tables
Additional breakdowns of further education statistics are published online, please see here: https://www.gov.uk/government/collections/fe-data-library. These additional breakdowns include breakdowns by age, gender, ethnicity, learners with learning difficulties and/or disabilities, region, local authority, parliamentary constituency, sector subject area and funding stream.
15
Qualification Achievement Rates (QARs) (Tables 14.1 & 14.2)
Qualification Achievement Rates (QARs), previously referred to as success rates, are calculated for individual qualifications. They show how many learners that started a qualification went on to successfully complete it. Achievement rates are typically calculated at a qualification level, but can be aggregated across different types of course, or for particular colleges or providers.
Prior to 2013/14 QARs were calculated using different methodologies for each of the different strands of further education provision. Employer-based provision (apprenticeships and workplace learning (WPL)) used a primary Overall achievement rate measure (based on the later of the actual and planned end dates) and a secondary Timely measure (based on the planned end date). However, Education and Training (E & T) provision had a different measure that was based upon the learning planned end date.
In the 2013/14 academic year the methodologies were aligned to give a consistent method of calculation across all provision areas, following changes to government-funded learning provision. E & T provision has adopted the Overall and Timely measures as used in apprenticeships and WPL. The Overall measure will be the principal measure and the one reported in this SFR, and will be used to assess the quality of provision against the minimum standards that are expected for funded training. The Timely measure will also be produced as a supporting measure.
The change in E & T methodology causes a break in the time series for these statistics and means that the qualification achievement rates for 2013/14 onwards cannot be directly compared with those from the previous years. See https://www.gov.uk/government/publications/sfa-qualification-success-rates-rationale-for-2013-to-2014 for more details of the changes. In 2014/15 the E & T and WPL achievement rates were combined into a single measure for E & T.
In 2014/15 there was a problem with the Qualification Management Application (QMA) of an awarding organisation that meant further education providers may have been unable to record results or obtain certificates during the period April to July 2015. In the majority of cases certificates were issued in time, although there is a risk that some results were missing or recorded in error.
Apprenticeship providers responded to this issue in different ways depending on their delivery models and the individual needs of learners and it may have resulted in a higher or lower QAR for different frameworks. For this reason there is the potential for some variation in the achievement rates between providers for specific frameworks but the data indicate that the impact on the overall rates presented here will be negligible.
There is no evidence of an impact on overall education and training achievement rates. The affected cohort for the duration of the QMA issues represents less than 4% of the total aims in scope for the 2014/15 E&T achievement rate calculations, and only a small fraction of these will have experienced problems.
New QARs methodology in 2015/16
The 2015/15 QARs have been calculated using a new methodology.
Rationale
Provider level and national QAR aim to show a fair and transparent view of the achievement rates of FE providers. Therefore to mitigate the substantial negative impact on some providers and on the national rate, the Skills Funding Agency has removed all late reported data for years prior to 2014/15 from the data used to calculate the 2015/16 QAR. This includes mainly data recording historical withdrawals but also a small number of late reported achievements. This has been done across the board for all providers for consistency and transparency. It improves the rates for the providers most affected, as we would expect, and results in a small increase for other providers as well as in the national rate.
Removing the extra years has also had a very slight negative impact for 6 providers – the biggest impact being a 0.45% decline. This is because the data we removed had some late reported achievers.
This is a one off mitigation that we will not need to implement in future years. See ‘impact assessment’ for further analysis.
16
The new methodology
The Skills Funding Agency reviewed the QAR and Minimum standards methodology and thresholds following their publication for 2013/14. This analysis identified that approximately 10 per cent of apprenticeship providers were receiving an artificially high QAR rate for apprenticeships because of how they were using three loopholes in the methodology. With just a few of those gaining a significant advantage of more than 20 per cent in their overall QAR whereas other providers were able to avoid falling below the minimum standard threshold which was 55 per cent at the time.
The three loop holes that were identified and closed, using published rule changes, are:
1. Inappropriate use of the planned break exclusion rule. QAR rules exclude frameworks reported using the planned break completion status. Providers were trusted to use the planned break withdrawal reason correctly and that those frameworks would only be reported in QAR when they returned. However, if a provider never reported a learner as returning and did not update the completion status to inform the Skills Funding Agency they had withdrawn – then those frameworks were never counted in their QAR. Some providers reported nearly all withdrawals as planned breaks and therefore received a significantly higher QAR.
2. Frameworks with a Continuing status in R14 (the final data return in an academic year) were not returned as continuing on that framework in the next academic year. No further funding was claimed but those learners appeared to be continuing forever and were never reported in QAR.
3. Non-reporting of actual end dates for leavers in a previous academic year. Late reported leavers from previous academic years were counted but only in the historical comparison values – they were never used to calculate the latest published QAR for a provider. The definition of the hybrid end year was changed to include the reporting year if this was later than the planned or actual end date.
This led to some providers having a negative impact on their 2015/16 QAR after they updated their ILR records, in response to the rule changes, and reported withdrawals for several previous years in their 2015/16 data. The cumulative negative impact of reporting withdrawals in one year which has taken place over a period of time, was significant for some providers. This is because they did not realise there would be such an impact under this rule change if they tried to update records prior to 2014/15 to deal with the first two new rules.
The Skills Funding Agency informed the sector in the 2014/15 QAR business rules that a set of new rules would be applied from 2015/16 onwards. For more information, please see https://www.gov.uk/government/publications/sfa-qualification-achievement-rate-2015-to-2016-formerly-qsr.
15 June QAR update
The 2015/16 QAR figures in Tables 14.1 and 14.2 originally published in 16 February 2017 SFR have been refreshed in this revision to the March 2017 SFR.
This coincides with the publication of the National Achievement Rates Tables (NARTs) 2015 to 2016 on 15 June 2017 (https://www.gov.uk/government/collections/sfa-national-success-rates-tables), and aligns with a corrected methodology used to calculate provider achievement rates.
Impact analysis of new methodology
To further assess the impact of the new 2015/16 QAR methodology, QARs have been calculated for the
academic years 2013/14, 2014/15, and 2015/16 using the new approach, and compared to the QARs
reported in the previous two years based on the previous methodology. Table 2 shows this comparison.
In table 2, the greatest impact of the new methodology can be seen for apprenticeships. There was a
decrease of 4.2 percentage points between 2014/15 and 2015/16 after implementing the new 2015/16
methodology. If we compare Apprenticeship QARs in 2014/15 using both methodologies, we can see that
when applying the new 2015/16 methodology on the 2014/15 data the QAR would have been 67.5 per
cent, whereas for the previous, published figure was 71.7 per cent, a difference of 4.2 percentage points.
The impact is less pronounced on Education and Training provision.
17
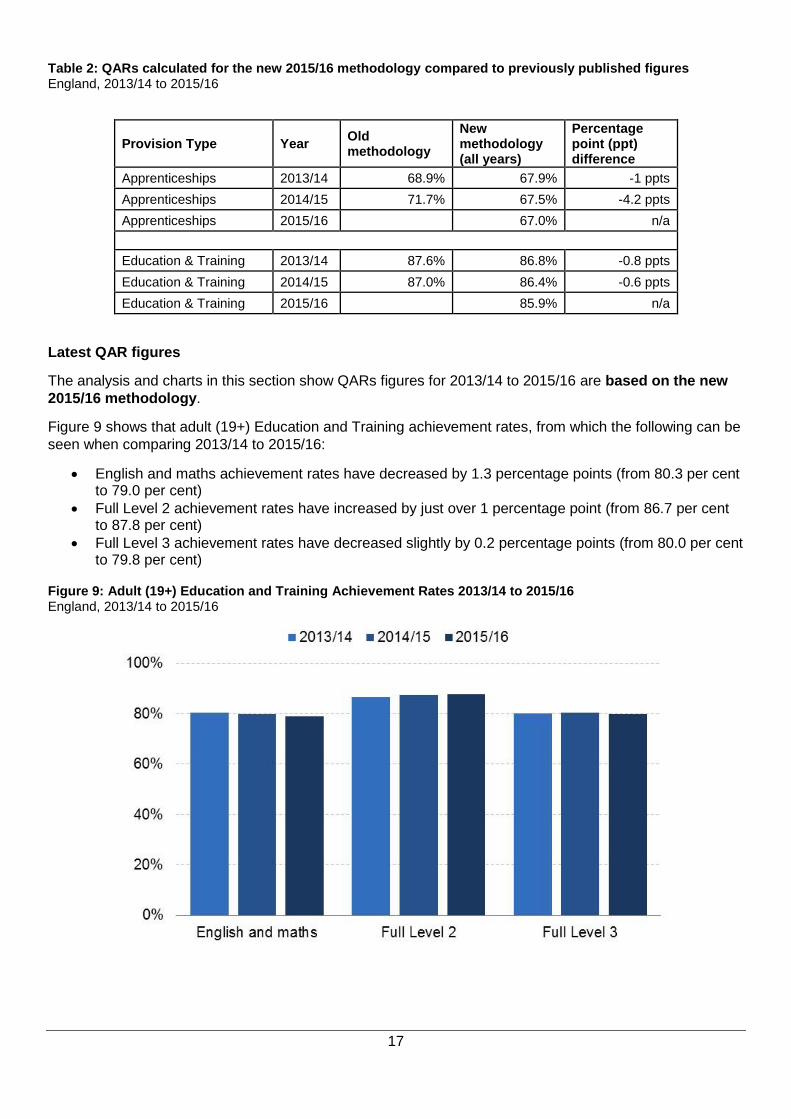
Table 2: QARs calculated for the new 2015/16 methodology compared to previously published figures England, 2013/14 to 2015/16
Provision Type Year Old methodology
New methodology (all years)
Percentage point (ppt) difference
Apprenticeships 2013/14 68.9% 67.9% -1 ppts
Apprenticeships 2014/15 71.7% 67.5% -4.2 ppts
Apprenticeships 2015/16 67.0% n/a
Education & Training 2013/14 87.6% 86.8% -0.8 ppts
Education & Training 2014/15 87.0% 86.4% -0.6 ppts
Education & Training 2015/16 85.9% n/a
Latest QAR figures
The analysis and charts in this section show QARs figures for 2013/14 to 2015/16 are based on the new
2015/16 methodology.
Figure 9 shows that adult (19+) Education and Training achievement rates, from which the following can be
seen when comparing 2013/14 to 2015/16:
English and maths achievement rates have decreased by 1.3 percentage points (from 80.3 per cent to 79.0 per cent)
Full Level 2 achievement rates have increased by just over 1 percentage point (from 86.7 per cent to 87.8 per cent)
Full Level 3 achievement rates have decreased slightly by 0.2 percentage points (from 80.0 per cent to 79.8 per cent)
Figure 9: Adult (19+) Education and Training Achievement Rates 2013/14 to 2015/16 England, 2013/14 to 2015/16
18
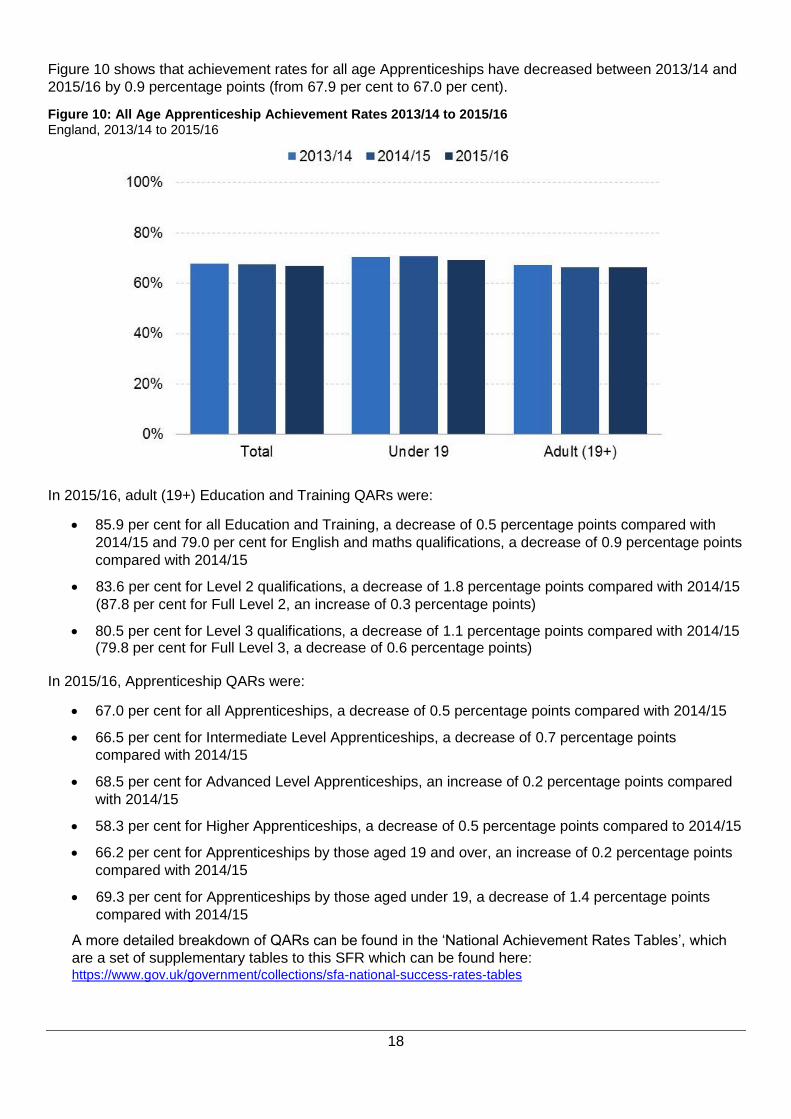
Figure 10 shows that achievement rates for all age Apprenticeships have decreased between 2013/14 and
2015/16 by 0.9 percentage points (from 67.9 per cent to 67.0 per cent).
Figure 10: All Age Apprenticeship Achievement Rates 2013/14 to 2015/16
England, 2013/14 to 2015/16
In 2015/16, adult (19+) Education and Training QARs were:
85.9 per cent for all Education and Training, a decrease of 0.5 percentage points compared with
2014/15 and 79.0 per cent for English and maths qualifications, a decrease of 0.9 percentage points
compared with 2014/15
83.6 per cent for Level 2 qualifications, a decrease of 1.8 percentage points compared with 2014/15
(87.8 per cent for Full Level 2, an increase of 0.3 percentage points)
80.5 per cent for Level 3 qualifications, a decrease of 1.1 percentage points compared with 2014/15 (79.8 per cent for Full Level 3, a decrease of 0.6 percentage points)
In 2015/16, Apprenticeship QARs were:
67.0 per cent for all Apprenticeships, a decrease of 0.5 percentage points compared with 2014/15
66.5 per cent for Intermediate Level Apprenticeships, a decrease of 0.7 percentage points
compared with 2014/15
68.5 per cent for Advanced Level Apprenticeships, an increase of 0.2 percentage points compared
with 2014/15
58.3 per cent for Higher Apprenticeships, a decrease of 0.5 percentage points compared to 2014/15
66.2 per cent for Apprenticeships by those aged 19 and over, an increase of 0.2 percentage points
compared with 2014/15
69.3 per cent for Apprenticeships by those aged under 19, a decrease of 1.4 percentage points
compared with 2014/15
A more detailed breakdown of QARs can be found in the ‘National Achievement Rates Tables’, which
are a set of supplementary tables to this SFR which can be found here: https://www.gov.uk/government/collections/sfa-national-success-rates-tables
19
Adult Attainment in the Population (Table 15.1)
Having a skilled population is vital to maintaining the international competitiveness of our economy and creating high quality jobs. Improving our skills does not just improve our economy; it also has the potential to make the UK a fairer place by creating more social mobility and enabling people to play their part in society.
Labour Force Survey data are used to measure the highest qualification levels of the working age population in England, where Level 2 equates to achievement of 5 or more GCSEs at grades A*-C or equivalent qualifications, Level 3 equates to achievement of 2 or more A-levels or equivalent qualifications, and Level 4 and above to higher education and degree level qualifications. See https://www.gov.uk/what-different-qualification-levels-mean/compare-different-qualification-levels for more information.
Data on the highest level of qualification was revised in late 2015 following a reweighting of the Labour Force Survey (LFS) that affects figures from 2001 onwards.
This section has updated in this SFR. Estimates previously published for 2012 and 2013 have been revised
following a reweighting of the Labour Force Survey covering 2012 to 2015 (the 2014 data was revised in
the November 2016 SFR). This SFR also now includes final 2015 data, along with provisional 2016 data.
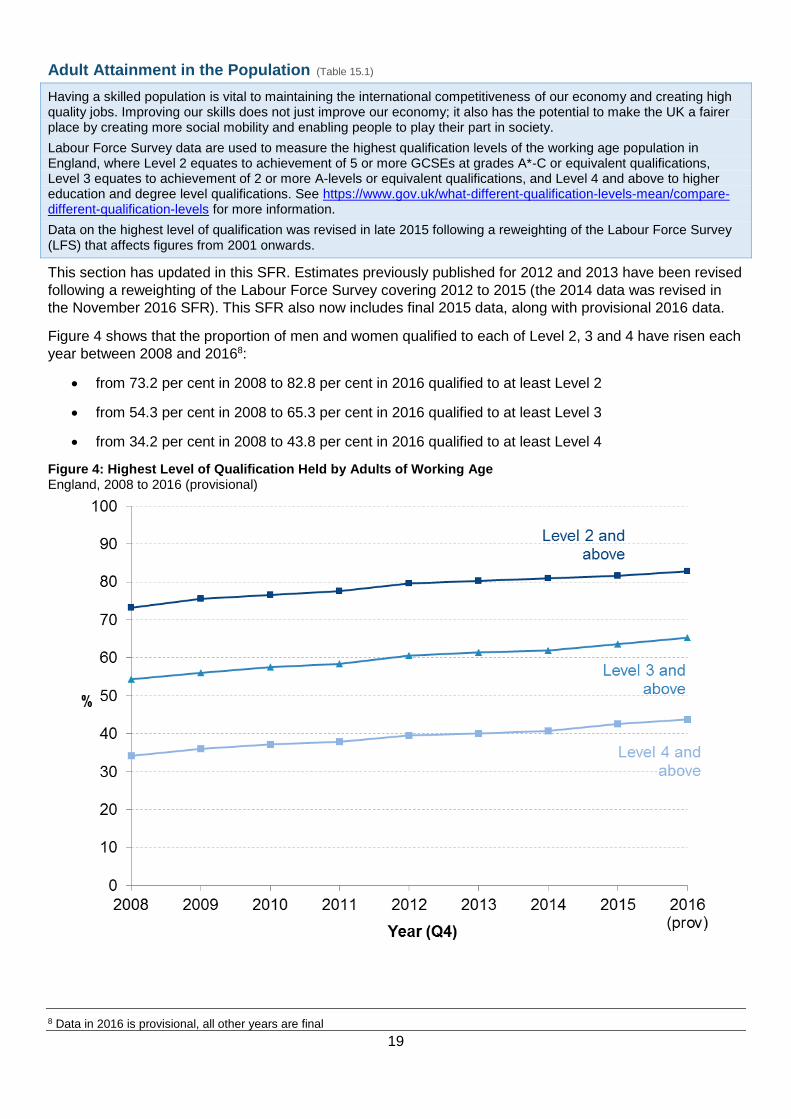
Figure 4 shows that the proportion of men and women qualified to each of Level 2, 3 and 4 have risen each
year between 2008 and 20168:
from 73.2 per cent in 2008 to 82.8 per cent in 2016 qualified to at least Level 2
from 54.3 per cent in 2008 to 65.3 per cent in 2016 qualified to at least Level 3
from 34.2 per cent in 2008 to 43.8 per cent in 2016 qualified to at least Level 4
Figure 4: Highest Level of Qualification Held by Adults of Working Age England, 2008 to 2016 (provisional)
8 Data in 2016 is provisional, all other years are final
20
In-Year Further Education Statistics for England, 2016/17
Figures for the first two quarters of the 2016/17 academic year (August 2016 to January 2017) are based on information that has been reported to the Skills Funding Agency in February 2017 by further education colleges and providers. The data provide an early view of performance and will change as further data returns are received. Since providers report some of their data for this period later in the year, the data are subject to change (in either direction) until final data is received. At this point in the year, 2016/17 figures are referred to as reported so far or reported to date to reflect this.
It is not possible to determine how complete or incomplete the information returned so far is, therefore care should be taken when comparing data reported so far in 2016/17 to the equivalent reporting period in 2015/16. This is particularly the case as provider reporting behaviour may change year to year 9. More accurate comparisons can be made once final returns for the academic year are made (data returned in October 2017, due to be published in November 2017).
New Full Level 2 and Full Level 3 methodology in 2016/17
The 2016/17 Full Level 2 and Full Level 3 figures have been calculated using a new methodology.
Rationale
In 2016/17 the number of qualifications classed as Full Level 2 and Full Level 3 have been reclassified by the Skills Funding Agency for the 19-23 entitlement, and to align with the 16-19 offer and recommendations in the Wolf Review of Vocational Qualifications.
Therefore the number of learning aims (qualifications) designated as ‘full’ for this SFR has decreased, as the Department continues to rationalise and streamline the qualifications offer. This SFR therefore now aligns more closely with the 16 to 19 Performance Tables in terms of the qualifications included.
The new methodology
The methodology change has involved a number of Level 2 and Level 3 vocational qualifications no longer being classed as Full Level 2 or Full Level 3 for funding purposes. This has affected the figures presented and led to a large fall compared to what the numbers would have been under the previous methodology as applied in 2015/16.
As a result, from 2016/17 some people who would have previously been included in the Full Level 2 and Full Level 3 figures in this SFR are no longer included following changes to funding rules on funding vocational qualifications. In effect these leareners have been ‘reclassified’ from Full Level 2 and Full Level 3 to Level 2 and Level 3, respectively, following changes made by the Skills Funding Agency to the qualification reference data used to calculate the Full Level 2 and Full Level 3 measures in this SFR.
This methodology change affects the overall FE and Skills participation figures (Table 18), the Education and Training participation figures (Table 20) and the offender learning participation (Table 25).
Impact assessment of 2016/17 Full Level 2 methodology
As noted above, from 2016/17 some people who would have previously been included in Full Level 2, have
been reclassified in the SFR tables show below:
Table 18: Adult (19+) FE and Skills Participation by Level (2016/17 – Reported to Date) and Table 20: Adult
(19+) Education and Training Participation by Level (2016/17 – Reported to Date)
Between August 2016 and January 2017, 92,500 learners have been reclassified to level 2 in both tables.
9 See the accompanying Quality and Methodology document for this SFR for more information: https://www.gov.uk/government/collections/further-
education-and-skills-statistical-first-release-sfr.
21
Table 25: Adult (18+) FE and Skills - Offender Learning Participation by Level (2016/17 – Reported to
Date):
Between August 2016 and January 2017, 6,800 learners have been reclassified to level 2.
Impact assessment of 2016/17 Full Level 3 methodology
As noted above, from 2016/17 some people who would have previously been included in Full Level 3, have
been reclassified in the SFR tables show below:
Table 18: Adult (19+) FE and Skills Participation by Level (2016/17 – Reported to Date) and Table 20: Adult
(19+) Education and Training Participation by Level (2016/17 – Reported to Date)
Between August 2016 and January 2017, 700 learners have been reclassified to level 3 in both tables.
Note: no offender learners are affected by the FL3 reclassification.
Adult Learner (19+) Participation (Table 18)
Data reported so far for the first two quarters of the 2016/17 academic year show there were 1,537,100
learners aged 19 and over participating in government-funded further education, compared to 1,615,400
reported at the equivalent time in 2015/16.
Of these:
578,300 participated on a English and Maths course, compared to 624,100 reported in the first two
quarters of 2015/16
570,900 participated on a Level 2 course, of which 341,400 were on a Full Level 2 course,
compared to 624,800 and 475,800 (respectively) reported in the first two quarters of 2015/16
384,600 participated on a Level 3 course, of which 372,900 were on a Full Level 3 course,
compared to 365,200 and 355,000 (respectively) reported in the first two quarters of 2015/16
162,400 benefited from support for the unemployed (those nearest the workforce), compared to
193,700 reported in the first two quarters of 2015/16
Apprenticeships (Tables 21, 22.1, 22.2 & 23)
Apprenticeship participation data reported so far for the first two quarters of the 2016/17 academic year
show that there were:
731,600 participants on an Apprenticeship, compared to 708,900 reported in the first two
quarters of 2015/16.
Of the 731,600 apprenticeship aparticpants in 2016/17, there were 392,700 at Intermediate Level;
308,200 at Advanced Level and 44,400 at Higher Level. 156,800 were aged under 19 and 574,800
aged 19 and over.
Of the 708,900 apprenticeship participants in 2015/16, there were 399,800 at Intermediate Level;
290,500 at Advanced Level and 30,600 at Higher Level. 157,000 were aged under 19 and 551,900
aged 19 and over.
22
Apprenticeship starts data reported in the first two quarters of the 2016/17 academic year show there were:
258,800 Apprenticeship starts, compared to 251,100 reported in the first two quarters of 2015/16.
Of the 258,800 starts reported in the first two quarters of in 2016/17 there were 141,400 at
Intermediate Level; 101,200 at Advanced Level and 16,200 at Higher Level. 82,600 Apprentices
were aged under 19 and 176,200 aged 19 and over.
Of the 251,100 starts reported in the first two quarters of 2015/16, there were 144,200 at
Intermediate Level; 95,800 at Advanced Level and 11,100 at Higher Level. 84,200 Apprentices were
aged under 19 and 166,900 aged 19 and over.
7,500 Apprenticeship starts were reported on the new Apprenticeship standards, compared to
1,100 reported in the first two quarters of 2015/16.
Of the 7,500 Apprentice standards started in 2016/17, 3,000 were aged under 19 and 4,500 were
aged 19 and over, compared to 500 and 600 (respectively) reported in the first two quarters of
2015/16. The volume of starts on Apprenticeship standards is shown by level in a supplementary
table10. There have been 12,100 starts on the new Apprenticeship standards since their
introduction.
237,600 starts for which a payment was made through the Apprenticeship Grant for Employers
(AGE 16 to 24) scheme between February 2012 and January 2017. A further 4,800 were in the
pipeline (started but not yet paid).
There have been 110,200 Apprenticeship framework achievements reported so far in 2016/17,
compared to 101,300 reported at this time last year.
Of the 110,200 achievements reported to date in 2016/17, there were 66,200 at Intermediate Level;
40,600 at Advanced Level and 3,300 at Higher Level. 34,600 Apprentices were aged under 19 and
75,500 aged 19 and over.
Of the 101,300 achievements reported in the first two quarters of 2015/16, there were 61,700 at
Intermediate Level; 37,900 at Advanced Level and 1,700 at Higher Level. 31,300 Apprentices were
aged under 19 and 70,000 aged 19 and over.
Additional breakdowns of provisional Apprenticeship statistics are published online at the FE Data Library11.
Adult (19+) English and Maths (Table 19)
Data reported so far in the first two quarters of the 2016/17 academic year show that 578,300 learners
aged 19 and over participated on an English and Maths course, compared to 624,100 reported in the first
two quarters of 2015/16.
Of the 578,300 in 2016/17:
405,200 participated on an English course, compared to 449,900 reported in the first two quarters
of 2015/16
395,700 participated on a Maths course, compared to 425,600 reported in the first two quarters of
in 2015/16
10 Supplementary tables can be accessed from the Apprenticeships FE Data Library. 11 The FE Data Library can be accessed at https://www.gov.uk/government/collections/fe-data-library.
23
87,700 participated on an English for Speakers of Other Languages (ESOL) course, compared to
86,700 reported in the first two quarters of 2015/16
Adult (19+) Education and Training (Table 20)
Data reported so far in the first two quarters of the 2016/17 academic year show there were 705,700
learners aged 19 and over participating in classroom-based education and training, compared to 771,900 at
this time in 2015/16.
Of the 705,700 in 2016/17:
287,700 participated on a Level 2 course, of which 57,700 were on a Full Level 2 course
131,300 participated on a Level 3 course, of which 117,900 were on a Full Level 3 course
Comparing to the 771,900 reported in the first two quarters of 2015/16:
314,000 participated on a Level 2 course, of which 171,900 were on a Full Level 2 course
126,300 participated on a Level 3 course, of which 123,100 were on a Full Level 3 course
Community Learning (Table 24)
Data reported so far in the first two quarters of the 2016/17 academic year (August 2016 to January 2017)
show that 307,900 learners participated on a Community Learning course, compared to 321,300 reported
in the first two quarters of 2015/16.
Of the 307,900 in 2016/17:
254,200 took a Personal and Community Development Learning course, compared to 262,000
reported in the first two quarters of 2015/16
19,000 took a Neighbourhood Learning in Deprived Communities course, compared to 20,300
reported in the first two quarters of 2015/16
15,700 took a Family English, Maths and Language course, compared to 19,500 reported in the
first two quarters of 2015/16
24,100 took a Wider Family Learning course, compared to 25,300 reported in the first two quarters
of 2015/16
Adult (18+) Offender Learners (Table 25)
Data reported so far in the first two quarters of the 2016/17 academic year show there were 55,800
offenders aged 18 or over in the prison system participating in learning, compared to 60,600 reported
reported in the first two quarters of 2015/16.
These offenders were funded via the Offenders’ Learning and Skills Service (OLASS) budget in August and
September, but responsibility transferred to the Ministry of Justice from 1 October following a Machinery of
Government change. However, data for the full quarter is still reported here. This number does not include
9,600 learners who sat an English and/or maths assessment but had not yet participated in any further
learning.
24
Advanced Learner Loans (Table 26)
In 2015/16 Advanced Learning Loans were available for learners aged 24 or older studying Full Level 3 and Level 4 qualifications. In 2016/17, loans were extended to learners aged 19 or older on the first day of their course and studying at Levels 3 to 6, and are now known as Advanced Learner Loans from 2016/17.
Data reported so far in the first two quarters of 2016/17 show that 91,800 learners took out a 19+
Advanced Learner Loan, of which 85,000 were participating at Level 3 and 6,900 at Level 4+.
The number of learners with a 19+ Advanced Learner Loan reported through the Individualised Learner
Record (ILR) differ from data showing loan applications and loans paid.
Traineeships (Table 27.1, 27.2 & 27.3)
Data reported so far in the first two quarters of the 2016/17 academic year show that there were:
11,800 Traineeship starts, of which 8,300 were aged under 19 and 3,500 were aged 19 to 24.
5,300 Traineeship completions, of which 3,200 were aged under 19 and 2,100 were aged 19 to
24.
2,800 Traineeship progressions to a job, apprenticeship, further full time education or other
training. Of these, 2,000 were progressions for those aged under 19, and 900 were for those aged
19-24.
Compared to data reported in the first two quarters of 2015/16, there were:
12,400 Traineeship starts, of which 8,300 were aged under 19 and 4,100 were aged 19 to24.
5,000 Traineeship completions, of which 3,000 were aged under 19 and 2,000 were aged 19 to
24.
2,700 Traineeship progressions to a job, apprenticeship, further full time education or other
training. Of these, 1,900 were progressions for those aged under 19, and 800 were progressions for
those aged 19-24.
25
Accompanying tables
The following tables are available in Excel format here: https://www.gov.uk/government/collections/further-
education-and-skills-statistical-first-release-sfr.
Final 2015/16 Tables
1.1 Adult (19+) FE and Skills Participation by Level (2010/11 to 2015/16) 1.2 Adult (19+) FE and Skills Achievement by Level (2010/11 to 2015/16) 2 All Age Apprenticeship Participation by Level and Age (2010/11 to 2015/16) 3.1 Adult (19+) Education and Training Participation by Level (2010/11 to 2015/16) 3.2 Adult (19+) Education and Training Achievement by Level (2010/11 to 2015/16) 4 Adult (19+) FE and Skills: English and Maths Participation and Achievement by Level (2010/11 to
2015/16) 5 All Age Demographic Summary of of FE and Skills Participation (2015/16) 6 All Age Demographic Summary of Apprenticeship Participation (2015/16) 7.1 All Age Apprenticeship Programme Starts by Level and Age (2010/11 to 2015/16) 7.2 All Age Apprenticeship Programme Achievements by Level and Age (2010/11 to 2015/16) 8.1 Workplace Learning Starts by Level (2010/11 to 2015/16) 8.2 Workplace Learning Achievements by Level (2010/11 to 2015/16) 9 Community Learning Participation and Achievement by Type (2010/11 to 2015/16) 10.1 Adult (18+) FE and Skills - Offender Learning Participation by Level (2010/11 to 2015/16) 10.2 Adult (18+) FE and Skills - Offender Learning Achievements by Level (2010/11 to 2015/16) 11 24+ FE and Skills: Participation with 24+ Advanced Learning Loans (Level 3+) (2013/14 to 2015/16) 12.1 Traineeship Starts by Age (2013/14 to 2015/16) 12.2 Traineeship Completions by Age (2013/14 to 2015/16) 12.3 Traineeship Progressions by Age (2013/14 to 2015/16) 13 Employer Ownership Pilot Starts (2012/13 to 2015/16) 14.1 Adult (19+) Education and Training Achievement Rates by Level (2010/11 to 2015/16) [revised June
2017] 14.2 Apprenticeship Achievement Rates by Level and Age (2010/11 to 2015/16) [revised June 2017] 15.1 Level of Highest Qualification Held by People aged 19-64 in England (Quarter 4) – percentages 15.2 Level of Highest Qualification Held by People aged 19-64 in England (Quarter 4) – volumes
(thousands) 16.1 Level Of Highest Qualification Held By Economically Active Adults In England (Quarter 4) –
Percentages 16.2 Level Of Highest Qualification Held By Economically Active Adults In England (Quarter 4) – volumes
(thousands) 17 Vocational Qualification Achievements in the UK by Qualification Type, 2006 (October) to 2016
(December) Year to Date Tables
18 Adult (19+) FE and Skills Participation by Level (2016/17 – Reported to Date) 19 Adult (19+) FE and Skills – English and Maths Participation by Level (2016/17 – Reported to Date) 20 Adult (19+) Education and Training Participation by Level (2016/17– Reported to Date) 21 All Age Apprenticeship Participation by Level and Age (2016/17 – Reported to Date) 22.1 All Age Apprenticeship Programme Starts by Level and Age (2016/17 – Reported to Date) 22.2 All Age Apprenticeship Programme Starts/Achievements by Level and Age (2016/17 – Reported to
Date) 23 Starts on the Apprenticeship Grant for Employers Scheme (AGE 16 to 24) - Pipeline Starts
Payments Made (February 2012 to October 2016) 24 Community Learning Participation by Type (2016/17 – Reported to Date) 25 Adult (18+) FE and Skills - Offender Learning Participation by Level (2016/17– Reported to Date) 26 24+ FE and Skills – Participation with 24+ Advanced Learner Loans (Level 3+) (2016/17 – Reported
to Date) 27.1 Traineeship Starts by Age (2016/17 – Reported to Date) 27.2 Traineeship Completions by Age (2016/17 – Reported to Date) 27.3 Traineeship Progression by Age (2016/17 – Reported to Date)
26
When reviewing the tables, please note that:
We preserve confidentiality The Code of Practice for Official Statistics (https://www.statisticsauthority.gov.uk/monitoring-and-assessment/code-of-practice/) requires us to take reasonable steps to ensure that our published or disseminated statistics protect confidentiality.
We suppress some figures In the SFR main tables, headline volumes below 50 are suppressed (this includes values of zero). In the supplementary tables volumes below 5 are suppressed (this includes values of zero). A percentage of less than 0.5% is suppressed.
We adopt symbols to help identify
suppression
Symbols are used in the tables as follows: ‘-’ indicates a headline volume with below 50 in the SFR main tables and below 5 in the supplementary tables. ‘*’ indicates a percentage of less than 0.5%.
We round figures In the SFR main tables, headline volumes are reported rounded to the nearest 100. In the supplementary tables volumes are rounded to the nearest 10. The exception to this is any figure that is an exact duplicate of a value in the headline figures (e.g. Grand Totals), which are rounded to the nearest 100 and avoid contradictory figures. Percentages reported are calculated on pre-rounded data and given to one decimal place.
Coverage of the data
This SFR includes finalised data for the full 2015/16 academic year (August 2015 to July 2016) reported to the Skills Funding Agency in October 2016 by further education providers. This SFR also includes data for the first two quarters of the 2016/17 academic year (August 2016 to January 2017).
Further information is available
Additional breakdowns of further education statistics are published online as supplementary tables These
include breakdowns by age, gender, ethnicity, learners with learning difficulties and/or disabilities, region,
local authority, parliamentary constituency, sector subject area and funding stream.
Please see the FE Data Library here: https://www.gov.uk/government/collections/fe-data-library
National Statistics
The United Kingdom Statistics Authority has designated these statistics as National Statistics, in
accordance with the Statistics and Registration Service Act 2007 and signifying compliance with the Code
of Practice for Official Statistics.
Designation can be broadly interpreted to mean that the statistics:
meet identified user needs;
are well explained and readily accessible;
are produced according to sound methods, and
are managed impartially and objectively in the public interest.
Once statistics have been designated as National Statistics it is a statutory requirement that the Code of
Practice shall continue to be observed.
The Department has a set of statistical policies in line with the Code of Practice for Official Statistics.
27
Technical information
A quality and methodology information document accompanies this SFR. This provides further information
on the data sources, their coverage and quality and explains the methodology used in producing the data,
including how it is validated and processed.
More technical information here: https://www.gov.uk/government/collections/further-education-and-skills-
statistical-first-release-sfr
Get in touch
Media enquiries
Press Office News Desk, Department for Education, Sanctuary Buildings, Great Smith Street, London
SW1P 3BT.
Tel: 020 7783 8300
Other enquiries/feedback
Elizabeth Richards, Further Education Statistical Dissemination Team, Department for Education,
Sanctuary Buildings, Great Smith Street, London, SW1P 3BT.
Email: [email protected]
© Crown copyright 2017
This publication (not including logos) is licensed under the terms of the
Open Government Licence v3.0 except where otherwise stated. Where
we have identified any third party copyright information you will need to
obtain permission from the copyright holders concerned.
To view this licence:
visit www.nationalarchives.gov.uk/doc/open-government-licence/version/3
email [email protected]
write to Information Policy Team, The National Archives, Kew, London, TW9 4DU
About this publication:
Enquiries: Elizabeth Richards, Further Education Statistical Dissemination Team, Department
for Education, Sanctuary Buildings, Great Smith Street, London, SW1P 3BT.
Email: [email protected]
Download: https://www.gov.uk/government/collections/further-education-and-skills-statistical-first-
release-sfr
Reference: SFR13/2017
Follow us on Twitter: @educationgovuk
Like us on Facebook: facebook.com/educationgovuk