Embed Size (px)
Citation preview
Future renewable energy costs: offshore wind51 technology innovations that will have greater impact on reducing the cost of electricity from European offshore wind farms
Renewable Energies
Update 2016
BVG Associates
BVG Associates is a technical consultancy with expertise in wind and marine energy technologies. The team probably has the best independent knowledge of the supply chain and market for wind turbines in the UK. BVG Associates has over 150 combined years of experience in the wind industry, many of these being “hands on” with wind turbine manufacturers, leading RD&D, purchasing and production departments. BVG Associates has consistently delivered to customers in many areas of the wind energy sector, including:•Marketleadersandnewentrantsinwindturbinesupplyand
UK and EU wind farm development•Marketleadersandnewentrantsinwindfarmcomponent
design and supply•Newandestablishedplayerswithinthewindindustryofall
sizes, in the UK and on most continents, and•TheDepartmentofEnergyandClimateChange(DECC),RenewableUK,TheCrownEstate,theEnergyTechnologiesInstitute,theCarbonTrust,ScottishEnterpriseandothersimilar enabling bodies.
KIC InnoEnergy
KICInnoEnergyisaEuropeancompanydrivinginnovationand entrepreneurship in the sustainable energy field, by bringing together academics, business and research sectors. KICInnoEnergyisoneofthefirstKnowledgeandInnovationCommunities(KICs)createdundertheleadershipoftheEuropeanInstituteofInnovationandTechnology(EIT).
We are a commercial company with 27 shareholders that include top ranking industries, research centres and universities - all of whom are key players in the energy field. Morethan150additionalpartnerscontributetoouractivities,forming a dynamic pan-European network. We are profit oriented, but have a “not for dividend” financial strategy: we reinvest any profits generated in our activities.
WithourheadquartersintheNetherlands,wedevelopouractivities through a network of offices located in Belgium, France,Germany,theNetherlands,Spain,Portugal,PolandandSweden.
Front cover image © RWE
Authors
Bruce Valpy Managing Director, BVG AssociatesKate Freeman Junior Associate, BVG AssociatesAlun Roberts Associate Director, BVG Associates
Coordinationofthestudy
Emilien Simonot Renewable Energies Technology Officer,KICInnoEnergy Antoni Martínez Renewable Energies CTO,KICInnoEnergy
Future renewable energy costs: offshore wind51 technology innovations that will have greater impact on reducing the cost of electricity from European offshore wind farms
KIC InnoEnergyRenewable Energies
Update 2016

05
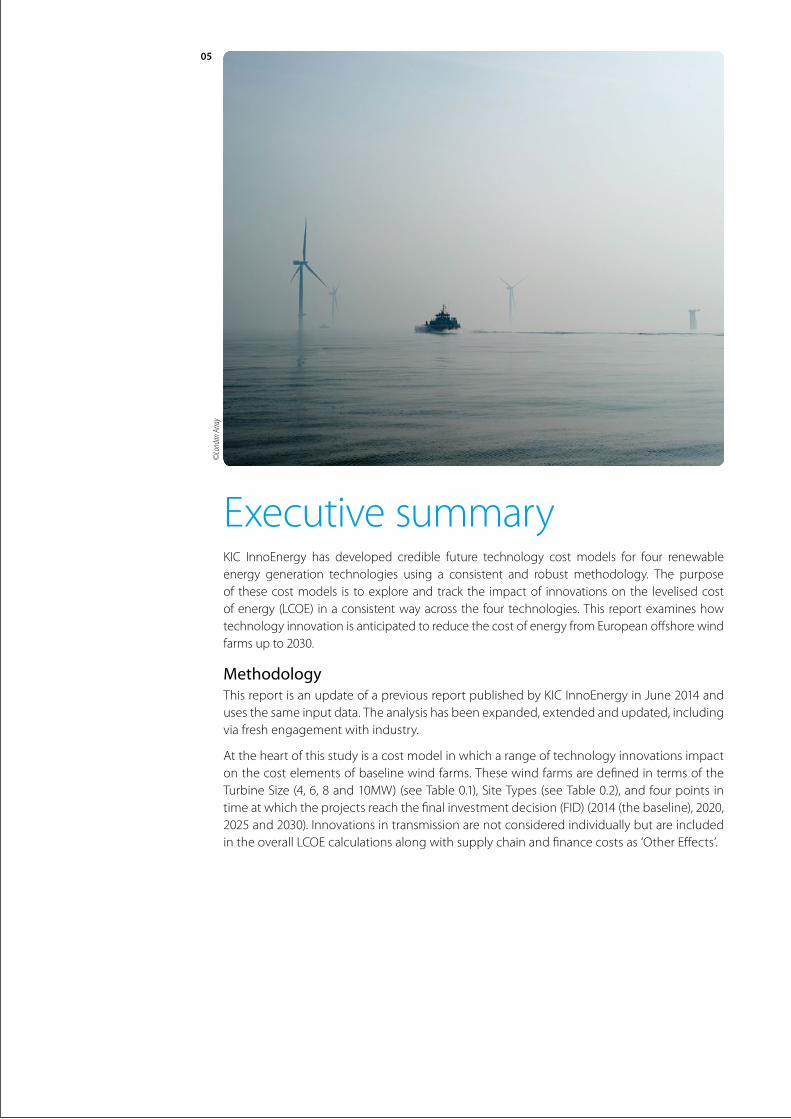
Executive summaryKIC InnoEnergy has developed credible future technology cost models for four renewableenergy generation technologies using a consistent and robust methodology. The purpose of these cost models is to explore and track the impact of innovations on the levelised cost ofenergy(LCOE) inaconsistentwayacrossthefourtechnologies.Thisreportexamineshowtechnology innovation is anticipated to reduce the cost of energy from European offshore wind farms up to 2030.
MethodologyThisreportisanupdateofapreviousreportpublishedbyKICInnoEnergyinJune2014anduses the same input data. The analysis has been expanded, extended and updated, including via fresh engagement with industry.
At the heart of this study is a cost model in which a range of technology innovations impact on the cost elements of baseline wind farms. These wind farms are defined in terms of the TurbineSize(4,6,8and10MW)(seeTable0.1),SiteTypes(seeTable0.2),andfourpointsintimeatwhichtheprojectsreachthefinalinvestmentdecision(FID)(2014(thebaseline),2020,2025and2030).InnovationsintransmissionarenotconsideredindividuallybutareincludedintheoverallLCOEcalculationsalongwithsupplychainandfinancecostsas‘OtherEffects’.
©Lo
ndon
Arra
y
Future renewable energy costs: offshore wind 06
ResultsMore than 50 technology innovations were identified as having the potential to cause asubstantialreductioninLCOEthroughachangeinthedesignofhardware,softwareorprocess.Manymoretechnicalinnovationsareindevelopment,sosomeofthosedescribedinthisreportmay be superseded by others.1
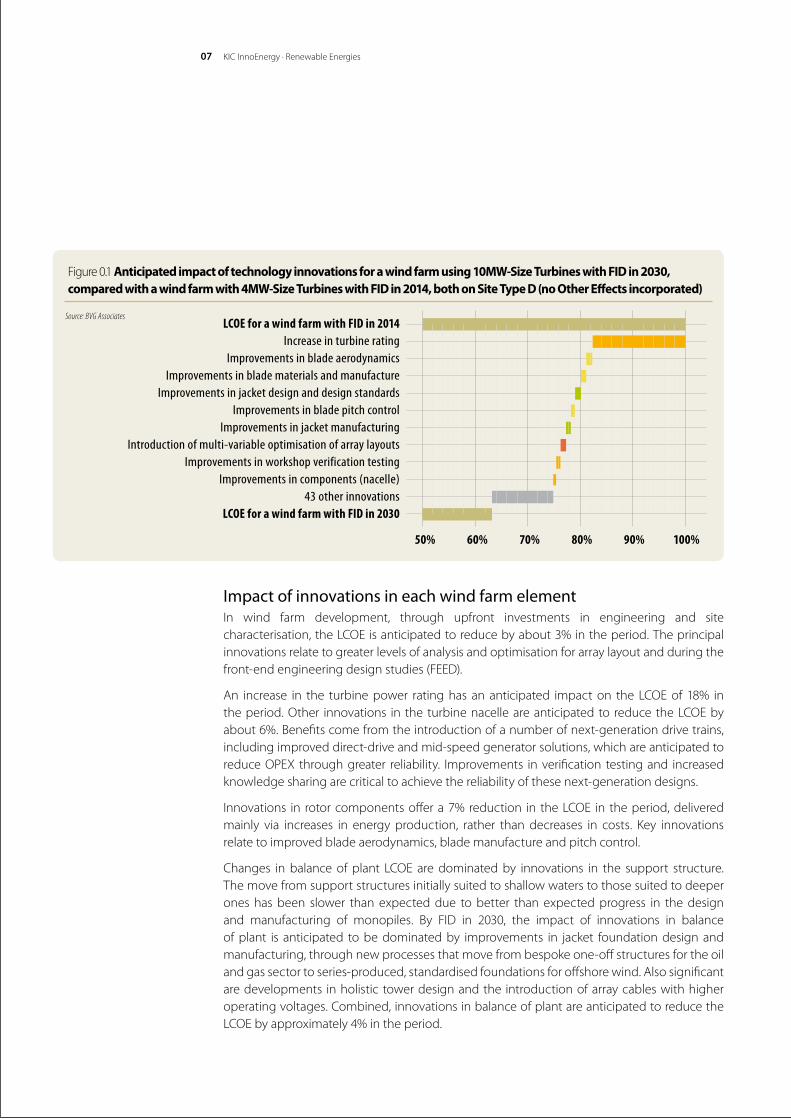
Thewindfarmtechnology innovations (excludingOtherEffects)contributeananticipated33%reductionintheLCOEfromFIDin2014toFIDin2030.Figure0.1showsthattwo-thirdsof the total anticipated technology impact is achieved through nine areas of innovation, thelargestofwhichistheincreaseinturbinesizefrom4MWto10MW.Byvirtueofhavingfewer turbines for a given wind farm rated power, there are significant savings in the cost of foundations and construction, and in operational expenditure (OPEX). All of the nextgenerationturbines(TurbineSizeof6MWorgreater)underdevelopmenttodayhavemoreoptimum-sized rotors than the previous generation and, because of a higher hub height, accesswind furtherabovesea level.They thereforehavehighergrossAEPpermegawatt,even before taking into account increased reliability and maintainability, which are expected with large turbines designed for the offshore market. The combined anticipated decrease in LCOEfromlargerturbineswithoptimum-sizedrotors, improvedaerodynamicsandcontrolandnextgenerationdrive-traindesignsisabout18%.
1 TheSiteTypenamesarethesameasin2012TheCrownEstateCostReductionsPathwaysStudy.SiteTypesBandCwerenotconsidered in this analysis.
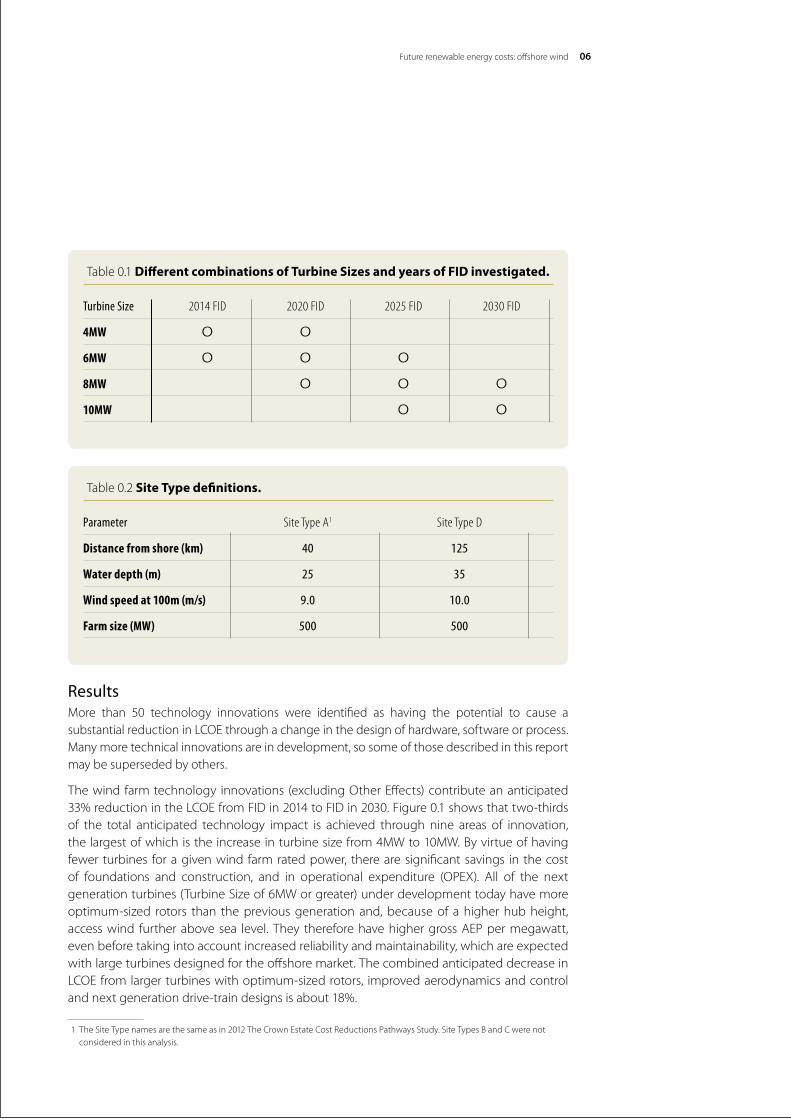
Table 0.1 Different combinations of Turbine Sizes and years of FID investigated.
Turbine Size 2014 FID 2020 FID 2025 FID 2030 FID
4MW о о6MW о о о8MW о о о10MW о о
Table 0.2 Site Type definitions.
Parameter Site Type A1 Site Type D
Distance from shore (km) 40 125
Water depth (m) 25 35
Wind speed at 100m (m/s) 9.0 10.0
Farm size (MW) 500 500
KIC InnoEnergy · Renewable Energies07
Impact of innovations in each wind farm elementIn wind farm development, through upfront investments in engineering and site characterisation,theLCOEisanticipatedtoreducebyabout3%intheperiod.Theprincipalinnovations relate to greater levels of analysis and optimisation for array layout and during the front-endengineeringdesignstudies(FEED).
An increase in the turbinepower ratinghas ananticipated impacton the LCOEof 18% intheperiod.Other innovations in the turbinenacelleareanticipatedto reducetheLCOEbyabout6%.Benefitscomefromtheintroductionofanumberofnext-generationdrivetrains,including improved direct-drive and mid-speed generator solutions, which are anticipated to reduceOPEX throughgreater reliability. Improvements inverification testingand increasedknowledge sharing are critical to achieve the reliability of these next-generation designs.
Innovations in rotorcomponentsoffera7%reduction in theLCOE in theperiod,deliveredmainly via increases in energy production, rather than decreases in costs. Key innovations relate to improved blade aerodynamics, blade manufacture and pitch control.
Changes inbalanceofplant LCOEaredominatedby innovations in the support structure.The move from support structures initially suited to shallow waters to those suited to deeper ones has been slower than expected due to better than expected progress in the design and manufacturing of monopiles. By FID in 2030, the impact of innovations in balance of plant is anticipated to be dominated by improvements in jacket foundation design and manufacturing, through new processes that move from bespoke one-off structures for the oil and gas sector to series-produced, standardised foundations for offshore wind. Also significant are developments in holistic tower design and the introduction of array cables with higher operatingvoltages.Combined,innovationsinbalanceofplantareanticipatedtoreducetheLCOEbyapproximately4%intheperiod.
Figure 0.1 Anticipated impact of technology innovations for a wind farm using 10MW-Size Turbines with FID in 2030, compared with a wind farm with 4MW-Size Turbines with FID in 2014, both on Site Type D (no Other Effects incorporated)
LCOE for a wind farm with FID in 2014Increase in turbine rating
Improvements in blade aerodynamicsImprovements in blade materials and manufacture
Improvements in jacket design and design standardsImprovements in blade pitch control
Improvements in jacket manufacturingIntroduction of multi-variable optimisation of array layouts
Improvements in workshop verification testingImprovements in components (nacelle)
43 other innovationsLCOE for a wind farm with FID in 2030
50% 60% 70% 80% 90% 100%
Source: BVG Associates
Future renewable energy costs: offshore wind 08
The introduction of installation vessels that can operate in a wider range of conditions and bespoke fleets of vessels for jacket foundation installation bring cost benefits because costs can be reduced through the introduction of large, heavy lift vessels designed for offshore wind foundation installation. The industry is anticipated to benefit from oil and gas sector experience and the entrance of major players from this sector is a positive sign that the potential savings canberealised.Overall,theanticipatedreductionintheLCOEduetoinnovationsinwindfarmconstruction is about 2% in the period.
ThethreebiggestinnovationsinOMSare:improvementsinOMSstrategyforfarfromshorewind farms; the introduction of condition-based maintenance for turbines and improvements in personnel access. Each will have the biggest impact on far-from-shore projects which involve greater transit distances and more severe sea states. We anticipate the reduction in the LCOEduetosuchinnovationstobeapproximately2%intheperiod.
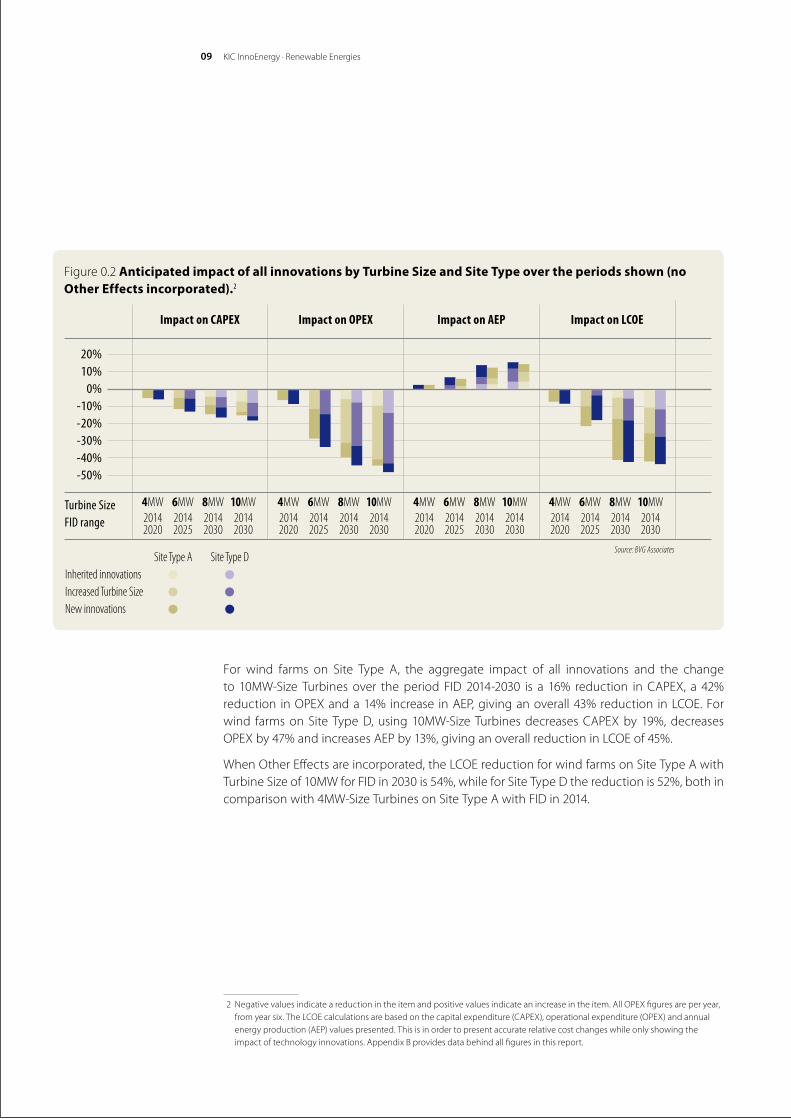
Source of innovation impactThe combined impact that technology innovations over the period are anticipated to have on projectswithdifferentcombinationsofTurbineSizesandSiteTypeispresentedinFigure0.2.TheaggregateimpactofallinnovationsisshownovertheFIDrangeforeachTurbineSize,allcomparedwiththesamewindfarm,thatis,onewith4MW-SizeTurbinesonSiteTypeAandFIDof2014.ShowingtheimpactwithrespecttothesamestartingwindfarmallowstheeffectofchangesinTurbineSizeandSiteTypetobecompareddirectly.
CAPEX,OPEX,AEPandLCOEallimprovewithincreasingTurbineSize:CAPEXandOPEXfallandtheAEPrises,resultinginLCOEsavings.Figure0.2alsobreakseachofthechanges inCAPEX,OPEX, AEP and LCOE down by the source of the change. The sources considered are gainsthrough:1.Inheritedinnovations(impactofinnovationsalreadyincorporatedinbaselineprojectforgivenTurbineSize,ref.Table2.2)
2.IncreasedTurbineSize3. Newinnovations(impactofinnovationscominginafterbaselineprojectforgivenTurbineSize).
09
For wind farms on Site Type A, the aggregate impact of all innovations and the changeto 10MW-Size Turbines over theperiod FID 2014-2030 is a 16% reduction inCAPEX, a 42%reduction inOPEXanda14% increase inAEP,givinganoverall43%reduction inLCOE.Forwind farmsonSite TypeD,using10MW-Size TurbinesdecreasesCAPEXby19%,decreasesOPEXby47%andincreasesAEPby13%,givinganoverallreductioninLCOEof45%.2
WhenOtherEffectsareincorporated,theLCOEreductionforwindfarmsonSiteTypeAwithTurbineSizeof10MWforFIDin2030is54%,whileforSiteTypeDthereductionis52%,bothincomparisonwith4MW-SizeTurbinesonSiteTypeAwithFIDin2014.
2 Negativevaluesindicateareductionintheitemandpositivevaluesindicateanincreaseintheitem.AllOPEXfiguresareperyear,fromyearsix.TheLCOEcalculationsarebasedonthecapitalexpenditure(CAPEX),operationalexpenditure(OPEX)andannualenergyproduction(AEP)valuespresented.Thisisinordertopresentaccuraterelativecostchangeswhileonlyshowingtheimpact of technology innovations. Appendix B provides data behind all figures in this report.
KICInnoEnergy·RenewableEnergies
Figure 0.2 Anticipated impact of all innovations by Turbine Size and Site Type over the periods shown (no Other Effects incorporated).2
20% 10% 0% -10% -20% -30% -40% -50%
Turbine Size FID range
Impact on CAPEX Impact on OPEX Impact on AEP Impact on LCOE
4MW2014 2020
6MW2014 2025
8MW2014 2030
10MW2014 2030
4MW2014 2020
6MW2014 2025
8MW2014 2030
10MW2014 2030
4MW2014 2020
6MW2014 2025
8MW2014 2030
10MW2014 2030
4MW2014 2020
6MW2014 2025
8MW2014 2030
10MW2014 2030
Site Type A Site Type D • • • • • •
Inherited innovations Increased Turbine SizeNew innovations
Source: BVG Associates
Future renewable energy costs: offshore wind 10
Glossary
AEP. Annual energy production.Anticipated impact. Term used in this report to quantify the anticipated market impact of a given innovation. This figure has been derived by moderating the potential impact through applyingvariousreal-worldfactors.Fordetailsofmethodology,seeSection2.Balance of plant.Supportstructureandarrayelectrical,seeAppendixA.Baseline. Termusedinthisreporttoreferto“today’s“technology,aswouldbeincorporatedinto a project.Capacity factor (CF). Ratio of annual energy production to annual energy production if all turbines are generating continuously at rated power.CAPEX.Capitalexpenditure.DECEX. Decommissioning expenditure.FEED. Front end engineering and design.FID. Final investment decision, defined here as that point of a project life cycle at which all consents, agreements and contracts that are required in order to commence a project constructionhavebeensigned(orareatornearexecutionform)andthereisafirmcommitment by equity holders and, in the case of debt finance, debt funders, to provide or mobilise funding to cover the majority of construction costs.Generic WACC.WeightedaveragecostofcapitalappliedtogenerateLCOE-basedcomparisonsoftechnicalinnovationsacrossscenarios.DifferentfromScenario-specificWACC.Gross AEP.Predictedannualenergyproductionbasedonturbinepowercurve,excludinglosses.Hs.Significantwaveheight.Inherited innovations.InnovationsalreadyincorporatedinbaselineprojectforgivenTurbineSize.LCOE.Levelisedcostofenergy,consideredhereaspre-taxandrealinend2013terms.Fordetailsofmethodology,seeSection2.MHWS. Meanhighwatersprings,theaveragethroughouttheyear(whentheaveragemaximiumdeclinationofthemoonis23.5°)oftwosuccessivehighwatersduringthoseperiodsof24hourswhentherangeofthetideisatitsgreatest.MSL.Meansealevel.MW.Megawatt.MWh.Megawatthour.Net AEP.Meteredannualenergyproductionattheoffshoresubstation,includingwindfarmlosses.New innovations.InnovationswhichcomeinafterbaselineprojectforgivenTurbineSize.OMS. Operation,plannedmaintenanceandunplannedserviceinresponsetoafault.OPEX.Operationalexpenditure.Other Effects. Effects other than from wind farm technology innovations, such as supply chain competition and changes in financing costs.Potential impact. Term used in this report to quantify the maximum potential technical impact by FID in 2030 of a given innovation. This impact is then moderated through applicationofvariousreal-worldfactors.Fordetailsofmethodology,seeSection2.RD&D. Research, development and demonstration.Site Type. Term used in this report to describe a representative set of physical parameters for alocationwhereaprojectmaybedeveloped.Fordetailsofmethodology,seeSection2.Scenario-specific WACC. Weighted average cost of capital associated with a specific combinationofSiteType,TurbineSizeandyearofFID.Usedtocalculatereal-worldLCOEincorporatingOtherEffects,(Section2.4).Technology Type. UsedinthisstudytodescribeTurbineSizeTurbine Size. Termusedinthisreporttodescribearepresentativeturbinesize(ratedpower)for which baseline costs are derived and to which innovations are applied. For details of methodology,seeSection2.WACC. Weighted average cost of capital, considered here as real and pre-tax.WCD. Works completion date.

11
Table of contents
Executive summary 5
1. Introduction 12
2. Methodology 14
3. Baseline wind farms 21
4. Innovations in wind farm development 25
5. Innovations in the wind turbine nacelle 30
6. Innovations in the wind turbine rotor 38
7. Innovations in balance of plant 45
8. Innovations in wind farm construction and commissioning 51
9. Innovations in wind farm operation, maintenance and service 57
10. Summary of the impact of innovations 65
11. Conclusions 73
12. About KIC InnoEnergy 76
AppendixA.Furtherdetailsofmethodology 78 AppendixB.Datasupportingtables 85
Listoffigures 92 Listoftables 94
KICInnoEnergy·RenewableEnergies
12
© D
ONG E
nerg
y A/S
1. Introduction1.1. FrameworkAsaninnovationpromoter,KICInnoEnergyisinterestedinidentifyingandevaluatingtheimpactof visible innovations on the cost of energy from various renewable energy technologies. This analysis is critical in understanding where the biggest opportunities and challenges are, from a technology point of view.
KIC InnoEnergyhasalreadypublishedasetofconsistentanalysesforvarioustechnologiestohelp in the understanding and definition of innovation pathways that industries could follow to maintain the competitiveness of the European renewable energy sector worldwide. These technologiesincludeonshoreandoffshorewind,solarPVandsolarthermalelectricityandgasandcoal.TheseanalysesallcontributetotheKICInnoEnergyDELPHOSonlinecostofenergytool. In 2014 KIC published Future renewable energy costs: offshore wind (2014)3. In this report, KIC InnoEnergy extends the temporal horizon of the previous offshore wind study to 2030and increases the turbinecapacity to10MW to lookat longer-term trends in the innovationpathways.Thisisclearlyalonger-termapproach,butiscomplementarytotheKICInnoEnergytechnologymappingfocusingoninnovationsreachingthemarketintheshort/mid-term(uptofiveyearsahead).
1.2. Purpose and backgroundThe purpose of this report is to document the cost of energy for offshore wind projects reaching financialinvestmentdecision(FID)upto2030,bymodellingoftheimpactofarangeoftechnicalinnovationsandOtherEffectsincludingfinancingandsupplychainimpacts.Themethodologyfollows that of the previous report. Additional industry engagement has been used in the production of this report.
3 KICInnoEnergy,availableonlineatwww.kic-innoenergy.com/reports
KIC InnoEnergy · Renewable Energies13
1.3. Structure of this reportFollowing this introduction, this report is structured as follows:Section 2. Methodology: This section describes the scope of the model, project terminology and assumptions, the process of technology innovation modelling, industry engagement and the treatment of risk and health and safety.Section 3. Baseline wind farms: This section summarises the parameters relating to the eight baseline wind farms for which results are presented. Assumptions relating to these wind farms arepresentedinSection2.
The following six sections consider each element of the wind farm in turn, exploring the impact of innovations in that element.Section 4. Innovations in wind farm development: This section incorporates the wind farmdesign,consenting,contractinganddeveloper’sprojectmanagementactivitiesthroughtotheworkscompletiondate(WCD).Section 5. Innovations in wind turbine nacelle: This section incorporates the drive train, power take-off and auxiliary systems, including those that may be located in the tower.Section 6. Innovations in wind turbine rotor: This section incorporates the blades, hub and any pitch or other aerodynamic control system.Section 7. Innovations in balance of plant: This section incorporates the support structure, the tower and foundation. It includes the sea bed connection and also the secondary steel work to provide personnel and equipment access and array cable support. It also considers subsea cables connecting turbines to any substation. Cable protection is covered underinnovationsinwindfarmconstruction.Offshoreandonshoresubstationsandexportcablesare not considered among the innovations, but these transmission costs are included in the OtherEffectsdiscussedinSection2.4.Section 8. Innovations in wind farm construction: This section incorporates transportation of components from the port nearest to the component supplier, plus all installation and commissioning activities for the support structure, turbine and array cables. Decommissioning is also discussed in this section. It excludes installation of the offshore substation, the export cables and onshore transmission assets, which are modelled as transmission charges.Section 9. Innovations in operation, maintenance and service (OMS): This section incorporatesallactivitiesaftertheWCDuntildecommissioning.Section 10. Summary of the impact of innovations: This section presents the aggregate impact of all innovations, exploring the relative impact of innovations in different wind farm elements.
Section 11. Conclusions: This section includes both technology-related conclusions and conclusionsregardingOtherEffects.
Appendix A. Details of methodology: This appendix discusses project assumptions and provides examples of methodology use.Appendix B. Data tables: This appendix provides tables of data behind figures presented in the report.
14
©Lo
ndon
Arra
y
2.MethodologyThe main innovations were selected and described through engagement with industry. This led to 51 innovations and their effects on cost pathways being modelled. The model uses the maximum technical potential impact of the innovations on the cost and energy elements of the baseline wind farms, which were developed from a combination of deeper modelling and engagementwithindustry.Siterelevance,commercialreadinessandmarketsharesareusedtomodify this maximum so as to give the anticipated impact of each innovation. The innovations are then combined togive anoverall innovation trajectory,with additional (non-innovation)effects included separately.
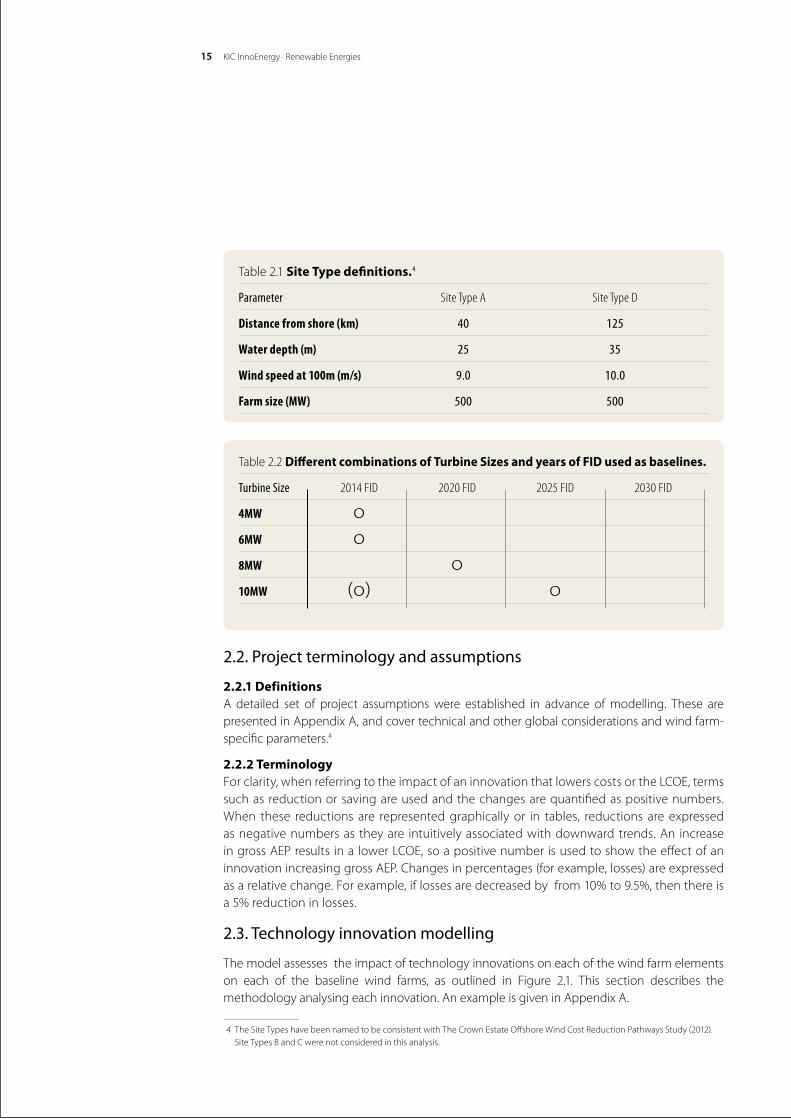
2.1. Scope of modelThebasisofthemodelisasetofbaselineelementsofcapitalexpenditure(CAPEX),operationalexpenditure(OPEX)andannualenergyproduction(AEP)forarangeofrepresentativeTurbineSizesontwoSiteTypes(seeTable2.1),impactedonbyarangeoftechnologyinnovations.Analysisiscarriedoutatanumberofpointsintime(yearsofFID)(seeTable2.2),thusdescribingvariouspotentialpathwaysthattheindustrycouldfollow,eachwithanassociatedLCOEtrajectory.Thetick in brackets in Table 2.2 shows the baseline used to compare individual innovations over the wholeperiodfromFIDin2014toFIDin2030,asusedinFigure4.2,Figure5.2,Figure6.2,Figure7.2,Figure8.2andFigure9.2.
ThestudydoesnotconsiderthemarketshareofthedifferentTurbineSizesandSiteTypesTheactualaveragelevelisedcostofenergy(LCOE)inagivenyearwilldependonthemixofsuchparameters for projects reaching FID in that year.
KIC InnoEnergy · Renewable Energies15
2.2. Project terminology and assumptions
2.2.1 DefinitionsA detailed set of project assumptions were established in advance of modelling. These are presented in Appendix A, and cover technical and other global considerations and wind farm-specific parameters.4
2.2.2 TerminologyForclarity,whenreferringtotheimpactofaninnovationthatlowerscostsortheLCOE,termssuch as reduction or saving are used and the changes are quantified as positive numbers. When these reductions are represented graphically or in tables, reductions are expressed as negative numbers as they are intuitively associated with downward trends. An increase ingrossAEPresultsinalowerLCOE,soapositivenumberisusedtoshowtheeffectofaninnovationincreasinggrossAEP.Changesinpercentages(forexample,losses)areexpressedasarelativechange.Forexample,iflossesaredecreasedbyfrom10%to9.5%,thenthereisa 5% reduction in losses.
2.3. Technology innovation modelling
The model assesses the impact of technology innovations on each of the wind farm elements on each of the baseline wind farms, as outlined in Figure 2.1. This section describes the methodology analysing each innovation. An example is given in Appendix A.
4 TheSiteTypeshavebeennamedtobeconsistentwithTheCrownEstateOffshoreWindCostReductionPathwaysStudy(2012).SiteTypesBandCwerenotconsideredinthisanalysis.
Table 2.2 Different combinations of Turbine Sizes and years of FID used as baselines.
Turbine Size 2014 FID 2020 FID 2025 FID 2030 FID
4MW о 6MW о 8MW о 10MW (о) о
Table 2.1 Site Type definitions.4
Parameter Site Type A Site Type D
Distance from shore (km) 40 125
Water depth (m) 25 35
Wind speed at 100m (m/s) 9.0 10.0
Farm size (MW) 500 500
Future renewable energy costs: offshore wind 16
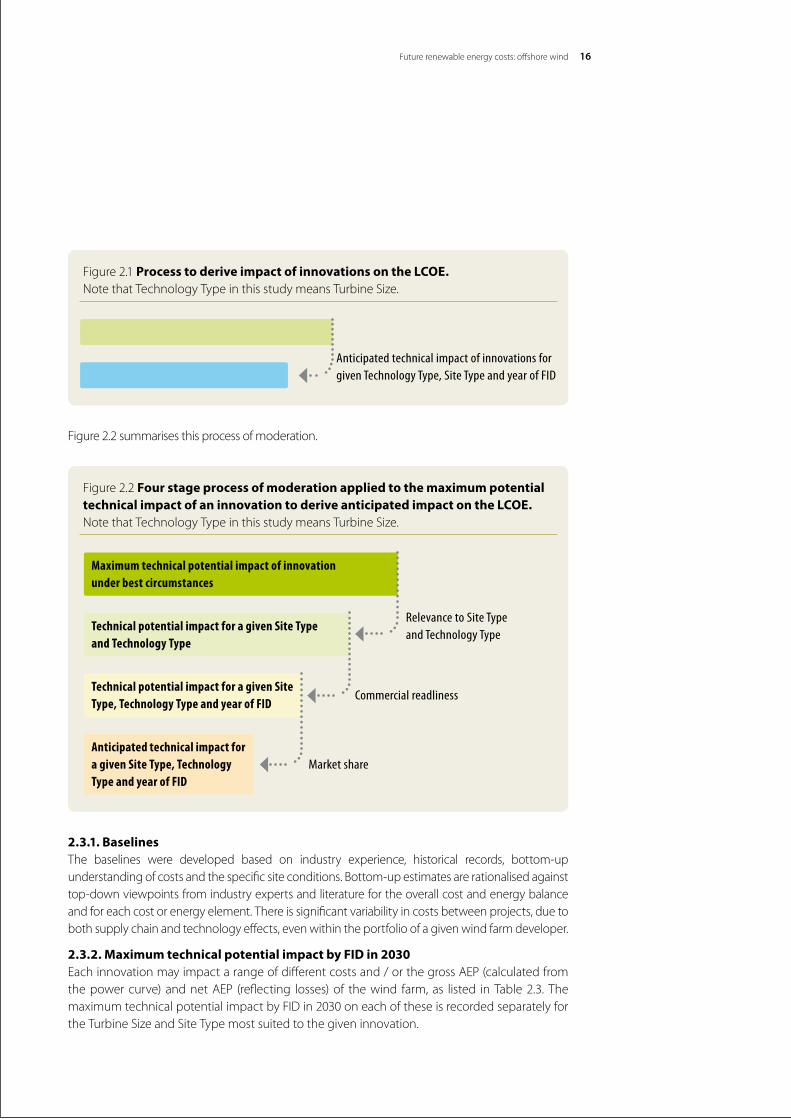
Figure 2.2 summarises this process of moderation.
2.3.1. BaselinesThe baselines were developed based on industry experience, historical records, bottom-up understanding of costs and the specific site conditions. Bottom-up estimates are rationalised against top-down viewpoints from industry experts and literature for the overall cost and energy balance and for each cost or energy element. There is significant variability in costs between projects, due to both supply chain and technology effects, even within the portfolio of a given wind farm developer.
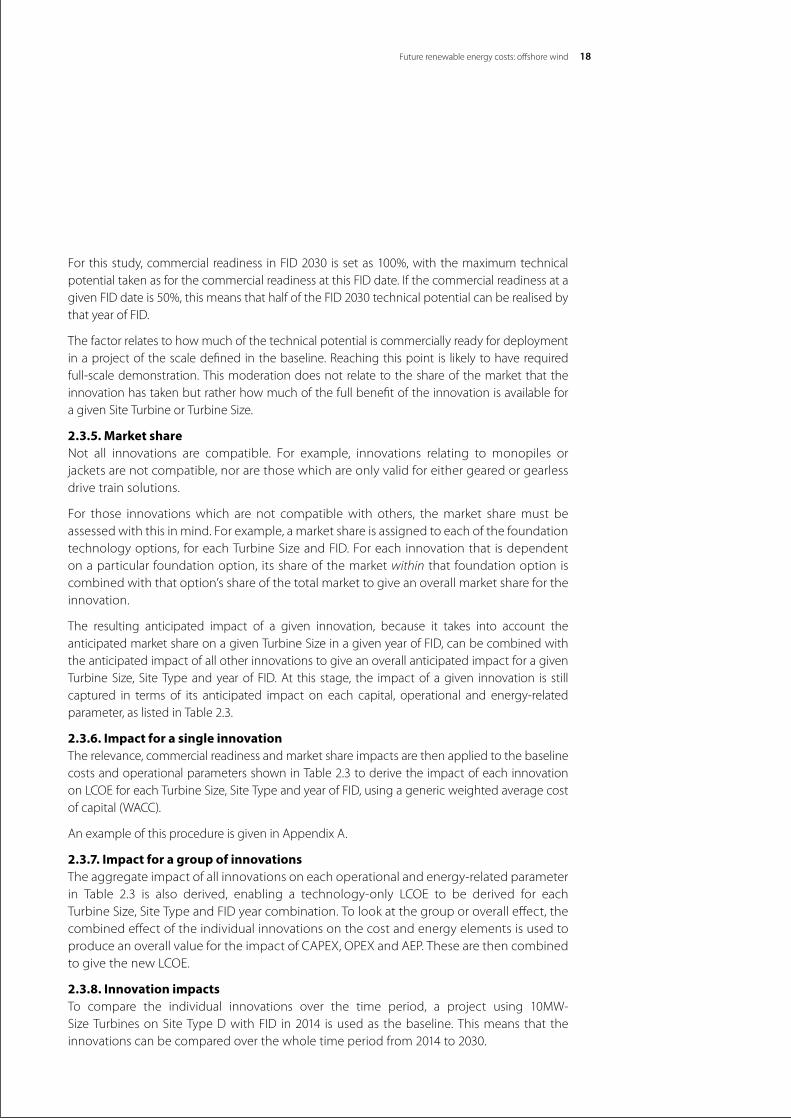
2.3.2. Maximum technical potential impact by FID in 2030Eachinnovationmayimpactarangeofdifferentcostsand/orthegrossAEP(calculatedfromthepowercurve)andnetAEP (reflecting losses)of thewind farm,as listed inTable2.3. Themaximum technical potential impact by FID in 2030 on each of these is recorded separately for theTurbineSizeandSiteTypemostsuitedtothegiveninnovation.
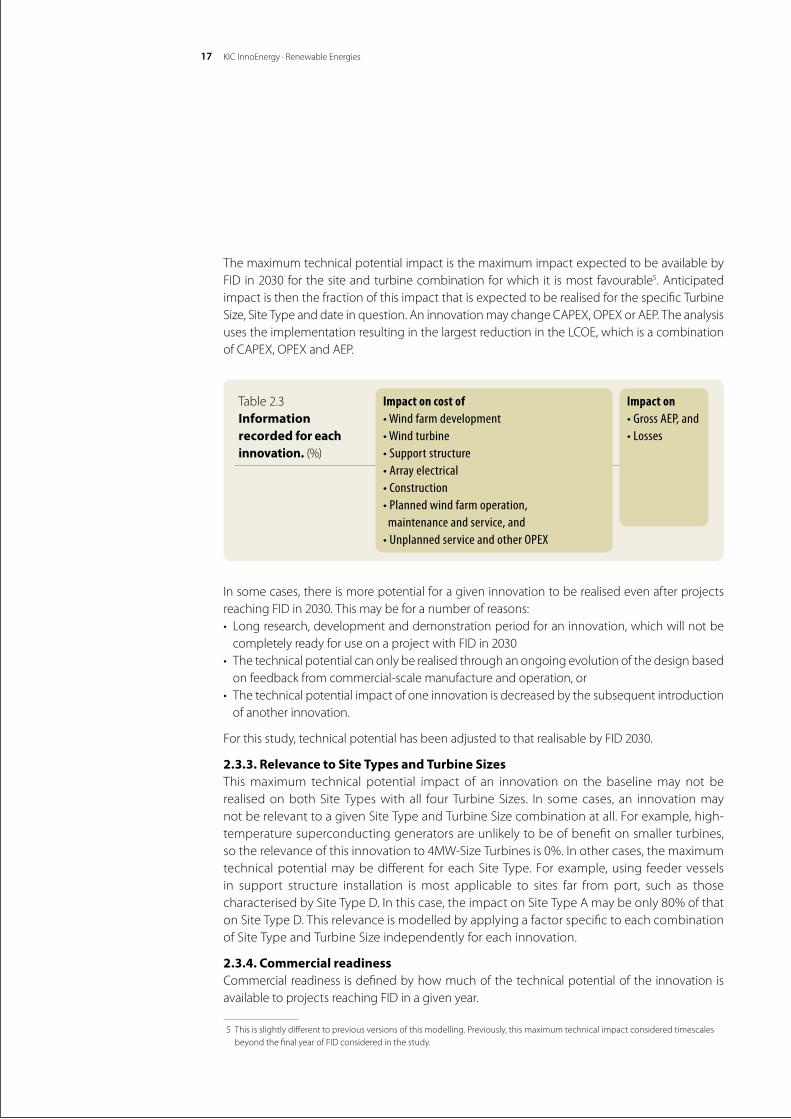
Figure 2.2 Four stage process of moderation applied to the maximum potential technical impact of an innovation to derive anticipated impact on the LCOE. NotethatTechnologyTypeinthisstudymeansTurbineSize.
Anticipated technical impact for a given Site Type, Technology Type and year of FID
Technical potential impact for a given Site Type, Technology Type and year of FID
Technical potential impact for a given Site Type and Technology Type
Maximum technical potential impact of innovation under best circumstances
Relevance to Site Type and Technology Type
Commercial readliness
Market share
Figure 2.1 Process to derive impact of innovations on the LCOE. NotethatTechnologyTypeinthisstudymeansTurbineSize.
Baseline parameters for given project
Revised parameters for given wind farmAnticipated technical impact of innovations for given Technology Type, Site Type and year of FID
KIC InnoEnergy · Renewable Energies17
The maximum technical potential impact is the maximum impact expected to be available by FID in 2030 for the site and turbine combination for which it is most favourable5. Anticipated impact is then the fraction of this impact that is expected to be realised for the specific Turbine Size,SiteTypeanddateinquestion.AninnovationmaychangeCAPEX,OPEXorAEP.TheanalysisusestheimplementationresultinginthelargestreductionintheLCOE,whichisacombinationofCAPEX,OPEXandAEP.
In some cases, there is more potential for a given innovation to be realised even after projects reaching FID in 2030. This may be for a number of reasons:• Longresearch,developmentanddemonstrationperiodforaninnovation,whichwillnotbe
completely ready for use on a project with FID in 2030• Thetechnicalpotentialcanonlyberealisedthroughanongoingevolutionofthedesignbased
on feedback from commercial-scale manufacture and operation, or• Thetechnicalpotentialimpactofoneinnovationisdecreasedbythesubsequentintroduction
of another innovation.
For this study, technical potential has been adjusted to that realisable by FID 2030.
2.3.3. Relevance to Site Types and Turbine SizesThis maximum technical potential impact of an innovation on the baseline may not be realisedonbothSiteTypeswithall fourTurbineSizes. In somecases, an innovationmaynotberelevanttoagivenSiteTypeandTurbineSizecombinationatall.Forexample,high-temperature superconducting generators are unlikely to be of benefit on smaller turbines, sotherelevanceofthisinnovationto4MW-SizeTurbinesis0%.Inothercases,themaximumtechnicalpotentialmaybedifferent foreachSiteType.Forexample,using feedervesselsin support structure installation is most applicable to sites far from port, such as those characterisedbySiteTypeD.Inthiscase,theimpactonSiteTypeAmaybeonly80%ofthatonSiteTypeD.ThisrelevanceismodelledbyapplyingafactorspecifictoeachcombinationofSiteTypeandTurbineSizeindependentlyforeachinnovation.
2.3.4. Commercial readinessCommercialreadiness isdefinedbyhowmuchofthetechnicalpotentialoftheinnovationisavailable to projects reaching FID in a given year.
5 Thisisslightlydifferenttopreviousversionsofthismodelling.Previously,thismaximumtechnicalimpactconsideredtimescalesbeyond the final year of FID considered in the study.
Table 2.3 Information recorded for each innovation.(%)
Impact on cost of• Wind farm development• Wind turbine• Support structure• Array electrical• Construction• Planned wind farm operation, maintenance and service, and • Unplanned service and other OPEX
Impact on• Gross AEP, and• Losses
Future renewable energy costs: offshore wind 18
For this study, commercial readiness in FID 2030 is set as 100%, with the maximum technical potential taken as for the commercial readiness at this FID date. If the commercial readiness at a given FID date is 50%, this means that half of the FID 2030 technical potential can be realised by that year of FID.
The factor relates to how much of the technical potential is commercially ready for deployment in a project of the scale defined in the baseline. Reaching this point is likely to have required full-scale demonstration. This moderation does not relate to the share of the market that the innovation has taken but rather how much of the full benefit of the innovation is available for agivenSiteTurbineorTurbineSize.
2.3.5. Market shareNot all innovations are compatible. For example, innovations relating to monopiles orjackets are not compatible, nor are those which are only valid for either geared or gearless drive train solutions.
For those innovations which are not compatible with others, the market share must be assessed with this in mind. For example, a market share is assigned to each of the foundation technologyoptions, foreachTurbineSizeandFID.Foreachinnovationthat isdependenton a particular foundation option, its share of the market within that foundation option is combinedwiththatoption’sshareofthetotalmarkettogiveanoverallmarketsharefortheinnovation.
The resulting anticipated impact of a given innovation, because it takes into account the anticipatedmarketshareonagivenTurbineSizeinagivenyearofFID,canbecombinedwiththe anticipated impact of all other innovations to give an overall anticipated impact for a given TurbineSize,SiteTypeandyearofFID.At this stage, the impactofagiven innovation is stillcaptured in terms of its anticipated impact on each capital, operational and energy-related parameter, as listed in Table 2.3.
2.3.6. Impact for a single innovationThe relevance, commercial readiness and market share impacts are then applied to the baseline costs and operational parameters shown in Table 2.3 to derive the impact of each innovation onLCOEforeachTurbineSize,SiteTypeandyearofFID,usingagenericweightedaveragecostofcapital(WACC).
An example of this procedure is given in Appendix A.
2.3.7. Impact for a group of innovationsThe aggregate impact of all innovations on each operational and energy-related parameter in Table 2.3 is also derived, enabling a technology-only LCOE to be derived for eachTurbineSize,SiteTypeandFIDyearcombination.Tolookatthegrouporoveralleffect,thecombined effect of the individual innovations on the cost and energy elements is used to produceanoverallvaluefortheimpactofCAPEX,OPEXandAEP.ThesearethencombinedtogivethenewLCOE.
2.3.8. Innovation impactsTo compare the individual innovations over the time period, a project using 10MW-SizeTurbinesonSiteTypeDwithFID in2014 isusedas thebaseline.Thismeans that theinnovationscanbecomparedoverthewholetimeperiodfrom2014to2030.
KIC InnoEnergy · Renewable Energies19
Obviously,this10MW-SizeTurbinewasnotavailableforuseinprojectswithFIDin2014,butusing itasa theoreticalcomparisonpoint ishelpful.TheCAPEX,OPEXandAEPvalues forsuchaprojectareshowninTableA.6.
2.4. Treatment of Other EffectsToderiveareal-worldLCOE,thistechnology-onlyLCOEisfactoredtoaccountfortheimpactofvariousOtherEffects,definedforeachforeachcombinationofTurbineSize,SiteTypeandyearof FID as follows:•Scenario-specificWACCandlifetimecombinations,takingintoaccountrisk(orcontingency)•Transmissionand landcost,covering transmissionCAPEXandOPEXandcharges related to
the onshore transmission network and sea bed lease fees. The transmission cost is based on anHVACtransmissionsystemforSiteTypeAandHVDCsystem(orHVACsystemwithreactorstation) forSiteTypeD.ThedistanceatwhichadeveloperwouldchooseanHVDCsystemoveranHVACsystemiscurrentlyquiteuncertain,duetodynamicchangesintechnologyandsupply chain. In some markets, transmission is a socialised cost, transparent to the wind farm owner; in other markets, the developer constructs the transmission system then sells it to an operator and pays a rental for its use. As the focus of this study is wind farm generating assets, transmissionistreatedsimplyasanOtherEffect•Supplychaindynamics,simplifyingtheimpactofthesupplychainleverssuchascompetitionandcollaboration,firstdiscussed inECHarris’Offshore Wind Cost Reduction Pathways: Supply chain work stream.In2015and2016,winningbidsforauctionsforpre-developedoffshorewindfarms in Europe have indicated important further cost reductions for projects commissioned from 2020. These are likely to be mainly due to:
• Increasedcompetitionatdeveloperlevelforthesamesite. • Benefitofanticipatedsavingsduetohavingapipelineofprojectsoveranumberofyears,
enabling savings in the supply chain due to the expectation of higher utilisation of vessels and facilities, depreciation of investment over more activity, increased learning through repetition and the facilitation of new investment.
• InclusionofbenefitsfromlikelyfuturesavingsinOMSthatarenotavailableatFID.•Insurance and contingency costs, both relating to construction and operation insurance and
typical spend of construction phase contingency•The risk that some projects are terminated prior to FID, thereby inflating the equivalent cost
of work carried out in this phase on a project that is constructed. For example, if only one in three projects reaches FID, then the effective contribution to the cost of energy of work carried out on projects prior to FID is modelled as three times the actual cost for the project that is successful, and•Decommissioning costs.
A factor for each of these effects was derived from a range of sources and a trend was used across each combinationof Turbine Size, Site Type and FID year, aspresented inAppendix A.
The factors are applied as follows:•Scenario-specificWACCandoperatinglifeareusedinplaceofthegenericWACCtocalculatearevisedLCOE,and•EachfactorisappliedinturntothisLCOEtoderivethereal-worldLCOE.

Future renewable energy costs: offshore wind 20
These factors are kept separate from the impact of technology innovations in order to clearly identifytheimpactofinnovations,buttheyareneededinordertobeabletocompareLCOEfordifferent scenarios rationally.
The effects of changes in construction time are not modelled.
2.5. Treatment of health and safety
The health and safety of staff working on both onshore and offshore operations is important to the offshore wind industry. This study incorporates into the cost of innovations any mitigation required in order to at least preserve existing levels of health and safety. It is difficult to quantify health and safety impacts but in some cases, preserving similar levels of health and safety precludedsomeinnovations.Thisisevidentin,forexample,offshoreoperations.ManyoftheinnovationsthatareconsideredtoreducetheLCOEovertimehaveanintrinsicbenefittohealthand safety performance. These include: •The increased rated capacity of turbines, hence fewer turbines to transfer to per gigawatt
installed. All other things being equal, reducing the number of transfers reduces the risk of incidents during transfer.•Turbine design with increased onshore assembly. All other things being equal, reducing the
amount of offshore activity decreases the risk of incidents.•The increased reliability of turbines and hence fewer transfers to turbines and less time working
in the offshore environment.•Conditionmonitoringandremotediagnostics,whichenableamoreeffectiveandproactive
service and hence result in fewer complex retrofits or repairs, and•The introduction of systems that allow for easier access to turbines, for example walk-to-work
access systems and crane-less transfer systems.

21
3. Baseline wind farmsSection2describedthemodellingprocessasthefollowing:•Define a set of baseline wind farms and derive costs, and energy-related parameters for each•For each of a range of innovations, derive the anticipated impact on these same parameters,
for each baseline wind farm, for a given year of FID, and•Combinetheimpactofarangeofinnovationstoderivecosts,andenergy-relatedparameters
for each of the baseline wind farms for each year of FID.
In this section, the costs and other parameters for the baseline wind farms are summarised.
The baseline costs presented in Figure 3.1 and Figure 3.2 are nominal contract values, rather than outturn values. As such, they incorporate real-life supply chain effects such as the impact ofcompetition.TheyareforthecombinationsofTurbineSizeandSiteTypeshowninTable2.2.
All results presented in this report incorporate the impact of technology innovations only, except forwhentheLCOEispresentedinFigure3.3andinSection10.3,whichalsoincorporatestheOtherEffectsdiscussedinSection2.4.
Forthepurposesofthisstudy,the8MWturbinesaremodelledfirstinprojectswithFIDsin2020onwards(ratherthanwithFIDsin2014).DONGenergydidcommitduring2014tousingtheV164-8.0MWturbine for its250MWBurboBankextensionoffshorewind farmproject,but this was a single case for a small project and therefore not representative of the market asawhole.Thefirst10MWturbinesareassumedtobeusedonprojectswithFIDsin2025onwards.Noassumptionsaremade in this reportabout themarket shareof thedifferentTurbineSizes.
Thebaselinewindfarmused inthe innovationcomparisons inSections4-9 isdescribed inTableA.6.
©ww
w.lon
dona
rray.c
om
22Future renewable energy costs: offshore wind
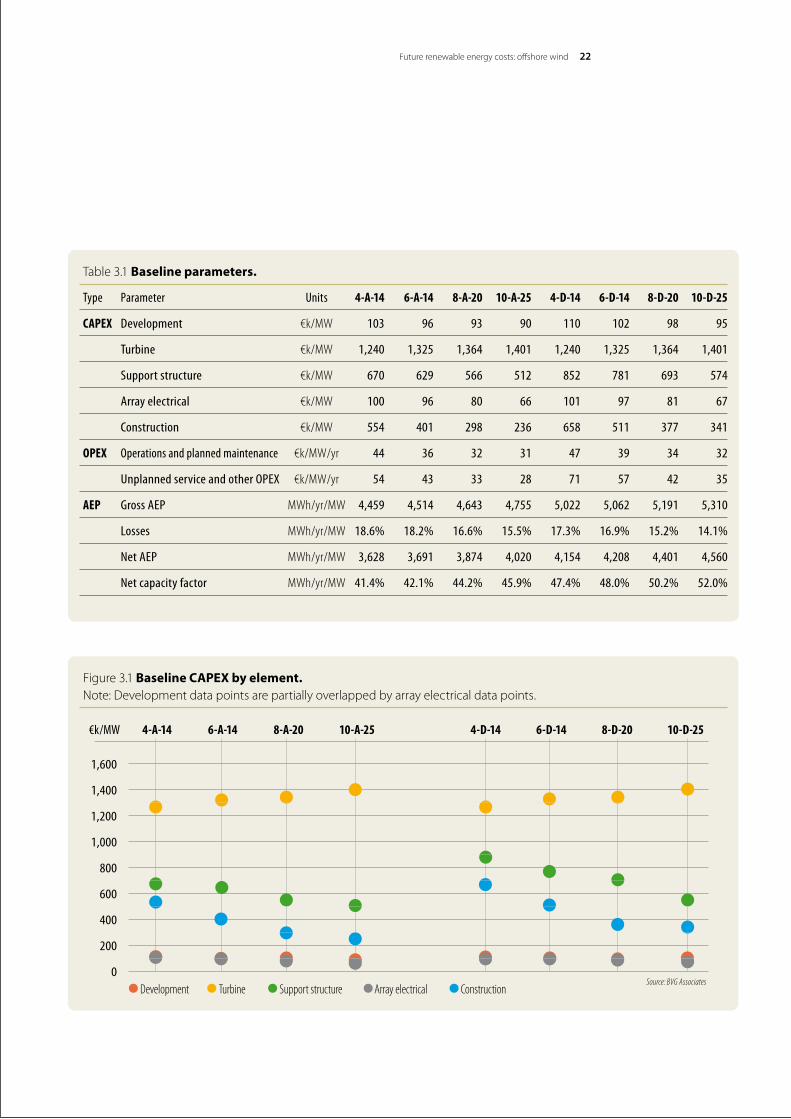
Table 3.1 Baseline parameters.
Type Parameter Units 4-A-14 6-A-14 8-A-20 10-A-25 4-D-14 6-D-14 8-D-20 10-D-25
CAPEX Development €k/MW 103 96 93 90 110 102 98 95
Turbine €k/MW 1,240 1,325 1,364 1,401 1,240 1,325 1,364 1,401
Support structure €k/MW 670 629 566 512 852 781 693 574
Array electrical €k/MW 100 96 80 66 101 97 81 67
Construction €k/MW 554 401 298 236 658 511 377 341
OPEX Operations and planned maintenance €k/MW/yr 44 36 32 31 47 39 34 32
Unplanned service and other OPEX €k/MW/yr 54 43 33 28 71 57 42 35
AEP Gross AEP MWh/yr/MW 4,459 4,514 4,643 4,755 5,022 5,062 5,191 5,310
Losses MWh/yr/MW 18.6% 18.2% 16.6% 15.5% 17.3% 16.9% 15.2% 14.1%
Net AEP MWh/yr/MW 3,628 3,691 3,874 4,020 4,154 4,208 4,401 4,560
Net capacity factor MWh/yr/MW 41.4% 42.1% 44.2% 45.9% 47.4% 48.0% 50.2% 52.0%
Figure 3.1 Baseline CAPEX by element. Note:Developmentdatapointsarepartiallyoverlappedbyarrayelectricaldatapoints.
€k/MW
1,600
1,400
1,200
1,000
800
600
400
200
0
4-A-14 6-A-14 8-A-20 10-A-25 4-D-14 6-D-14 8-D-20 10-D-25
Source: BVG Associates •Development •Turbine •Support structure •Array electrical •Construction
KIC InnoEnergy · Renewable Energies23
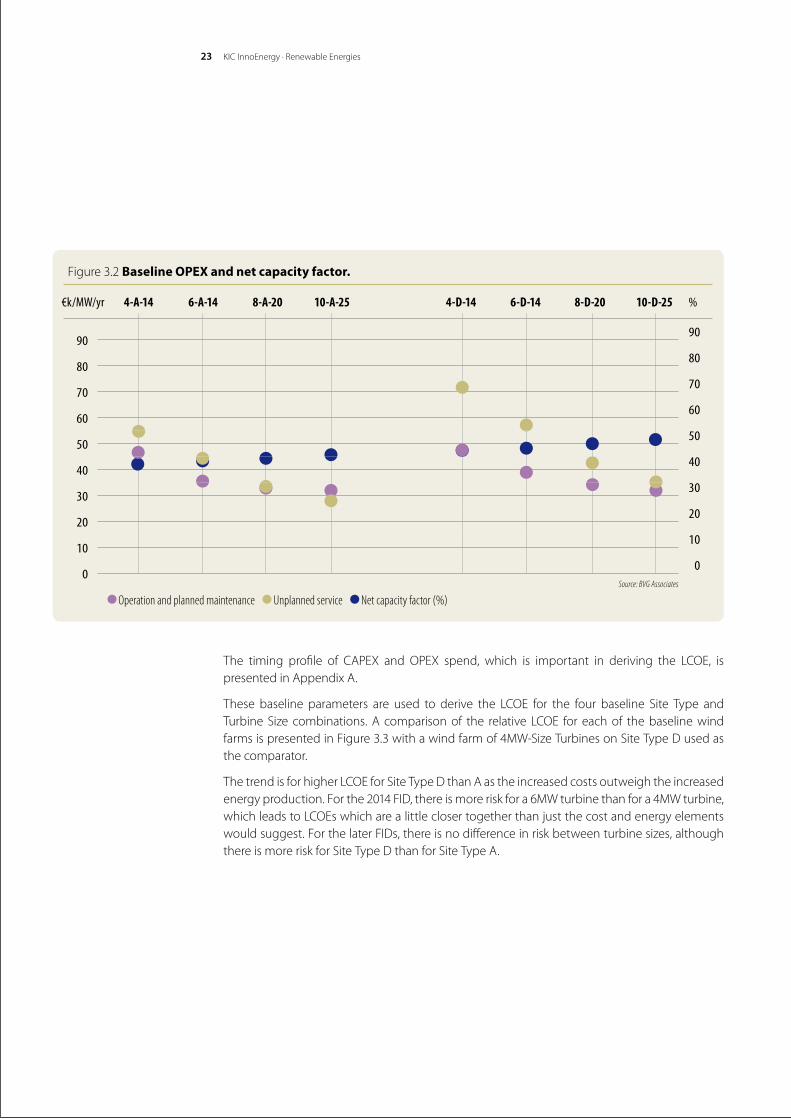
The timing profile of CAPEX and OPEX spend, which is important in deriving the LCOE, ispresented in Appendix A.
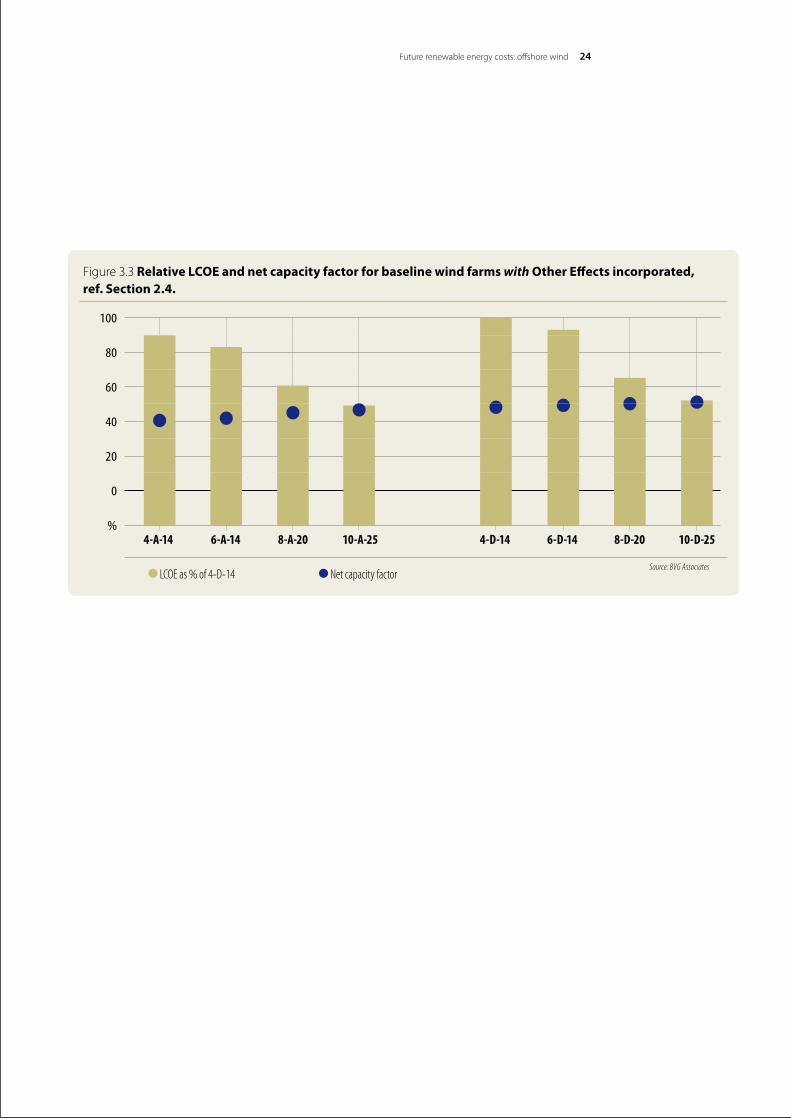
These baseline parameters are used to derive the LCOE for the four baseline Site Type andTurbineSize combinations.A comparisonof the relative LCOE for eachof thebaselinewindfarmsispresentedinFigure3.3withawindfarmof4MW-SizeTurbinesonSiteTypeDusedasthe comparator.
ThetrendisforhigherLCOEforSiteTypeDthanAastheincreasedcostsoutweightheincreasedenergyproduction.Forthe2014FID,thereismoreriskfora6MWturbinethanfora4MWturbine,whichleadstoLCOEswhicharealittleclosertogetherthanjustthecostandenergyelementswould suggest. For the later FIDs, there is no difference in risk between turbine sizes, although thereismoreriskforSiteTypeDthanforSiteTypeA.
Figure 3.2 Baseline OPEX and net capacity factor.
90
80
70
60
50
40
30
20
10
0
€k/MW/yr 4-A-14 6-A-14 8-A-20 10-A-25 4-D-14 6-D-14 8-D-20 10-D-25 %
Source: BVG Associates
•Operation and planned maintenance •Unplanned service •Net capacity factor (%)
90
80
70
60
50
40
30
20
10
0
Future renewable energy costs: offshore wind 24
Figure 3.3 Relative LCOE and net capacity factor for baseline wind farms with Other Effects incorporated, ref. Section 2.4.
100
80
60
40
20
0
% 4-A-14 6-A-14 8-A-20 10-A-25 4-D-14 6-D-14 8-D-20 10-D-25
Source: BVG Associates •LCOE as % of 4-D-14 •Net capacity factor
25
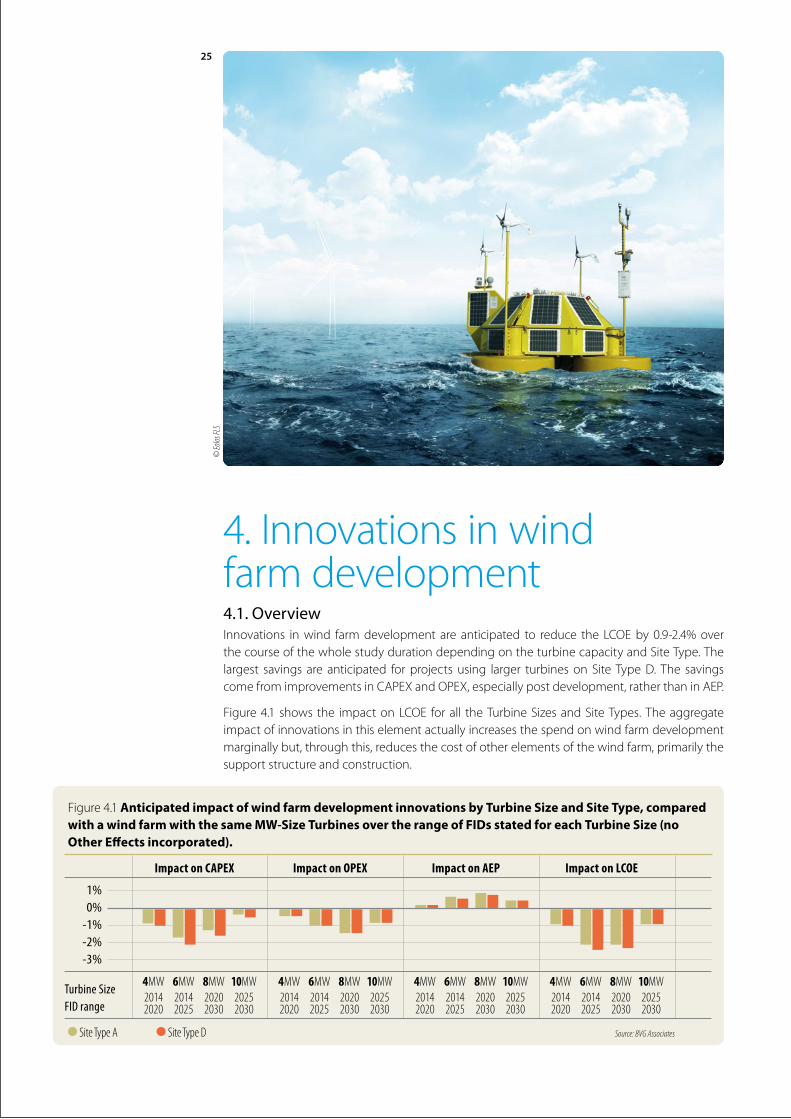
4.Innovationsinwind farm development4.1. OverviewInnovations inwind farmdevelopment are anticipated to reduce the LCOEby0.9-2.4%overthecourseofthewholestudydurationdependingontheturbinecapacityandSiteType.Thelargest savings are anticipated forprojectsusing larger turbineson Site TypeD. The savingscomefromimprovementsinCAPEXandOPEX,especiallypostdevelopment,ratherthaninAEP.
Figure4.1shows the impactonLCOE forall theTurbineSizesandSiteTypes.Theaggregateimpact of innovations in this element actually increases the spend on wind farm development marginally but, through this, reduces the cost of other elements of the wind farm, primarily the support structure and construction.
© Eo
los FL
S
Figure4.1 Anticipated impact of wind farm development innovations by Turbine Size and Site Type, compared with a wind farm with the same MW-Size Turbines over the range of FIDs stated for each Turbine Size (no Other Effects incorporated).
1% 0% -1% -2% -3%
Turbine Size FID range
Impact on CAPEX Impact on OPEX Impact on AEP Impact on LCOE
•Site Type A •Site Type D
4MW20142020
6MW20142025
8MW20202030
10MW20252030
4MW20142020
6MW20142025
8MW20202030
10MW20252030
4MW20142020
6MW20142025
8MW20202030
10MW20252030
4MW20142020
6MW20142025
8MW20202030
10MW20252030
Source: BVG Associates
Future renewable energy costs: offshore wind 26
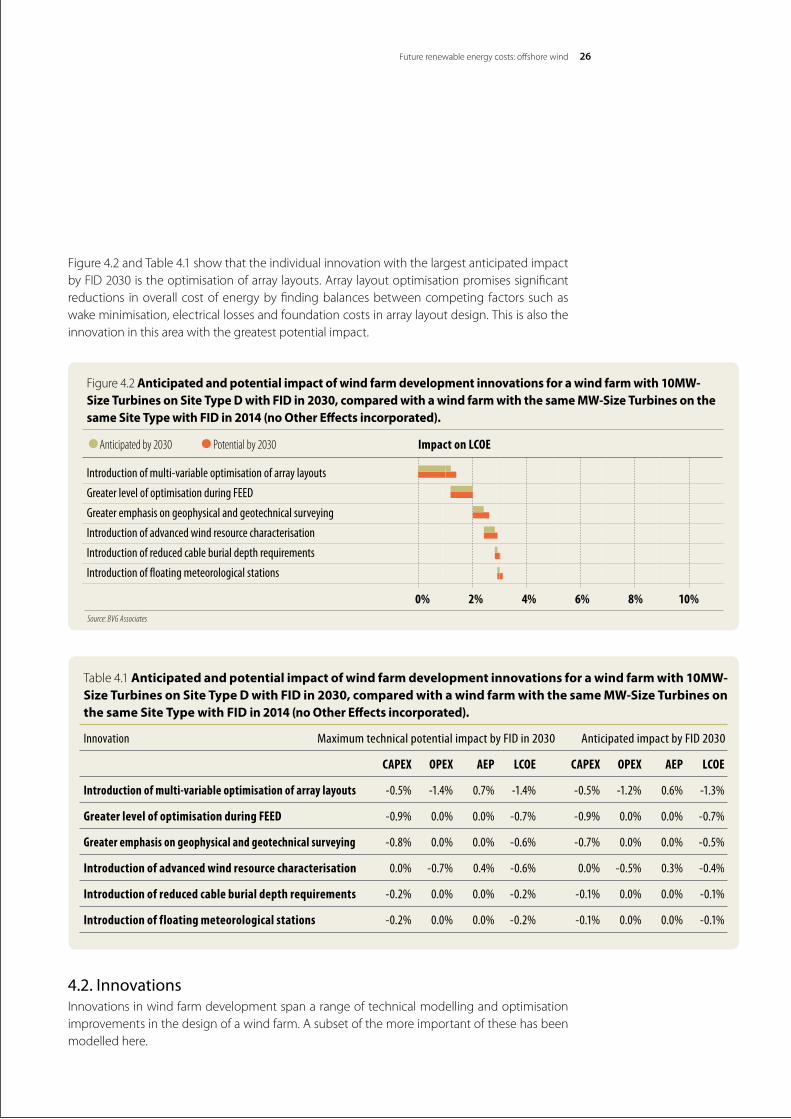
Figure4.2andTable4.1showthattheindividualinnovationwiththelargestanticipatedimpactby FID 2030 is the optimisation of array layouts. Array layout optimisation promises significant reductions in overall cost of energy by finding balances between competing factors such as wake minimisation, electrical losses and foundation costs in array layout design. This is also the innovation in this area with the greatest potential impact.
4.2. InnovationsInnovations in wind farm development span a range of technical modelling and optimisation improvements in the design of a wind farm. A subset of the more important of these has been modelled here.
Table4.1Anticipated and potential impact of wind farm development innovations for a wind farm with 10MW-Size Turbines on Site Type D with FID in 2030, compared with a wind farm with the same MW-Size Turbines on the same Site Type with FID in 2014 (no Other Effects incorporated).
Innovation Maximum technical potential impact by FID in 2030 Anticipated impact by FID 2030
CAPEX OPEX AEP LCOE CAPEX OPEX AEP LCOE
Introduction of multi-variable optimisation of array layouts -0.5% -1.4% 0.7% -1.4% -0.5% -1.2% 0.6% -1.3%
Greater level of optimisation during FEED -0.9% 0.0% 0.0% -0.7% -0.9% 0.0% 0.0% -0.7%
Greater emphasis on geophysical and geotechnical surveying -0.8% 0.0% 0.0% -0.6% -0.7% 0.0% 0.0% -0.5%
Introduction of advanced wind resource characterisation 0.0% -0.7% 0.4% -0.6% 0.0% -0.5% 0.3% -0.4%
Introduction of reduced cable burial depth requirements -0.2% 0.0% 0.0% -0.2% -0.1% 0.0% 0.0% -0.1%
Introduction of floating meteorological stations -0.2% 0.0% 0.0% -0.2% -0.1% 0.0% 0.0% -0.1%
Figure4.2 Anticipated and potential impact of wind farm development innovations for a wind farm with 10MW-Size Turbines on Site Type D with FID in 2030, compared with a wind farm with the same MW-Size Turbines on the same Site Type with FID in 2014 (no Other Effects incorporated).
Introduction of multi-variable optimisation of array layouts
Greater level of optimisation during FEED
Greater emphasis on geophysical and geotechnical surveying
Introduction of advanced wind resource characterisation
Introduction of reduced cable burial depth requirements
Introduction of floating meteorological stations
Impact on LCOE
Source: BVG Associates
•Anticipated by 2030 •Potential by 2030
0% 2% 4% 6% 8% 10%
27
Introduction of multi-variable optimisation of array layouts
Practice today: In 2014, multi-disciplinary optimisation tools had not been used onprojects that had reached FID because of the relatively benign and uniform conditions in which the early wind farms were deployed, the lack of accurate cost of energy modelling data and the constraints imposed on the sites. Instead, developers have used the existing iterative process involving multiple engineering teams and design loops occurring throughthepre-FEEDandFEEDperiods.Suchmultidisciplinaryoptimisationtoolsarenowbeginning to be used.Innovation: The introduction of multi-variable optimisation of array layouts includes using fast and reliable optimisation software that allows for the constraints required by multiple technical disciplines. The wind farm array layout is optimised, for example, for the combination of wake effects, array electrical cost, support structure cost, consenting constraints and construction and operationalcosts.TheoverallbenefitofthisinnovationistoreducetheLCOEthroughimprovingthe choice of turbine, foundation design and location of turbines and cables while accounting for the constraints of multiple design criteria, completing iterative loops in minutes where these currently take weeks.Relevance: TheinnovationisequallyrelevanttoallTurbineSizesandSiteTypes.Commercial readiness: Almost 50% of the benefit of this innovation is anticipated to be available for projects with FID in 2020 rising to around 70% for projects with FID in 2025. Market share:Marketshareisanticipatedtobeabouttwo-thirdsofprojectswithFIDin2020.It is anticipated that it will be used almost universally for projects with FID in 2025 and 2030.
Greater level of optimisation during FEED
Practice today: Detailed design and optimisation occur during FEED studies that are delivered viaamixofdeveloperin-houseexpertiseandcontractedservices.Currently,FEEDstudiesenablethe basic concept and component size to be chosen based on simplified design activities. Usually, this is completed for a variety of design options to compare economically viable solutions. At this stage, design options remain relatively flexible.Innovation: Developers indicate that a greater level of optimisation during FEED could offer substantialreductionsintheLCOE.Thisincludestheundertakingofadditionaldetaileddesignstudies at the FEED stage. It involves the use of additional survey data, such as those gathered through a greater level of geotechnical and geophysical surveying, and increased depth of design for the foundation and installation methods for a number of turbine and foundation designs, which are usually completed later in the development process. A greater level of optimisation during FEED allows some of the detailed aspects of design to be brought forward, enhancing the accuracy of cost estimates for wind farm design solutions with variables such as water depth, soil conditions and wind speed, as well as choice of turbine. This enables improved decision making.Relevance: The innovation is more relevant to wind farms in deeper water and further from shore where support structure and construction costs are higher.Commercial readiness: Overhalfofthebenefitofthisinnovationisanticipatedtobeavailableto projects with FID in 2020, with almost all of the remainder available for projects with FID in 2025.Market share: Marketshareisanticipatedtobeabout70%ofprojectswithFID,risingtoalmost100% by FID 2025.
KICInnoEnergy·RenewableEnergies
Future renewable energy costs: offshore wind 28
Greater emphasis on geophysical and geotechnical surveying
Practice today: Historically,seabed(geotechnicalandgeophysical)surveysanddatacollectionstartmanyyearsbeforetheplannedoperationofthewindfarm.Often,pre-FIDgeotechnicaland geophysical data are available only at turbine locations and with a focus on properties far below the sea bed, leading to significant uncertainties relating to cable design and installation.Innovation: An improved knowledge of sea bed conditions and of soil conditions closer to the surfaceoftheseabedcanleadtocostreductionsinarrayelectricalandconstructionCAPEX.This is because it can prevent conservative overdesign or late design changes. It can also reduce costs in construction because the soil conditions are known beforehand in places where jack-uplegswillbesitedandthecorrectcableinstallationtoolscanbechosen.SupportstructureCAPEX savingsarealsopossiblewithan increasednumberof core samples takenat turbinelocations resulting in reduced uncertainty about sea bed conditions. Additional data have the added benefit of reducing the uncertainties relating to installation methods and costs, thus leading to an eventual reduction in both the allocated contingency and the cost of finance. It is also relevant to work on reducing the costs of the geotechnical campaigns, defining low-cost survey strategies and lowering the cost of material and tools, provided this does not materially impact the quality of results.Relevance: TheinnovationisequallyrelevanttoallTurbineSizesandSiteTypes.Commercial readiness: About 60% of the benefit of this innovation is anticipated to beavailable for projects with FID in 2020, rising to almost 100% for projects with FID in 2025.Market share: MarketshareisanticipatedtobeabouthalfofprojectswithFIDin2020.Thisis anticipated to rise to about two-thirds of projects with FID in 2025 and four-fifths of projects with FID in 2030.
Introduction of advanced wind resource characterisation
Practice today: Wind resource characterisation for projects being installed today is often based ondatafromasinglemetmast,correlatedtooneormore‘virtual’datasources.Innovation: Thequalityandnumberof‘virtual’andremotedatasourceswillincrease,allowingfor greater understanding of the variation of wind speeds across a site and increased certainty. The ability to model wake effects will also increase. This means that wind farms can be designed with more sensitivity to local wind resource and inter-turbine effects, thereby increasing the energy yield. Installation and OMS solutions can also be better optimised with improvedcharacterisation of the conditions.Relevance: TheinnovationisequallyrelevanttoallTurbineSizesandbothSiteTypes.Commercial readiness: Onlyaround10%ofthebenefitofthisinnovationisanticipatedtobeavailable for projects with FID in 2020. By 2025, this will rise to about one third. Market share:Inthe2020market,lessthan5%ofprojectswillusethisinnovation.However,by2025 the share will be 50%, rising to 75% by 2030.
Introduction of reduced cable burial depth requirements
Practice today: There is concern across the industry that cable burial requirements are frequently arbitrary and do not fully reflect site conditions or the risk of cable damage. This issue has a significant effect on cable installation costs.Innovation: The cable burial depth requirement typically exceeds 1m because standard fishing equipment and anchors would not normally make disturbances beyond this depth.
KIC InnoEnergy · Renewable Energies29
With due consideration of soil conditions and the penetration risk of other sea bed uses, cable burial depth can safely be reduced. A cable buried shallower in clay, for example, can still be better protected than a cable buried deeper in sand; this is a reality often not taken into account in specifying cable burial depths to date.Relevance: TheinnovationisequallyrelevanttoallTurbineSizesandSiteTypes.Commercial readiness: About two-thirds of the benefit of this innovation is anticipated to be availableforprojectswithFIDin2020risingtoabout90%forprojectswithFIDin2025.Market share:Marketshareisanticipatedtobeabout25%ofprojectswithFIDin2020,50%forprojectswithFIDin2025andreachingaround60%by2030.
Introduction of floating meteorological stations
Practice today: Fixed meteorological stations are erected at a proposed wind farm site prior to FID to monitor meteorological and oceanographic conditions at the site, generally with conventional anemometry and light detecting and ranging (LiDAR) units. These LiDARunitshave been favourably compared, in terms of cost and accuracy, with meteorological masts whensituatedonfixedoffshoreplatforms.FloatingLiDARsystemshavestartedtobedeployedinitially to verify their performance rather than to replace existing measurement methods.Innovation:TheintroductionoffloatingLiDARunitsforwindresourcedatacollectioninsteadofafixedmeteorologicalstationreduceswindfarmdevelopmentCAPEXandcanincreasetheperiod of collection before FID. The use of floating meteorological stations is not anticipated to increase the certainty of wind resource estimates for a few years but, eventually, benefits in this regard will be seen. Benefits also come from the ability to measure relatively cheaply above hub height and in multiple locations for short campaigns. Another scenario anticipated by some developers is to use floating meteorological stations in conjunction with a fixed meteorological masttomaximiseconfidenceinthewindresource,evenifthisresultsinincreasedCAPEX.Relevance: The innovation is more relevant to wind farms in deeper water and further from shore where fixed meteorological station and related installation costs are higher.Commercial readiness: About 50% of the benefit of this innovation will be available for projects with FID in 2020, rising to about 70% for projects with FID in 2025. Market share: MarketshareisanticipatedtobeaboutathirdofprojectswithFIDin2020.Thisis anticipated to double for projects with FID in 2025 and increase a little more to 2030.
30
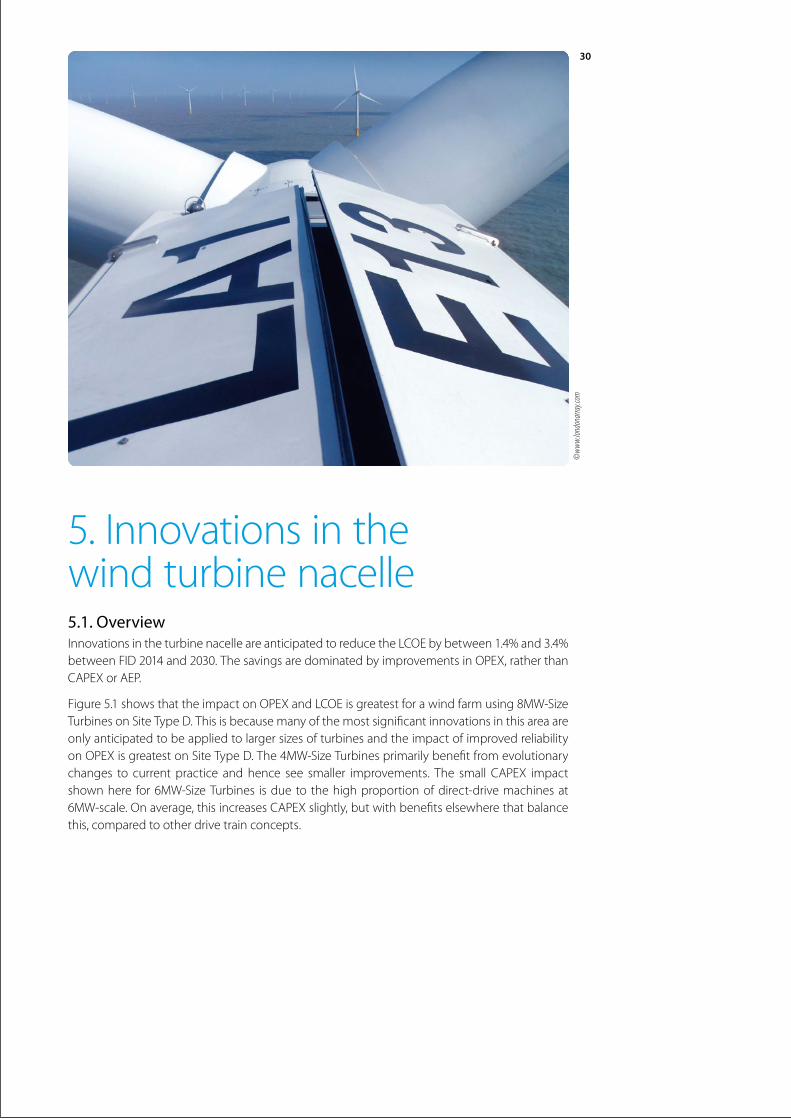
5. Innovations in the wind turbine nacelle5.1. OverviewInnovationsintheturbinenacelleareanticipatedtoreducetheLCOEbybetween1.4%and3.4%betweenFID2014and2030.ThesavingsaredominatedbyimprovementsinOPEX,ratherthanCAPEXorAEP.
Figure5.1showsthattheimpactonOPEXandLCOEisgreatestforawindfarmusing8MW-SizeTurbinesonSiteTypeD.Thisisbecausemanyofthemostsignificantinnovationsinthisareaareonly anticipated to be applied to larger sizes of turbines and the impact of improved reliability onOPEXisgreatestonSiteTypeD.The4MW-SizeTurbinesprimarilybenefitfromevolutionarychanges to current practice andhence see smaller improvements. The small CAPEX impactshownhere for6MW-SizeTurbines isdue to thehighproportionofdirect-drivemachinesat6MW-scale.Onaverage,thisincreasesCAPEXslightly,butwithbenefitselsewherethatbalancethis, compared to other drive train concepts.
©ww
w.lon
dona
rray.c
om
KIC InnoEnergy · Renewable Energies31
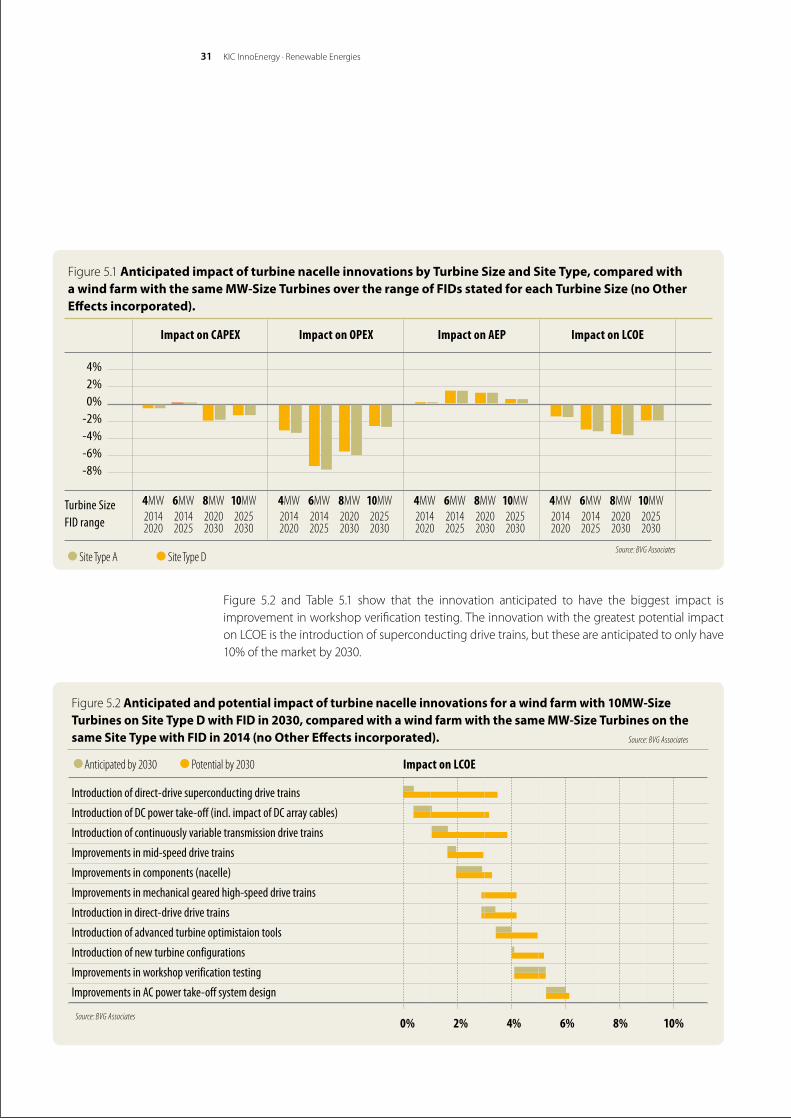
Figure 5.2 and Table 5.1 show that the innovation anticipated to have the biggest impact is improvement in workshop verification testing. The innovation with the greatest potential impact onLCOEistheintroductionofsuperconductingdrivetrains,buttheseareanticipatedtoonlyhave10% of the market by 2030.
Figure 5.1 Anticipated impact of turbine nacelle innovations by Turbine Size and Site Type, compared with a wind farm with the same MW-Size Turbines over the range of FIDs stated for each Turbine Size (no Other Effects incorporated).
4% 2% 0% -2% -4% -6% -8%
Turbine Size FID range
Impact on CAPEX Impact on OPEX Impact on AEP Impact on LCOE
•Site Type A •Site Type D
4MW20142020
6MW20142025
8MW20202030
10MW20252030
4MW20142020
6MW20142025
8MW20202030
10MW20252030
4MW20142020
6MW20142025
8MW20202030
10MW20252030
4MW20142020
6MW20142025
8MW20202030
10MW20252030
Figure 5.2 Anticipated and potential impact of turbine nacelle innovations for a wind farm with 10MW-Size Turbines on Site Type D with FID in 2030, compared with a wind farm with the same MW-Size Turbines on the same Site Type with FID in 2014 (no Other Effects incorporated).
Introduction of direct-drive superconducting drive trains
Introduction of DC power take-off (incl. impact of DC array cables)
Introduction of continuously variable transmission drive trains
Improvements in mid-speed drive trains
Improvements in components (nacelle)
Improvements in mechanical geared high-speed drive trains
Introduction in direct-drive drive trains
Introduction of advanced turbine optimistaion tools
Introduction of new turbine configurations
Improvements in workshop verification testing
Improvements in AC power take-off system design
Impact on LCOE
0% 2% 4% 6% 8% 10%
•Anticipated by 2030 •Potential by 2030
Source: BVG Associates
Source: BVG Associates
Source: BVG Associates
Future renewable energy costs: offshore wind 32
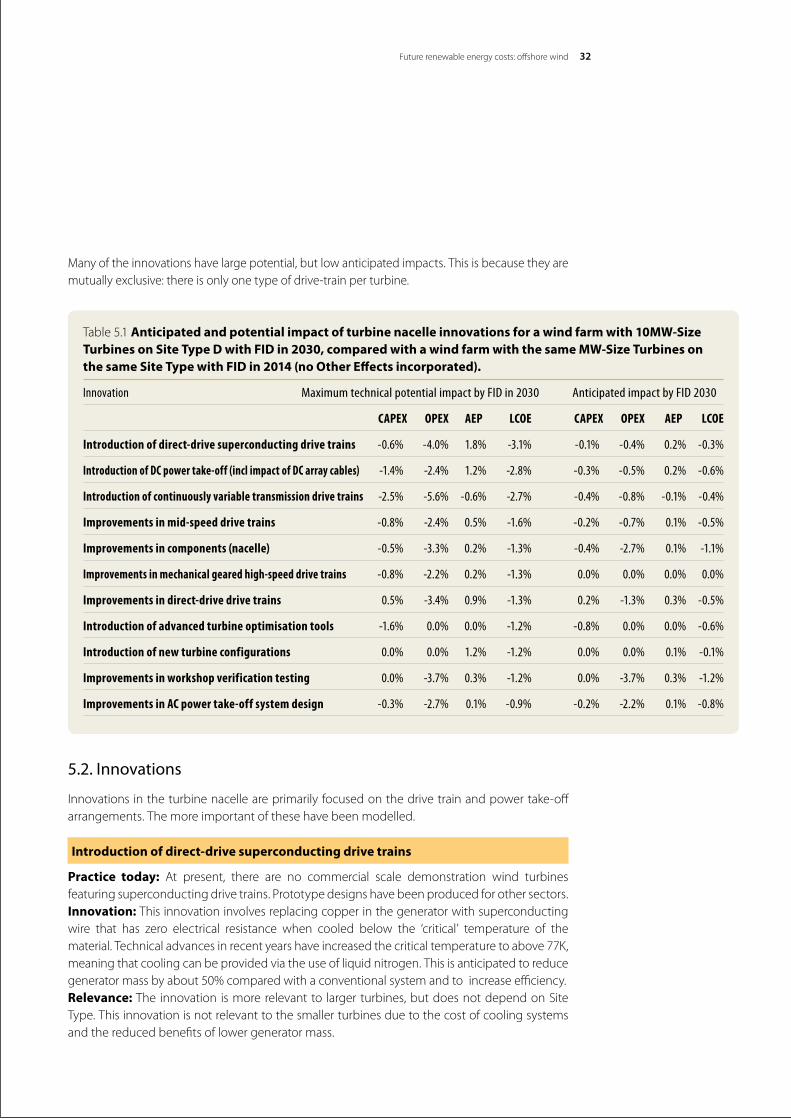
Manyoftheinnovationshavelargepotential,butlowanticipatedimpacts.Thisisbecausetheyaremutually exclusive: there is only one type of drive-train per turbine.
5.2. Innovations
Innovations in the turbine nacelle are primarily focused on the drive train and power take-off arrangements. The more important of these have been modelled.
Introduction of direct-drive superconducting drive trains
Practice today: At present, there are no commercial scale demonstration wind turbines featuringsuperconductingdrivetrains.Prototypedesignshavebeenproducedforothersectors.Innovation: This innovation involves replacing copper in the generator with superconducting wire that has zero electrical resistance when cooled below the ‘critical’ temperature of thematerial. Technical advances in recent years have increased the critical temperature to above 77K, meaning that cooling can be provided via the use of liquid nitrogen. This is anticipated to reduce generator mass by about 50% compared with a conventional system and to increase efficiency.Relevance: The innovation ismorerelevantto largerturbines,butdoesnotdependonSiteType. This innovation is not relevant to the smaller turbines due to the cost of cooling systems and the reduced benefits of lower generator mass.
Table 5.1 Anticipated and potential impact of turbine nacelle innovations for a wind farm with 10MW-Size Turbines on Site Type D with FID in 2030, compared with a wind farm with the same MW-Size Turbines on the same Site Type with FID in 2014 (no Other Effects incorporated).
Innovation Maximum technical potential impact by FID in 2030 Anticipated impact by FID 2030
CAPEX OPEX AEP LCOE CAPEX OPEX AEP LCOE
Introduction of direct-drive superconducting drive trains -0.6% -4.0% 1.8% -3.1% -0.1% -0.4% 0.2% -0.3%
Introduction of DC power take-off (incl impact of DC array cables) -1.4% -2.4% 1.2% -2.8% -0.3% -0.5% 0.2% -0.6%
Introduction of continuously variable transmission drive trains -2.5% -5.6% -0.6% -2.7% -0.4% -0.8% -0.1% -0.4%
Improvements in mid-speed drive trains -0.8% -2.4% 0.5% -1.6% -0.2% -0.7% 0.1% -0.5%
Improvements in components (nacelle) -0.5% -3.3% 0.2% -1.3% -0.4% -2.7% 0.1% -1.1%
Improvements in mechanical geared high-speed drive trains -0.8% -2.2% 0.2% -1.3% 0.0% 0.0% 0.0% 0.0%
Improvements in direct-drive drive trains 0.5% -3.4% 0.9% -1.3% 0.2% -1.3% 0.3% -0.5%
Introduction of advanced turbine optimisation tools -1.6% 0.0% 0.0% -1.2% -0.8% 0.0% 0.0% -0.6%
Introduction of new turbine configurations 0.0% 0.0% 1.2% -1.2% 0.0% 0.0% 0.1% -0.1%
Improvements in workshop verification testing 0.0% -3.7% 0.3% -1.2% 0.0% -3.7% 0.3% -1.2%
Improvements in AC power take-off system design -0.3% -2.7% 0.1% -0.9% -0.2% -2.2% 0.1% -0.8%
33
Commercial readiness: High temperature superconducting (HTS) wire is currentlymanufacturedinsmallquantitiesalthoughsecondgenerationHTSwireproducershavebeenscaling up production. Due to the immaturity of this innovation, it is anticipated that commercial readiness will remain low for projects with FID in 2020 but that most of the benefit will be available for projects reaching FID in 2025.Market share: A move to superconductivity is a large technical leap which brings supply chain challenges. It is anticipated that this innovation will only begin to be implemented on a small proportionofprojectsby theendof theperiodof interest,with10%of10MW-SizeTurbineshaving direct-drive superconducting drive-trains by FID 2030.
Introduction of DC power take-off
Practice today: Currentpractice is toconvertvariable frequencyalternatingcurrent (AC) todirectcurrent(DC)thenbacktoACat50Hzforcollectionthroughthesitearraycabling.Innovation:Inthisinnovation,thesecondhalfofthepowerconverterthatconvertsbacktoACisremoved.MovingtoDCcollectionreducesthenumberofarraycablecoresfromthreetotwoandmaterialby20-30%whichresultsinsavingsonarrayelectricalCAPEX.IncreasedreliabilitydrivesareductionofunplannedserviceOPEXandlossesarereduced.Relevance: TheinnovationisequallyrelevanttoallTurbineSizes.ProjectsonSiteTypeAwillonlyrealise90%ofthemaximumpotentialbenefitbecausethesedonotalsousehighvoltagedirectcurrent(HVDC)transmission.Commercial readiness: About two-thirds of the benefit of this innovation is anticipated to be available to sites reaching FID in 2020 rising to about three-quarters for sites reaching FID in 2025.Market share: DCtake-offisnotanticipatedtohavesignificantmarketimpactonprojectswithFID in 2020, but it is anticipated to have about a 10% market share for projects with FID in 2025, rising to 20% by FID in 2030.
Introduction of continuously variable transmission drive trains
Practice today: At present, there are no commercially available wind turbines featuring continuouslyvariabletransmissiondrivetrains.MHIVestasownstwoprototypesthedesignofwhichwasdevelopedbyMHIbeforethejointventurewasformed.Innovation: A hydraulic or mechanical device provides a variable ratio of input to output speed between the rotor and a synchronous generator. The need for a power converter is removed as compliance and generator speed control is provided by the variable transmission device. A reductioningrossAEPduetodriveinefficiencyisanticipatedtobeoffsetbyadecreaseinturbineCAPEXandimprovedreliability,resultinginareducedunplannedOPEXandavailabilitylosses. Relevance: TheinnovationisequallyrelevanttoallTurbineSizesandSiteTypes.Commercial readiness: Given the current state of development, it is anticipated that about half of the benefit of this innovation will be technically available for projects with FID in 2020 increasing to about three quarters for projects with FID in 2025.Market share: It is anticipated that this innovation will be implemented on 10% of projects using10MW-SizeTurbineswithFID in2025, risingto15%by2030,with10%ofthe8MW-SizeTurbines in use in 2030 having such drive-trains It is not anticipated that this innovation will be implemented on the smaller turbines. If this innovation is prioritised by manufacturers, the innovation will be more widely adopted than stated here, but it is also possible that the market share will be 0%. This is because the way of assessing market share is probabilistic.
KICInnoEnergy·RenewableEnergies
Future renewable energy costs: offshore wind 34
Improvements in mid-speed drive trains
Practice today: In2014,therewererelativelyfewturbinesfeaturingamid-speeddrive-train.In2016,the8MW-SizeTurbinesfromAdwenandMHIVestasfeatureamid-speeddrivetrainwitharelatively close-coupled generator. Innovation: Removal of the high-speed stage in the gearbox reduces the gearbox size and mechanical losses. These benefits are somewhat offset by the increased size and inefficiencies associated with the move to a multipole generator. The generator and gearbox become more similar in size and may be close-coupled with a potential improvement in reliability, although some argue that part of this increase will be offset by the reliability of the morecomplexmultipolegenerator.IncreasesinreliabilityofferanimprovementtoOPEXandAEP.Relevance:TheinnovationisequallyrelevanttoallTurbineSizesandbothSiteTypes.Commercial readiness: As first generation designs are already in production, it is anticipated that most of the benefit will be technically available for projects with FID in 2020 and almost all for projects with FID in 2025.Market share: Itisanticipatedthataroundhalfofprojectsusing8MW-SizeTurbinesandasmallproportionofprojectsusing6MW-SizeTurbinesthatreachFIDin2020willusethisinnovationand that this will remain the case for projects with FID in 2025. By FID 2030, the market share will bejustunderhalffor8MW-SizeTurbinesandathirdfor10MW-SizeTurbines.
Improvements in components (nacelle)
Practice today: Manycomponentswithintheturbinenacelleusetechnologiesdevelopedinarange of other industries, which are in some cases adapted for use in offshore wind.Innovation: Component-levelprogressinindustriessuchasheavyautomotive,marinetransport,aerospace and industrial machines will continue to be applied in the offshore wind industry. Examplesareasincludemetallurgy(scienceofmetals),tribology(thescienceofmovingsurfaces).Such innovations aregenerally evolutionary (resulting in small stepsof improvement andareincorporated into new components almost as a matter of course. They are not seen as a wind industry innovation. The benefits are seen in increased reliability through decreasing unplanned maintenance costs and downtime losses. It is recognised that it is hard to define and quantify the impact of innovations in this area, but for completeness, an estimate has been made.Relevance: ThistypeofinnovationappliesequallytoallTurbineSizesandSiteTypes.Commercial readiness:Onlyaround10%ofthebenefitofthisinnovationisavailabletositesreachingFIDin2020.Thisrisesto60%byFIDin2025.Market share: Themarketsharefor4MW-SizeTurbinesin2020isaroundathird,risingtooverthree-quarters for turbines with FID in 2030.
Improvements in mechanical geared high-speed drive trains
Practice today: Generally, the wind turbine manufacturer specifies gearbox loading to the supplier after limited whole drive train modelling. The gearbox, when designed, is tested under torque loads only by the supplier, rather than on a whole nacelle test rig under dynamic loads.Innovation: Improvements through more holistic drive train design and developments in bearing design, manufacture and lubrication have the potential to decrease operational costsby reducingunplanned service events. Similarly, ongoing improvements in thedesignof gearboxes to further optimise gear mesh loadings, accommodate higher rated but slower rotatingmachines,andreducerelativegearboxmasswillenableareduction inCAPEXandadecreaseinunplannedserviceOPEX.
KIC InnoEnergy · Renewable Energies35
Innovation in this field has been continuous since the start of the wind turbine industry and impact is anticipated to continue at a gradually decreasing pace, partly dependent on the number of suppliers that stay with the technology for both offshore and onshore applications.Relevance: TheinnovationisequallyrelevanttoallTurbineSizesandbothSiteTypes.Commercial readiness: Around two-thirds of the benefit of this innovation will be available for projects with FID in 2020, rising to three-quarters by 2025. Market share: Market share is anticipated to be almost 100% for projects with 4MW-SizeTurbineswithFIDin2020.For6MW-SizeTurbines,thisdropsto10%.By2025,themarketshareis less than 10% and by 2030, the market share is almost negligible as other drive types come into the market.
Improvements in direct-drive drive trains
Practice today: GEandSiemenshaveadopteddirect-drivedrivetrainsforoffshoreturbines.Full-scale test machines are currently operational at a number of European sites with full-scale commercial deployment commencing. This drive train design has also been applied to 4MW-SizeTurbinesincommercialonshorewindfarms.Innovation: Removal of the gearbox results in a simpler drive train with fewer mechanical parts and an anticipated increase in reliability, although some argue that part of this increase will be offset by the reliability of the more complex multipole generator. It is anticipated that a slight increaseinCAPEXwillbemorethanoffsetbytheanticipatedreductioninunplannedserviceOPEXandlosses.Relevance: TheinnovationisequallyrelevanttoallTurbineSizesandSiteTypes.Commercial readiness: As first generation designs are already in production, it is anticipated that most of the benefit will be technically available for projects with FID in 2020 and almost all of the benefit will be available for projects with FID in 2025.Market share: Itisanticipatedthatlessthan5%ofwindfarmsusing4MW-SizeTurbinesandreachingFIDin2020willusethissolution.For6MW-SizeTurbines,themarketsizeisanticipatedtobeabove80%,and50%for8MW-SizeTurbinesbyFID2025duetocompetitionfromotheroptions.ByFID2030,itisanticipatedthataround40%ofthewindfarmswithboth8MW-and10MW-SizeTurbineswillusethissolution.
Introduction of advanced turbine optimisation
Practice today: Current turbines have been designed with good optimisation of eachcomponent, but a varying amount of optimisation between different components and little optimisationoftheturbinesystemasawhole.Muchofthecomponentoptimisationisbasedon experience at smaller-scale.Innovation: As the industry improves its dynamic aeroelastic and hydrodynamic modelling tools and improves the correlation between predicted and measured behaviour, there is an increasing opportunity to optimise the whole system through changes in the sub-systems. This requires further use of analytical software and optimisation tools that are being used also in other sectors. Inaddition,aslargercomponentsarerequired,thereismoreopportunity(andmotivation)forre-thinking the design of some components, enabling optimisation to different local maxima.Relevance: TheinnovationappliesequallytoallTurbineSizesandSiteTypes.Commercial readiness: The benefit of this innovation only begins to be available by FID in 2025, with nearly two-thirds of the benefit available by this point.
Future renewable energy costs: offshore wind 36
Market share: It is anticipated that for FID in 2030 around half of the market will use this innovation, with usage dominated by new turbine platforms that have the opportunity to use such optimisation tools.
Introduction of new turbine configurations
Practice today: Current commercially produced offshore wind turbines are three-bladed,horizontal-axis, pitch-regulated and upwind, mounted on a tubular tower and with yaw system designed to keep the turbine facing the wind during operation. Innovation: Someofthelimitationsfordesignofonshorewindturbinesdonotapplyoffshore;andoffshore,thecosts(andhencethedesigndrivers)aredifferent.Thusawiderrangeofturbineconfigurations isavailable.Longer-term, therearepossibilities to implement2-bladed,down-wind, multi-rotor turbine or vertical-axis solutions. Examples of innovation in this area include those from 2B-Energy (2-bladed, downwind, lattice tower), Hitachi (downwind), Nenuphar(verticalaxis),SeawindOceanTechnology(2-bladed,activeyaw-controltoregulatepowerbyyawingoutofthewind),Vestas(multi-rotor).SuchinnovationsgenerallytendtoimproveAEPwithoutsignificantlyincreasingCAPEXandOPEX,thoughsometendtoimpactLCOEthroughreductions in costs. Relevance: TheseinnovationsapplyequallytoallTurbineSizesandSiteTypes.Commercial readiness: The benefits only begin to be available for FID in 2025, with around 40%ofthebenefitavailablebythispoint.Market share: It is anticipated that around 10% of the market will use this innovation for FID in 2030, with none of the market using the innovation before this.
Improvements in workshop verification testing
Practice today: Workshop verification testing, which is the verification and approval of turbines or turbine components in laboratory conditions rather than in field trials, has occurred for turbines used on projects reaching FID today, but it is not standardised and has been limited in scopeandintheabilitytosimulateaccurateloadingregimes.Newer,largerandmoredynamicrigs are being commissioned but standards are still absent.Innovation: The development of standardised functional and highly accelerated life tests (HALTs)forcomponentsandsystemsuptocompletedrivetrainsiswidelyviewedbyindustryas a route to deliver increased reliability, especially when combined with monitoring turbines under deployment.Relevance: Theinnovation isequallyrelevanttoallTurbineSizes.SitesclosetoshoreandinshallowwaterwillbenefitlessthanharshersitesduetotheincreasedOPEXforharsher sites.Commercial readiness: Three-quarters of the benefit of this innovation is anticipated to be available for projects with FID in 2020, with almost all available for projects with FID in 2025.Market share: Because the types of drive used for the larger turbines will be developed later, it is anticipated that this innovation will have a larger share for larger turbines for which manufacturerswillhaveseengreaterbenefitsfromworkshoptesting.Fora4MW-SizeTurbinewithFIDin2014,theshareisaroundathird,risingtoovertwo-thirdsforan8MW-SizeTurbine.This market share increases somewhat for FID in 2025. By FID in 2030, the innovation is used for almostallTurbineSizes.
KIC InnoEnergy · Renewable Energies37
Improvements in AC power take-off system design
Practice today: Converters currently in use rely primarily on silicon components and havelimitedprognosticanddiagnosticcapability.Powerelectronicsareacommoncauseofturbinefailure although wind turbine manufacturers and tier 1 suppliers are continually improving designs.Innovation: Improvements include the use of advanced materials such as silicon carbide or diamond to achieve greater reliability of smaller, more efficient and faster switching power conditioning units with greater health monitoring capabilities. Also included are modularisation and redundancy strategies to limit downtime and improve maintainability. This trend is anticipatedtocontinueandtodeliver reductions in turbineCAPEX,unplannedserviceOPEXand losses. Relevance:TheinnovationisequallyrelevanttoallTurbineSizesandSiteTypes.Commercial readiness: Two-thirds of the benefits of this innovation are anticipated to be available to projects reaching FID in 2020 and almost all of the benefits are anticipated to be available for projects with FID in 2025.Market share: It is anticipated that this innovation will be implemented on about half of 4MW-SizeTurbineswithFIDin2020,risingto80%for8MW-SizeTurbines,ThisincreasesforFIDin2025.ByFIDin2030,allthewindfarmsusingACpowertake-offwillusethisinnovation,butasDCpowertake-offbecomesmorecommon,thiswilllimitthemarketshareofimprovementsinACpowertake-offsystemdesignto80%forboth8MW-and10MW-SizeTurbines.
38
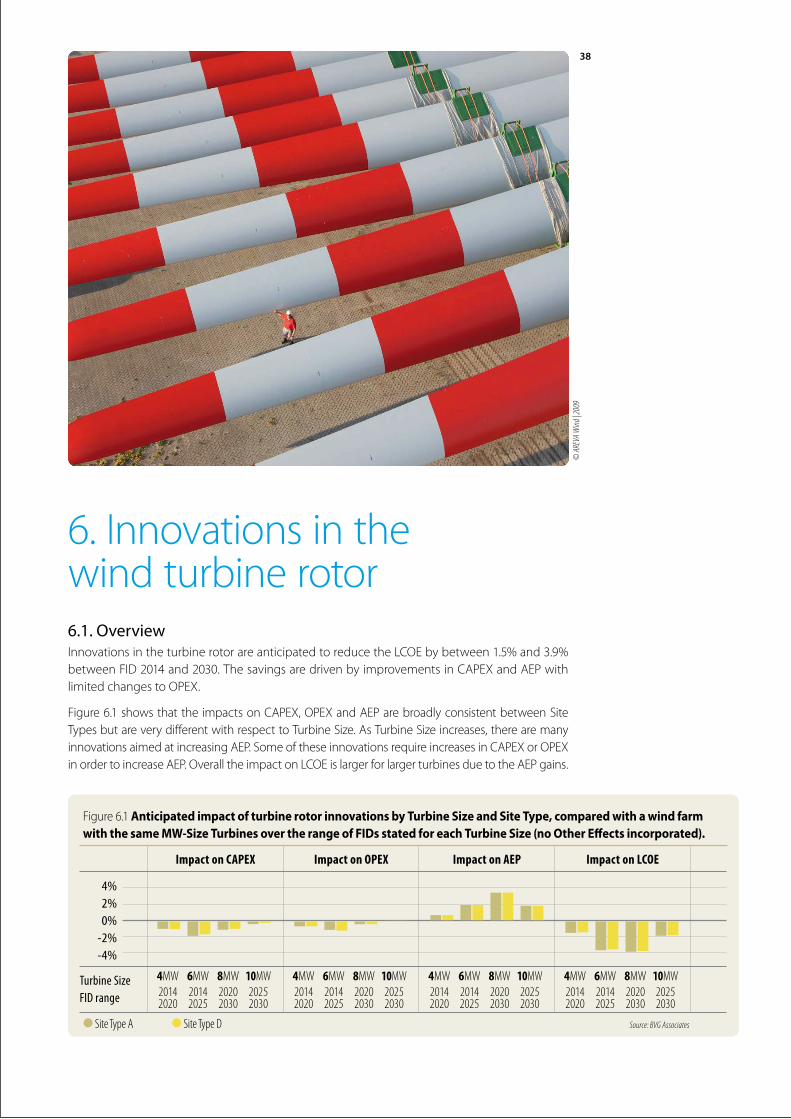
6.Innovationsinthe wind turbine rotor6.1. OverviewInnovationsintheturbinerotorareanticipatedtoreducetheLCOEbybetween1.5%and3.9%betweenFID2014and2030.ThesavingsaredrivenbyimprovementsinCAPEXandAEPwithlimitedchangestoOPEX.
Figure6.1showsthatthe impactsonCAPEX,OPEXandAEParebroadlyconsistentbetweenSiteTypesbutareverydifferentwithrespecttoTurbineSize.AsTurbineSizeincreases,therearemanyinnovationsaimedatincreasingAEP.SomeoftheseinnovationsrequireincreasesinCAPEXorOPEXinordertoincreaseAEP.OveralltheimpactonLCOEislargerforlargerturbinesduetotheAEPgains.
© A
REVA
Wind
| 200
9
Figure 6.1 Anticipated impact of turbine rotor innovations by Turbine Size and Site Type, compared with a wind farm with the same MW-Size Turbines over the range of FIDs stated for each Turbine Size (no Other Effects incorporated).
4%
2% 0% -2% -4%
Turbine Size FID range
Impact on CAPEX Impact on OPEX Impact on AEP Impact on LCOE
•Site Type A •Site Type D
4MW20142020
6MW20142025
8MW20202030
10MW20252030
4MW20142020
6MW20142025
8MW20202030
10MW20252030
4MW20142020
6MW20142025
8MW20202030
10MW20252030
4MW20142020
6MW20142025
8MW20202030
10MW20252030
Source: BVG Associates
KIC InnoEnergy · Renewable Energies39
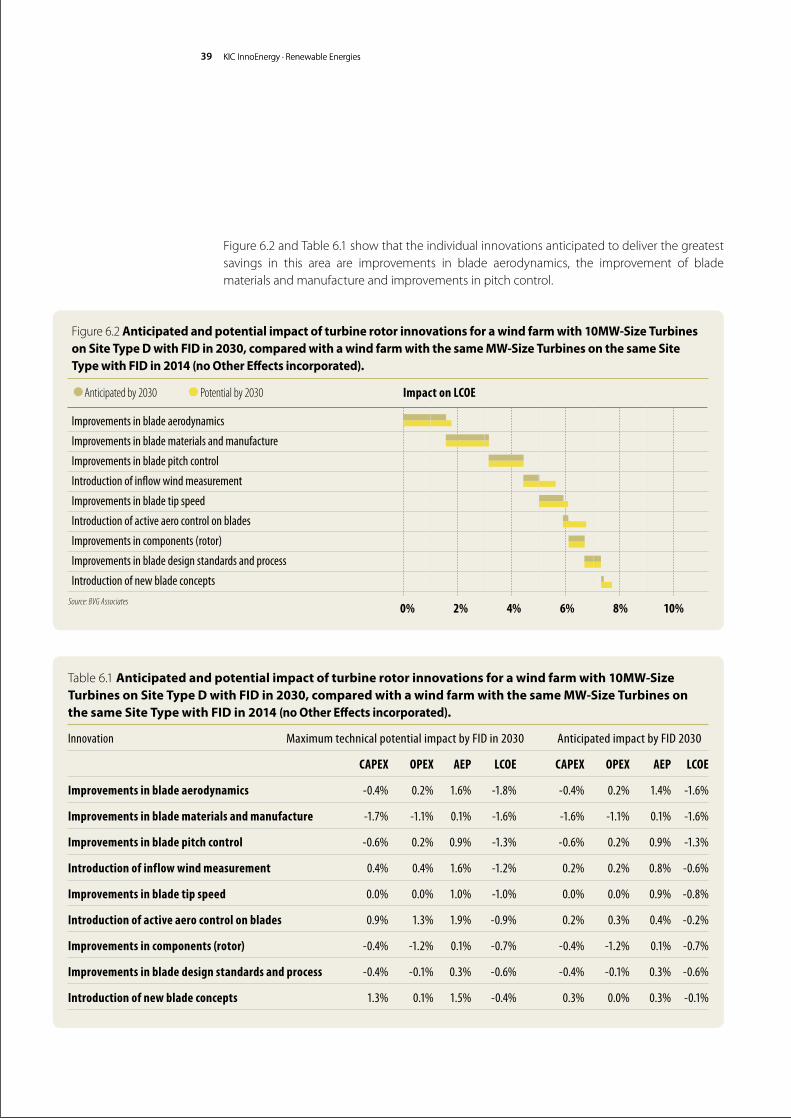
Figure6.2andTable6.1showthattheindividualinnovationsanticipatedtodeliverthegreatestsavings in this area are improvements in blade aerodynamics, the improvement of blade materials and manufacture and improvements in pitch control.
KICInnoEnergy·RenewableEnergies
Table6.1Anticipated and potential impact of turbine rotor innovations for a wind farm with 10MW-Size Turbines on Site Type D with FID in 2030, compared with a wind farm with the same MW-Size Turbines on the same Site Type with FID in 2014 (no Other Effects incorporated).
Innovation Maximum technical potential impact by FID in 2030 Anticipated impact by FID 2030
CAPEX OPEX AEP LCOE CAPEX OPEX AEP LCOE
Improvements in blade aerodynamics -0.4% 0.2% 1.6% -1.8% -0.4% 0.2% 1.4% -1.6%
Improvements in blade materials and manufacture -1.7% -1.1% 0.1% -1.6% -1.6% -1.1% 0.1% -1.6%
Improvements in blade pitch control -0.6% 0.2% 0.9% -1.3% -0.6% 0.2% 0.9% -1.3%
Introduction of inflow wind measurement 0.4% 0.4% 1.6% -1.2% 0.2% 0.2% 0.8% -0.6%
Improvements in blade tip speed 0.0% 0.0% 1.0% -1.0% 0.0% 0.0% 0.9% -0.8%
Introduction of active aero control on blades 0.9% 1.3% 1.9% -0.9% 0.2% 0.3% 0.4% -0.2%
Improvements in components (rotor) -0.4% -1.2% 0.1% -0.7% -0.4% -1.2% 0.1% -0.7%
Improvements in blade design standards and process -0.4% -0.1% 0.3% -0.6% -0.4% -0.1% 0.3% -0.6%
Introduction of new blade concepts 1.3% 0.1% 1.5% -0.4% 0.3% 0.0% 0.3% -0.1%
Figure6.2 Anticipated and potential impact of turbine rotor innovations for a wind farm with 10MW-Size Turbines on Site Type D with FID in 2030, compared with a wind farm with the same MW-Size Turbines on the same Site Type with FID in 2014 (no Other Effects incorporated).
Improvements in blade aerodynamics
Improvements in blade materials and manufacture
Improvements in blade pitch control
Introduction of inflow wind measurement
Improvements in blade tip speed
Introduction of active aero control on blades
Improvements in components (rotor)
Improvements in blade design standards and process
Introduction of new blade concepts
Impact on LCOE
Source: BVG Associates 0% 2% 4% 6% 8% 10%
•Anticipated by 2030 •Potential by 2030
Future renewable energy costs: offshore wind 40
6.2. InnovationsInnovations in turbine rotors encompass a range of improvements around the design and manufacture of blades and the algorithms and systems which control the blades in operation. The more important of these have been modelled here.
Improvements in blade aerodynamics
Practice today: Blademanufacturersusecuttingedgecomputational fluiddynamics (CFD)modelling and wind tunnel testing to improve design. Passive aerodynamic elements (forexample,trailingedgeflowmodifiers)arebeingdevelopedandoptimised.Innovation: This innovation includes a range of possibilities from evolutionary developments and fine-tuning of existing designs through to more radical changes such as new aerofoil concepts and the passive aerodynamic enhancements, such as those now being offered by Siemens.Overall, an increase in gross AEP ismodelled alongside a small increase in turbineCAPEX,reflectingadditionalcostsinthemanufactureoftherotorandadditionalOPEXtocarefor passive blade modifications. Reduced support structure costs will result from lower thrust fatigue loading.Relevance:TheinnovationisequallyrelevanttoallTurbineSizesandSiteTypes.Commercial readiness: This innovation will develop more slowly than most others in this area with around 50% of the benefits available for projects reaching FID in 2020 and rising to around 80%byFIDin2025.Therehasalreadybeenastronghistoryofinnovationinbladeaerodynamicsand it is anticipated that the pace of progress will gradually slow.Market share: Marketshareisanticipatedtobegreaterfor largerturbines.Lessthan20%ofprojectsusing4MW-SizeTurbinesreachingFIDin2020willusethisinnovation.ByFIDin2025,aroundathirdof6MW-SizeTurbineswillfeaturethis,risingtoslightlybelowtwo-thirdsof8MW-SizeTurbinesandslightlyabovetwo-thirdsof10MW-SizeTurbines.ByFIDin2030,around80%of the market will use this innovation.
Improvements in blade materials and manufacture
Practice today: Mostoffshorewindturbinebladesuseglassfibreasthemainstructuralmaterial,alongwithepoxy-basedresinsandadhesives.Carbonfibreisusedbysometodecreasemassand increasestiffness,butatextramaterialcost.Manufactureofbladesgenerally involves a significant element of resin-infusion moulding, with structural elements either built into the shell of the blade or into a spar, bonded to the aerodynamic shells. Innovation: Many novel materials and manufacturing processes are in development toproduce stiffer, lighter, lower cost and higher quality blades with improved radar, lightning, environmental resistance and aerodynamic performance. In some cases, aerospace innovations are now starting to be incorporated. There is greater potential for the use of such aerospace techniques. This innovation includes those processes that enable lighter and longer blades to be manufactured.Relevance:TheinnovationisequallyrelevanttoallTurbineSizesandSiteTypes.Commercial readiness:Someaspectsofthisinnovationmaybeavailablerelativelyquickly;othersareatanearlystageandmayrequiremoredevelopmentandcommercialisation.Overall,around two-thirds of the benefits are anticipated to be available for projects reaching FID in 2020 with further gains by FID in 2025.
KIC InnoEnergy · Renewable Energies41
Market share: The market share is anticipated to be larger for projects using larger turbines. For4MW-SizeTurbineswithFIDin2020,itisanticipatedtobearoundathird,risingtoahalffor6MW-SizeTurbines.ForFIDin2025,themarketsharefor6MW-SizeTurbinesisexpectedtobearoundtwo-thirds.Thisrisestoaround90%for10MW-SizeTurbines.ByFIDin2030,over90%ofturbines use this innovation.
Improvements in blade pitch control
Practice today:Most commercial turbines use collective pitch control to control the rotorspeed and loads, with drive train torque controlled by the converter, although some use individualpitchcontroltoaddressaerodynamicimbalancesbetweenblades.Manufacturersarebeginning to develop more advanced algorithms to balance wake and turbulence loads on turbines to improve energy production. Innovation: Continuing improvements in both collective and individual pitch control, inboth routine and turbulent or wake affected operating conditions, have the potential to reduce lifetime turbine loads on some components by up to 30% as well as increasing energy production.Savings insupportstructureandturbineCAPEXareanticipatedbutareoffsettosome extent by increased duty cycles on the pitch system, which leads to an increase in turbine CAPEXandunplannedOPEX.GrossAEPisanticipatedtoincreaseduetoimprovedaerodynamicperformance. This innovation does not include wind farm wide control strategies. These are includedasanOMSinnovationinSection9.Relevance:TheinnovationisequallyrelevanttoallTurbineSizesandSiteTypes.Commercial readiness: Work is ongoing in this area, although some improvements are atarelativelyearlystage.Overall,two-thirdsofthebenefitsareanticipatedtobeavailablefor projects with FID in 2020 with almost all available for projects with FID in 2025.Market share: Forprojectsusing4MW-SizeTurbineswithFIDin2020marketshareisanticipatedtobeovertwo-thirds.ThisriseswithTurbineSizeandFID.For10MW-SizeTurbinesandforFIDin2030, this innovation will be universally adopted.
Introduction of inflow wind measurement
Practice today: Currentturbinedesignsuseanemometrymountedattherearofthenacelletoinferinflowwindconditions.Forward-lookingwindmeasurementdevices,typicallyLiDAR,arenow being trialled as a potential alternative with additional benefits.Innovation: Forward-looking LiDAR has the ability to characterise the inflow wind fieldmore completely and earlier than an anemometer downwind of the rotor. The best way to take advantage of the resulting reduced fatigue loading is to increase the diameter of the rotor, thereby increasing AEPwith onlymarginal changes in load andOPEX. It is critical todevelopLiDARunitssuitedtothisapplication,withhighreliabilityandrobustnesstodifferentenvironmentalconditions.Simultaneously,costsmustbereducedsignificantlycomparedwiththe units currently used for resource assessment where accurate measurement of absolute windspeedismoreimportant.TheanticipatedincreaseingrossAEPcomesatthecostofanincreaseinturbineCAPEXtoaccountforequipmentandintegrationcostsandanincreaseinunplannedOPEX.Relevance: TheinnovationisequallyrelevanttoallSiteTypes,butislessrelevantforsmallerTurbine Sizes, with 4MW-Size Turbines having around 70% of the benefits available as for10MW-SizeTurbines.
Future renewable energy costs: offshore wind 42
Commercial readiness: The relatively high upfront cost of LiDAR in comparison to ananemometer and the complexity of the necessary integrated control system mean that only a third of the technical potential of this innovation is anticipated to be available for projects reaching FID in 2020, but this is anticipated to double for projects with FID in 2025.Market share: This innovation is not anticipated to be deployed in large quantities on smaller turbinesorinlargescalesuntilreachingthe8MW-and10MW-SizeTurbinesforFIDin2025,whereabout a third of the market will use this innovation. By FID in 2030 market share is anticipated to reach about half.
Improvements in blade tip speed
Practice today:Thehighest tipspeedsare90m/s, limitedby fatigue loading,bladeerosionand uncertainty about slender blade aerodynamic performance. Typically, blade leading edge erosion is mitigated by the use of tape, which is applied after manufacture of the blade and then repaired at least twice during the life of the blade.Innovation:IncreasingtipspeedhasthepotentialtoincreaseAEPandreduceturbineCAPEX,although some of this benefit is anticipated to be offset by increases in the support structure CAPEX. Increased aerodynamic noise is less of an issue offshore than onshore, but erosionremains critical and work is underway to develop and test long-term robust solutions with less aerodynamic impact which, in some cases, are built into the blade during manufacture. Increasesintipspeedcanbelinkedtodecreasesinsolidity(bladeplanformarea)andchangesin aerofoil shape to reduce fatigue loads.Relevance:TheinnovationisequallyrelevanttoallTurbineSizesandSiteTypes.Commercial readiness: Around a third of the benefit will be available to projects with FID in 2020 and two-thirds by FID in 2025.Market share: Market share is anticipated to be below 20% for projects using 4MW-SizeTurbinesreachingFID in2020,with6MW-SizeTurbineshigher.Thismarketsharerisestoover50%forprojectsusing8MW-SizeTurbinesforFIDin2025,witharound80%ofthemarketusingthis innovation by FID in 2030.
Introduction of active aero control on blades
Practice today: Active control surfaces are commonly used in the aerospace industry. At present this approach is not yet used in the wind industry, although there has been an upturn in the use of passive aerodynamic enhancement devices. Innovation: This innovation encompasses many potential advances, including micro-actuated surfaces, air-jet boundary layer control, active flaps, trailing edge modifiers and plasma aerodynamic control effectors. The industry expects some to be commercialised but it is unclear which ones. Robustness and reliability of any solution in the tough environmental conditions experiencedbytheoutersectionsofbladesiscritical.UpliftingrossAEPisanticipated,combinedwithanincreaseinturbineCAPEXandunplannedservicecosttoaccountforincreasedfailurerates of these advanced control solutions. This reduced reliability is also reflected in a modelled increase in losses. This innovation does not include wind farm wide control strategies. These are includedasanOMSinnovationinSection9.Relevance:TheinnovationisequallyrelevanttoallTurbineSizesandSiteTypes.Commercial readiness: The limited interest currently shown by mainstream manufacturers and the relatively early stage in development mean that only around a third of the technical potential
KIC InnoEnergy · Renewable Energies43
of this innovation will be available for projects with FID in 2020. This will double by FID in 2025.Market share: Uptakeofthistechnologyisanticipatedtobeslow.MarketshareisanticipatedtobeverylowforprojectswithFIDin2020andtorisetoaround15%forFIDin2025for10MW-SizeTurbines.ByFIDin2030,onlyaround20%ofthemarketisanticipatedtousethisinnovation.
Improvements in components (rotor)
Practice today: Pitch systems and blade bearings are significant sources of downtime.Innovations that increase the load cycles on pitch systems risk compounding this problem. Designs have only evolved slowly over the last 10 years and hub castings have continued to be scaled upwards for larger turbines, which can create problems in manufacture.Innovation: This innovation includes improved bearing concepts and lubrication, improved hydraulic and electric systems, improved backup energy sources for emergency response and grid fault ride-through. It also includes improved hub design through better design methods and improved material properties that are necessary for larger castings. Better design is anticipated to reduceturbineCAPEXandimprovereliability,reducingunplannedOPEXandincreasingavailability.Relevance:TheinnovationisequallyrelevanttoallTurbineSizesandSiteTypes.Commercial readiness: Two-thirds of the technical potential of these innovations will be available for projects with FID in 2020, with further gains by FID in 2025.Market share: This innovation is anticipated to have around three-quarters of the market for projectsusing4MW-SizeTurbinesreachingFIDin2020,withalittlemorefor6MW-SizeTurbines.Thereisthennochangefor6MW-SizeTurbineswithFIDin2025.Forprojectsusing8MW-SizeTurbines,themarketshareisanticipatedtobehigher,ataround90%,risinggraduallytobecomealmostuniversal.For10MW-SizeTurbines,almostallprojectswilluseimprovedhubassemblycomponents.
Improvements in blade design standards and process
Practice today: Blades and blade components are tested before use. The quality of this testing hasincreasedsince2014,butdesignisstillsuboptimal.Holisticmulti-objectivedesignprocessesbalance the aerodynamic and structural requirementsof blades andCFD is used to explorespecific effects.Innovation: Further progress via the use of more advanced tools and modelling techniques willcontinuetoimproveaerodynamicperformance, decreaseCAPEX(ofthebladesandalsothe rest of the turbine) or decrease OPEX (due to increased reliability). Progress in this areais anticipated to have a small impact on turbine CAPEX, a saving on OPEX associatedwithunplanned service and an associated reduction in losses due to blade related issues. A small increaseisalsoanticipatedingrossAEP.Relevance:TheinnovationisequallyrelevanttoallTurbineSizesandSiteTypes.Commercial readiness: Given the good progress already made by the industry, it is anticipated thataround90%ofthebenefitsofthisinnovationwillbeavailableforprojectswithFIDin2020,with almost 100% by FID in 2025.Market share: The market share is anticipated to be larger for projects using larger turbines. For4MW-SizeTurbineswithFID in2020themarketshare isanticipatedtobearounda third,risingtoahalffor6MW-SizeTurbines.ForFIDin2025,themarketsharefor6MW-SizeTurbinesisanticipatedtobearoundtwo-thirds.Thisrisestobeingalmostuniversalfor10MW-SizeTurbinesfor 2025 FID. By FID in 2030, almost all turbines use this innovation.
Future renewable energy costs: offshore wind 44
Introduction of new blade concepts
Practice today: Blades used in offshore wind today use either a central structural spar with an aerodynamic shells or aerodynamic shells with a structural spar caps and webs to connect the shells. Aerodynamic shells are moulded in one or two pieces and the whole blade is manufactured at a coastal site.Innovation: This innovation includes modular blades assembled from pre-manufactured components, including aerodynamic surfaces moulded in multiple pieces, or provided by textiles. The benefits include the ability to better control the quality of components, reduced manufacturing facility costs and increased design and supply flexibility. Together these offer reductionsinCAPEXandincreasesinAEP.Relevance:TheinnovationismorerelevanttolargerTurbineSizes,withSiteTypenothavingan effect.Commercial readiness:OverhalfoftheanticipatedbenefitisavailablebyFIDin2025.Market share: Around10%ofthe8MW-and10MW-SizeTurbineswithFIDin2025willusenewblade concepts. This rises to 20% by FID in 2030.
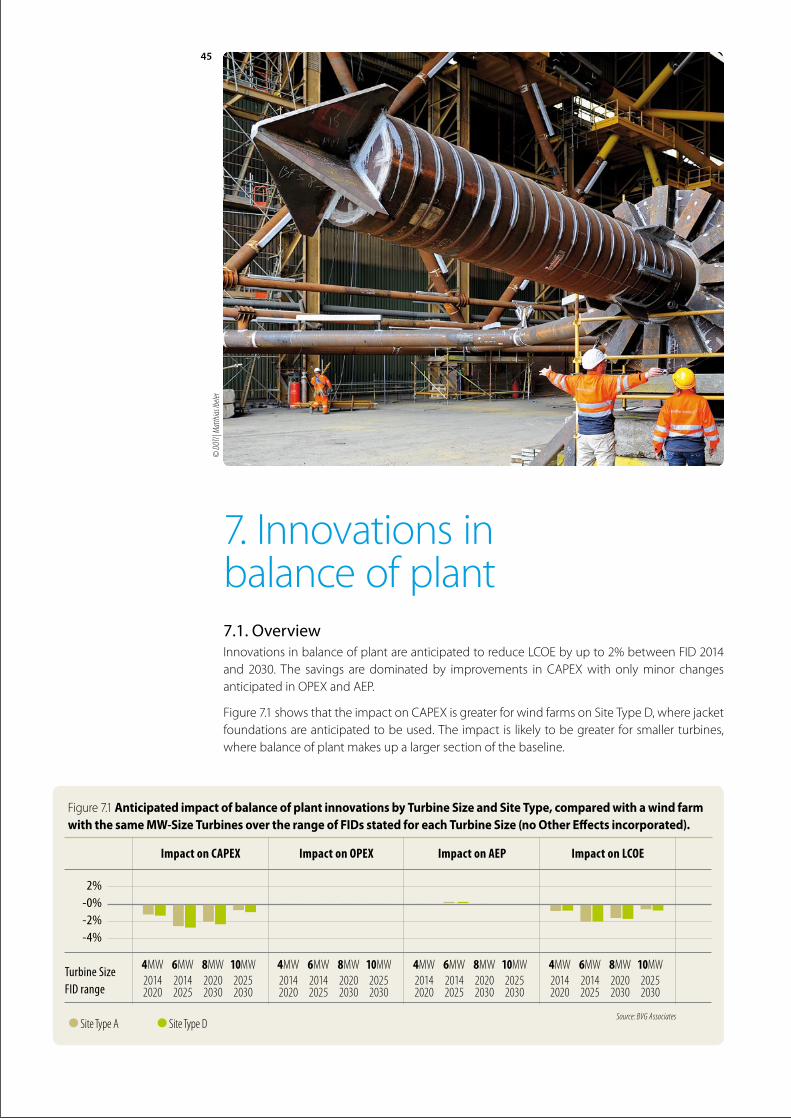
45
7. Innovations in balance of plant7.1. OverviewInnovationsinbalanceofplantareanticipatedtoreduceLCOEbyupto2%betweenFID2014and 2030. The savings are dominatedby improvements in CAPEXwith onlyminor changesanticipatedinOPEXandAEP.
Figure7.1showsthattheimpactonCAPEXisgreaterforwindfarmsonSiteTypeD,wherejacketfoundations are anticipated to be used. The impact is likely to be greater for smaller turbines, where balance of plant makes up a larger section of the baseline.
© D
OTI |
Mat
thias
Ibele
r
Figure 7.1 Anticipated impact of balance of plant innovations by Turbine Size and Site Type, compared with a wind farm with the same MW-Size Turbines over the range of FIDs stated for each Turbine Size (no Other Effects incorporated).
2% -0% -2% -4%
Turbine Size FID range
Impact on CAPEX Impact on OPEX Impact on AEP Impact on LCOE
•Site Type A •Site Type D
4MW20142020
6MW20142025
8MW20202030
10MW20252030
4MW20142020
6MW20142025
8MW20202030
10MW20252030
4MW20142020
6MW20142025
8MW20202030
10MW20252030
4MW20142020
6MW20142025
8MW20202030
10MW20252030
Source: BVG Associates
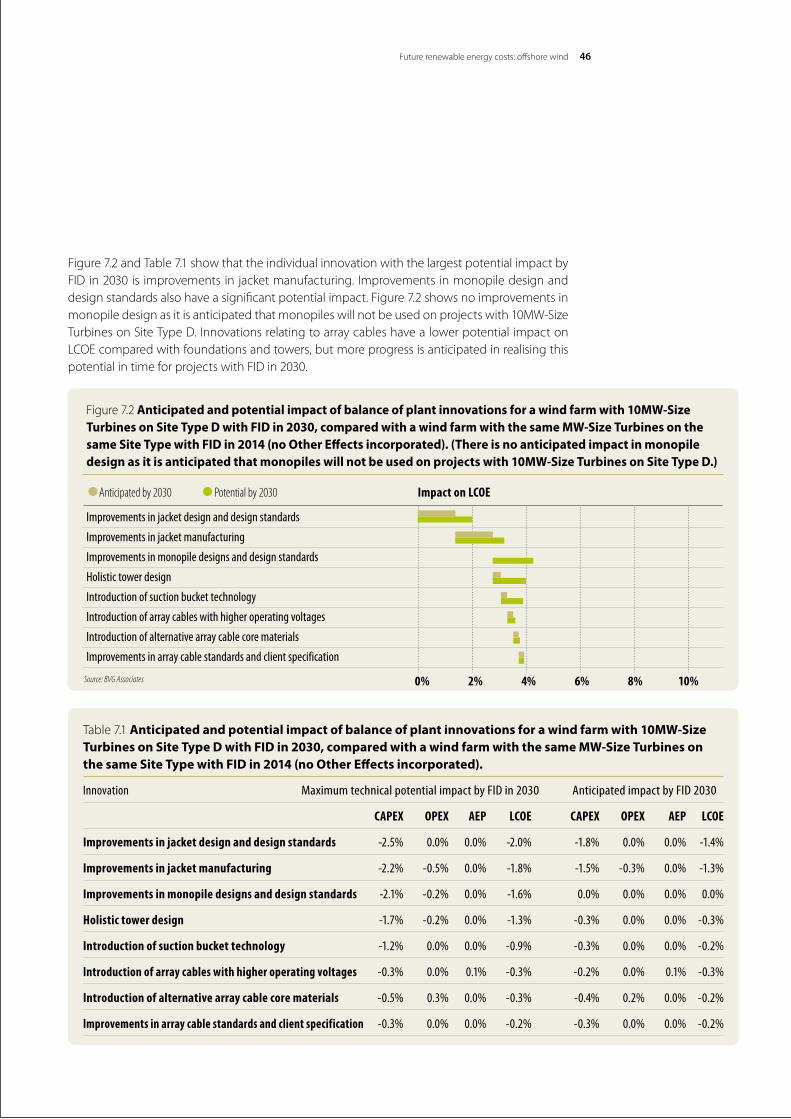
Future renewable energy costs: offshore wind 46
Figure 7.2 and Table 7.1 show that the individual innovation with the largest potential impact by FID in 2030 is improvements in jacket manufacturing. Improvements in monopile design and design standards also have a significant potential impact. Figure 7.2 shows no improvements in monopiledesignasitisanticipatedthatmonopileswillnotbeusedonprojectswith10MW-SizeTurbinesonSiteTypeD.InnovationsrelatingtoarraycableshavealowerpotentialimpactonLCOEcomparedwithfoundationsandtowers,butmoreprogressisanticipatedinrealisingthispotential in time for projects with FID in 2030.
Table 7.1 Anticipated and potential impact of balance of plant innovations for a wind farm with 10MW-Size Turbines on Site Type D with FID in 2030, compared with a wind farm with the same MW-Size Turbines on the same Site Type with FID in 2014 (no Other Effects incorporated).
Innovation Maximum technical potential impact by FID in 2030 Anticipated impact by FID 2030
CAPEX OPEX AEP LCOE CAPEX OPEX AEP LCOE
Improvements in jacket design and design standards -2.5% 0.0% 0.0% -2.0% -1.8% 0.0% 0.0% -1.4%
Improvements in jacket manufacturing -2.2% -0.5% 0.0% -1.8% -1.5% -0.3% 0.0% -1.3%
Improvements in monopile designs and design standards -2.1% -0.2% 0.0% -1.6% 0.0% 0.0% 0.0% 0.0%
Holistic tower design -1.7% -0.2% 0.0% -1.3% -0.3% 0.0% 0.0% -0.3%
Introduction of suction bucket technology -1.2% 0.0% 0.0% -0.9% -0.3% 0.0% 0.0% -0.2%
Introduction of array cables with higher operating voltages -0.3% 0.0% 0.1% -0.3% -0.2% 0.0% 0.1% -0.3%
Introduction of alternative array cable core materials -0.5% 0.3% 0.0% -0.3% -0.4% 0.2% 0.0% -0.2%
Improvements in array cable standards and client specification -0.3% 0.0% 0.0% -0.2% -0.3% 0.0% 0.0% -0.2%
Figure 7.2 Anticipated and potential impact of balance of plant innovations for a wind farm with 10MW-Size Turbines on Site Type D with FID in 2030, compared with a wind farm with the same MW-Size Turbines on the same Site Type with FID in 2014 (no Other Effects incorporated). (There is no anticipated impact in monopile design as it is anticipated that monopiles will not be used on projects with 10MW-Size Turbines on Site Type D.)
Improvements in jacket design and design standards
Improvements in jacket manufacturing
Improvements in monopile designs and design standards
Holistic tower design
Introduction of suction bucket technology
Introduction of array cables with higher operating voltages
Introduction of alternative array cable core materials
Improvements in array cable standards and client specification
Impact on LCOE
Source: BVG Associates 0% 2% 4% 6% 8% 10%
•Anticipated by 2030 •Potential by 2030
KIC InnoEnergy · Renewable Energies47
7.2. InnovationsInnovations in balance of plant are mostly centred on the foundation and relate to improvements in the manufacture and design of this main structure. The most important of these have been modelled here. Offshore and onshore substations and export cables have been modelledseparatelyinthisstudy(seeSection2.4).Solutionsinvolvingpermanentlyfloatingfoundationsin deeper water are not modelled as it is unlikely that there will be benefits in 35m water depth, asforprojectsonSiteTypeD.
Improvements in jacket design and design standards
Practice today: Jacketdesignisoptimisedforoilandgasstructuresbutnotforserialproductionforoffshorewind.Currentdesignstandardsforstructure-soilinteractionandmaterialfatiguearealso considered to be excessively conservative because they are based on dated oil and gas standards for manned structures.Innovation: The development of semi-standardised jacket designs capable of accommodating some variation in water depth will facilitate higher levels of automated fabrication, reducing labour, production time and installation time. As with monopiles, savings on secondary steel design and J-tube placement will also be applicable. Although jackets are less sensitive tofatigue loads than monopiles, it is anticipated that the development of offshore wind-specific design standards will allow a saving on material costs.Relevance: These innovations are relevant to projects using jacket support structures, hence projectsusing10MW-SizeTurbinesonSiteTypeD.Commercial readiness:Morethanthree-quartersofthebenefitisanticipatedtobeavailablefor projects with FID in 2020 rising further for projects with FID in 2025.Market share: Where relevant, around 60% of the projects with 10MW-Size Turbines areanticipated to use these innovations.
Improvements in jacket manufacturing
Practice today: Jacket production is based on themanufacturing practices of the oil andgas sector,with tubulars added to a static structurewithmanuallywelded joints. Corrosionprotection is applied to the completed structure in a large paint shop.Innovation: New fabrication facilities will be developed that are optimised for the serialfabrication of jacket foundations with more advanced handling and welding equipment and pre-fabricatednodes reducing support structureCAPEXandOPEXby increasing reliability.Increasingly, activity may also take place away from the main fabrication facility with the modular assembly of sections by sub-suppliers and the pre-painting of tubulars.Relevance: The innovation is only relevant to projects using jacket support structures, hence 10MW-SizeTurbinesonSiteTypeD.Commercial readiness: Morethanhalfofthebenefitoftheseinnovationsisanticipatedtobe available for projects with FID in 2020 rising to more than three quarters for projects with FID in 2025.Market share: Where relevant, around 60% of the projects with 10MW-Size Turbines areanticipated to use these innovations.
Future renewable energy costs: offshore wind 48
Improvements in monopile design and design standards
Practice today: Monopiledesignislargelyoptimisedbutarefinementofdesignstandardsandfurtherimprovements(includingtothetransmissionpieceandconnectionwiththemonopile)are still possible. The design standards use an empirical approach to soil interaction based on data from the oil and gas sector, which is considered to be out of date and unrepresentative of the larger piles used in the offshore wind industry today. Fatigue properties and safety factors are also not ideally suited to the application.Innovation: Improvements in the design of the transmission piece, the suitability of design standards to soil interaction for offshorewindmonopiles and in the design of J-tubes offersavingsinbothsupportstructureandconstructionCAPEX.Relevance:Theinnovationisrelevanttoallprojectsexceptthoseusing10MW-SizeTurbinesonSiteTypeD,wherejacketsareanticipatedtobeused.Commercial readiness: 70% of the benefit of innovation in this area is anticipated to be availableforprojectswithFIDin2020,increasingto80%forprojectswithFIDin2025.Market share: It is anticipated that, where relevant, more than 50% of the projects with FID in 2020willusetheseinnovationsandthatthiswillincreasetoabout60%forprojectswithFIDin2025and2030.Thiswillnotincreasebeyond60%duetothemixofsupportstructuretypesinthe market.
Holistic tower design
Practice today: The tower is generally a standard design for a given turbine and the design and supply responsibility has always been within the scope of the wind turbine manufacturer. Conversely,thefoundationisproject-andgenerallylocation-specific.Towersconsistoftwoorthree flanged sections that are pre-assembled at a local construction port before installation.Innovation: By considering the stiffness performance requirement of the combined tower and foundation, a slight increase in the mass of the tower would enable a more substantial decrease in the mass of the foundation. This innovation includes more sophisticated tower dampers. It also includes production of single section towers which require fewer flanges and allow a morestreamlinedmanufacturingapproach.Suchchangesreducebothsupportstructureandconstruction CAPEX. Single section towers would also reduce inspection requirements forboltedflangejointsandhenceOPEX.Relevance: The innovation is relevant toallTurbineSizeandSiteTypesbut the impactis reduced by a half on wind farms using 10MW-Size Turbines on Site Type D as thiscombination will use jackets, where the challenges relating to natural frequency are less significant.Commercial readiness: It is anticipated that almost a third of the benefit of this innovation will be available for projects with FID in 2020 and over three-quarters will be fully available for projects with FID in 2025. Market share: Market share is anticipated to be around 10% for projectswith FID in 2020increasingto30%forprojectswithFIDin2025and40%forprojectswithFIDin2030.
Introduction of suction bucket technology
Practice today: Suctionbuckettechnologyhasbeendemonstratedonsmallerclose-to-shoreturbines and two offshore met stations with a further test planned at full-scale. It has not yet been used with “next generation” turbines in a commercial or full-scale test environment.
KIC InnoEnergy · Renewable Energies49
Innovation: The pile-driven foundation is replaced by a suction bucket which is drawn into the sea bed by a combination of its own weight and applied hydrostatic pressure. The structure can be vertically aligned during installation. The installation process is quieter than piling and thus noise abatement costs are lowered. A small rise in development costs is anticipated due to the need for increased geotechnical surveying. It can be used with both monopile and jacket-type structures.Relevance: TheinnovationisequallyrelevanttoallTurbineSizesandSiteTypes,thoughnotallground conditions are suitable for sites types not considered in this analysis.Commercial readiness: Almost two-thirds of the benefit of this innovation is anticipated to be available for projects with FID in 2020, rising to almost full availability for projects with FID in 2025.Market share: Lessthan5%ofprojectswithFIDin2020areanticipatedtousethisinnovationbut this is anticipated to increase to around 10% by 2025 and to almost 25% of projects with FID in 2030.
Introduction of array cables with higher operating voltages
Practice today: Today, 33kV three-core subsea AC cable is the universal solution for arraycabling but this means that the number of turbines that can be connected to a single cable run is limited by the rated capacity of the cable, which is supplied in a number of steps of core size. ThislimitsthenumberofturbinesonaruntofiveorsixdependingonTurbineSize.Innovation: The introduction of array cables with higher operating voltages means capacity canbeincreasedandelectricallossesreduced.Studieshaveprovedthefeasibilityofextendingtheoperatingvoltageofcabledesignstocloseto66kV.Astheindustrymovestowardslargerturbines, the need for higher capacity array cables becomes more critical to minimise the total cable length and the number of substations required.Relevance: All of the value of this innovation is anticipated to be realised on projects using 10MW- and 8MW-Size Turbines and over three-quarters is anticipated to be realised onprojectsusing6MW-SizeTurbines.Nobenefitisanticipatedtocomefromthisinnovationfora4MW-SizeTurbine.Commercial readiness: It is anticipated that more than two-thirds of the benefit of this innovation will be available for projects with FID in 2020 with the full benefit available for projects with FID in 2025. Market share: It isanticipated that for the6MW-and8MW-SizeTurbines,60%and75%ofprojects respectively with FID in 2020 will use this innovation. This market share rises to over 80%for8MW-and10MW-SizeTurbinesforprojectswithFIDin2025.Forthe6MW-SizeTurbines,the market share will be a little lower, at 70%. For FID in 2030, the market share will not increase above80%asDCarraycablingwillbeavailableasanalternative.
Introduction of alternative array cable core materials
Practice today:In2014,mostarraycablesinstalledinoffshorewindfarmshadcoppercores.In2016aluminiumisalsobeingused.Ithasalsobeenusedinothersectorsforbothonshoreandoffshore links.Innovation: The introduction of alternative array cable core materials could offer significant CAPEX savings. Copper prices have increased rapidly over recent years and are currentlysignificantly higher than aluminium.
Future renewable energy costs: offshore wind 50
An increased core size is required but there is an overall saving in material costs leading to significantsavings inarrayelectricalCAPEX. Installationcostsdo increaseduethedifficultyof handling and burying cables with aluminium cores due to lower density and increased susceptibility to work hardening. Some increase in unplanned OPEX and losses due tounavailability of the electrical system are anticipated in the early years.Relevance: TheinnovationisequallyrelevanttoallTurbineSizesandSiteTypes.Commercial readiness: Halfofthebenefitofthisinnovationisanticipatedtobeavailablefor projects with FID in 2020 with almost all of the benefit available for projects with FID in 2025.Market share: It is anticipated that almost 80% of projects with FID in 2020 will use thisinnovationandthatthismarketsharewillonlyincreaseveryslowlyto85%forFIDin2030.
Improvements in array cable standards and client specification
Practice today: Developers conventionally regularly require cable manufacturers to produce cables to a higher specification than the minimum accepted by recognised standards, even though the integrity of operating cable has generally been good, excluding externally-caused mechanical damage.Innovation: This innovation will involve the selection of the most suitable cable core size, insulation thicknesses and mechanical protection based on a greater understanding of site conditions and the specificationof cabledelivery lengths to fitwith themanufacturer’scapability. Small increases in development CAPEX are anticipated to be dominated by largesavingsonarrayelectricalCAPEXandsmallersavingsonconstructionCAPEX.Relevance: TheinnovationisequallyrelevanttoallTurbineSizesandSiteTypes.Commercial readiness: It is anticipated that more than two-thirds of the benefit of this innovation will be available for projects with FID in 2020 with three quarters of the benefit available for projects with FID in 2025. Market share: It is anticipated that more than a -third of projects with FID in 2020 will use this innovation. This is anticipated to increase to about threequarters for projects with FID in 2025, with almost all for FID in 2030. It is anticipated that the projects with smaller turbines are more likely to take up this innovation due to cabling being a larger fraction of the cost in these cases.
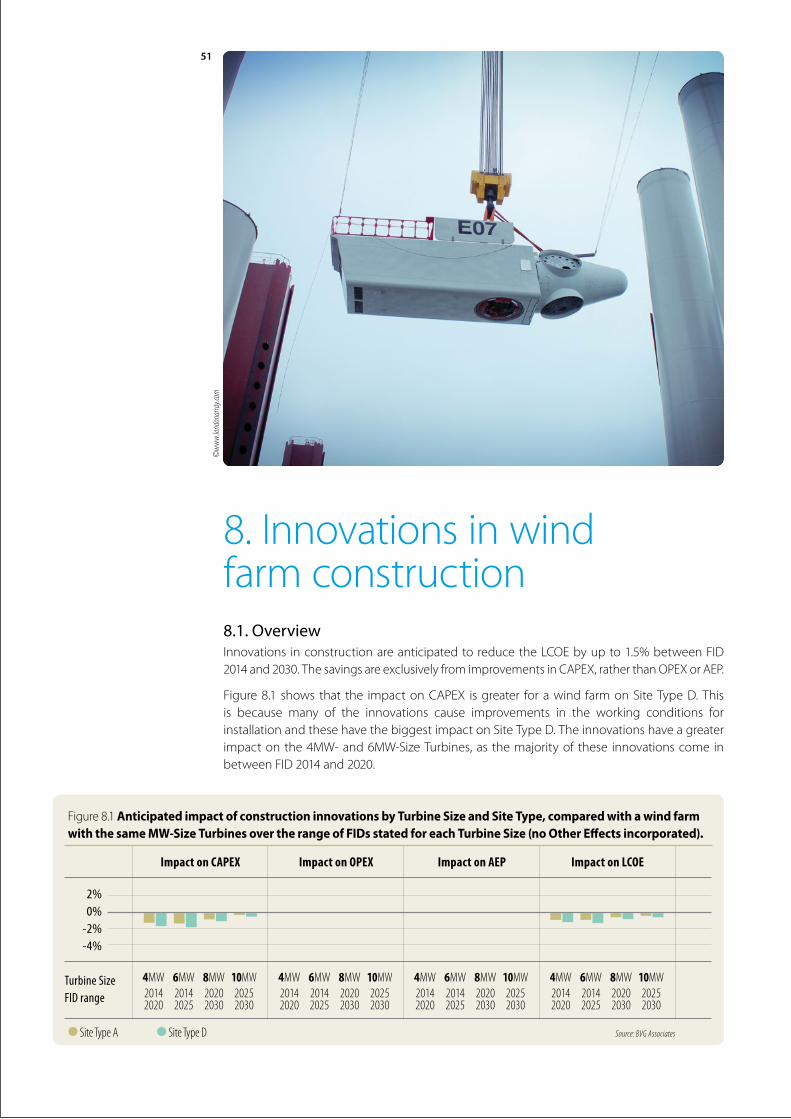
51
8.Innovationsinwind farm construction8.1. OverviewInnovations inconstructionareanticipatedtoreducetheLCOEbyupto1.5%betweenFID2014and2030.ThesavingsareexclusivelyfromimprovementsinCAPEX,ratherthanOPEXorAEP.
Figure8.1 shows that the impactonCAPEX isgreater forawind farmonSiteTypeD.Thisis because many of the innovations cause improvements in the working conditions for installationandthesehavethebiggestimpactonSiteTypeD.Theinnovationshaveagreaterimpactonthe4MW-and6MW-SizeTurbines,as themajorityof these innovationscome inbetweenFID2014and2020.
©ww
w.lon
dona
rray.c
om
Figure8.1 Anticipated impact of construction innovations by Turbine Size and Site Type, compared with a wind farm with the same MW-Size Turbines over the range of FIDs stated for each Turbine Size (no Other Effects incorporated).
2% 0% -2% -4%
Turbine Size FID range
Impact on CAPEX Impact on OPEX Impact on AEP Impact on LCOE
•Site Type A •Site Type D
4MW20142020
6MW20142025
8MW20202030
10MW20252030
4MW20142020
6MW20142025
8MW20202030
10MW20252030
4MW20142020
6MW20142025
8MW20202030
10MW20252030
4MW20142020
6MW20142025
8MW20202030
10MW20252030
Source: BVG Associates
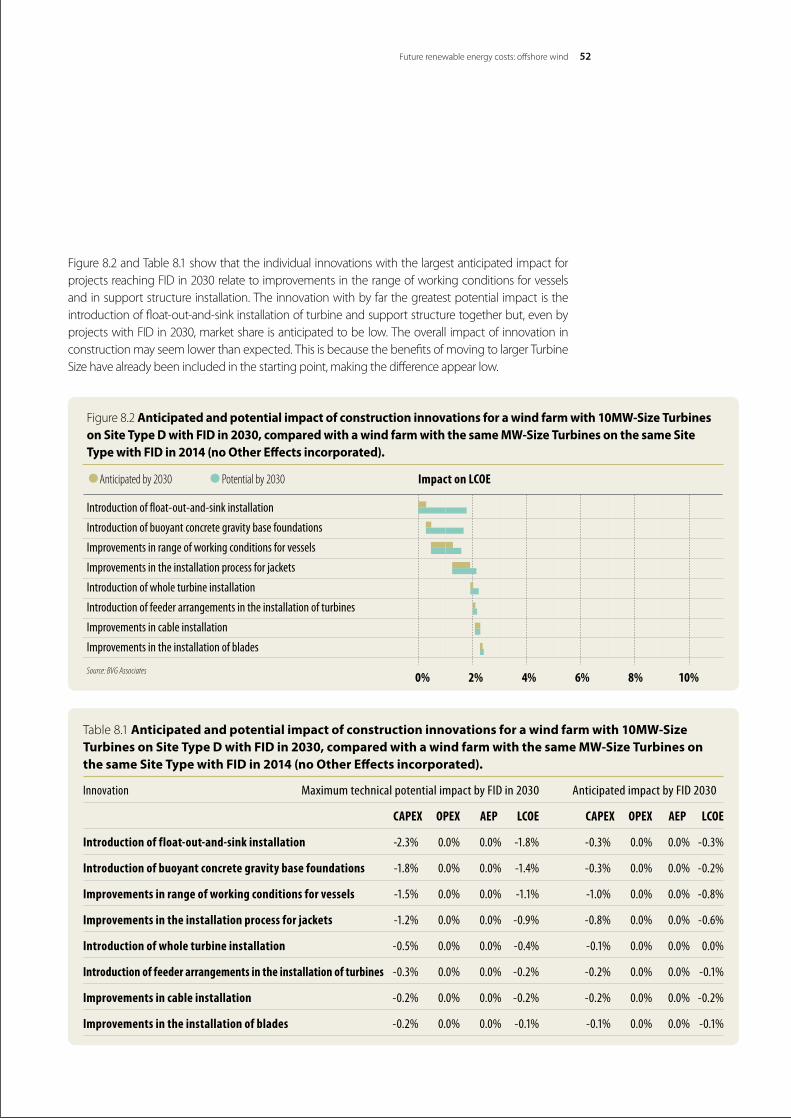
Future renewable energy costs: offshore wind 52
Figure8.2andTable8.1showthattheindividualinnovationswiththelargestanticipatedimpactforprojects reaching FID in 2030 relate to improvements in the range of working conditions for vessels and in support structure installation. The innovation with by far the greatest potential impact is the introduction of float-out-and-sink installation of turbine and support structure together but, even by projects with FID in 2030, market share is anticipated to be low. The overall impact of innovation in construction may seem lower than expected. This is because the benefits of moving to larger Turbine Sizehavealreadybeenincludedinthestartingpoint,makingthedifferenceappearlow.
Table8.1 Anticipated and potential impact of construction innovations for a wind farm with 10MW-Size Turbines on Site Type D with FID in 2030, compared with a wind farm with the same MW-Size Turbines on the same Site Type with FID in 2014 (no Other Effects incorporated).
Innovation Maximum technical potential impact by FID in 2030 Anticipated impact by FID 2030
CAPEX OPEX AEP LCOE CAPEX OPEX AEP LCOE
Introduction of float-out-and-sink installation -2.3% 0.0% 0.0% -1.8% -0.3% 0.0% 0.0% -0.3%
Introduction of buoyant concrete gravity base foundations -1.8% 0.0% 0.0% -1.4% -0.3% 0.0% 0.0% -0.2%
Improvements in range of working conditions for vessels -1.5% 0.0% 0.0% -1.1% -1.0% 0.0% 0.0% -0.8%
Improvements in the installation process for jackets -1.2% 0.0% 0.0% -0.9% -0.8% 0.0% 0.0% -0.6%
Introduction of whole turbine installation -0.5% 0.0% 0.0% -0.4% -0.1% 0.0% 0.0% 0.0%
Introduction of feeder arrangements in the installation of turbines -0.3% 0.0% 0.0% -0.2% -0.2% 0.0% 0.0% -0.1%
Improvements in cable installation -0.2% 0.0% 0.0% -0.2% -0.2% 0.0% 0.0% -0.2%
Improvements in the installation of blades -0.2% 0.0% 0.0% -0.1% -0.1% 0.0% 0.0% -0.1%
Figure8.2 Anticipated and potential impact of construction innovations for a wind farm with 10MW-Size Turbines on Site Type D with FID in 2030, compared with a wind farm with the same MW-Size Turbines on the same Site Type with FID in 2014 (no Other Effects incorporated).
Introduction of float-out-and-sink installation
Introduction of buoyant concrete gravity base foundations
Improvements in range of working conditions for vessels
Improvements in the installation process for jackets
Introduction of whole turbine installation
Introduction of feeder arrangements in the installation of turbines
Improvements in cable installation
Improvements in the installation of blades
Impact on LCOE
Source: BVG Associates 0% 2% 4% 6% 8% 10%
•Anticipated by 2030 •Potential by 2030
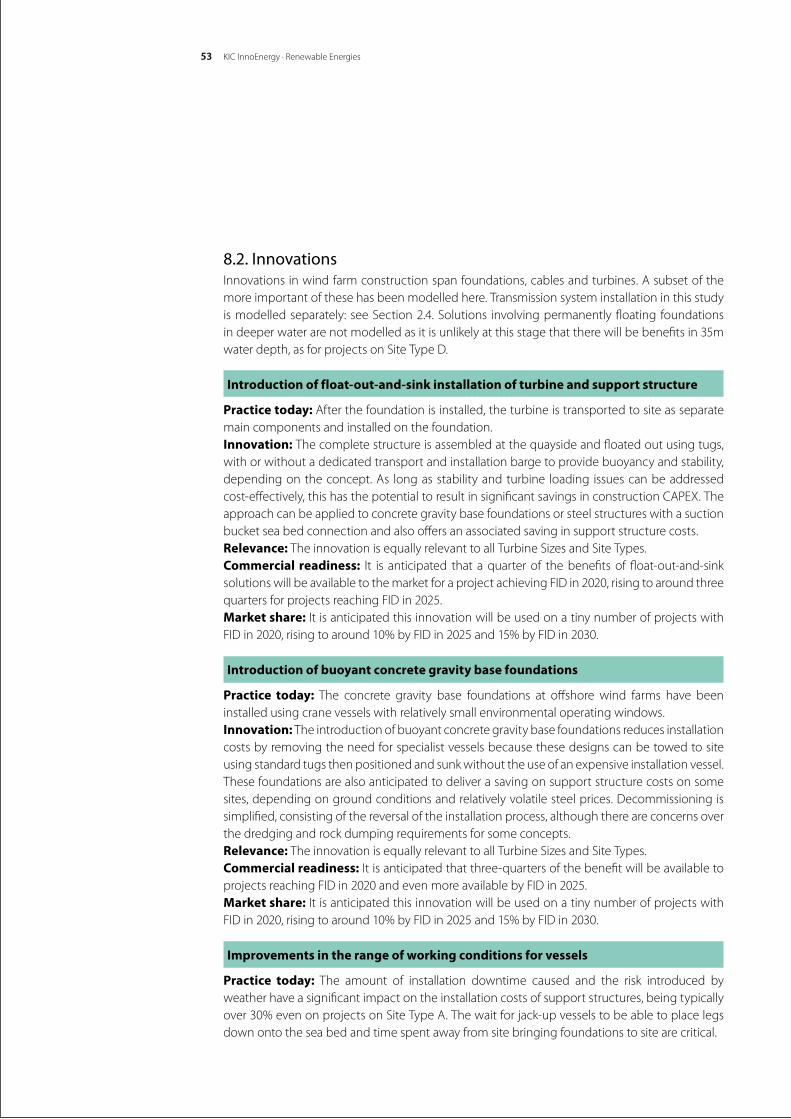
KIC InnoEnergy · Renewable Energies53
8.2. InnovationsInnovations in wind farm construction span foundations, cables and turbines. A subset of the more important of these has been modelled here. Transmission system installation in this study ismodelledseparately: seeSection2.4.Solutions involvingpermanentlyfloating foundationsin deeper water are not modelled as it is unlikely at this stage that there will be benefits in 35m waterdepth,asforprojectsonSiteTypeD.
Introduction of float-out-and-sink installation of turbine and support structure
Practice today: After the foundation is installed, the turbine is transported to site as separate main components and installed on the foundation.Innovation: The complete structure is assembled at the quayside and floated out using tugs, with or without a dedicated transport and installation barge to provide buoyancy and stability, depending on the concept. As long as stability and turbine loading issues can be addressed cost-effectively,thishasthepotentialtoresultinsignificantsavingsinconstructionCAPEX.Theapproach can be applied to concrete gravity base foundations or steel structures with a suction bucket sea bed connection and also offers an associated saving in support structure costs.Relevance: TheinnovationisequallyrelevanttoallTurbineSizesandSiteTypes.Commercial readiness: It is anticipated that a quarter of the benefits of float-out-and-sink solutions will be available to the market for a project achieving FID in 2020, rising to around three quarters for projects reaching FID in 2025.Market share: It is anticipated this innovation will be used on a tiny number of projects with FID in 2020, rising to around 10% by FID in 2025 and 15% by FID in 2030.
Introduction of buoyant concrete gravity base foundations
Practice today: The concrete gravity base foundations at offshore wind farms have been installed using crane vessels with relatively small environmental operating windows.Innovation: The introduction of buoyant concrete gravity base foundations reduces installation costs by removing the need for specialist vessels because these designs can be towed to site using standard tugs then positioned and sunk without the use of an expensive installation vessel. These foundations are also anticipated to deliver a saving on support structure costs on some sites, depending on ground conditions and relatively volatile steel prices. Decommissioning is simplified, consisting of the reversal of the installation process, although there are concerns over the dredging and rock dumping requirements for some concepts. Relevance: TheinnovationisequallyrelevanttoallTurbineSizesandSiteTypes.Commercial readiness: It is anticipated that three-quarters of the benefit will be available to projects reaching FID in 2020 and even more available by FID in 2025.Market share: It is anticipated this innovation will be used on a tiny number of projects with FID in 2020, rising to around 10% by FID in 2025 and 15% by FID in 2030.
Improvements in the range of working conditions for vessels
Practice today: The amount of installation downtime caused and the risk introduced by weather have a significant impact on the installation costs of support structures, being typically over30%evenonprojectsonSiteTypeA.Thewaitforjack-upvesselstobeabletoplacelegsdown onto the sea bed and time spent away from site bringing foundations to site are critical.
Future renewable energy costs: offshore wind 54
Innovation: An increase in the average Hs working limit from 1.4m to 2.5m represents asignificant but achievable target. The use of feeder barges maximises the utilisation of the installation vessel on core installation tasks, hence decreasing construction costs at the cost of additional offshore lifts and increased costs in the case of critical path delays. Relevance: The full impact of these innovations is anticipated to be realised for projects usingSiteTypeD,withlowerbenefitavailableforprojectsusingthemorebenignSiteType A.Commercial readiness:Mostofthebenefitoftheseinnovationswillbeavailableforprojectswith FID in 2020, with the remainder available for projects with FID in 2025. Market share:Itisanticipatedthatthisinnovationwillbeusedonover80%ofprojectswithFIDin 2020. By FID in 2030, the market share is slightly down, at 70%, due to alternative installation strategies being used.
Improvements in the installation process for jackets
Practice today: Asof2014,jacketstructureshadbeeninstalledusingweather-sensitivevessels.By2016, jacketshavebeen installedusing sheerlegcranevessels,heavy lift vesselsand jack-upvessels.Noneoftheseareoptimallyspecifiedforspaceframeinstallation,duetoweathersensitivity, vessel cost or carrying capacity.Innovation: Developers anticipate significant savings from the development of a fleet of specialised vessels able to perform discrete installation steps more efficiently. Where vessels transport both foundations and turbines, the introduction of flexible sea fastenings capable of holding both components could reduce mobilisation time and hence construction costs. Advances in pre-piling technology and innovative drilling processes could reduce cost in the installation process for jackets.Relevance: This innovation is relevant only for projects using jacket support structures, hence using10MW-SizeTurbinesonSiteTypeD.Commercial readiness: Over half of the benefit of this innovation is anticipated to beavailable for projects with FID in 2020, with most of the remainder available for projects with FID in 2025.Market share: This innovation is anticipated to capture over half of the market on relevant projects for FID in 2025 and over two-thirds by FID in 2030. The increase is less than expected because alternative installation methods become available throughout the period.
Introduction of whole turbine installation
Practice today: After the foundation is installed, the turbine is transported to site as separate main components and installed on the foundation.Innovation: The turbine is fully assembled and partly commissioned in the construction port then transported to site and installed in one lift onto the foundation. This requires the use of a different design of installation vessel but reduces installation time and weather downtime.Relevance: The full impact of this innovation is anticipated to be realised for projects using 10MW-SizeTurbinesonSiteTypeD,withsomewhatlowerbenefitavailableforprojectsusingSiteTypeAandlowerbenefitsforprojectsusingsmallerturbines.Forthe4MA-SizeTurbinesonSiteTypeA,therelevanceisjustunderhalf.
KIC InnoEnergy · Renewable Energies55
Commercial readiness: Noneof thebenefitof this innovationwillbeavailable forFID in2020.About60%ofthebenefitofthisinnovationwillbeavailableforprojectswithFIDin2025.Market share: This innovation is not anticipated to capture significant market share for projects reaching FID in 2020 but is anticipated to rise to account for around a tenth of the market for projects reaching FID in 2025 and 2030.
Introduction of feeder arrangements in the installation of turbines
Practice today: Turbine components are transported from port to the wind farm site by the specialised installation vessel. This reduces the proportion of time this vessel is available for use lifting components into position.Innovation: The use of feeder barges to transport turbine components to the installation vessel reduces the installation time. This saving is offset by the marginal increase in risk associated with the additional at-sea lifts and increased per-day costs due for the feeder vessels, especially in the event of project delays.Relevance: ThefullimpactofthisinnovationisforprojectsusingSiteTypeD,withlittleavailableforprojectsusingtheSiteTypeA,withashorterdistancefromport.Commercial readiness: It is anticipated that 20% of the benefit from this innovation will be available for projects reaching FID in 2020, increasing to 50 by FID in 2025.Market share: This innovation is anticipated to be used on 0% of projects with FID in 2020 and about20%ofprojectsforFIDin2025.Forprojectsusing6MW-SizeTurbines,thisisanticipatedto rise further to 50% for those reaching FID in 2030 but competition from other methods is anticipatedtolimitfurtherrisesforprojectsusing8MW-and10MW-SizeTurbines.
Improvements in cable installation
Practice today: ThecableispulledinthroughaJ-tubeorequivalentatthefirstturbinepositionbefore being laid between turbine positions then pulled in at the second position. Array cable installation can be undertaken using either a single lay and burial process with a plough or a separate surface lay with subsequent burial, using a jetting tool operated from a remotely operatedvehicle(ROV).Innovation: Early engagement between cable installers and support structure designers allows the optimisation of the cable-pull in process and reduces the use of specialist vessels. A move to more advanced, bespoke cable laying vessels will increase the range of working conditions for array cable installation, maximising vessel utilisation and further reducing the cost of installing cables.Relevance: TheinnovationisequallyrelevanttoallTurbineSizesandSiteTypes.Commercial readiness: Mostofthebenefitoftheseinnovationsisanticipatedtobeavailablefor projects with FID in 2020, with almost all of the remaining benefit available by FID in 2025.Market share:MostprojectswithFIDin2020andallprojectswithFIDin2025and2030areanticipated to use these innovations.
Improvements in the installation of blades
Practice today: The blades are either lifted individually with the nacelle and hub in position or as a preinstalled rotor as a single “star” lift. This activity is often the bottleneck in turbine installation due to weather dependency.

Future renewable energy costs: offshore wind 56
Innovation: Increasing themaximumwindspeed forblade lifts from8m/s to12m/swouldreduce weather downtime for such operations by around a third and deliver installation savings by increasing utilisation of the installation vessels. Relevance: The fullbenefitof this innovation isavailable forprojectsonSiteTypeD.LowerwindspeedsonprojectsonSiteTypeAmeanthatitisanticipatedthatonlythree-quartersofthe potential benefit is available.Commercial readiness: It is anticipated that 70% of the benefit from this innovation will be availableforprojectsreachingFIDin2020,increasingto85%byFIDin2025.Market share: This innovation is anticipated to be used on three-quarters of projects for FID in 2020.Forprojectsusing6MW-SizeTurbines,thisisanticipatedtorisefurtherforprojectsreachingFID in 2025 but competition from other methods is anticipated to limit further rises for projects using8MWand10MW-SizeTurbines.Competitionfromothermethodslimitsthemarketshareto a little over half for projects with FID in 2030.
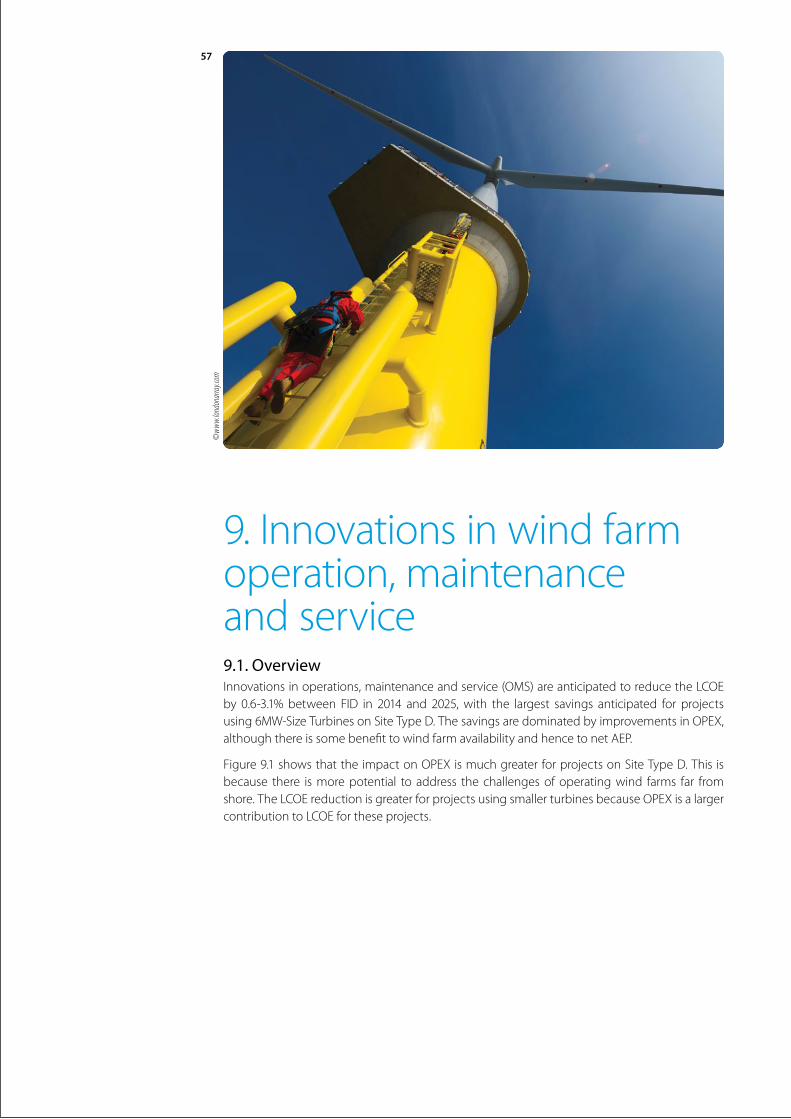
57
9.Innovationsinwindfarmoperation, maintenance and service9.1. OverviewInnovationsinoperations,maintenanceandservice(OMS)areanticipatedtoreducetheLCOEby 0.6-3.1%between FID in 2014 and 2025,with the largest savings anticipated for projectsusing6MW-SizeTurbinesonSiteTypeD.ThesavingsaredominatedbyimprovementsinOPEX,althoughthereissomebenefittowindfarmavailabilityandhencetonetAEP.
Figure9.1showsthattheimpactonOPEXismuchgreaterforprojectsonSiteTypeD.Thisisbecause there is more potential to address the challenges of operating wind farms far from shore.TheLCOEreductionisgreaterforprojectsusingsmallerturbinesbecauseOPEXisalargercontributiontoLCOEfortheseprojects.
©ww
w.lon
dona
rray.c
om
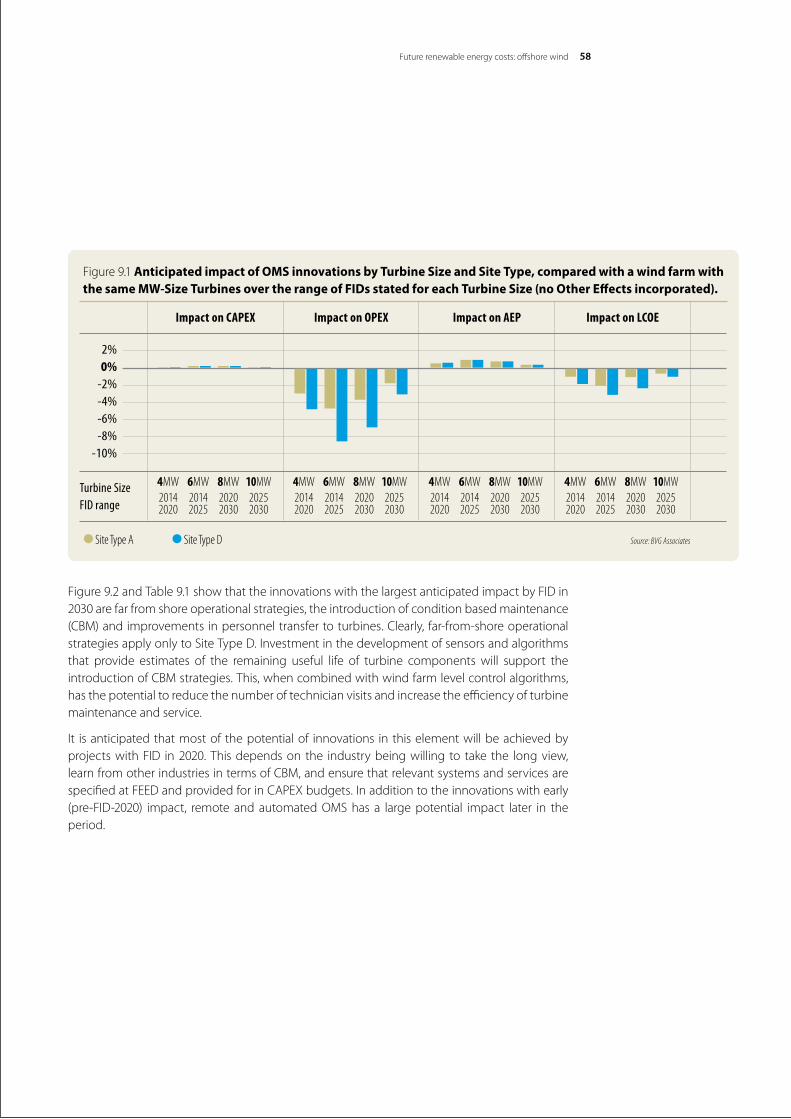
Future renewable energy costs: offshore wind 58
Figure9.2andTable9.1showthattheinnovationswiththelargestanticipatedimpactbyFIDin2030 are far from shore operational strategies, the introduction of condition based maintenance (CBM)andimprovementsinpersonneltransfertoturbines.Clearly,far-from-shoreoperationalstrategiesapplyonlytoSiteTypeD.Investmentinthedevelopmentofsensorsandalgorithmsthat provide estimates of the remaining useful life of turbine components will support the introductionofCBMstrategies.This,whencombinedwithwindfarmlevelcontrolalgorithms,has the potential to reduce the number of technician visits and increase the efficiency of turbine maintenance and service.
It is anticipated that most of the potential of innovations in this element will be achieved by projects with FID in 2020. This depends on the industry being willing to take the long view, learnfromotherindustriesintermsofCBM,andensurethatrelevantsystemsandservicesarespecifiedatFEEDandprovidedforinCAPEXbudgets.Inadditiontotheinnovationswithearly(pre-FID-2020) impact, remote and automatedOMShas a largepotential impact later in theperiod.
Figure9.1 Anticipated impact of OMS innovations by Turbine Size and Site Type, compared with a wind farm with the same MW-Size Turbines over the range of FIDs stated for each Turbine Size (no Other Effects incorporated).
2% 0% -2% -4% -6% -8% -10%
Turbine Size FID range
Impact on CAPEX Impact on OPEX Impact on AEP Impact on LCOE
•Site Type A •Site Type D
4MW20142020
6MW20142025
8MW20202030
10MW20252030
4MW20142020
6MW20142025
8MW20202030
10MW20252030
4MW20142020
6MW20142025
8MW20202030
10MW20252030
4MW20142020
6MW20142025
8MW20202030
10MW20252030
Source: BVG Associates
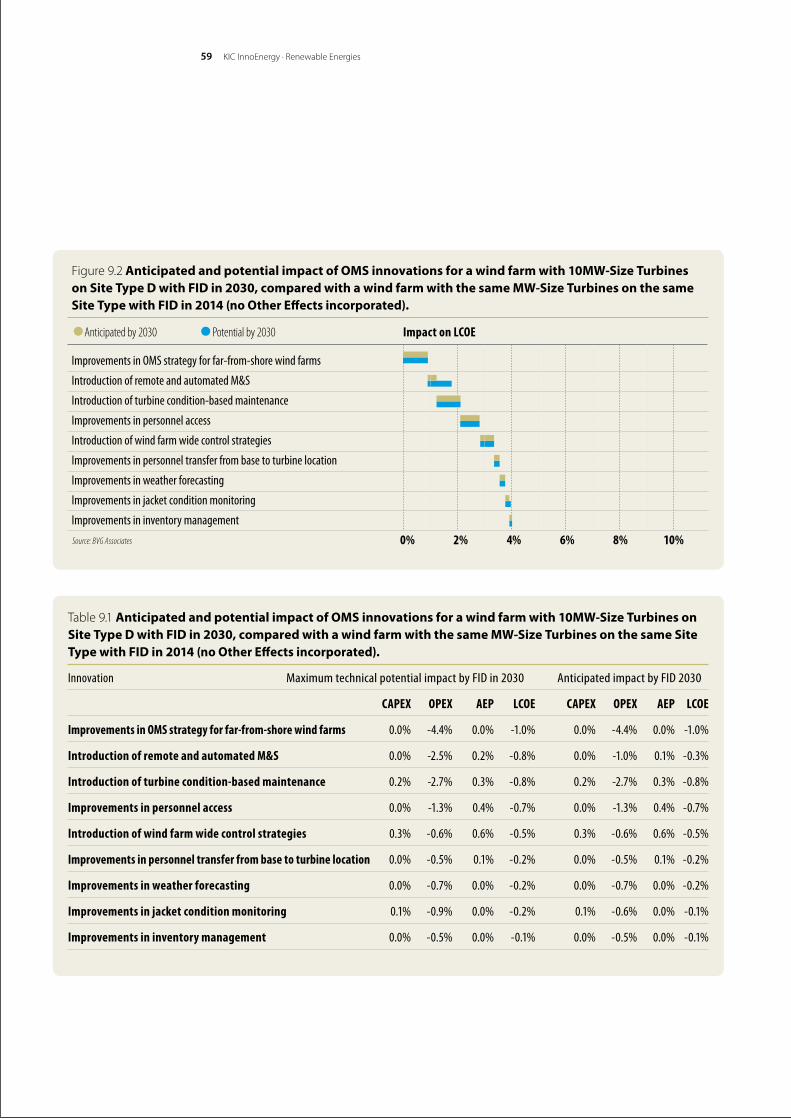
KIC InnoEnergy · Renewable Energies59
Table9.1Anticipated and potential impact of OMS innovations for a wind farm with 10MW-Size Turbines on Site Type D with FID in 2030, compared with a wind farm with the same MW-Size Turbines on the same Site Type with FID in 2014 (no Other Effects incorporated).
Innovation Maximum technical potential impact by FID in 2030 Anticipated impact by FID 2030
CAPEX OPEX AEP LCOE CAPEX OPEX AEP LCOE
Improvements in OMS strategy for far-from-shore wind farms 0.0% -4.4% 0.0% -1.0% 0.0% -4.4% 0.0% -1.0%
Introduction of remote and automated M&S 0.0% -2.5% 0.2% -0.8% 0.0% -1.0% 0.1% -0.3%
Introduction of turbine condition-based maintenance 0.2% -2.7% 0.3% -0.8% 0.2% -2.7% 0.3% -0.8%
Improvements in personnel access 0.0% -1.3% 0.4% -0.7% 0.0% -1.3% 0.4% -0.7%
Introduction of wind farm wide control strategies 0.3% -0.6% 0.6% -0.5% 0.3% -0.6% 0.6% -0.5%
Improvements in personnel transfer from base to turbine location 0.0% -0.5% 0.1% -0.2% 0.0% -0.5% 0.1% -0.2%
Improvements in weather forecasting 0.0% -0.7% 0.0% -0.2% 0.0% -0.7% 0.0% -0.2%
Improvements in jacket condition monitoring 0.1% -0.9% 0.0% -0.2% 0.1% -0.6% 0.0% -0.1%
Improvements in inventory management 0.0% -0.5% 0.0% -0.1% 0.0% -0.5% 0.0% -0.1%
Figure9.2 Anticipated and potential impact of OMS innovations for a wind farm with 10MW-Size Turbines on Site Type D with FID in 2030, compared with a wind farm with the same MW-Size Turbines on the same Site Type with FID in 2014 (no Other Effects incorporated).
Improvements in OMS strategy for far-from-shore wind farms
Introduction of remote and automated M&S
Introduction of turbine condition-based maintenance
Improvements in personnel access
Introduction of wind farm wide control strategies
Improvements in personnel transfer from base to turbine location
Improvements in weather forecasting
Improvements in jacket condition monitoring
Improvements in inventory management
Impact on LCOE
Source: BVG Associates 0% 2% 4% 6% 8% 10%
•Anticipated by 2030 •Potential by 2030
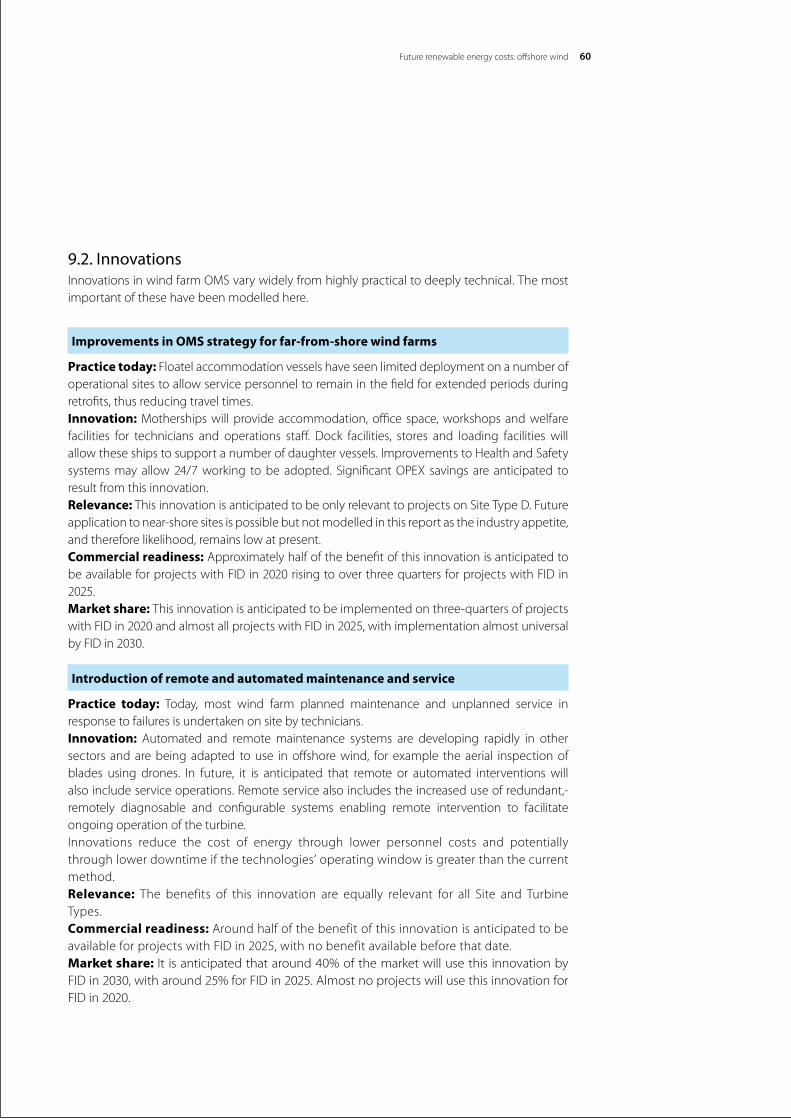
Future renewable energy costs: offshore wind 60
9.2. InnovationsInnovationsinwindfarmOMSvarywidelyfromhighlypracticaltodeeplytechnical.Themostimportant of these have been modelled here.
Improvements in OMS strategy for far-from-shore wind farms
Practice today: Floatel accommodation vessels have seen limited deployment on a number of operational sites to allow service personnel to remain in the field for extended periods during retrofits, thus reducing travel times.Innovation:Mothershipswillprovideaccommodation,officespace,workshopsandwelfarefacilities for technicians and operations staff. Dock facilities, stores and loading facilities will allowtheseshipstosupportanumberofdaughtervessels.ImprovementstoHealthandSafetysystemsmay allow24/7working tobe adopted. SignificantOPEX savings are anticipated toresult from this innovation.Relevance: ThisinnovationisanticipatedtobeonlyrelevanttoprojectsonSiteTypeD.Futureapplication to near-shore sites is possible but not modelled in this report as the industry appetite, and therefore likelihood, remains low at present.Commercial readiness: Approximately half of the benefit of this innovation is anticipated to be available for projects with FID in 2020 rising to over three quarters for projects with FID in 2025.Market share: This innovation is anticipated to be implemented on three-quarters of projects with FID in 2020 and almost all projects with FID in 2025, with implementation almost universal by FID in 2030.
Introduction of remote and automated maintenance and service
Practice today: Today, most wind farm planned maintenance and unplanned service in response to failures is undertaken on site by technicians.Innovation: Automated and remote maintenance systems are developing rapidly in other sectors and are being adapted to use in offshore wind, for example the aerial inspection of blades using drones. In future, it is anticipated that remote or automated interventions will also include service operations. Remote service also includes the increased use of redundant,- remotely diagnosable and configurable systems enabling remote intervention to facilitate ongoing operation of the turbine.Innovations reduce the cost of energy through lower personnel costs and potentially throughlowerdowntimeifthetechnologies’operatingwindowisgreaterthanthecurrentmethod.Relevance: The benefits of this innovation are equally relevant for all Site and TurbineTypes. Commercial readiness: Around half of the benefit of this innovation is anticipated to be available for projects with FID in 2025, with no benefit available before that date.Market share: It isanticipatedthataround40%ofthemarketwillusethisinnovationbyFID in 2030, with around 25% for FID in 2025. Almost no projects will use this innovation for FID in 2020.
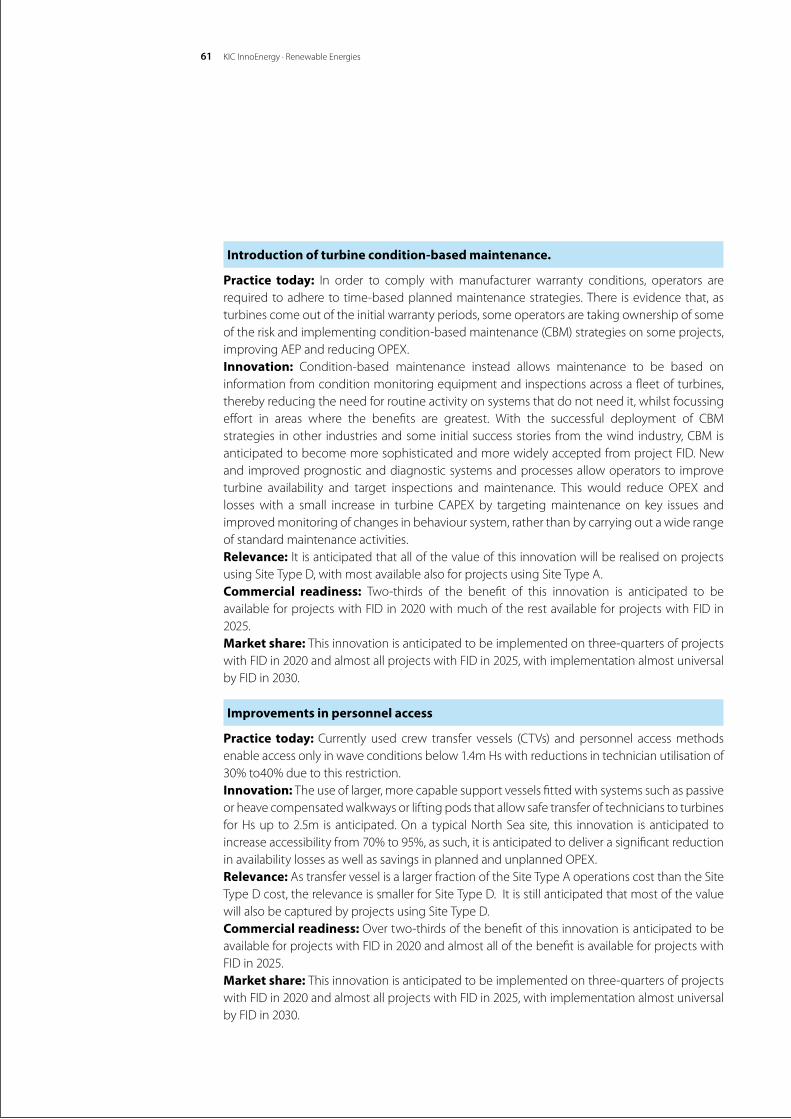
61
Introduction of turbine condition-based maintenance.
Practice today: In order to comply with manufacturer warranty conditions, operators are required to adhere to time-based planned maintenance strategies. There is evidence that, as turbines come out of the initial warranty periods, some operators are taking ownership of some oftheriskandimplementingcondition-basedmaintenance(CBM)strategiesonsomeprojects,improvingAEPandreducingOPEX.Innovation: Condition-based maintenance instead allows maintenance to be based oninformation from condition monitoring equipment and inspections across a fleet of turbines, thereby reducing the need for routine activity on systems that do not need it, whilst focussing effort in areas where the benefits are greatest. With the successful deployment of CBMstrategies inother industriesandsomeinitialsuccessstories fromthewind industry,CBMisanticipatedtobecomemoresophisticatedandmorewidelyacceptedfromprojectFID.Newand improved prognostic and diagnostic systems and processes allow operators to improve turbine availability and target inspections andmaintenance. This would reduce OPEX andlosseswith a small increase in turbine CAPEX by targetingmaintenance on key issues andimproved monitoring of changes in behaviour system, rather than by carrying out a wide range of standard maintenance activities.Relevance: It is anticipated that all of the value of this innovation will be realised on projects usingSiteTypeD,withmostavailablealsoforprojectsusingSiteTypeA.Commercial readiness: Two-thirds of the benefit of this innovation is anticipated to be available for projects with FID in 2020 with much of the rest available for projects with FID in 2025.Market share: This innovation is anticipated to be implemented on three-quarters of projects with FID in 2020 and almost all projects with FID in 2025, with implementation almost universal by FID in 2030.
Improvements in personnel access
Practice today: Currently used crew transfer vessels (CTVs) and personnel accessmethodsenableaccessonlyinwaveconditionsbelow1.4mHswithreductionsintechnicianutilisationof30%to40%duetothisrestriction.Innovation: The use of larger, more capable support vessels fitted with systems such as passive or heave compensated walkways or lifting pods that allow safe transfer of technicians to turbines forHsup to2.5m isanticipated.Ona typicalNorthSeasite, this innovation isanticipated toincreaseaccessibilityfrom70%to95%,assuch,itisanticipatedtodeliverasignificantreductioninavailabilitylossesaswellassavingsinplannedandunplannedOPEX.Relevance:AstransfervesselisalargerfractionoftheSiteTypeAoperationscostthantheSiteTypeDcost,therelevanceissmallerforSiteTypeD.ItisstillanticipatedthatmostofthevaluewillalsobecapturedbyprojectsusingSiteTypeD.Commercial readiness: Overtwo-thirdsofthebenefitofthisinnovationisanticipatedtobeavailable for projects with FID in 2020 and almost all of the benefit is available for projects with FID in 2025.Market share: This innovation is anticipated to be implemented on three-quarters of projects with FID in 2020 and almost all projects with FID in 2025, with implementation almost universal by FID in 2030.
KICInnoEnergy·RenewableEnergies
Future renewable energy costs: offshore wind 62
Introduction of wind farm wide control strategies
Practice today: Automatic control of wind turbines is carried out by individual wind turbine controls systems that cannot be co-ordinated to optimise performance across a wind farm. Any intervention to change the turbine operational parameters based on wind farm wide or local operating conditions is generally only by human operators. All wind turbine control systems provide forautomaticcurtailment (reductionofmaximumpower)whichmay in somecasesalready be managed by simple wind farm level control algorithms.Innovation: Development of more holistic control strategies using systems able to measure residualusefullifeandholdanunderstandingoftheincomedrivers(forexample,marketspotprices)hasthepotentialtoprovidemulti-objectiveoptimalcontrolofwindfarmstominimiseLCOE.ThisinnovationwillslightlyincreaseturbineCAPEXbutisanticipatedtoreduceunplannedOPEXandlosses,andtoincreaseAEP.Thisinnovationdoesnotincludeindividualwindturbinecontrolstrategies.TheseareincludedasinnovationsinSection6.Relevance: The full impact of this innovation is anticipated to be realised for projects using 10MW-SizeTurbines.Thebenefitsforprojectsusingsmallerturbinesarelower.Forthe4MW-SizeTurbinesonSiteTypeA,therelevanceisjustunderthree-quarters.Commercial readiness: Around 50% of the benefit of this innovation is anticipated to be available for projects with FID in 2020, increasing to 75% for projects with FID in 2025.Market share: This innovation is anticipated to be implemented on three-quarters of projects with FID in 2020 and almost all projects with FID in 2025, with implementation almost universal by FID in 2030.
Improvements in personnel transfer from base to turbine location
Practice today: Themajorityofoffshorewind farmsoperating in2014havea shore-basedoperatingbase.Transitfromthebasetothewindturbineisroutinelybysmall(15m-26mm)crewtransfervessels.Somemorerecentwindfarmshavehadprovisionforhelicopteraccessforbothoperational and health and safety functions. Innovation: Improved transfer vessels will deliver crews in larger numbers and greater comfort from their onshore or offshore base, maximising technician productivity on arrival. These vessels will also have greater payload capacities enabling a greater stock of material and tooling to be transported.Industryanticipatesreducedstaffchurn(andhenceincreasedknowledgeretention)as working conditions improve. This is anticipated to improve both planned and unplanned OPEXandtoreduceavailabilitylosses.Relevance: The harsher conditions and shorter transit times from the offshore base on projectsonSiteTypeDareanticipatedtoallowthemaximumvaluetobeextractedfromthisinnovation, but it is still anticipated that most of the value will also be captured by projects usingSiteTypeA.Commercial readiness: Three-quarters of the benefit of this innovation is anticipated to be available for projects with FID in 2020 and almost all is available for projects with FID in 2025.Market share: This innovation is anticipated to be implemented on three-quarters of projects with FID in 2020 and almost all projects with FID in 2025, with implementation almost universal by FID in 2030.
KIC InnoEnergy · Renewable Energies63
Improvements in weather forecasting
Practice today: Owners of offshore wind farms can subscribe to one or more weatherforecasting feeds provided by organisations such asMeteoGroup or the UKMeteorologicalOffice.Forecastsaregenerallyupdatedup to four timesaday, toagranularityofhalf-hourlyintervals out to six days ahead. The most advanced services provide hourly updates.Innovation: Improvements in weather forecasting will increase the efficient use of staff and vessels by maximising activity during weather windows. This requires advances both in the accuracyand thegranularityof forecasts.Currently, accuracydrops significantly for forecastsbeyond five days ahead for an area of approximately 100km2. In order to make the most efficient use of resources, and especially heavy equipment such as jack-up vessels, reasonable accuracy will need to be extended to a 21-day forecast. Relevance: It is anticipated that all of the value of this innovation will be realised on projects usingSiteTypeD,withmostavailablealsoforprojectsusingSiteTypeA.Commercial readiness: Around half of the benefit of this innovation is anticipated to be available for projects with FID in 2020 rising to around three quarters for projects with FID in 2025.Market share: This innovation is anticipated to be implemented on three-quarters of projects with FID in 2020 and almost all projects with FID in 2025, with implementation almost universal by FID in 2030.
Improvements in jacket condition monitoring
Practice today: In2014,onlyasmallnumberofoffshoreturbineshadbeeninstalledonjacketfoundations. In 2016, there are over 200 jackets installed on offshore wind farms. Trial sitessuch as Alpha Ventus and Beatrice have been used to evaluate a variety of jacket condition monitoring systems. As more complex sites are developed, jacket use is anticipated to increase. Industryadvisesthat,typically,60person-hoursofannualinspectionvisitsisrequiredforajacketcompared with 20 person-hours for a monopile foundation.Innovation: The remaining life of the foundation will be measured by installing permanent sensors at critical points and implementing remote monitoring and subsea inspections using autonomous systems. Improvements in jacket condition monitoring will increase in foundationCAPEXmarginally, but reduceunplannedOPEX, and lossesdue to unavailability.Relevance: The full value of this innovation is anticipated to be realised on all projects using jacketfoundations,thatis,10MW-SizeTurbinesonSiteTypeD.Commercial readiness: Two-thirds of the benefit of this innovation is anticipated to be available for projects with FID in 2020 with much of the rest available for projects with FID in 2025.Market share: This innovation is anticipated to be implemented on three-quarters of relevant projects(10MW-SizeTurbines)withFIDin2025and2030.
Improvements in inventory management
Practice today: Some wind turbine manufacturers have adopted systems such as radiofrequencyidentification(RFID)componenttaggingandelectronicconfigurationmanagement;however, tracking of turbine operational spares holding and use, and the clarity of recording turbine configuration are suboptimal.
64
Innovation: Adopting and further developing inventory management systems and processes has the potential to reduce the cost of both planned and unplanned OPEX by increasingknowledge of the configuration of the turbines, allowing appropriate parts to be dispatched. Suchsystemswillalsoallowproactivemanagementofinventorylevelsandtheabilitytobettercharacterise and analyse turbine fault patterns.More efficient dispatch is also anticipated toreduce the mean time to repair and hence unavailability losses.Relevance: It is anticipated that all of the value of this innovation will be realised on projects usingSiteTypeD,withmostavailablealsoforprojectsusingSiteTypeA.Commercial readiness: Almost all of the benefit of this innovation is anticipated to be available for projects with FID in 2020 and 2025. Market share: This innovation is anticipated to be implemented on three-quarters of projects with FID in 2020 and almost all projects with FID in 2025, with implementation almost universal by FID in 2030.
Future renewable energy costs: offshore wind
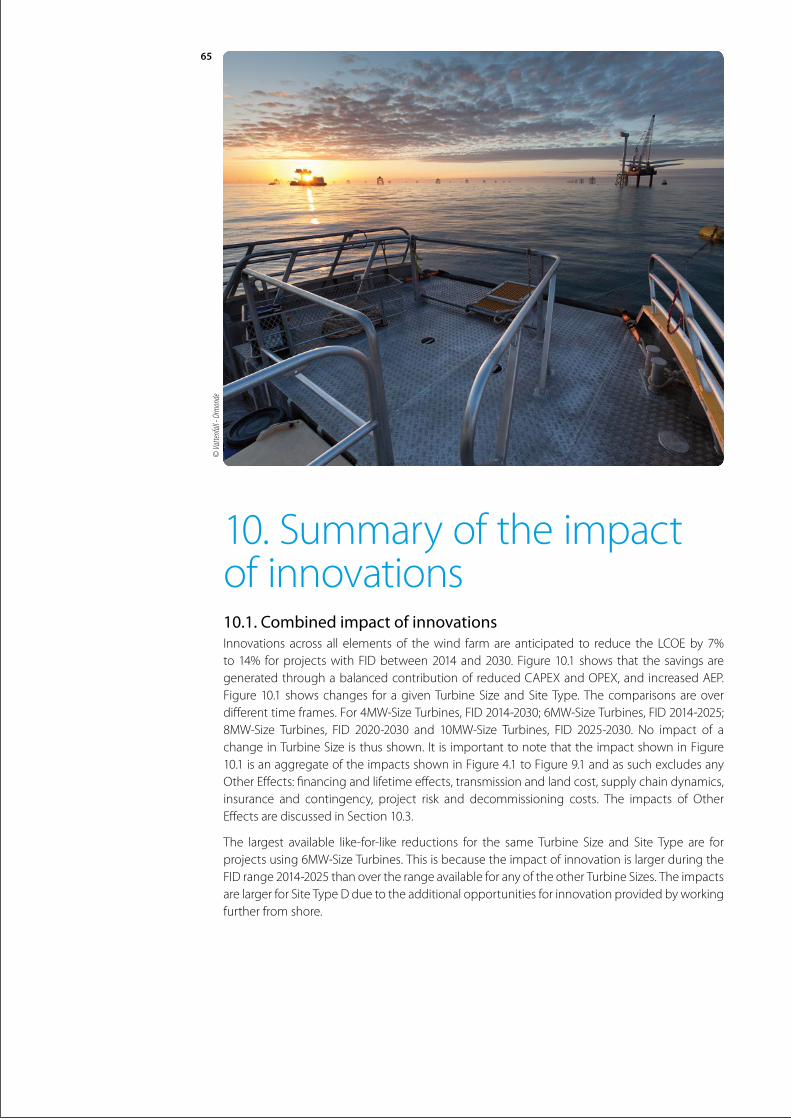
65
10.Summaryoftheimpactof innovations10.1. Combined impact of innovationsInnovations across all elements of thewind farmare anticipated to reduce the LCOEby 7%to14% forprojectswithFIDbetween2014and2030.Figure10.1 shows that the savingsaregeneratedthroughabalancedcontributionofreducedCAPEXandOPEX,andincreasedAEP.Figure10.1 showschanges for agivenTurbineSizeandSiteType. Thecomparisonsareoverdifferenttimeframes.For4MW-SizeTurbines,FID2014-2030;6MW-SizeTurbines,FID2014-2025;8MW-Size Turbines, FID 2020-2030 and 10MW-Size Turbines, FID 2025-2030. No impact of achangeinTurbineSizeisthusshown.ItisimportanttonotethattheimpactshowninFigure10.1isanaggregateoftheimpactsshowninFigure4.1toFigure9.1andassuchexcludesanyOtherEffects:financingandlifetimeeffects,transmissionandlandcost,supplychaindynamics,insurance and contingency, project risk and decommissioning costs. The impacts of OtherEffectsarediscussedinSection10.3.
The largest available like-for-like reductions for the same Turbine Size and Site Type are forprojectsusing6MW-SizeTurbines.ThisisbecausetheimpactofinnovationislargerduringtheFIDrange2014-2025thanovertherangeavailableforanyoftheotherTurbineSizes.TheimpactsarelargerforSiteTypeDduetotheadditionalopportunitiesforinnovationprovidedbyworkingfurther from shore.
© Va
ttenf
all -
Orm
onde
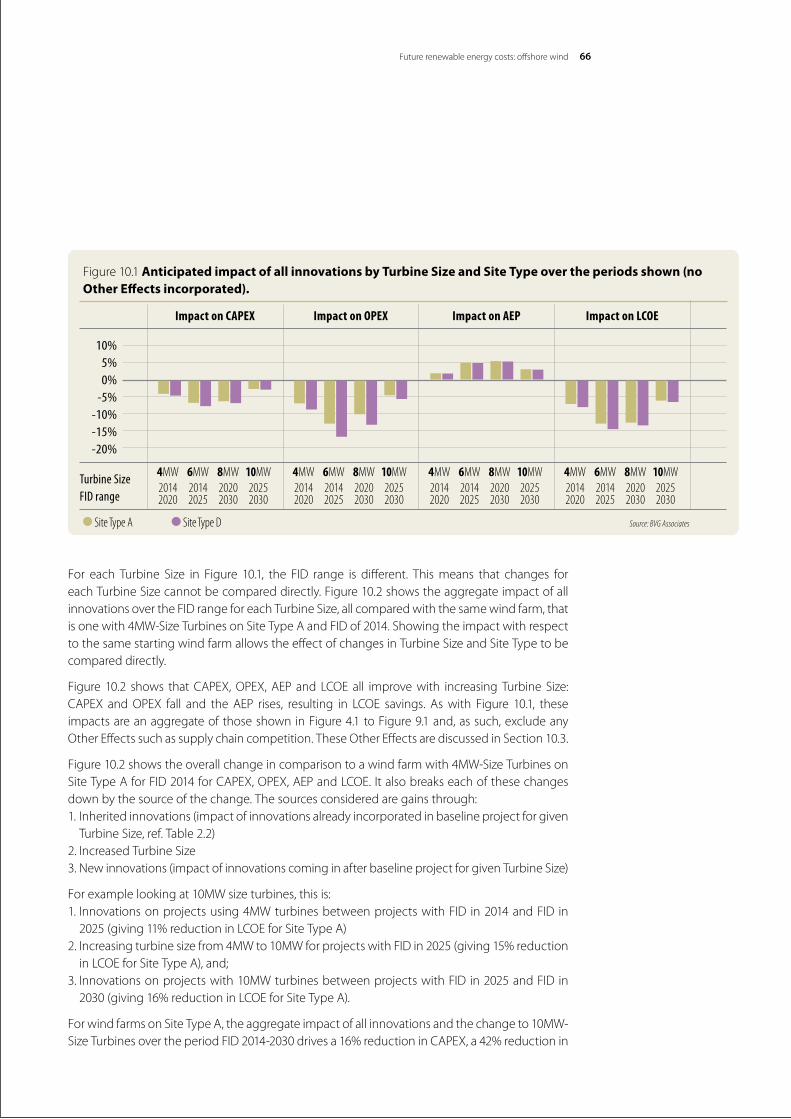
Future renewable energy costs: offshore wind 66
For each Turbine Size in Figure 10.1, the FID range is different. Thismeans that changes foreachTurbineSizecannotbecompareddirectly.Figure10.2showstheaggregateimpactofallinnovationsovertheFIDrangeforeachTurbineSize,allcomparedwiththesamewindfarm,thatisonewith4MW-SizeTurbinesonSiteTypeAandFIDof2014.ShowingtheimpactwithrespecttothesamestartingwindfarmallowstheeffectofchangesinTurbineSizeandSiteTypetobecompared directly.
Figure 10.2 shows thatCAPEX,OPEX,AEP and LCOE all improvewith increasing Turbine Size:CAPEX andOPEX fall and the AEP rises, resulting in LCOE savings. Aswith Figure 10.1, theseimpactsareanaggregateofthoseshowninFigure4.1toFigure9.1and,assuch,excludeanyOtherEffectssuchassupplychaincompetition.TheseOtherEffectsarediscussedinSection10.3.
Figure10.2showstheoverallchangeincomparisontoawindfarmwith4MW-SizeTurbinesonSiteTypeAforFID2014forCAPEX,OPEX,AEPandLCOE.Italsobreakseachofthesechangesdown by the source of the change. The sources considered are gains through:1.Inheritedinnovations(impactofinnovationsalreadyincorporatedinbaselineprojectforgivenTurbineSize,ref.Table2.2)
2.IncreasedTurbineSize3. Newinnovations(impactofinnovationscominginafterbaselineprojectforgivenTurbineSize)
Forexamplelookingat10MWsizeturbines,thisis:1.Innovationsonprojectsusing4MWturbinesbetweenprojectswithFID in2014andFID in2025(giving11%reductioninLCOEforSiteTypeA)
2.Increasingturbinesizefrom4MWto10MWforprojectswithFIDin2025(giving15%reductioninLCOEforSiteTypeA),and;
3.Innovationsonprojectswith10MWturbinesbetweenprojectswithFIDin2025andFIDin2030(giving16%reductioninLCOEforSiteTypeA).
ForwindfarmsonSiteTypeA,theaggregateimpactofallinnovationsandthechangeto10MW-SizeTurbinesovertheperiodFID2014-2030drivesa16%reductioninCAPEX,a42%reductionin
Figure 10.1 Anticipated impact of all innovations by Turbine Size and Site Type over the periods shown (no Other Effects incorporated).
10% 5% 0% -5% -10% -15% -20%
Turbine Size FID range
Impact on CAPEX Impact on OPEX Impact on AEP Impact on LCOE
•Site Type A •Site Type D
4MW20142020
6MW20142025
8MW20202030
10MW20252030
4MW20142020
6MW20142025
8MW20202030
10MW20252030
4MW20142020
6MW20142025
8MW20202030
10MW20252030
4MW20142020
6MW20142025
8MW20202030
10MW20252030
Source: BVG Associates
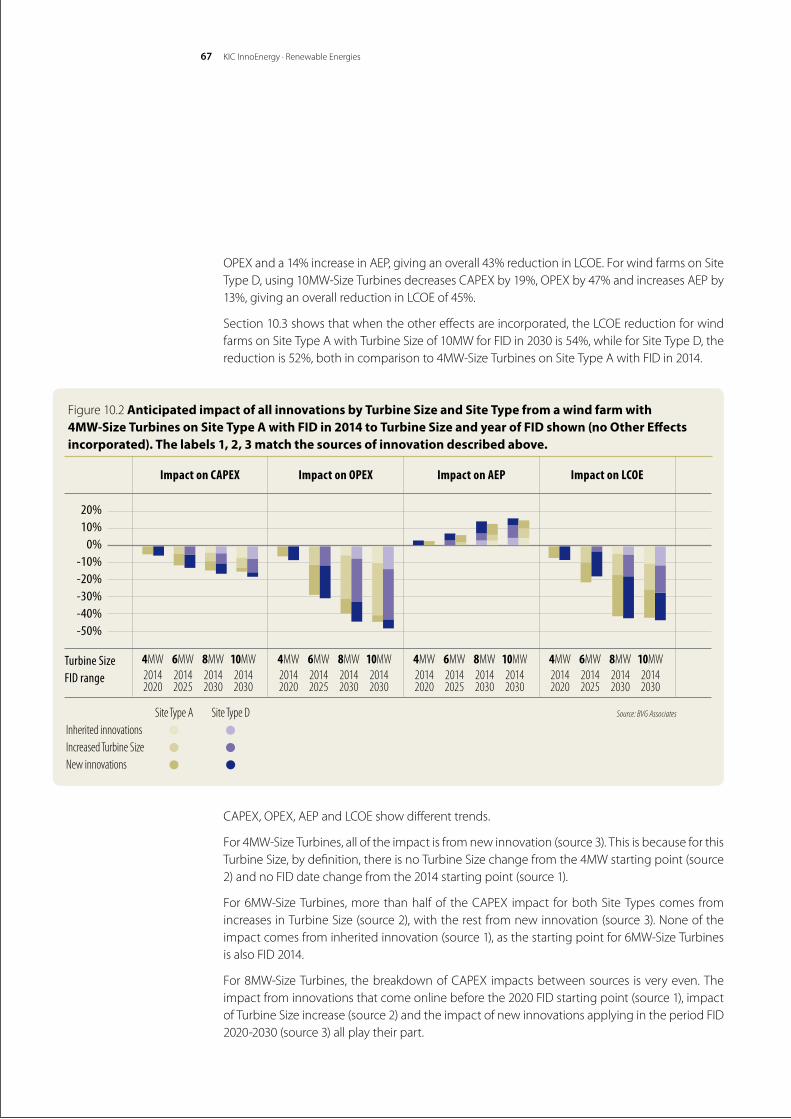
KIC InnoEnergy · Renewable Energies67
OPEXanda14%increaseinAEP,givinganoverall43%reductioninLCOE.ForwindfarmsonSiteTypeD,using10MW-SizeTurbinesdecreasesCAPEXby19%,OPEXby47%andincreasesAEPby13%,givinganoverallreductioninLCOEof45%.
Section10.3showsthatwhentheothereffectsareincorporated,theLCOEreductionforwindfarmsonSiteTypeAwithTurbineSizeof10MWforFIDin2030is54%,whileforSiteTypeD,thereductionis52%,bothincomparisonto4MW-SizeTurbinesonSiteTypeAwithFIDin2014.
CAPEX,OPEX,AEPandLCOEshowdifferenttrends.
For4MW-SizeTurbines,alloftheimpactisfromnewinnovation(source3).ThisisbecauseforthisTurbineSize,bydefinition,thereisnoTurbineSizechangefromthe4MWstartingpoint(source2)andnoFIDdatechangefromthe2014startingpoint(source1).
For6MW-SizeTurbines,more thanhalfof theCAPEX impact forbothSiteTypescomes fromincreasesinTurbineSize(source2),withtherestfromnewinnovation(source3).Noneoftheimpactcomesfrominheritedinnovation(source1),asthestartingpointfor6MW-SizeTurbinesisalsoFID2014.
For8MW-SizeTurbines, thebreakdownofCAPEX impactsbetweensources isveryeven.Theimpactfrominnovationsthatcomeonlinebeforethe2020FIDstartingpoint(source1),impactofTurbineSizeincrease(source2)andtheimpactofnewinnovationsapplyingintheperiodFID2020-2030(source3)allplaytheirpart.
Figure 10.2 Anticipated impact of all innovations by Turbine Size and Site Type from a wind farm with 4MW-Size Turbines on Site Type A with FID in 2014 to Turbine Size and year of FID shown (no Other Effects incorporated). The labels 1, 2, 3 match the sources of innovation described above.
20% 10% 0% -10% -20% -30% -40% -50%
Turbine Size FID range
Impact on CAPEX Impact on OPEX Impact on AEP Impact on LCOE
4MW2014 2020
6MW2014 2025
8MW2014 2030
10MW2014 2030
4MW2014 2020
6MW2014 2025
8MW2014 2030
10MW2014 2030
4MW2014 2020
6MW2014 2025
8MW2014 2030
10MW2014 2030
4MW2014 2020
6MW2014 2025
8MW2014 2030
10MW2014 2030
Site Type A Site Type D • • • • • •
Inherited innovations Increased Turbine SizeNew innovations
Source: BVG Associates
Future renewable energy costs: offshore wind 68
For10MW-SizeTurbines, theopportunity for improvement inCAPEXcosts for theFIDperiod2025-2030(source3)issmallerthanforFIDperiod2014-2025(source1).Theproportionofthebreakdownduetonewinnovationsisthussmallerinthecaseofthe10MW-SizeTurbinesthanforthe8MW-SizeTurbines.
ForOPEX,themainsourceofchangeisinTurbineSizeincrease(source2).ThisisbecausethenumberofcomponentsperMWneededtomaintain,andtoserviceintheeventoffailuresissignificantlysmaller.IncomparisontoCAPEX,theimpactsfrominnovationsinheritedandnewinnovations(sources1and3)arelarge.
For the AEP impact, the increase in Turbine Size (especially with increasing hub-height) isimportant(source2),butnotasimportantasforCAPEXorOPEX.ForAEP,thenewinnovations(source3)contributealargerproportionofthesplitbysourcethanfortheCAPEXorOPEX.
TheeffectsofnewinnovationsonLCOEareparticularlyimportantforthe8MW-SizeTurbines;there isalsoastrongeffect for the10MW-SizeTurbinesbut theseare less than for8MW-SizeTurbines because they are available for a shorter period. The isolated effect of increasing Turbine Sizefrom4MWto10MW(withouttheeffectofinheritedornewinnovations(sources1and3)overtheperiod)isresponsibleforanLCOEsavingof15%.
10.2. Relative impact of cost of each wind farm elementFigure10.3showsthecostofallCAPEXelementsforallcombinationsofTurbineSize,SiteTypeandFIDdateandFigure10.4showsthesameforOPEXandnetcapacityfactor.Thesefiguresshow the reduction in costs and increases in capacity factor over time for a given combination ofTurbineSizeandSiteType,aswellastherelativecostsbetweendifferentTurbineSizesandSiteTypes.
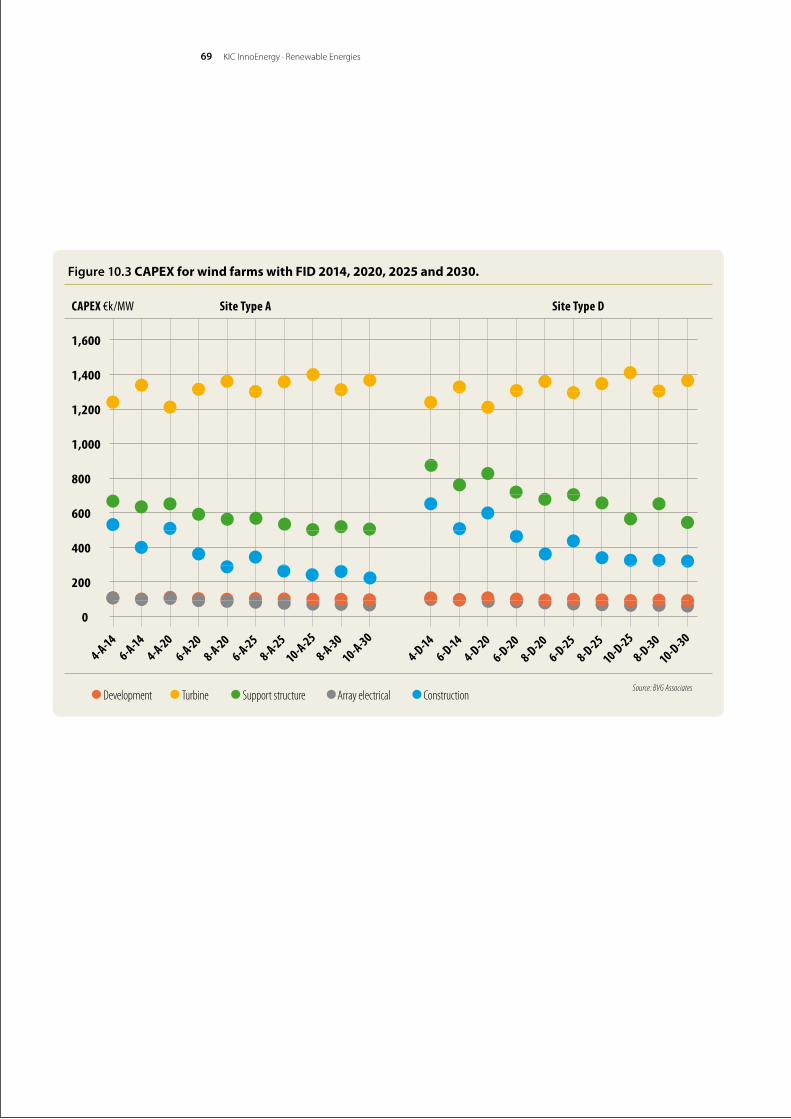
69 KICInnoEnergy·RenewableEnergies
Figure 10.3 CAPEX for wind farms with FID 2014, 2020, 2025 and 2030.
CAPEX €k/MW Site Type A Site Type D
1,600
1,400
1,200
1,000
800
600
400
200
0
•Development •Turbine •Support structure •Array electrical •Construction
4-A-144-D-14
6-A-146-D-14
4-A-204-D-20
6-A-206-D-20
8-A-206-A-25
8-D-206-D-25
8-A-258-D-25
10-A-25
10-D-258-A-30
8-D-3010-A-30
10-D-30
Source: BVG Associates
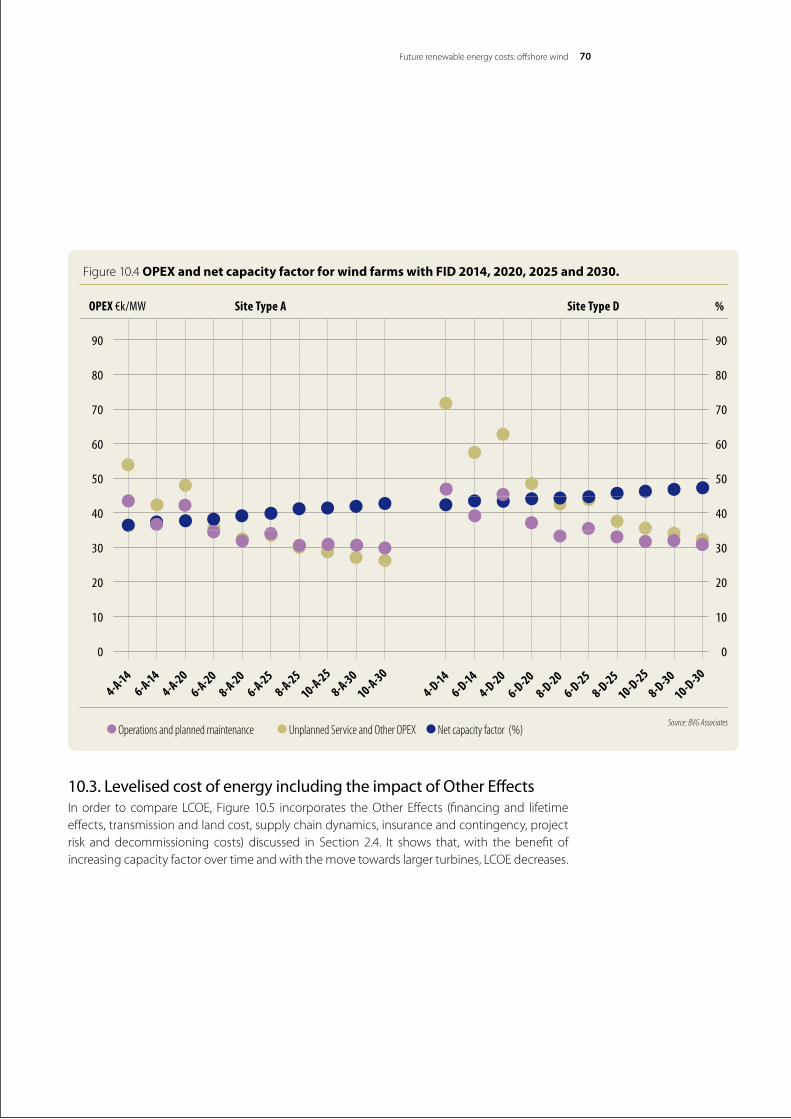
Future renewable energy costs: offshore wind 70
10.3. Levelised cost of energy including the impact of Other EffectsInorder to compare LCOE, Figure10.5 incorporates theOther Effects (financingand lifetimeeffects, transmission and land cost, supply chain dynamics, insurance and contingency, project risk and decommissioning costs) discussed in Section 2.4. It shows that,with the benefit ofincreasingcapacityfactorovertimeandwiththemovetowardslargerturbines,LCOEdecreases.
Figure10.4 OPEX and net capacity factor for wind farms with FID 2014, 2020, 2025 and 2030.
OPEX €k/MW Site Type A Site Type D %
90
80
70
60
50
40
30
20
10
0
4-A-144-D-14
6-A-146-D-14
4-A-204-D-20
6-A-206-D-20
8-A-206-A-25
8-D-206-D-25
8-A-258-D-25
10-A-25
10-D-258-A-30
8-D-3010-A-30
10-D-30
•Operations and planned maintenance •Unplanned Service and Other OPEX •Net capacity factor (%)
90
80
70
60
50
40
30
20
10
0
Source: BVG Associates
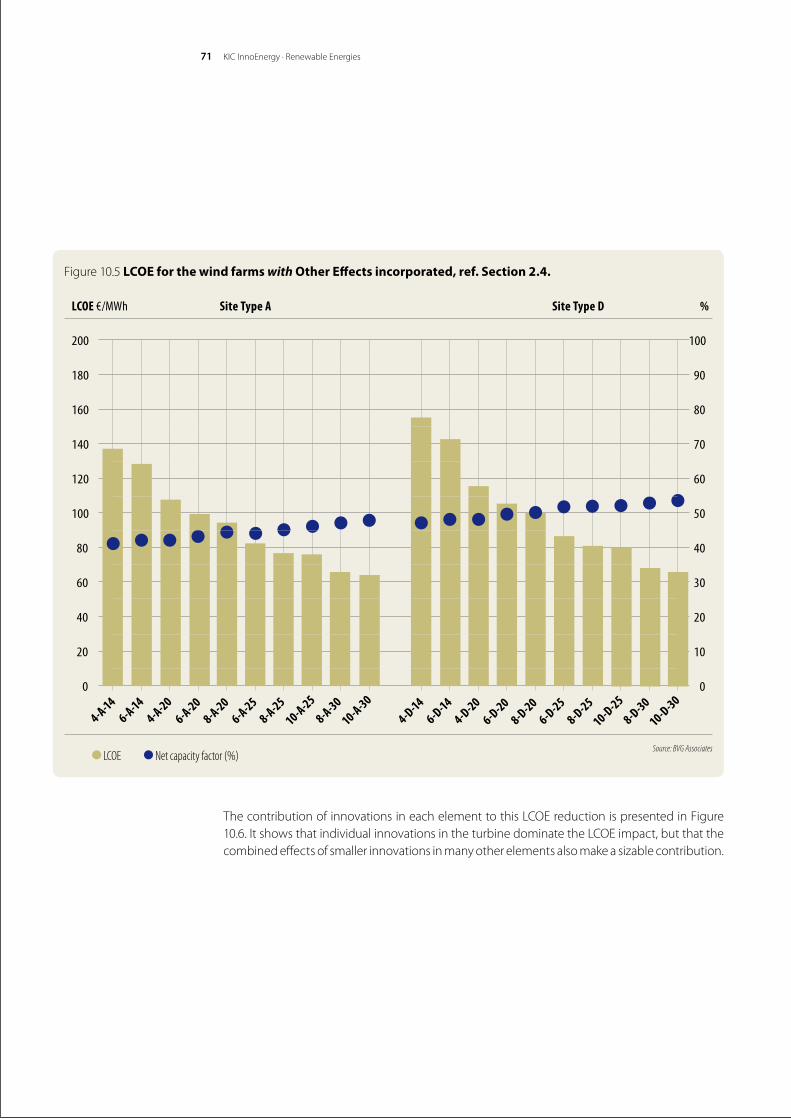
71
ThecontributionofinnovationsineachelementtothisLCOEreductionispresentedinFigure10.6.ItshowsthatindividualinnovationsintheturbinedominatetheLCOEimpact,butthatthecombined effects of smaller innovations in many other elements also make a sizable contribution.
KICInnoEnergy·RenewableEnergies
Figure 10.5 LCOE for the wind farms with Other Effects incorporated, ref. Section 2.4.
LCOE €/MWh Site Type A Site Type D %
200
180
160
140
120
100
80
60
40
20
0
4-A-144-D-14
6-A-146-D-14
4-A-204-D-20
6-A-206-D-20
8-A-206-A-25
8-D-206-D-25
8-A-258-D-25
10-A-25
10-D-258-A-30
8-D-3010-A-30
10-D-30
100
90
80
70
60
50
40
30
20
10
0
•LCOE •Net capacity factor (%) Source: BVG Associates
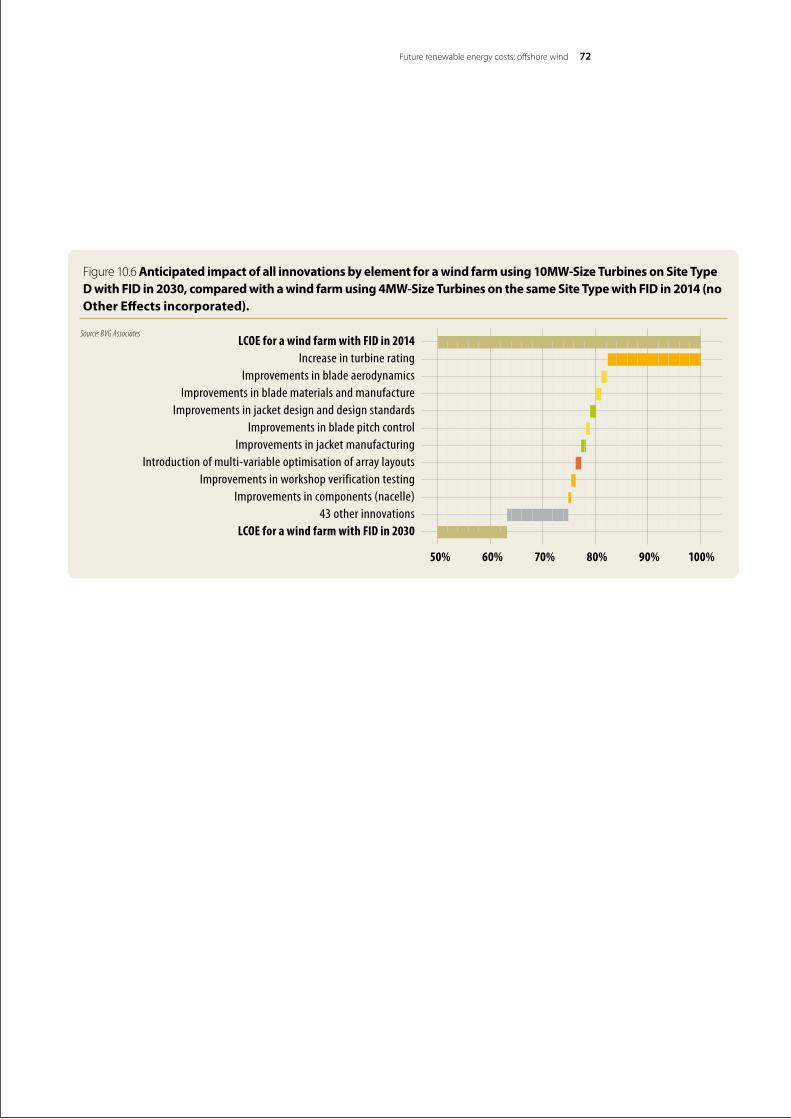
Future renewable energy costs: offshore wind 72
Figure10.6 Anticipated impact of all innovations by element for a wind farm using 10MW-Size Turbines on Site Type D with FID in 2030, compared with a wind farm using 4MW-Size Turbines on the same Site Type with FID in 2014 (no Other Effects incorporated).
LCOE for a wind farm with FID in 2014Increase in turbine rating
Improvements in blade aerodynamicsImprovements in blade materials and manufacture
Improvements in jacket design and design standardsImprovements in blade pitch control
Improvements in jacket manufacturingIntroduction of multi-variable optimisation of array layouts
Improvements in workshop verification testingImprovements in components (nacelle)
43 other innovationsLCOE for a wind farm with FID in 2030
50% 60% 70% 80% 90% 100%
Source: BVG Associates
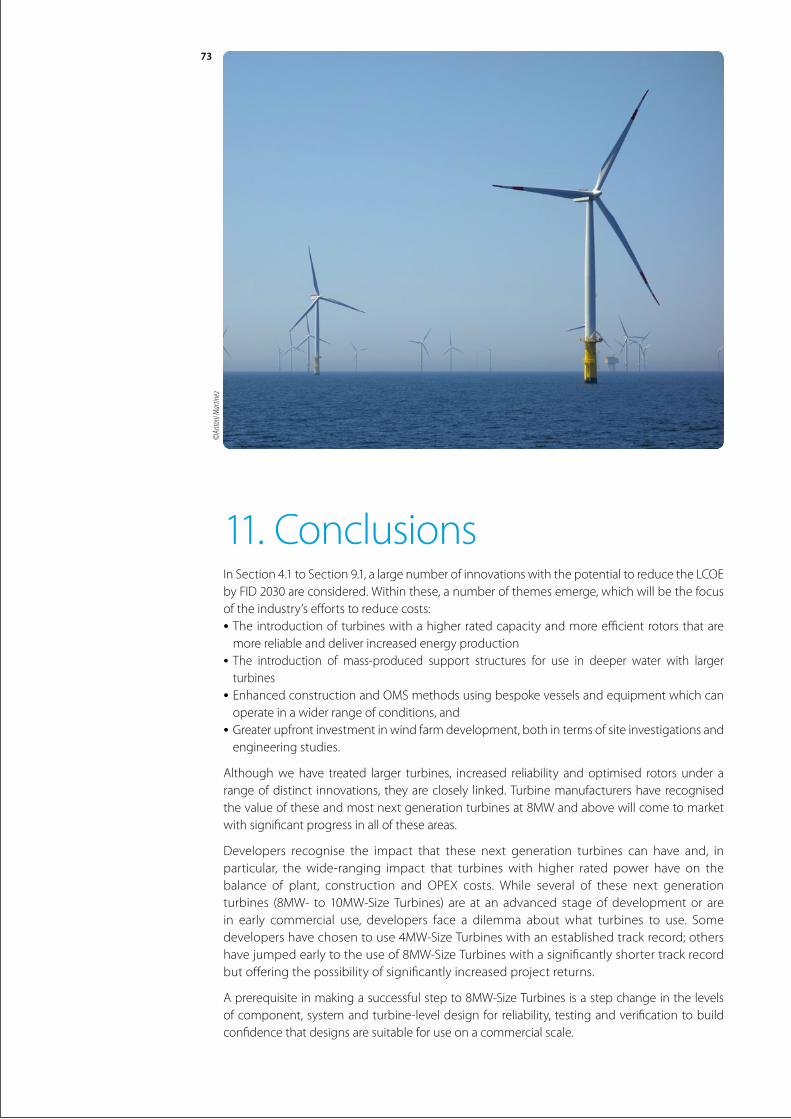
73
11.ConclusionsInSection4.1toSection9.1,alargenumberofinnovationswiththepotentialtoreducetheLCOEby FID 2030 are considered. Within these, a number of themes emerge, which will be the focus oftheindustry’seffortstoreducecosts:•The introduction of turbines with a higher rated capacity and more efficient rotors that are
more reliable and deliver increased energy production•The introduction of mass-produced support structures for use in deeper water with larger
turbines•EnhancedconstructionandOMSmethodsusingbespokevesselsandequipmentwhichcan
operate in a wider range of conditions, and•Greater upfront investment in wind farm development, both in terms of site investigations and
engineering studies.
Although we have treated larger turbines, increased reliability and optimised rotors under a range of distinct innovations, they are closely linked. Turbine manufacturers have recognised thevalueoftheseandmostnextgenerationturbinesat8MWandabovewillcometomarketwith significant progress in all of these areas.
Developers recognise the impact that these next generation turbines can have and, in particular, the wide-ranging impact that turbines with higher rated power have on the balance of plant, construction and OPEX costs. While several of these next generationturbines (8MW- to10MW-SizeTurbines) are at anadvanced stageofdevelopmentor arein early commercial use, developers face a dilemma about what turbines to use. Somedevelopershavechosentouse4MW-SizeTurbineswithanestablishedtrackrecord;othershavejumpedearlytotheuseof8MW-SizeTurbineswithasignificantlyshortertrackrecordbut offering the possibility of significantly increased project returns.
Aprerequisiteinmakingasuccessfulstepto8MW-SizeTurbinesisastepchangeinthelevelsof component, system and turbine-level design for reliability, testing and verification to build confidence that designs are suitable for use on a commercial scale.
©An
toni
Mar
tinez
Future renewable energy costs: offshore wind 74
This will need to be accompanied by an increase in the quality assurance and quality control processes right through the supply chain, including for many low cost turbine components. This activity needs to be further opened to wind farm developer scrutiny to build confidence in manufacturers’commitmenttoreliability.
This focus on larger turbines and the increase in water depth of projects in development below 35m dictates a shift away from the monopile foundations that have dominated the market to date. Recent experience has been that this trend has been slower than initially expected due to greater understanding of monopiles design and development of larger-scale manufacturing and installation tooling.Severaldecadesofoffshoreoilandgasextractionand largebridge-building projects have delivered proven technologies in the form of space-frame structures such as jackets and concrete gravity bases. The offshore wind industry will use these technologies more, but recognises that changes to the design are needed to reflect the increased quantities of similar structures required, the higher focus on cost, the changed design margins and the greater importance of fatigue loading.
For novel foundation designs, test sites are needed to prove the concept and, as importantly, the installation methods. For example, the underlying technology for concrete gravity bases is sound, but developers will need confidence that they can be manufactured and installed efficiently in volume. This drives additional requirements in terms of demonstrating new technology using multiple units.
Offshorewindvesselpractices,bothduringconstructionandOMS,arestillnotfullydevelopedand future projects in deeper water and further from shore increase the scale and complexity of the work. A key element in maturing this area is investing in new fit-for-purpose vessels and equipment. This process is underway for turbine installation, aided by a relatively clear view of the physical parameters of next generation hardware. This is less true for foundation installation. While there is widespread recognition that jack-up vessels may not be the best solution, there is less certainty about what should replace them. Feedback from industry is that jacket structures are generally the preferred solution where monopiles cannot be used cost effectively and installation contractors should be in a position to refine vessel design concepts while retaining flexibility with new designs of sea fastenings.
Another recurring theme in this study has been the value in greater upfront investment in wind farm development, both in terms of site investigations and engineering studies. For example, a focus on optimising layout not only based on energy production but also taking intoaccountthe impactonCAPEXofdifferentgroundconditionsandwaterdepths,alongwith an improved understanding ofwake effects,will reduce the LCOE. In addition,moreextensive cable route characterisation on average will reduce quoted costs and, in all cases, reducetherisksassociatedwithcable-laying.Muchprogressintheseareashasalreadybeenmade, but there is more to do.
Over 50 technology innovations have been identified as having the potential to cause asubstantive change in the design of hardware, software or process, with an impact on the cost of energy.Manymore technical innovations are in development and so someofthosedescribedinthisreportmaywellbesupersededbyothers.Overall,however,industryexpectation is that the level of cost of energy reduction is consistent with the findings of this analysis.

KIC InnoEnergy · Renewable Energies75
Indeed, in most cases, the anticipated impact of each innovation has been significantly moderated downwards in order to give overall levels of cost of energy reduction in line with industry expectations. The availability of such a range of innovations with the potential to impact LCOEmorethanshowngivesconfidencethatthepicturedescribedisachievable.
Inaddition,largeLCOEreductionsareavailablethroughsomeoftheOtherEffectsconsideredinSection2.4.Improvedfinancingarrangementsandreducedriskcanhavesignificanteffectsascan competition in the supply chain.
76
12.AboutKICInnoEnergyKIC InnoEnergy is a European company driving innovation and entrepreneurship in thesustainable energy field, by bringing together academics, business and research sectors.
•We provide acceleration services to startups and ventures by supporting entrepreneurs with their business ideas, strengthening their business models, building expert teams, and providing access to finance.•We support innovation in the field and bring innovative ideas to life that have a positive
impact on sustainable energy in Europe.•WeprovideMaster andPhDeducationalprogrammes thatdeliver knowledgeand skills to
students and managers that will shape the future of the energy sector.
KICInnoEnergyisoneofthefirstthreeKnowledgeandInnovationCommunities(KICs)createdunder the leadership of the European Institute of Innovation and Technology (EIT). We area commercial company with 27 shareholders that include top ranking industries, research centresanduniversities-allofthemkeyplayersintheenergyfield.(SeeFigure12.1)
We are headquartered in theNetherlands, andmanageour activities throughoffices acrossEuropeinBelgium,France,Germany,theNetherlands,Poland,Portugal,SpainandSweden.
Wearecommittedtoreducingcostsintheenergyvaluechain,increasingsecurityandreducingCO2 and
other greenhouse gas emissions. To achieve this, we focus our activities around eight thematic areas:
• Energy Storage• Energy from Chemical Fuels• Sustainable Nuclear and Renewable Energy Convergence• Smart and Efficient Cities and Buildings• Clean Coal Technologies• Smart Electric Grid• Renewable Energies, and• Energy Efficiency
© N
ASA
Earth
Obs
erva
tory
imag
e by R
ober
t Sim
mon
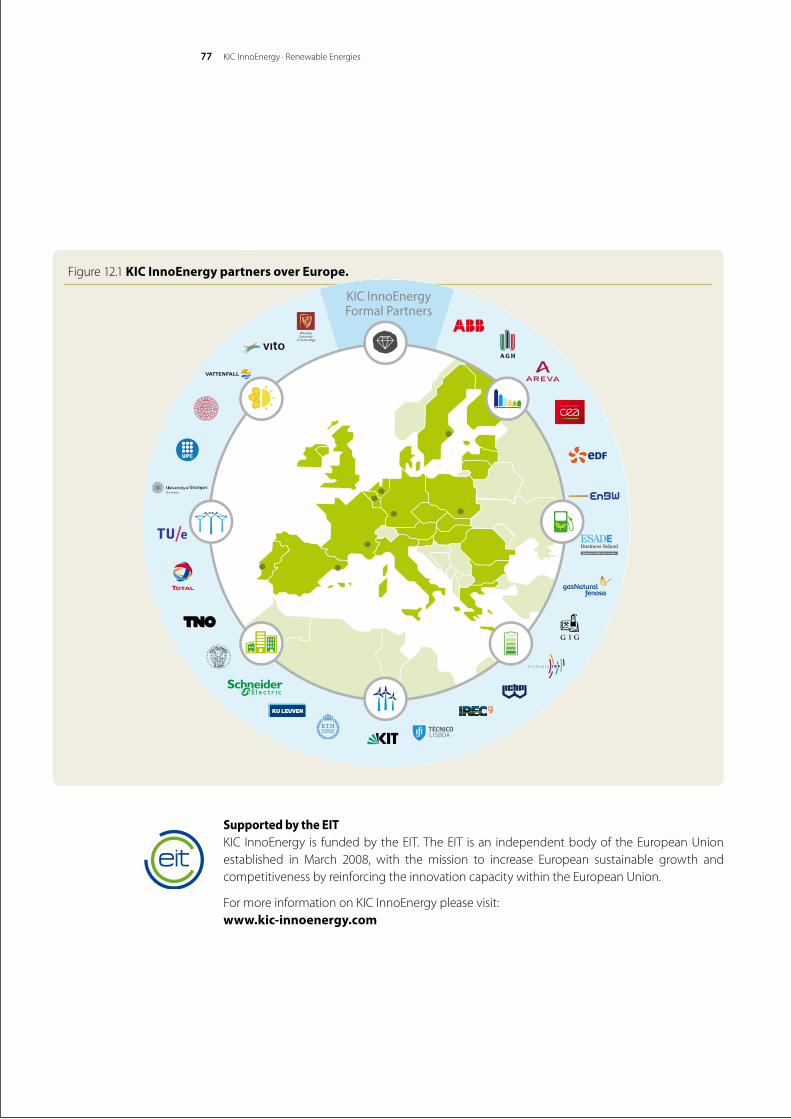
KIC InnoEnergy · Renewable Energies77
Supported by the EITKIC InnoEnergy is fundedbytheEIT.TheEIT isan independentbodyof theEuropeanUnionestablished in March 2008, with the mission to increase European sustainable growth andcompetitiveness by reinforcing the innovation capacity within the European Union.
FormoreinformationonKICInnoEnergypleasevisit: www.kic-innoenergy.com
Figure 12.1 KIC InnoEnergy partners over Europe.
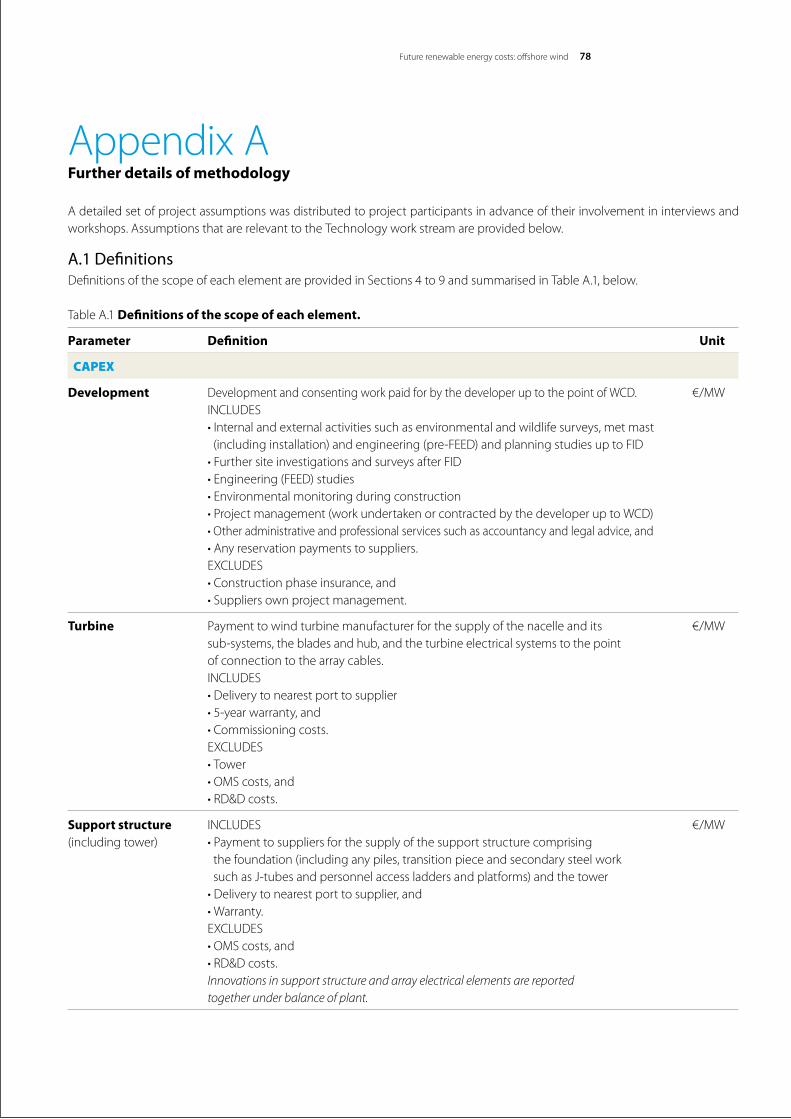
Future renewable energy costs: offshore wind 78
Appendix AFurther details of methodology
A detailed set of project assumptions was distributed to project participants in advance of their involvement in interviews and workshops. Assumptions that are relevant to the Technology work stream are provided below.
A.1 DefinitionsDefinitionsofthescopeofeachelementareprovidedinSections4to9andsummarisedinTableA.1,below.
Table A.1 Definitions of the scope of each element.
Parameter Definition Unit
CAPEX
Development DevelopmentandconsentingworkpaidforbythedeveloperuptothepointofWCD. €/MW INCLUDES •Internalandexternalactivitiessuchasenvironmentalandwildlifesurveys,metmast (includinginstallation)andengineering(pre-FEED)andplanningstudiesuptoFID •FurthersiteinvestigationsandsurveysafterFID •Engineering(FEED)studies •Environmentalmonitoringduringconstruction •Projectmanagement(workundertakenorcontractedbythedeveloperuptoWCD) •Otheradministrativeandprofessionalservicessuchasaccountancyandlegaladvice,and •Anyreservationpaymentstosuppliers. EXCLUDES •Constructionphaseinsurance,and •Suppliersownprojectmanagement.
Turbine Paymenttowindturbinemanufacturerforthesupplyofthenacelleandits €/MW sub-systems, the blades and hub, and the turbine electrical systems to the point of connection to the array cables. INCLUDES •Deliverytonearestporttosupplier •5-yearwarranty,and •Commissioningcosts. EXCLUDES •Tower •OMScosts,and •RD&Dcosts.
Support structure INCLUDES €/MW (includingtower) •Paymenttosuppliersforthesupplyofthesupportstructurecomprising thefoundation(includinganypiles,transitionpieceandsecondarysteelwork suchasJ-tubesandpersonnelaccessladdersandplatforms)andthetower •Deliverytonearestporttosupplier,and •Warranty. EXCLUDES •OMScosts,and •RD&Dcosts. Innovations in support structure and array electrical elements are reported together under balance of plant.
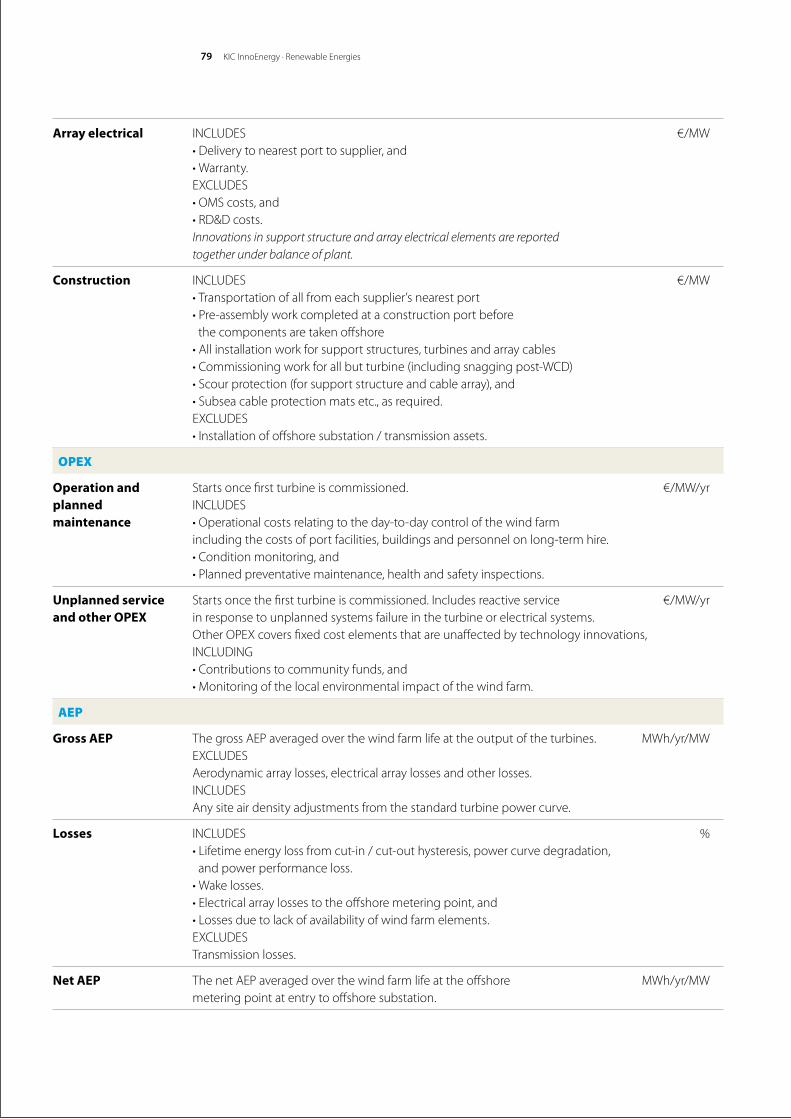
KIC InnoEnergy · Renewable Energies79
Array electrical INCLUDES €/MW •Deliverytonearestporttosupplier,and •Warranty. EXCLUDES •OMScosts,and •RD&Dcosts. Innovations in support structure and array electrical elements are reported together under balance of plant.
Construction INCLUDES €/MW •Transportationofallfromeachsupplier’snearestport •Pre-assemblyworkcompletedataconstructionportbefore the components are taken offshore •Allinstallationworkforsupportstructures,turbinesandarraycables •Commissioningworkforallbutturbine(includingsnaggingpost-WCD) •Scourprotection(forsupportstructureandcablearray),and •Subseacableprotectionmatsetc.,asrequired. EXCLUDES •Installationofoffshoresubstation/transmissionassets.
OPEX
Operation and Startsoncefirstturbineiscommissioned. €/MW/yr planned INCLUDES maintenance •Operationalcostsrelatingtotheday-to-daycontrolofthewindfarm including the costs of port facilities, buildings and personnel on long-term hire. •Conditionmonitoring,and •Plannedpreventativemaintenance,healthandsafetyinspections.
Unplanned service Startsoncethefirstturbineiscommissioned.Includesreactiveservice €/MW/yr and other OPEX in response to unplanned systems failure in the turbine or electrical systems. OtherOPEXcoversfixedcostelementsthatareunaffectedbytechnologyinnovations, INCLUDING •Contributionstocommunityfunds,and •Monitoringofthelocalenvironmentalimpactofthewindfarm.
AEP
Gross AEP ThegrossAEPaveragedoverthewindfarmlifeattheoutputoftheturbines. MWh/yr/MW EXCLUDES Aerodynamic array losses, electrical array losses and other losses. INCLUDES Any site air density adjustments from the standard turbine power curve.
Losses INCLUDES % •Lifetimeenergylossfromcut-in/cut-outhysteresis,powercurvedegradation, and power performance loss. •Wakelosses. •Electricalarraylossestotheoffshoremeteringpoint,and •Lossesduetolackofavailabilityofwindfarmelements. EXCLUDES Transmission losses.
Net AEP ThenetAEPaveragedoverthewindfarmlifeattheoffshore MWh/yr/MW metering point at entry to offshore substation.
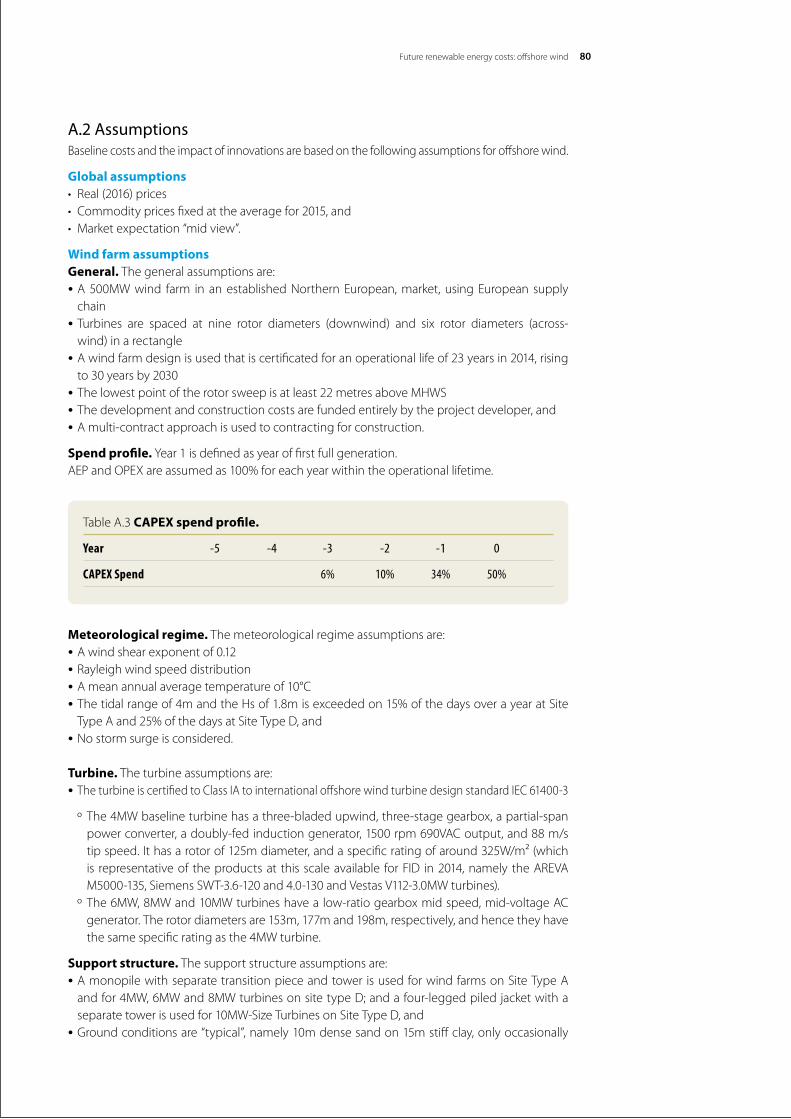
Future renewable energy costs: offshore wind 80
A.2 AssumptionsBaseline costs and the impact of innovations are based on the following assumptions for offshore wind.
Global assumptions• Real(2016)prices• Commoditypricesfixedattheaveragefor2015,and• Marketexpectation“midview”.
Wind farm assumptionsGeneral. The general assumptions are:•A500MWwind farm in anestablishedNorthernEuropean,market, usingEuropean supply
chain•Turbines are spaced at nine rotor diameters (downwind) and six rotor diameters (across-wind)inarectangle•Awindfarmdesignisusedthatiscertificatedforanoperationallifeof23yearsin2014,rising
to 30 years by 2030•Thelowestpointoftherotorsweepisatleast22metresaboveMHWS•The development and construction costs are funded entirely by the project developer, and •A multi-contract approach is used to contracting for construction.
Spend profile. Year 1 is defined as year of first full generation.AEPandOPEXareassumedas100%foreachyearwithintheoperationallifetime.
Meteorological regime. The meteorological regime assumptions are:•A wind shear exponent of 0.12•Rayleigh wind speed distribution•Ameanannualaveragetemperatureof10°C•Thetidalrangeof4mandtheHsof1.8misexceededon15%ofthedaysoverayearatSiteTypeAand25%ofthedaysatSiteTypeD,and•Nostormsurgeisconsidered.
Turbine. The turbine assumptions are:•TheturbineiscertifiedtoClassIAtointernationaloffshorewindturbinedesignstandardIEC61400-3 º The4MWbaselineturbinehasathree-bladedupwind,three-stagegearbox,apartial-span
powerconverter,adoubly-fedinductiongenerator,1500rpm690VACoutput,and88m/stipspeed.Ithasarotorof125mdiameter,andaspecificratingofaround325W/m²(whichis representativeof theproductsat thisscaleavailable forFID in2014,namely theAREVAM5000-135,SiemensSWT-3.6-120and4.0-130andVestasV112-3.0MWturbines).
º The6MW,8MWand10MWturbineshavealow-ratiogearboxmidspeed,mid-voltageACgenerator.Therotordiametersare153m,177mand198m,respectively,andhencetheyhavethesamespecificratingasthe4MWturbine.
Support structure. The support structure assumptions are:•Amonopilewithseparatetransitionpieceandtower isusedforwindfarmsonSiteTypeAandfor4MW,6MWand8MWturbinesonsitetypeD;andafour-leggedpiledjacketwithaseparatetowerisusedfor10MW-SizeTurbinesonSiteTypeD,and•Ground conditions are “typical”, namely 10m dense sand on 15m stiff clay, only occasionally
Table A.3 CAPEX spend profile.
Year -5 -4 -3 -2 -1 0
CAPEX Spend 6% 10% 34% 50%
KIC InnoEnergy · Renewable Energies81
with locations with lower bearing pressure, the presence of boulders or significant gradients.
Array electrical. Thearrayelectricalassumptionisthatathreecore33kVACcableinfullyflexible strings is used, that is, with provision to isolate an individual turbine.
Construction. The construction assumptions are:•Constructioniscarriedoutsequentiallybythefoundation,arraycable,thenthepre-assembled
tower and turbine together •A jack-up vessel collects components from the construction port for turbine installation•A single jack-up is used to install the monopile and transition pieces•Two jack-ups are used for jacket installation and pre-piling, collecting components from the
construction port, and•ArraycablesareinstalledviaJ-tubes,withseparatecablelayandsurveyandburial.•Decommissioningreversestheassemblyprocesstoresultinconstructiontakingoneyear.Piles
and cables are cut off at a depth below the sea bed, which is unlikely to lead to uncovering. Environmental monitoring is conducted at the end. The residual value and cost of scrapping are ignored.
OMS. BaselineaccessisbyworkboatsforSiteTypeAandmothershipsoraccommodationplatformsforSiteTypeD,whilejack-upsareusedformajorcomponentreplacement.
A.3 Other effects ThetablebelowcorrespondstodefinitionsmadeinSection2.4.Thesefiguresarederivedfrominternal BVGA modelling, first used in the Offshore Wind Cost Reduction Pathways Study and are provided for completeness. They do not form an integral part of the study.
DECEX includes•Planningworkanddesignofanyadditionalequipmentrequired•Removal of the turbine and support structure to meet legal obligations, and•Further environmental work and monitoring.
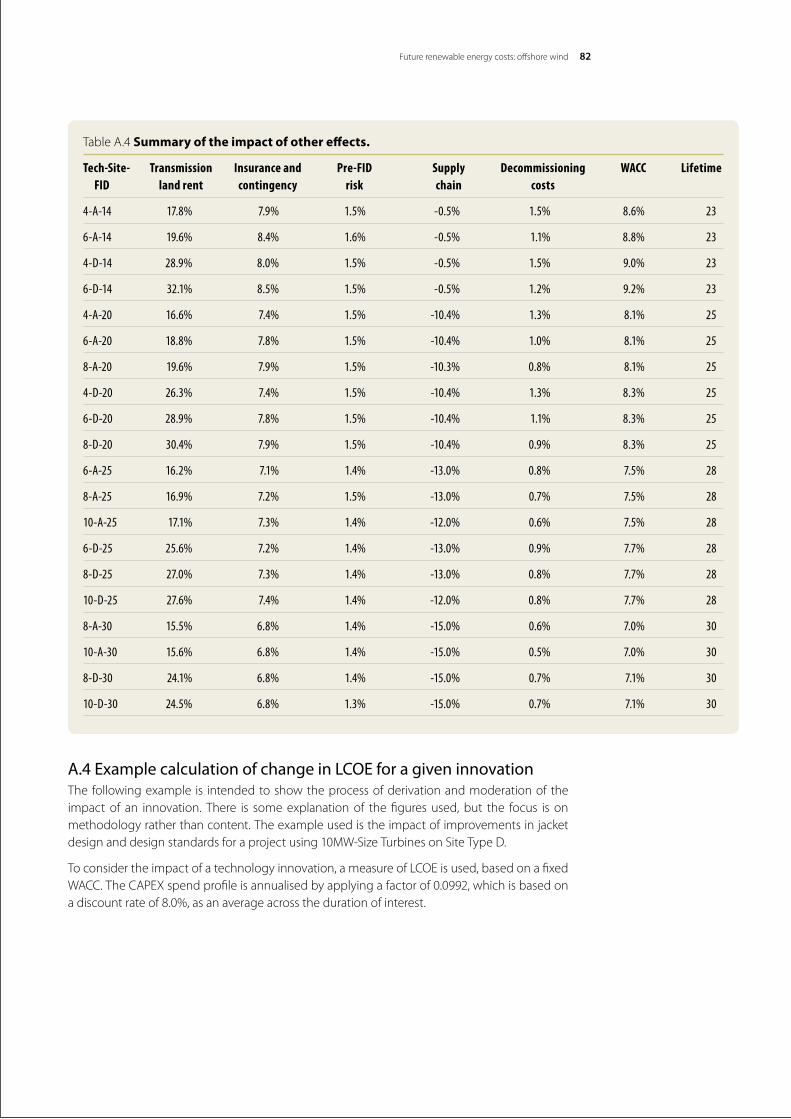
Future renewable energy costs: offshore wind 82
A.4 Example calculation of change in LCOE for a given innovationThe following example is intended to show the process of derivation and moderation of the impact of an innovation. There is some explanation of the figures used, but the focus is on methodology rather than content. The example used is the impact of improvements in jacket designanddesignstandardsforaprojectusing10MW-SizeTurbinesonSiteTypeD.
Toconsidertheimpactofatechnologyinnovation,ameasureofLCOEisused,basedonafixedWACC.TheCAPEXspendprofileisannualisedbyapplyingafactorof0.0992,whichisbasedonadiscountrateof8.0%,asanaverageacrossthedurationofinterest.
TableA.4Summary of the impact of other effects.
Tech-Site- Transmission Insurance and Pre-FID Supply Decommissioning WACC Lifetime FID land rent contingency risk chain costs
4-A-14 17.8% 7.9% 1.5% -0.5% 1.5% 8.6% 23
6-A-14 19.6% 8.4% 1.6% -0.5% 1.1% 8.8% 23
4-D-14 28.9% 8.0% 1.5% -0.5% 1.5% 9.0% 23
6-D-14 32.1% 8.5% 1.5% -0.5% 1.2% 9.2% 23
4-A-20 16.6% 7.4% 1.5% -10.4% 1.3% 8.1% 25
6-A-20 18.8% 7.8% 1.5% -10.4% 1.0% 8.1% 25
8-A-20 19.6% 7.9% 1.5% -10.3% 0.8% 8.1% 25
4-D-20 26.3% 7.4% 1.5% -10.4% 1.3% 8.3% 25
6-D-20 28.9% 7.8% 1.5% -10.4% 1.1% 8.3% 25
8-D-20 30.4% 7.9% 1.5% -10.4% 0.9% 8.3% 25
6-A-25 16.2% 7.1% 1.4% -13.0% 0.8% 7.5% 28
8-A-25 16.9% 7.2% 1.5% -13.0% 0.7% 7.5% 28
10-A-25 17.1% 7.3% 1.4% -12.0% 0.6% 7.5% 28
6-D-25 25.6% 7.2% 1.4% -13.0% 0.9% 7.7% 28
8-D-25 27.0% 7.3% 1.4% -13.0% 0.8% 7.7% 28
10-D-25 27.6% 7.4% 1.4% -12.0% 0.8% 7.7% 28
8-A-30 15.5% 6.8% 1.4% -15.0% 0.6% 7.0% 30
10-A-30 15.6% 6.8% 1.4% -15.0% 0.5% 7.0% 30
8-D-30 24.1% 6.8% 1.4% -15.0% 0.7% 7.1% 30
10-D-30 24.5% 6.8% 1.3% -15.0% 0.7% 7.1% 30
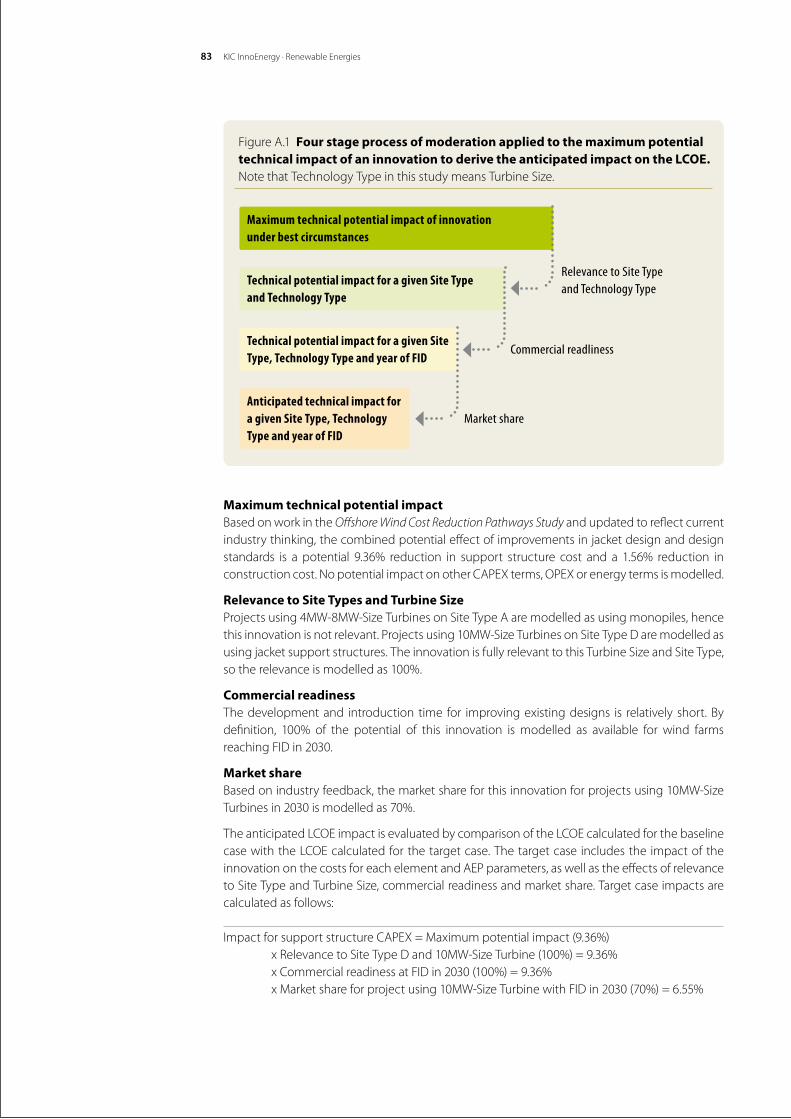
KIC InnoEnergy · Renewable Energies83
Maximum technical potential impactBased on work in the Offshore Wind Cost Reduction Pathways Study and updated to reflect current industry thinking, the combined potential effect of improvements in jacket design and design standards is a potential 9.36% reduction in support structure cost and a 1.56% reduction inconstructioncost.NopotentialimpactonotherCAPEXterms,OPEXorenergytermsismodelled.
Relevance to Site Types and Turbine SizeProjectsusing4MW-8MW-SizeTurbinesonSiteTypeAaremodelledasusingmonopiles,hencethisinnovationisnotrelevant.Projectsusing10MW-SizeTurbinesonSiteTypeDaremodelledasusingjacketsupportstructures.TheinnovationisfullyrelevanttothisTurbineSizeandSiteType,so the relevance is modelled as 100%.
Commercial readinessThe development and introduction time for improving existing designs is relatively short. By definition, 100% of the potential of this innovation is modelled as available for wind farms reaching FID in 2030.
Market shareBasedonindustryfeedback,themarketshareforthisinnovationforprojectsusing10MW-SizeTurbines in 2030 is modelled as 70%.
TheanticipatedLCOEimpactisevaluatedbycomparisonoftheLCOEcalculatedforthebaselinecasewiththeLCOEcalculatedforthetargetcase.ThetargetcaseincludestheimpactoftheinnovationonthecostsforeachelementandAEPparameters,aswellastheeffectsofrelevancetoSiteTypeandTurbineSize,commercialreadinessandmarketshare.Targetcaseimpactsarecalculated as follows:
ImpactforsupportstructureCAPEX=Maximumpotentialimpact(9.36%) xRelevancetoSiteTypeDand10MW-SizeTurbine(100%)=9.36% xCommercialreadinessatFIDin2030(100%)=9.36% xMarketshareforprojectusing10MW-SizeTurbinewithFIDin2030(70%)=6.55%
Figure A.1 Four stage process of moderation applied to the maximum potential technical impact of an innovation to derive the anticipated impact on the LCOE. NotethatTechnologyTypeinthisstudymeansTurbineSize.
Anticipated technical impact for a given Site Type, Technology Type and year of FID
Technical potential impact for a given Site Type, Technology Type and year of FID
Technical potential impact for a given Site Type and Technology Type
Maximum technical potential impact of innovation under best circumstances
Relevance to Site Type and Technology Type
Commercial readliness
Market share
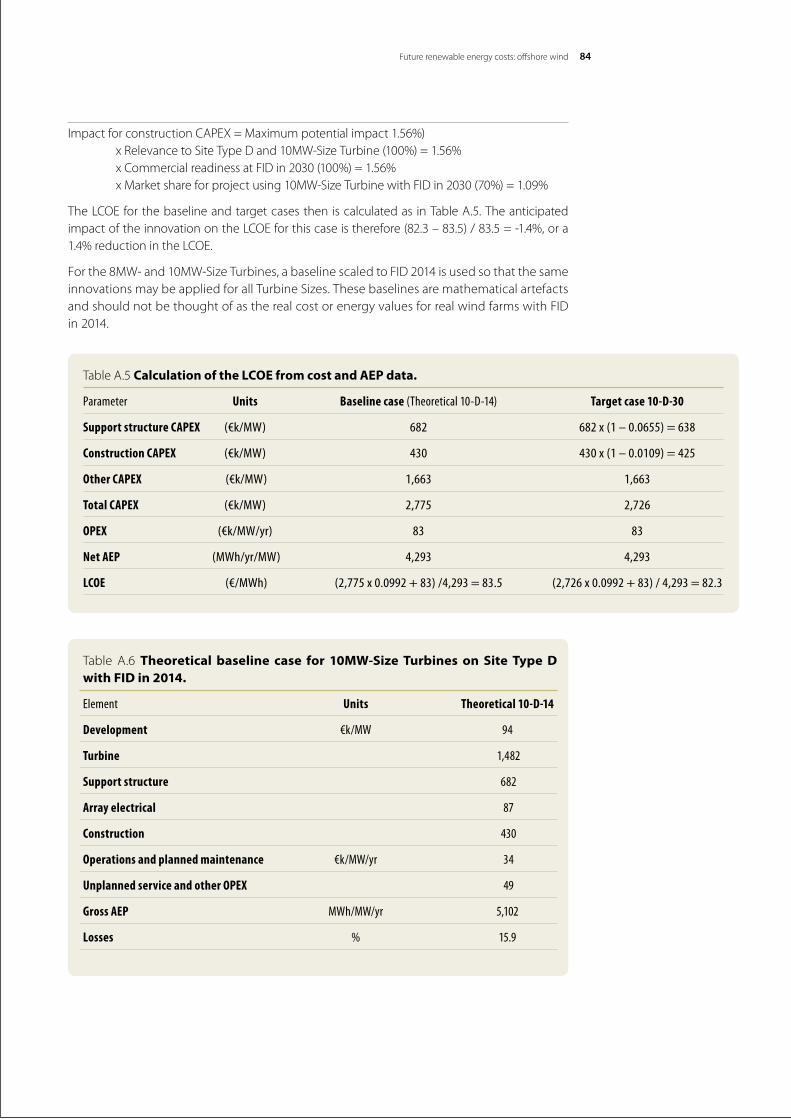
Future renewable energy costs: offshore wind 84
ImpactforconstructionCAPEX=Maximumpotentialimpact1.56%) xRelevancetoSiteTypeDand10MW-SizeTurbine(100%)=1.56% xCommercialreadinessatFIDin2030(100%)=1.56% xMarketshareforprojectusing10MW-SizeTurbinewithFIDin2030(70%)=1.09%
TheLCOEforthebaselineandtargetcasestheniscalculatedas inTableA.5.TheanticipatedimpactoftheinnovationontheLCOEforthiscaseistherefore(82.3–83.5)/83.5=-1.4%,ora1.4%reductionintheLCOE.
Forthe8MW-and10MW-SizeTurbines,abaselinescaledtoFID2014isusedsothatthesameinnovationsmaybeappliedforallTurbineSizes.Thesebaselinesaremathematicalartefactsand should not be thought of as the real cost or energy values for real wind farms with FID in2014.
Table A.5 Calculation of the LCOE from cost and AEP data.
Parameter Units Baseline case (Theoretical 10-D-14) Target case 10-D-30
Support structure CAPEX (€k/MW) 682 682 x (1 – 0.0655) = 638
Construction CAPEX (€k/MW) 430 430 x (1 – 0.0109) = 425
Other CAPEX (€k/MW) 1,663 1,663
Total CAPEX (€k/MW) 2,775 2,726
OPEX (€k/MW/yr) 83 83
Net AEP (MWh/yr/MW) 4,293 4,293
LCOE (€/MWh) (2,775 x 0.0992 + 83) /4,293 = 83.5 (2,726 x 0.0992 + 83) / 4,293 = 82.3
Table A.6Theoretical baseline case for 10MW-Size Turbines on Site Type D with FID in 2014.
Element Units Theoretical 10-D-14
Development €k/MW 94
Turbine 1,482
Support structure 682
Array electrical 87
Construction 430
Operations and planned maintenance €k/MW/yr 34
Unplanned service and other OPEX 49
Gross AEP MWh/MW/yr 5,102
Losses % 15.9
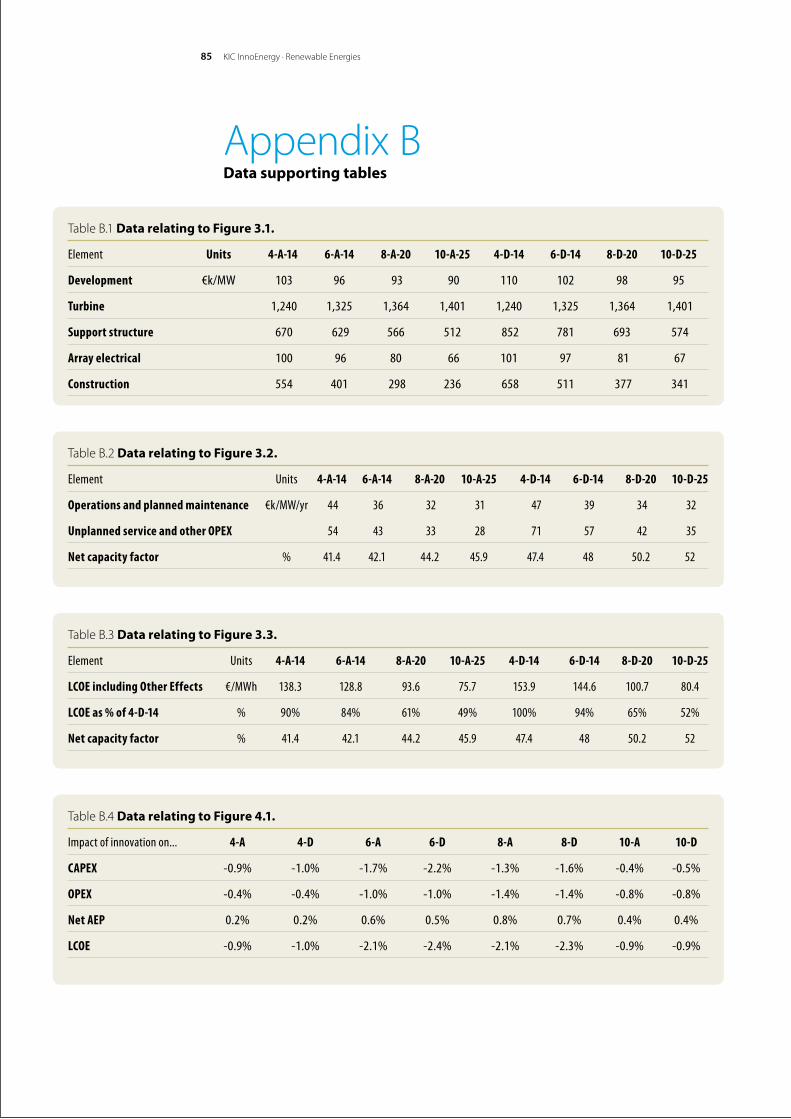
KIC InnoEnergy · Renewable Energies85
Appendix BData supporting tables
Table B.1 Data relating to Figure 3.1.
Element Units 4-A-14 6-A-14 8-A-20 10-A-25 4-D-14 6-D-14 8-D-20 10-D-25
Development €k/MW 103 96 93 90 110 102 98 95
Turbine 1,240 1,325 1,364 1,401 1,240 1,325 1,364 1,401
Support structure 670 629 566 512 852 781 693 574
Array electrical 100 96 80 66 101 97 81 67
Construction 554 401 298 236 658 511 377 341
Table B.2 Data relating to Figure 3.2.
Element Units 4-A-14 6-A-14 8-A-20 10-A-25 4-D-14 6-D-14 8-D-20 10-D-25
Operations and planned maintenance €k/MW/yr 44 36 32 31 47 39 34 32
Unplanned service and other OPEX 54 43 33 28 71 57 42 35
Net capacity factor % 41.4 42.1 44.2 45.9 47.4 48 50.2 52
Table B.3 Data relating to Figure 3.3.
Element Units 4-A-14 6-A-14 8-A-20 10-A-25 4-D-14 6-D-14 8-D-20 10-D-25
LCOE including Other Effects €/MWh 138.3 128.8 93.6 75.7 153.9 144.6 100.7 80.4
LCOE as % of 4-D-14 % 90% 84% 61% 49% 100% 94% 65% 52%
Net capacity factor % 41.4 42.1 44.2 45.9 47.4 48 50.2 52
TableB.4Data relating to Figure 4.1.
Impact of innovation on... 4-A 4-D 6-A 6-D 8-A 8-D 10-A 10-D
CAPEX -0.9% -1.0% -1.7% -2.2% -1.3% -1.6% -0.4% -0.5%
OPEX -0.4% -0.4% -1.0% -1.0% -1.4% -1.4% -0.8% -0.8%
Net AEP 0.2% 0.2% 0.6% 0.5% 0.8% 0.7% 0.4% 0.4%
LCOE -0.9% -1.0% -2.1% -2.4% -2.1% -2.3% -0.9% -0.9%
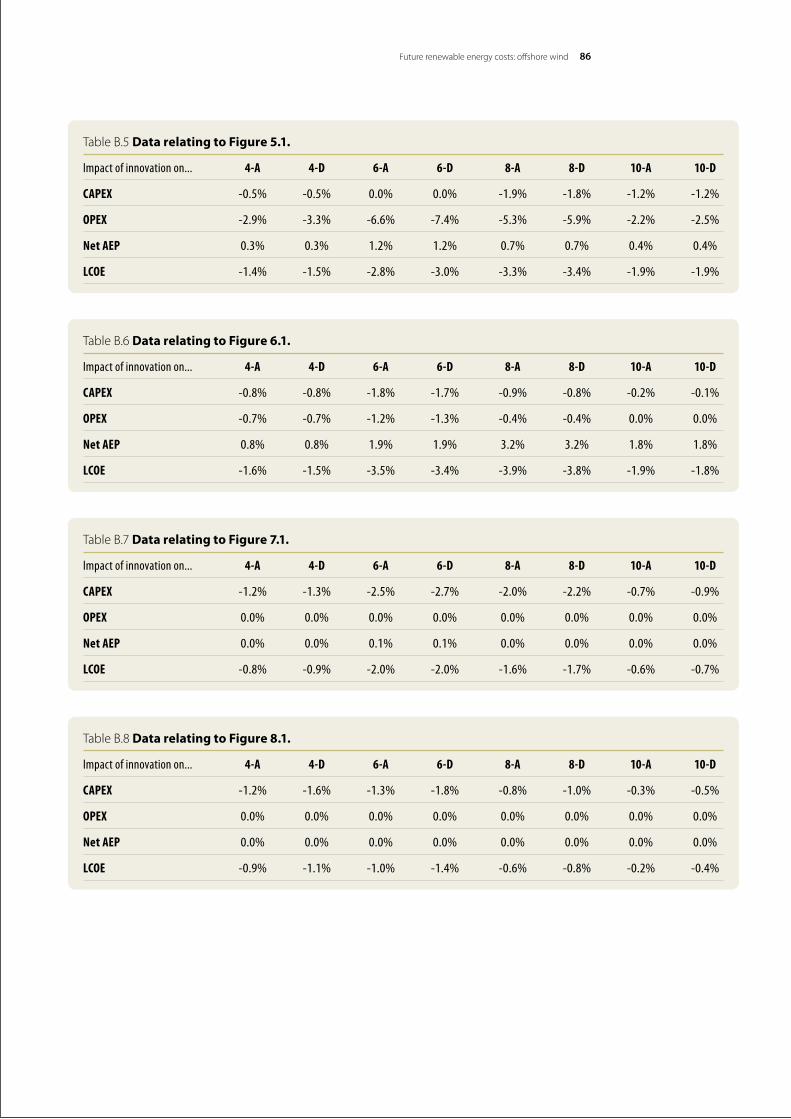
Future renewable energy costs: offshore wind 86
Table B.5 Data relating to Figure 5.1.
Impact of innovation on... 4-A 4-D 6-A 6-D 8-A 8-D 10-A 10-D
CAPEX -0.5% -0.5% 0.0% 0.0% -1.9% -1.8% -1.2% -1.2%
OPEX -2.9% -3.3% -6.6% -7.4% -5.3% -5.9% -2.2% -2.5%
Net AEP 0.3% 0.3% 1.2% 1.2% 0.7% 0.7% 0.4% 0.4%
LCOE -1.4% -1.5% -2.8% -3.0% -3.3% -3.4% -1.9% -1.9%
TableB.6Data relating to Figure 6.1.
Impact of innovation on... 4-A 4-D 6-A 6-D 8-A 8-D 10-A 10-D
CAPEX -0.8% -0.8% -1.8% -1.7% -0.9% -0.8% -0.2% -0.1%
OPEX -0.7% -0.7% -1.2% -1.3% -0.4% -0.4% 0.0% 0.0%
Net AEP 0.8% 0.8% 1.9% 1.9% 3.2% 3.2% 1.8% 1.8%
LCOE -1.6% -1.5% -3.5% -3.4% -3.9% -3.8% -1.9% -1.8%
Table B.7 Data relating to Figure 7.1.
Impact of innovation on... 4-A 4-D 6-A 6-D 8-A 8-D 10-A 10-D
CAPEX -1.2% -1.3% -2.5% -2.7% -2.0% -2.2% -0.7% -0.9%
OPEX 0.0% 0.0% 0.0% 0.0% 0.0% 0.0% 0.0% 0.0%
Net AEP 0.0% 0.0% 0.1% 0.1% 0.0% 0.0% 0.0% 0.0%
LCOE -0.8% -0.9% -2.0% -2.0% -1.6% -1.7% -0.6% -0.7%
TableB.8Data relating to Figure 8.1.
Impact of innovation on... 4-A 4-D 6-A 6-D 8-A 8-D 10-A 10-D
CAPEX -1.2% -1.6% -1.3% -1.8% -0.8% -1.0% -0.3% -0.5%
OPEX 0.0% 0.0% 0.0% 0.0% 0.0% 0.0% 0.0% 0.0%
Net AEP 0.0% 0.0% 0.0% 0.0% 0.0% 0.0% 0.0% 0.0%
LCOE -0.9% -1.1% -1.0% -1.4% -0.6% -0.8% -0.2% -0.4%
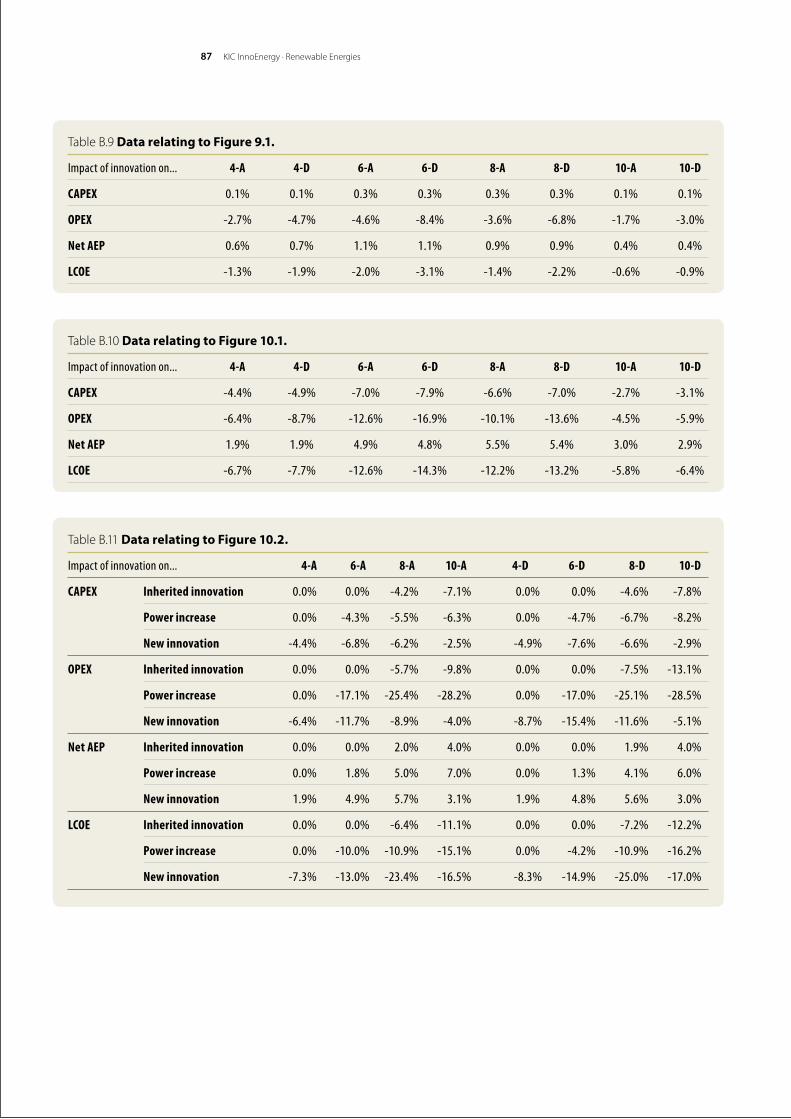
KIC InnoEnergy · Renewable Energies87
TableB.9Data relating to Figure 9.1.
Impact of innovation on... 4-A 4-D 6-A 6-D 8-A 8-D 10-A 10-D
CAPEX 0.1% 0.1% 0.3% 0.3% 0.3% 0.3% 0.1% 0.1%
OPEX -2.7% -4.7% -4.6% -8.4% -3.6% -6.8% -1.7% -3.0%
Net AEP 0.6% 0.7% 1.1% 1.1% 0.9% 0.9% 0.4% 0.4%
LCOE -1.3% -1.9% -2.0% -3.1% -1.4% -2.2% -0.6% -0.9%
Table B.10 Data relating to Figure 10.1.
Impact of innovation on... 4-A 4-D 6-A 6-D 8-A 8-D 10-A 10-D
CAPEX -4.4% -4.9% -7.0% -7.9% -6.6% -7.0% -2.7% -3.1%
OPEX -6.4% -8.7% -12.6% -16.9% -10.1% -13.6% -4.5% -5.9%
Net AEP 1.9% 1.9% 4.9% 4.8% 5.5% 5.4% 3.0% 2.9%
LCOE -6.7% -7.7% -12.6% -14.3% -12.2% -13.2% -5.8% -6.4%
Table B.11 Data relating to Figure 10.2.
Impact of innovation on... 4-A 6-A 8-A 10-A 4-D 6-D 8-D 10-D
CAPEX Inherited innovation 0.0% 0.0% -4.2% -7.1% 0.0% 0.0% -4.6% -7.8%
Power increase 0.0% -4.3% -5.5% -6.3% 0.0% -4.7% -6.7% -8.2%
New innovation -4.4% -6.8% -6.2% -2.5% -4.9% -7.6% -6.6% -2.9%
OPEX Inherited innovation 0.0% 0.0% -5.7% -9.8% 0.0% 0.0% -7.5% -13.1%
Power increase 0.0% -17.1% -25.4% -28.2% 0.0% -17.0% -25.1% -28.5%
New innovation -6.4% -11.7% -8.9% -4.0% -8.7% -15.4% -11.6% -5.1%
Net AEP Inherited innovation 0.0% 0.0% 2.0% 4.0% 0.0% 0.0% 1.9% 4.0%
Power increase 0.0% 1.8% 5.0% 7.0% 0.0% 1.3% 4.1% 6.0%
New innovation 1.9% 4.9% 5.7% 3.1% 1.9% 4.8% 5.6% 3.0%
LCOE Inherited innovation 0.0% 0.0% -6.4% -11.1% 0.0% 0.0% -7.2% -12.2%
Power increase 0.0% -10.0% -10.9% -15.1% 0.0% -4.2% -10.9% -16.2%
New innovation -7.3% -13.0% -23.4% -16.5% -8.3% -14.9% -25.0% -17.0%
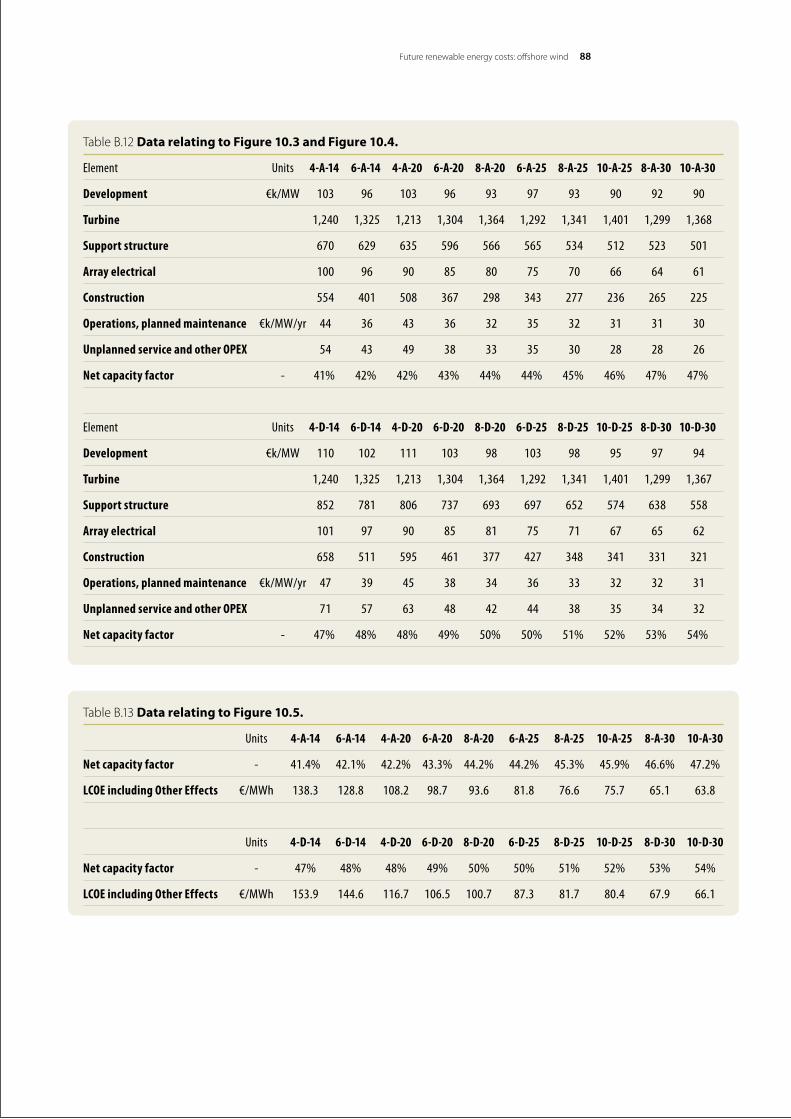
Future renewable energy costs: offshore wind 88
Table B.12 Data relating to Figure 10.3 and Figure 10.4.
Element Units 4-A-14 6-A-14 4-A-20 6-A-20 8-A-20 6-A-25 8-A-25 10-A-25 8-A-30 10-A-30
Development €k/MW 103 96 103 96 93 97 93 90 92 90
Turbine 1,240 1,325 1,213 1,304 1,364 1,292 1,341 1,401 1,299 1,368
Support structure 670 629 635 596 566 565 534 512 523 501
Array electrical 100 96 90 85 80 75 70 66 64 61
Construction 554 401 508 367 298 343 277 236 265 225
Operations, planned maintenance €k/MW/yr 44 36 43 36 32 35 32 31 31 30
Unplanned service and other OPEX 54 43 49 38 33 35 30 28 28 26
Net capacity factor - 41% 42% 42% 43% 44% 44% 45% 46% 47% 47%
Element Units 4-D-14 6-D-14 4-D-20 6-D-20 8-D-20 6-D-25 8-D-25 10-D-25 8-D-30 10-D-30
Development €k/MW 110 102 111 103 98 103 98 95 97 94
Turbine 1,240 1,325 1,213 1,304 1,364 1,292 1,341 1,401 1,299 1,367
Support structure 852 781 806 737 693 697 652 574 638 558
Array electrical 101 97 90 85 81 75 71 67 65 62
Construction 658 511 595 461 377 427 348 341 331 321
Operations, planned maintenance €k/MW/yr 47 39 45 38 34 36 33 32 32 31
Unplanned service and other OPEX 71 57 63 48 42 44 38 35 34 32
Net capacity factor - 47% 48% 48% 49% 50% 50% 51% 52% 53% 54%
Table B.13 Data relating to Figure 10.5.
Units 4-A-14 6-A-14 4-A-20 6-A-20 8-A-20 6-A-25 8-A-25 10-A-25 8-A-30 10-A-30
Net capacity factor - 41.4% 42.1% 42.2% 43.3% 44.2% 44.2% 45.3% 45.9% 46.6% 47.2%
LCOE including Other Effects €/MWh 138.3 128.8 108.2 98.7 93.6 81.8 76.6 75.7 65.1 63.8
Units 4-D-14 6-D-14 4-D-20 6-D-20 8-D-20 6-D-25 8-D-25 10-D-25 8-D-30 10-D-30
Net capacity factor - 47% 48% 48% 49% 50% 50% 51% 52% 53% 54%
LCOE including Other Effects €/MWh 153.9 144.6 116.7 106.5 100.7 87.3 81.7 80.4 67.9 66.1

KIC InnoEnergy · Renewable Energies89
TableB.14Data relating to Figure 0.1 and Figure 10.6.
Innovation Relative impact of innovation on LCOE
LCOE for a wind farm with FID in 2014 100.0%
Increase in turbine rating 17.7%
Improvements in blade aerodynamics 1.1%
Improvements in blade materials and manufacture 1.0%
Improvements in jacket design and design standards 0.9%
Improvements in blade pitch control 0.9%
Improvements in jacket manufacturing 0.9%
Introduction of multi-variable optimisation of array layouts 0.8%
Improvements in workshop verification testing 0.8%
Improvements in components (nacelle) 0.7%
43 other innovations 10.5%
LCOE for a wind farm with FID in 2030 64.7%
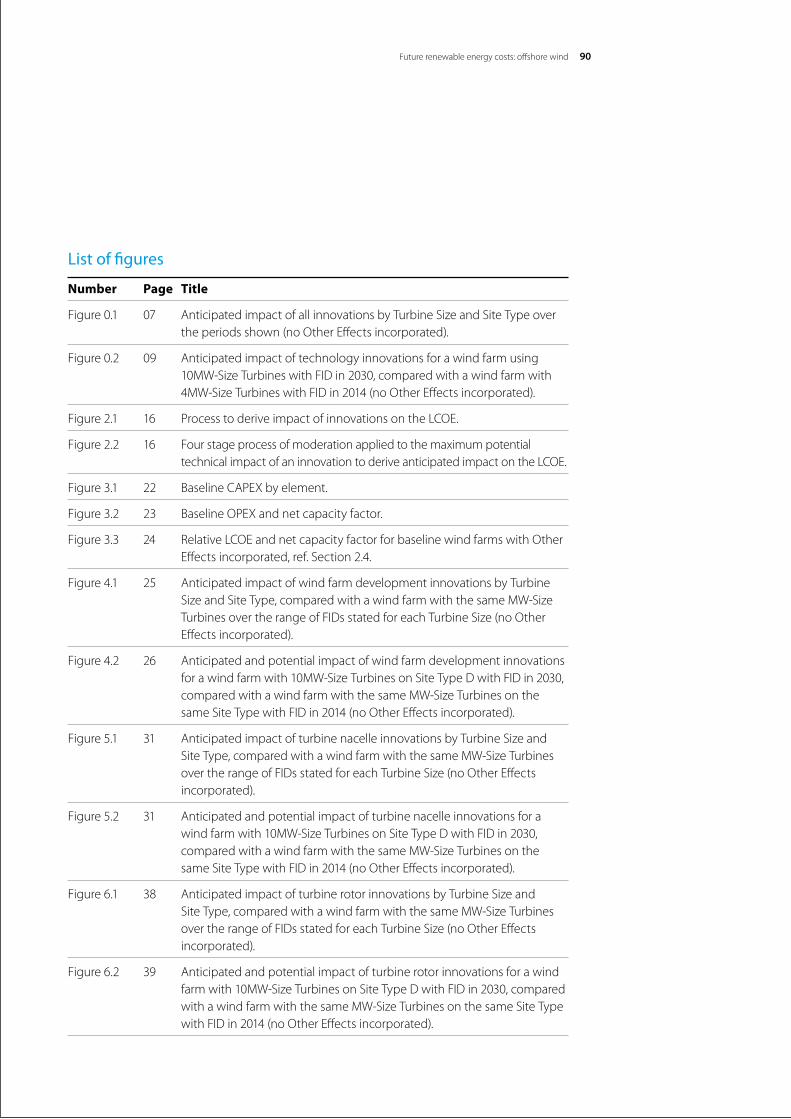
Future renewable energy costs: offshore wind 90
List of figures
Number Page Title
Figure0.1 07 AnticipatedimpactofallinnovationsbyTurbineSizeandSiteTypeovertheperiodsshown(noOtherEffectsincorporated).
Figure0.2 09 Anticipatedimpactoftechnologyinnovationsforawindfarmusing10MW-SizeTurbineswithFIDin2030,comparedwithawindfarmwith4MW-SizeTurbineswithFIDin2014(noOtherEffectsincorporated).
Figure2.1 16 ProcesstoderiveimpactofinnovationsontheLCOE.
Figure2.2 16 Four stage process of moderation applied to the maximum potential technicalimpactofaninnovationtoderiveanticipatedimpactontheLCOE.
Figure3.1 22 BaselineCAPEXbyelement.
Figure3.2 23 BaselineOPEXandnetcapacityfactor.
Figure3.3 24 RelativeLCOEandnetcapacityfactorforbaselinewindfarmswithOtherEffectsincorporated,ref.Section2.4.
Figure4.1 25 AnticipatedimpactofwindfarmdevelopmentinnovationsbyTurbineSizeandSiteType,comparedwithawindfarmwiththesameMW-SizeTurbinesovertherangeofFIDsstatedforeachTurbineSize(noOtherEffectsincorporated).
Figure4.2 26 Anticipatedandpotentialimpactofwindfarmdevelopmentinnovationsforawindfarmwith10MW-SizeTurbinesonSiteTypeDwithFIDin2030,comparedwithawindfarmwiththesameMW-SizeTurbinesonthesameSiteTypewithFIDin2014(noOtherEffectsincorporated).
Figure5.1 31 AnticipatedimpactofturbinenacelleinnovationsbyTurbineSizeandSiteType,comparedwithawindfarmwiththesameMW-SizeTurbinesovertherangeofFIDsstatedforeachTurbineSize(noOtherEffectsincorporated).
Figure 5.2 31 Anticipated and potential impact of turbine nacelle innovations for a windfarmwith10MW-SizeTurbinesonSiteTypeDwithFIDin2030,comparedwithawindfarmwiththesameMW-SizeTurbinesonthesameSiteTypewithFIDin2014(noOtherEffectsincorporated).
Figure6.1 38 AnticipatedimpactofturbinerotorinnovationsbyTurbineSizeandSiteType,comparedwithawindfarmwiththesameMW-SizeTurbinesovertherangeofFIDsstatedforeachTurbineSize(noOtherEffectsincorporated).
Figure6.2 39 Anticipatedandpotentialimpactofturbinerotorinnovationsforawindfarmwith10MW-SizeTurbinesonSiteTypeDwithFIDin2030,comparedwithawindfarmwiththesameMW-SizeTurbinesonthesameSiteTypewithFIDin2014(noOtherEffectsincorporated).
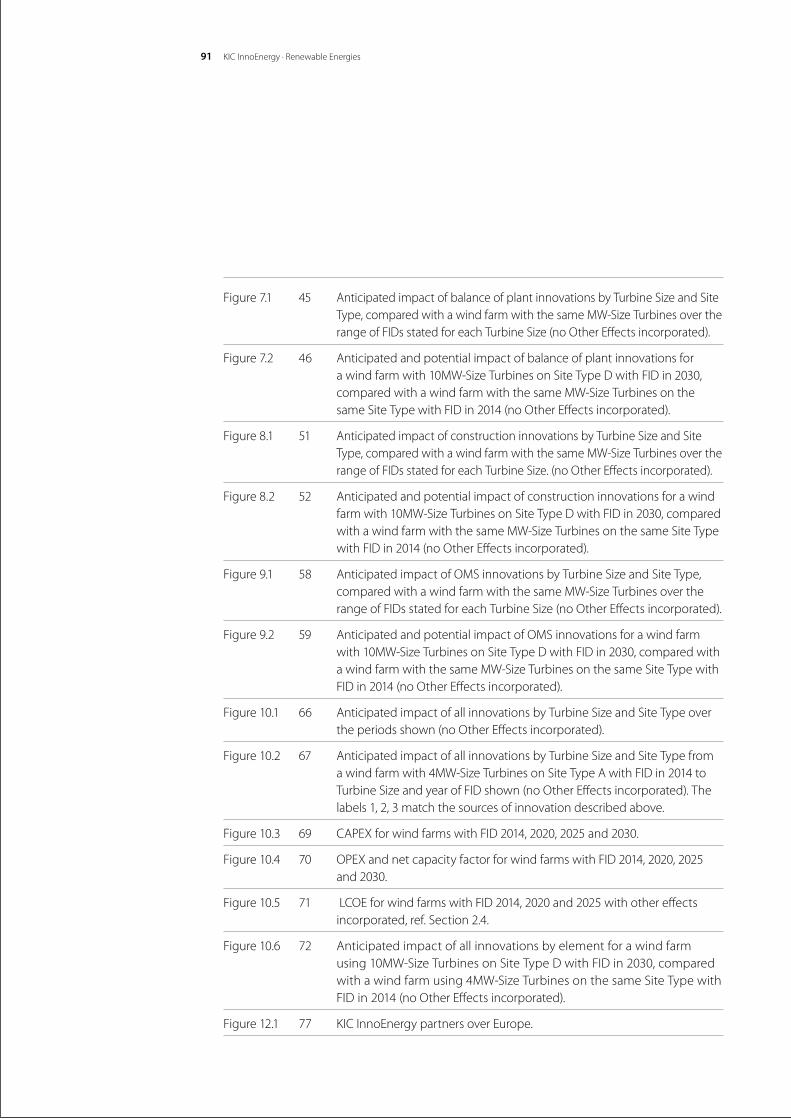
KIC InnoEnergy · Renewable Energies91
Figure7.1 45 AnticipatedimpactofbalanceofplantinnovationsbyTurbineSizeandSiteType,comparedwithawindfarmwiththesameMW-SizeTurbinesovertherangeofFIDsstatedforeachTurbineSize(noOtherEffectsincorporated).
Figure7.2 46 Anticipatedandpotentialimpactofbalanceofplantinnovationsforawindfarmwith10MW-SizeTurbinesonSiteTypeDwithFIDin2030,comparedwithawindfarmwiththesameMW-SizeTurbinesonthesameSiteTypewithFIDin2014(noOtherEffectsincorporated).
Figure8.1 51 AnticipatedimpactofconstructioninnovationsbyTurbineSizeandSiteType,comparedwithawindfarmwiththesameMW-SizeTurbinesovertherangeofFIDsstatedforeachTurbineSize.(noOtherEffectsincorporated).
Figure8.2 52 Anticipatedandpotentialimpactofconstructioninnovationsforawindfarmwith10MW-SizeTurbinesonSiteTypeDwithFIDin2030,comparedwithawindfarmwiththesameMW-SizeTurbinesonthesameSiteTypewithFIDin2014(noOtherEffectsincorporated).
Figure9.1 58 AnticipatedimpactofOMSinnovationsbyTurbineSizeandSiteType,comparedwithawindfarmwiththesameMW-SizeTurbinesovertherangeofFIDsstatedforeachTurbineSize(noOtherEffectsincorporated).
Figure9.2 59 AnticipatedandpotentialimpactofOMSinnovationsforawindfarmwith10MW-SizeTurbinesonSiteTypeDwithFIDin2030,comparedwithawindfarmwiththesameMW-SizeTurbinesonthesameSiteTypewithFIDin2014(noOtherEffectsincorporated).
Figure10.1 66 AnticipatedimpactofallinnovationsbyTurbineSizeandSiteTypeovertheperiodsshown(noOtherEffectsincorporated).
Figure10.2 67 AnticipatedimpactofallinnovationsbyTurbineSizeandSiteTypefromawindfarmwith4MW-SizeTurbinesonSiteTypeAwithFIDin2014toTurbineSizeandyearofFIDshown(noOtherEffectsincorporated).Thelabels 1, 2, 3 match the sources of innovation described above.
Figure10.3 69 CAPEXforwindfarmswithFID2014,2020,2025and2030.
Figure10.4 70 OPEXandnetcapacityfactorforwindfarmswithFID2014,2020,2025and 2030.
Figure10.5 71 LCOEforwindfarmswithFID2014,2020and2025withothereffectsincorporated,ref.Section2.4.
Figure10.6 72 Anticipated impact of all innovations by element for a wind farm using10MW-SizeTurbinesonSiteTypeDwithFIDin2030,comparedwithawindfarmusing4MW-SizeTurbinesonthesameSiteTypewithFIDin2014(noOtherEffectsincorporated).
Figure12.1 77 KICInnoEnergypartnersoverEurope.
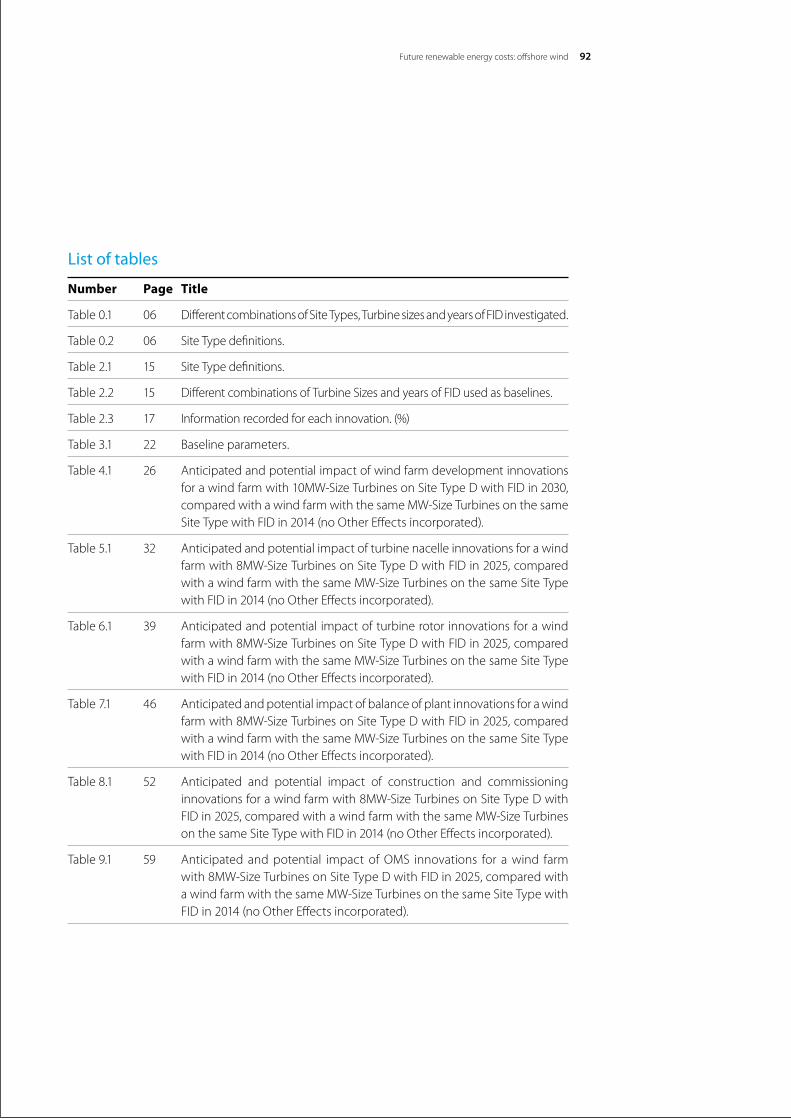
Future renewable energy costs: offshore wind 92
List of tables
Number Page Title
Table0.1 06 DifferentcombinationsofSiteTypes,TurbinesizesandyearsofFIDinvestigated.
Table0.2 06 SiteTypedefinitions.
Table 2.1 15 SiteTypedefinitions.
Table 2.2 15 DifferentcombinationsofTurbineSizesandyearsofFIDusedasbaselines.
Table 2.3 17 Informationrecordedforeachinnovation.(%)
Table 3.1 22 Baseline parameters.
Table4.1 26 Anticipatedandpotentialimpactofwindfarmdevelopmentinnovationsforawindfarmwith10MW-SizeTurbinesonSiteTypeDwithFIDin2030,comparedwithawindfarmwiththesameMW-SizeTurbinesonthesameSiteTypewithFIDin2014(noOtherEffectsincorporated).
Table 5.1 32 Anticipated and potential impact of turbine nacelle innovations for a wind farmwith8MW-SizeTurbinesonSiteTypeDwithFIDin2025,comparedwithawindfarmwiththesameMW-SizeTurbinesonthesameSiteTypewithFIDin2014(noOtherEffectsincorporated).
Table6.1 39 Anticipatedandpotentialimpactofturbinerotorinnovationsforawindfarmwith8MW-SizeTurbinesonSiteTypeDwithFIDin2025,comparedwithawindfarmwiththesameMW-SizeTurbinesonthesameSiteTypewithFIDin2014(noOtherEffectsincorporated).
Table7.1 46 Anticipatedandpotentialimpactofbalanceofplantinnovationsforawindfarmwith8MW-SizeTurbinesonSiteTypeDwithFIDin2025,comparedwithawindfarmwiththesameMW-SizeTurbinesonthesameSiteTypewithFIDin2014(noOtherEffectsincorporated).
Table8.1 52 Anticipated and potential impact of construction and commissioninginnovationsforawindfarmwith8MW-SizeTurbinesonSiteTypeDwithFIDin2025,comparedwithawindfarmwiththesameMW-SizeTurbinesonthesameSiteTypewithFIDin2014(noOtherEffectsincorporated).
Table9.1 59 Anticipated andpotential impactofOMS innovations for awind farmwith8MW-SizeTurbinesonSiteTypeDwithFIDin2025,comparedwithawindfarmwiththesameMW-SizeTurbinesonthesameSiteTypewithFIDin2014(noOtherEffectsincorporated).

KIC InnoEnergy · Renewable Energies93

The Future renewable energy costs: offshore wind.51 technology innovations that will have greater impact on reducing the cost of electricity from European offshore wind farms.
©KICInnoEnergy,2016ISBN978-94-92056-06-1
The Future renewable energy costs: offshore wind report is a property ofKICInnoEnergy.Itscontent,figuresanddatamayonlybere-usedandcitedwithaclearreferencetoKICInnoEnergyasasource.
The document is also available in an online format on the KICInnoEnergywebsite:www.kic-innoenergy.com
For more information about the report, please contact: [email protected]

KIC InnoEnergy SE KennispoortJohnF.Kennedylaan2,6thfloor5612ABEindhovenTheNetherlandsinfo@kic-innoenergy.comwww.kic-innoenergy.com
· B E N E LU X · F R A N C E · G E R M A N Y · I B E R I A · POLAND PLUS · S W E D E NE U R O P E
KIC InnoEnergy is supported by
the EIT, a body of the European Union