Embed Size (px)
Citation preview

FUZZY EXPERT SYSTEM ON DIAGNOSIS
ATHEROSCLEROSIS
LINA FARHANA BINTI MAHADI
UNIVERSITI TUN HUSSEIN ONN MALAYSIA
i
FUZZY EXPERT SYSTEM ON DIAGNOSIS ATHEROSCLEROSIS
LINA FARHANA BINTI MAHADI
A project report submitted in partial
fulfillment of the requirement for the award of the
Degree in Master of Electrical Engineering
Faculty of Electrical and Electronic Engineering
Universiti Tun Hussein Onn Malaysia
JANUARY 2017

iii
Dedicated for:
Beloved mum and dad,
Puan Zainon binti Md. Ali and Mahadi bin Ismail
Dearest sisters and brothers in law
&
Lovely niece and nephew

iv
ACKNOWLEDGEMENT
In the name of Allah, The most Gracious and Merciful.
First and foremost, I would like to express my sincere gratitude to my
supervisor Dr Nabilah binti Ibrahim and my co-supervisor Dr Farhanahani binti
Mahmud who has supported me throughout my thesis with their patience and
knowledge whilst allowing me the room to work in my own way. I attribute the level
of my Masters degree to their encouragement and effort and without them this thesis,
too, would not have been completed or written. One simply could not wish for a
better or friendlier supervisor.
Besides my supervisor, I would like to thank my lecturer involved indirectly;
Dr Audrey Huong Kah Ching and Dr Nur Anida binti Jumadi for all the opinions and
advice that they have given me. Financial support was made possible by the Majlis
Amanah Rakyat (MARA).
I would also like to thank the subjects who were involved in this research
project. Without their passionate cooperations, this project could not have been
successfully conducted.
Finally, I must express my very profound gratitude to my parents and to my
fellow friends: Muhammad Ihsan, Wan Fatin Liyana, Muhammad Haniff and
Muhammad Amzar for the stimulating discussions, providing me with unfailing
support and continuous encouragement throughout my years of study and through the
process of researching and writing this thesis. This accomplishment would not have
been possible without them. Thank you.

v
ABSTRACT
Heart disease is one of the major factors of death in world wide. Atherosclerosis is
the major factor of heart disease. Atherosclerosis is a disease in which plaque builds
up inside the arteries that eventually likely to be hardened over time thus narrows the
arteries. This project is developed to monitor the atherosclerosis risk among people,
which can tell their current health condition. This system could change the
perspective of one’s life for better living. 20 people consist of 10 male, 10 female
have been used as a test subject in this project. An Arduino prototype of
Atherosclerosis monitors have been developed by applying the fuzzy logic method
for testing and analyze the possibilities of atherosclerosis based on several input data
obtained from the subject. The selected input data are age, body mass index (BMI),
intima media thickness (IMT), blood pressure (BP) and blood glucose level (BGL).
Since all the subjects are young in age, the chance of them to have the atherosclerosis
is low.

vi
ABSTRAK
Penyakit jantung adalah salah satu faktor utama kematian di seluruh dunia.
Aterosklerosis adalah faktor utama penyakit jantung. Aterosklerosis adalah penyakit
di mana plak membina di dalam arteri yang akhirnya mungkin akan keras dari masa
ke masa dengan itu menyempitkan arteri. Projek ini dibangunkan untuk memantau
risiko aterosklerosis di kalangan rakyat, yang boleh memberitahu keadaan kesihatan
semasa mereka. Sistem ini boleh mengubah perspektif kehidupan seseorang untuk
hidup yang lebih baik. 20 orang terdiri daripada 10 lelaki, 10 perempuan telah
digunakan sebagai subjek ujian dalam projek ini. Satu prototaip Arduino monitor
Aterosklerosis telah dibangunkan dengan menggunakan kaedah fuzzy logic untuk
menguji dan menganalisis kemungkinan aterosklerosis berdasarkan beberapa data
input yang diperolehi daripada subjek. Data input yang dipilih ialah umur, indeks
jisim badan (BMI), ketebalan media Intima (IMT), tekanan darah (BP) dan tahap
glukosa darah (BGL). Oleh kerana subjek semua dalam usia muda, peluang mereka
untuk mempunyai aterosklerosis adalah rendah.

vii
CONTENTS
TITLE i
DECLARATION ii
DEDICATION iii
ACKNOWLEDGEMENT iv
ABSTRACT v
CONTENTS vii
LIST OF TABLES x
LIST OF FIGURE xi
LIST OF SYMBOLS AND ABBREVIATIONS xiii
CHAPTER 1 INTRODUCTION 1
1.1 Background of study 1
1.2 Problem statement 5
1.3 Aim 6
1.4 Objectives 6
1.5 Scopes 6
CHAPTER 2 LITERATURE REVIEW 7
2.1 Introduction 7
2.2 Measurands to be taken into account 7
2.2.1 Body Mass Index (BMI) 7

viii
2.2.2 Carotid Intima Media Thickness (CIMT) 8
2.2.3 Blood Pressure (BP) 10
2.2.4 Blood Glucose level (BGL) 12
2.3 Soft computing 14
2.3.1 Neural Network 14
2.3.2 Fuzzy logic 15
2.2.3 The difference between Fuzzy Logic and Neural
Networks
15
2.4 Previous Case studies 16
2.4.1 Measurement of Local Elasticity of Human
Carotid Arterial Walls and Its Relationship with Risk
Index of Atherosclerosis
16
2.4.2 Atherosclerosis Risk Assessment using Rule-
based Approach
17
CHAPTER 3 METHODOLOGY 19
3.1 Introduction 19
3.2 System development 20
3.2.1 Data collection 20
3.2.2 Software implementation 24
3.2.2.1 Fuzzy Logic 24
I. General outline of Fuzzy controller 25
II. Fuzzy logic implementation block
diagram
25
III. Membership Function, Input and
Output
25
IV. Created rules 29

ix
3.2.2.2 Arduino IDE 30
3.2.2.3 Matlab 32
3.2.3 Hardware implementation 33
3.2.3.1 Arduino 33
3.2.3.2 Matrix Keypad 35
3.2.3.3 LCD display 35
3.2.4 Prototype design 36
3.2.5 Operation flow chart 37
CHAPTER 4 RESULT AND DISCUSSION 38
4.1 Fuzzy logic output 38
4.1.1 Fuzzy logic output: Surface viewer 41
4.2 Hardware prototype 46
4.2.1 System testing 47
4.2.1.1 Prototype running 48
4.2.2 Data collection 50
CHAPTER 5 CONCLUSION 52
REFERENCES 53
APPENDIX 58

x
LIST OF TABLES
2.1 Classification of BMI scores 8
2.2 Classification of IMT categories 9
2.3 Blood pressure chart categories 11
2.4 Blood sugar level in diagnosing diabetes 12
2.5 Classification accuracy system for risky and non-
risky patient
18
3.1 Age range of subject 21
3.2 BMI range of subject 22
3.3 CIMT range reading 23
3.4 The blood pressure range 23
3.5 Blood glucose level range 24
4.1 Output range of fuzzy sets that represents
Atherosclerosis disease
38
4.2 Result display of Atherosclerosis risk on LCD
display prototype based percentage range on fuzzy
sets
47
4.3 Prototype testing step by step 48
4.4 Subject data collection 50

xi
LIST OF FIGURES
1.1 Atherosclerosis development 2
1.2 a) Normal artery, b) Narrowing of artery 3
1.3 Sequences in Atherosclerosis progression 5
2.1 The comparison of normal lumen of artery and
artery with plaque
9
2.2 The relationship between incremental strain with
arterial inner pressure
12
2.3 The average of elastic module E of 54 patients and
30 healthy subjects. Values are mean measured in 3
cardiac cycle
16
2.4 CVD risk calculator 17
3.1 Data collection flow chart 20
3.2 Carotid artery classification 22
3.3 Blood pressure monitor 23
3.4 Accu-chek Performa blood glucose meter 24
3.5 Block diagram of fuzzy logic 25
3.6 Membership function for Age 26
3.7 Membership function for BMI 27
3.8 Membership function for IMT 27
3.9 Membership function for Blood Pressure 28
3.10 Membership function for blood glucose level 29
3.11 Rules editor 30
3.12 Screenshot of the Arduino IDE showing the Fuzzy
inference system of Atherosclerosis
31
3.13 The average of IMT measurement (Pixel = 2.43,
Millimeter = 0.64)
33
3.14 Arduino Uno R3 board with labels 34
xii
3.15 Matrix keypad 35
3.16 LCD display 36
3.17 Prototype design 36
3.18 Operation flow chart 37
4.1 Membership function for Atherosclerosis condition 39
4.2 Rule viewer 39
4.3 Surface viewer for atherosclerosis condition based
on BGL and BP
41
4.4 Surface viewer for atherosclerosis condition based
on IMT and BMI
42
4.5 Surface viewer for atherosclerosis condition based
on age and BMI
42
4.6 Surface viewer for atherosclerosis condition based
on IMT and age
43
4.7 Surface viewer for atherosclerosis condition based
on blood pressure and BMI
43
4.8 Surface viewer for atherosclerosis condition based
on blood glucose and BMI
44
4.9 Surface viewer for atherosclerosis condition based
on blood glucose and IMT
44
4.10 Surface viewer for atherosclerosis condition based
on age and blood pressure
45
4.11 Surface viewer for atherosclerosis condition based
on age and blood glucose
45
4.12 Fuzzy expert system on diagnosis atherosclerosis
prototype
46
4.13 Block diagram on how hardware prototype works 46
4.14 Example of required input data display in LCD a)
Age, b) IMT, c) BGL
49
4.15 The result display of LCD to indicate a) low risk, b)
mid risk, c) high risk
50

xiii
LIST OF SYMBOLS AND ABBREVIATIONS
AGEs - advanced glycation end products
Ant - Conjunction of attribute-value pairs
ANN - Artificial neural network
BGL - Blood glucose level
BMI - Body mass index
B-mode - Brightness mode
BP - Blood pressure
C - Class
CCA - Common carotid artery
CIMT - Carotid intima media thickness, intima media thickness
cm - Centimetre
CVD - Cardiovascular disease
HR - High risk
in - inches
IMT - Intima media thickness
KEX - Knowledge Explorer algorithm
kg - Kilogram
lb - Pound
LCD - Liquid crystal display
LDL - Low density lipoprotein
LR - Low risk
m - Meter
mg/dl - Milligrams per deciliter
mm - Millimetre
mmHg - Millimetres of mercury
mmol/l - Millimoles per litre
M-mode - Motion mode
Modulus E - Elastic modulus

xiv
MR - Mid risk
N/A - Not applicable
NIH - National Institute of Health
NO - Nitrous oxide
NR - No risk
UTHM - Universiti Tun Hussein Onn Malaysia
VHR - Very high risk
w - weight

CHAPTER 1
INTRODUCTION
1.1 Background of study
Atherosclerosis is a disease in which plaque builds up inside arteries. Arteries are
blood vessels that carry oxygenated blood to the heart and other parts of body.
Plaque is made up of fat, cholesterol, calcium, and other substances found in the
blood [1]. Over time, plaque hardens and narrows the arteries. This limits the flow
of oxygenated blood to the organs and other parts of the body and therefore can lead
to serious problems, including heart attack, stroke, or even death [2]. The exact cause
of atherosclerosis is not being known. However, atherosclerosis may start when
certain factors damage the inner layers of the arteries. These factors include smoking,
high amounts of certain fats and cholesterol in the blood, high blood pressure, high
amounts of sugar in the blood due to insulin resistance or diabetes.
Furthermore, studies show that atherosclerosis is a slow, complex disease that
may start in childhood [3]. Plaque may begin to build up where the arteries are
damaged. Over time, plaque hardens and thus narrows the arteries. Eventually, an
area of plaque can be rupture. When this happens, blood cell fragments
called platelets stick to the site of the injury. They may clump together to form blood
clots. Clots narrow the arteries even more, limiting the flow of oxygenated blood to
the body. The atherosclerosis development can be shown in Figure 1.1.

2
Figure 1.1: Atherosclerosis development.
(Mayo clinic, 2016)
Depending on which arteries are affected, blood clots can worsen angina,
(chest pain) or cause a heart attack or stroke. Atherosclerosis can affect any artery in
the body, including arteries in the heart, brain, arms, legs pelvis and kidneys. As a
result, different diseases may develop based on which arteries are affected.
Therefore, it is important to have a system which can alert people with their
health condition to prevent for the worst. This project proposed the development of
the Atherosclerosis risk assessment monitoring system. This project will develop a
prototype that will inform the present condition of the patients after certain
measurand has been taken which include the age, body mass index (BMI), intima
media thickness (IMT), blood pressure (BP) and blood glucose level (BGL). On the
bright side, the system could probably safe more life, times and money as it acts as
early detection of cardiovascular and other related disease. Moreover, it may cause
more people to lead for better healthy lifestyle.

3
Figure 1.2: a) Normal artery b) Narrowing of artery.
(Nhlbi, 2015)
The comparison between the normal artery and narrowing of artery due to
plaque build-up is shown as Figure 1.2 where figure A is the normal artery with
normal blood flow. The inset image shows a cross-section of a normal artery.
Meanwhile, Figure B shows an artery with plaque build-up and the inset image
shows a cross-section of an artery with plaque build-up [1]. The pathophysiologic
process by which atherosclerosis occurs is complex and somewhat controversial. The
working theory includes four steps [4]:
i. Endothelial cell injury
ii. Lipoprotein deposition
iii. Inflammatory reaction
iv. Smooth muscle cell cap formation

4
i. Endothelial cell injury
This is likely the initial factor that begins the process of atherosclerotic
plaque formation. Since the endothelium are constantly exposed to the
circulation, any toxin present can result in damage (as occurs during tobacco
use, diabetes and dyslipidemia). The continuous physical force exerted upon
the endothelium also plays a role as commonly the greatest atherosclerotic
plaque occurs at arterial bifurcations. Hypertension increases the physical
force present.
ii. Lipoprotein deposition
When the endothelium is injured or disrupted, lipoprotein molecules can gain
entry where they are then modified by oxidation (via free radicals or
oxidizing enzymes) or glycation (diabetics). This modified lipoprotein
(modified LDL) is inflammatory and able to be ingested by macrophages
creating “foam cells” causing a “fatty streak” in the arterial wall.
iii. Inflammatory reaction
The modified LDL is antigenic and attracts inflammatory cells into the
arterial wall. Also, after endothelial injury, inflammatory mediators are
released further increasing leukocyte recruitment.
iv. Smooth muscle cell cap formation
Smooth muscle cells migrate to the surface of the plaque creating a “fibrous
cap”. When this cap is thick, the plaque is stable, however thin capped
atherosclerotic plaques are thought to be more prone to rupture or erosion
causing thrombosis.

5
The pathophysiological process of Atherosclerosis can be summarizes as
Figure 1.3 below.
Figure 1.3: Sequences in Atherosclerosis progression.
(Steven Lome, 2016)
1.2 Problem statement
Generally, for certain disease that people may encounter, there are few symptoms or
sign that will be appeared when they feel sick which makes them aware of their
health and it is easier to take an action to prevent from the worst. Atherosclerosis will
not show any sign or symptoms to the patients until the artery were totally blocks.
People were not aware of the disease until they got heart attack or stroke. Therefore,
this project proposed to develop Fuzzy expert system on diagnosis Atherosclerosis.
So people will alert with their health condition as the system will indicate the level of
atherosclerosis disease that they might have.

6
1.3 Aim
The aim of this project is to develop the Fuzzy expert system on diagnosis
Atherosclerosis.
1.4 Objectives
To achieve the above aim, the objectives for the project are:
To assess the risk factor of atherosclerosis.
To develop a prototype that could monitor the risk of atherosclerosis
1.5 Scope
To detect the early stage of the atherosclerosis at common carotid, the development
of atherosclerosis risk assessment monitoring system measurement is proposed. The
measurands/parameters that will be considered in this project are:
a) Age
b) Body mass index (BMI)
c) Intima media thickness (IMT)
d) Systolic blood pressure (BP)
e) Blood glucose level (BGL)
All the parameters above will be categorized in each selected range. For BMI,
four group will be categorized which are underweight, normal, overweight and
obesity. For IMT, if the measurement is greater than 1.0 mm, the value will be
considered as abnormal. The blood pressure category would be low, normal and high
blood pressure (hypertension) while for blood glucose level they would be low,
normal and high glucose level (diabetes). Furthermore, this project proposed to
implement a fuzzy logic concept based prototype which embedding structured
human knowledge into workable algorithm.

CHAPTER 2
LITERATURE REVIEW
2.1 Introduction
In this section, the details of parameter that will be used for the data recording will be
discussed. The parameters that would be used including body mass index (BMI),
intima media thickness (IMT), blood pressure (BP) and blood glucose level (BGL).
Moreover, previous case studies will also be discussed.
2.2 Measurands to be taken into account
2.2.1 Body Mass Index (BMI)
The body mass index (BMI) is a value derived from the mass (weight) and height of
an individual. The BMI is an attempt to quantify the amount of tissue mass (muscle,
fat, and bone) in an individual, and then categorize that person
as underweight, normal weight, overweight, or obese based on that value. Commonly
accepted BMI ranges are underweight: under 18.5, normal weight: 18.5 to 25,
overweight: 25 to 30 and obese: over 30 [5]. The BMI can be calculated as below:
BMI=
(2.1)

8
In an analysis of 40 studies involving 250,000 people, patients with coronary artery
disease with normal BMIs were at higher risk of death from cardiovascular disease
than people whose BMIs put them in the overweight range (BMI 25–29.9) [6].
One study found that BMI had a good general correlation with body fat percentage,
and noted that obesity has overtaken smoking as the world's number one cause of
death. But it also notes that in the study, 50% of men and 62% of women were obese,
according to body fat defined obesity, while only 21% of men and 31% of women
were obese, according to BMI, meaning that BMI was found to underestimate the
number of obese subjects [7]. Table 2.1 shows the classification of the BMI standard
score.
Table 2.1: Classification of BMI scores.
(Webmd, 2005)
Classification BMI score (kg/m2)
Underweight
<18.5
Normal 18.5-24.9
Overweight 25.00-29.00
Obese >30
2.2.2 Carotid intima media thickness (CIMT)
The carotid intima-media thickness (CIMT) test is a measurement used to analyze
the degree of carotid atherosclerotic vascular illness. The test measures the thickness
of the inner two layers of the carotid artery - the intima and media - and alerts
physicians to any thickening when patients are still asymptomatic. Early discovery
may demonstrate the requirement for a more forceful way to managing the risk
factors associated with coronary illness and stroke.
Aging is a contributing component to expanded carotid intima-media thickness.
Other danger variables incorporate high lipoprotein levels, hypertension, smoking,
diabetes, corpulence and a stationary way of life. Physicians use CIMT testing to
determine the "age" of the carotid arteries. Knowing that patients may not be
experiencing the symptoms of atherosclerosis, there still may be subtle changes in
artery thickness. Armed with this information, physicians may develop an aggressive

9
medical approach by prescribing medications such as blood pressure and cholesterol
lowering agents and aspirin, and patients may be encouraged to make lifestyle and
dietary improvements [8]. Figure 2.1 shows the comparison of normal lumen of the
artery and artery with plaque.
In a study there was clearly stated that in the relatively aged population, increases in
intima-media thickness as measured in the Common Carotid Artery (CCAs) were
clearly related to locally detected atherosclerosis and known risk factors for
atherosclerosis. Longitudinal studies are needed to clarify the role of arterial wall
thickening in the atherosclerotic process [9]. The classification of CIMT is being
shown as Table 2.2 below [11].
Figure 2.1: The comparison of normal lumen of artery and artery with plaque.
(Hideyuki Hasegawa et al, 1998)
Table 2.2: Classification of CIMT categories.
(Carotidworld, 2016)
Classification CIMT (mm)
Normal
< 0.8
Borderline 0.8-1.0
Abnormal >1.1
10
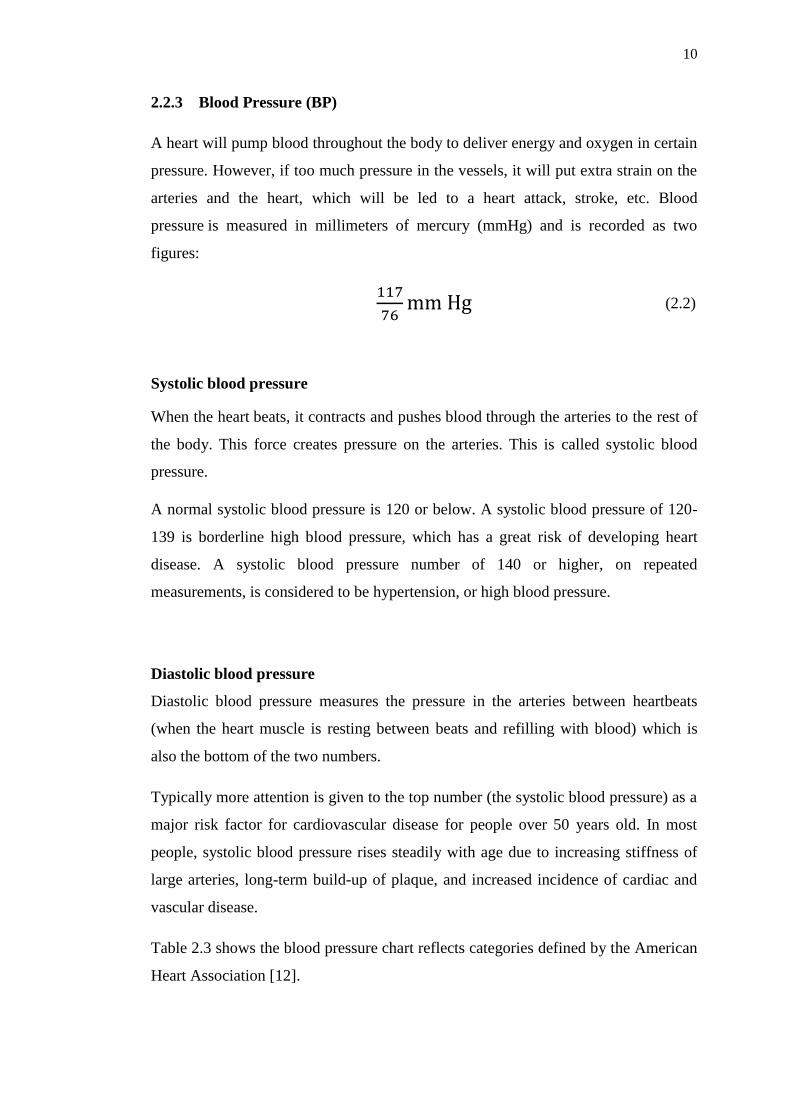
2.2.3 Blood Pressure (BP)
A heart will pump blood throughout the body to deliver energy and oxygen in certain
pressure. However, if too much pressure in the vessels, it will put extra strain on the
arteries and the heart, which will be led to a heart attack, stroke, etc. Blood
pressure is measured in millimeters of mercury (mmHg) and is recorded as two
figures:
Systolic blood pressure
When the heart beats, it contracts and pushes blood through the arteries to the rest of
the body. This force creates pressure on the arteries. This is called systolic blood
pressure.
A normal systolic blood pressure is 120 or below. A systolic blood pressure of 120-
139 is borderline high blood pressure, which has a great risk of developing heart
disease. A systolic blood pressure number of 140 or higher, on repeated
measurements, is considered to be hypertension, or high blood pressure.
Diastolic blood pressure
Diastolic blood pressure measures the pressure in the arteries between heartbeats
(when the heart muscle is resting between beats and refilling with blood) which is
also the bottom of the two numbers.
Typically more attention is given to the top number (the systolic blood pressure) as a
major risk factor for cardiovascular disease for people over 50 years old. In most
people, systolic blood pressure rises steadily with age due to increasing stiffness of
large arteries, long-term build-up of plaque, and increased incidence of cardiac and
vascular disease.
Table 2.3 shows the blood pressure chart reflects categories defined by the American
Heart Association [12].
(2.2)

11
Table 2.3: Blood pressure chart categories.
(American Heart Association, 2016)
Blood Pressure
Category
Systolic
mm Hg (upper #)
Diastolic
mm Hg (lower #)
Normal
Less than 120
and
Less than 80
Prehypertension 120 – 139 or 80 – 89
High Blood Pressure
(Hypertension) Stage 1
140 – 159 or 90 – 99
High Blood Pressure
(Hypertension) Stage 2
160 or higher or 100 or higher
Hypertensive Crisis
(Emergency care needed)
Higher than 180 or Higher than 110
When the heart beats, it pushes blood through the arteries in the entire body. Higher
blood pressures means that with each beat, arteries throughout the body swell and
stretch more than they would normally. This stretching can injure the endothelium,
the delicate lining of all arteries, causing arteries to become stiff over time. Healthy
endothelium actively works to prevent atherosclerosis from developing. Injured
endothelium, on the other hand, attracts more "bad" low density lipoprotein (LDL)
cholesterol and white blood cells. The cholesterol and cells build up in the artery
wall, eventually forming the plaque of atherosclerosis.
As stated in Table 2.3, hypertension can be classified as a condition when the blood
pressure is getting higher which means the chance to have atherosclerosis is also
high. Priya R. Mohan et al. [13] stated that since hypertension are often treated by
orally medication such as beta blockers, calcium channel blockers, etc. As a result,
these drugs gradually caused the artery to become stiffer over times.
However, there are some author stated that the atherosclerosis itself will cause the
hypertension. As atherosclerosis caused by the builds up of plague, it then will leads
to stenosis condition. Stenosis is defined by the narrowing of the artery. Therefore,
since the artery become narrow, the pressure inside the artery will be increase. This
then will cause the hypertension.

12
Figure 2.2: Relationship between incremental strain with arterial inner pressure.
(Hideyuki Hasegawa et al, 1998)
From the Figure 2.2 above, it shows that the strain in the radial direction in
proportional to the blood pressure. The strain in the radial direction is the carotid
intima media thickness. The known fact that is the thickness of arterial wall will
cause atherosclerosis. Therefore, as the blood pressure increase, the percentage to get
atherosclerosis also will increase.
2.2.4 Blood Glucose Level (BGL)
The blood sugar concentrated or blood glucose level is the amount of glucose (sugar)
present in the blood of a human or animal. Table 2.4 shows the blood sugar levels in
diagnosing diabetes [14].
Table 2.4: Blood sugar levels in diagnosing diabetes.
(Diabetes.co.uk, 2016)
Plasma glucose
test
Normal Prediabetes Diabetes
Random Below 11.1 mmol/l
Below 200 mg/dl
N/A 11.1 mmol/l or more
200 mg/dl or more
Fasting Below 6.1 mmol/l
Below 108 mg/dl
6.1 to 6.9 mmol/l
108 to 125 mg/dl
7.0 mmol/l or more
126 mg/dl or more
2 hour post-
prandial
Below 7.8 mmol/l
Below 140 mg/dl
7.8 to 11.0 mmol/l
140 to 199 mg/dl
11.1 mmol/l or more
200 mg/dl or more
13
Normal blood vessels have an inner lining, called endothelium, that keeps blood
flowing smoothly by producing local Nitrous oxide (NO). NO serves to relax the
smooth muscles in the walls of the vessels and prevent cells from sticking to the
walls. A disruption of this mechanism is thought to be at the heart of the increased
formation of plaques in diabetes. High blood sugar, elevated fatty acids and
triglycerides leads to stickier walls, encouraging the attachment of cells that produces
a local tissue reaction. The local tissue reaction further traps floating particles and
different blood cells, hopping up and hardening the vessel walls.
The metabolic abnormalities that characterize diabetes, such as hyperglycemia,
increased free fatty acids, and insulin resistance, each provokes molecular
mechanisms that contribute to vascular dysfunction. These include decreased
bioavailability of NO, increased oxidative stress, disturbances of intracellular signal
transduction, and activation of receptors for advanced glycation end
products (AGEs). In addition, platelet function is abnormal, and there is increased
production of several prothrombotic factors. These abnormalities contribute to the
cellular events that cause atherosclerosis and subsequently increase the risk of the
adverse cardiovascular events that occur in patients with diabetes and atherosclerosis
[15].
The relationship between diabetes and atherosclerosis is being explored and
discussed by the author in 1981. Diabetes is being known to have two types which
are due to genetically and metabolic abnormalities and there are possibilities these
two types of diabetes relationship with atherosclerosis may vary [16].
Based on autopsy study [16], there was no significant correlation between severity
and duration of diabetes with atherosclerosis. The type of medical treatment for
diabetes also was not related to atherosclerosis. However, when the patients with
diabetes were being compared to non-diabetics, the diabetics possessed significantly
more atherosclerosis with myocardial infarction, and other coronary artery disease.
This result shows that person with diabetic has a great potential to have
atherosclerosis. However the author claims that the progression of atherosclerosis is
not depends on how severity of diabetes is.

14
2.3 Soft computing
2.3.1 Neural Network
Artificial neural network (ANN) are preparing gadgets (algorithms or actual
hardware) that are approximately displayed after the neuronal structure of the
mamalian cerebral cortex however on much littler scales. An extensive ANN may
have hundreds or a huge number of processor units, though a mamalian cerebrum has
billions of neurons with a corresponding increment in greatness of their general
association and developing behavior. Despite the fact that ANN analysts are for the
most part not worried with whether their networks precisely take after natural
frameworks, some have. For instance, specialists have precisely reproduced the
capacity of the retina and demonstrated the eye rather well [17].
Artificial neural networks in light of straightforward models for neurons and their
associations can be extremely effective both in reproducing the memory storing and
recall process (the Hopfield network) and for pattern-based decision making and
learning (the Perceptron model). Both of these networks have officially discovered
wide application outside of neuroscience - in fields as different as signal processing,
recognition and synthesis of speech, financial forecasting and modelling, and
medical diagnosis [18].
In general, neural networks give great solutions for issues with the accompanying
components:
i. The issue makes utilization of `noisy' information
ii. Quick preparing might be required. We may not require the absolute best
answer for the issue. We may very well need a sensibly decent one rapidly.
iii. There are no basic standards for tackling the issue - the sum total of what we
have are an arrangement of test arrangements. The network can `trained' on
these so it creates great reactions to comparative new cases.
However, there are two vital issues with the utilization of these networks. The first is
that there is no present comprehension of how huge (how many nodes and
connections) a network must be in order to handle an issue of some given many-
sided quality (the special case to this being the Hopfield network). The second

15
disservice with these networks can be the long circumstances once in a while
expected to instruct the network the fitting reactions - these networks learn
supervisedly - input data is fed many times to the network and the associations
balanced in order to attempt to accomplish an objective yield. This "programming"
stage can imply that a given pattern must be introduced to the network thousands of
times [19].
2.3.2 Fuzzy logic
Fuzzy Logic has a place with the group of many-valued logic. It concentrates on
settled and estimated thinking restricted to settled and correct thinking. A variable in
fuzzy logic can take a truth esteem run somewhere around 0 and 1, rather than taking
genuine or false in conventional twofold sets. Since reality esteem is a range, it can
deal with incomplete truth. Start of fuzzy logic was set apart in 1956, with the
presentation of fuzzy set theory by Lotfi Zadeh. Fuzzy logic gives a technique to
settle on positive choices in view of uncertain and questionable information. Fuzzy
logic is generally utilized for applications as a part of control frameworks, since it
nearly takes after how a human settle on choice yet in speedier way. Fuzzy logic can
be incorporated into control frameworks in light of little handheld gadgets to
extensive PC workstations [18].
2.3.3 The difference between Fuzzy Logic and Neural Networks
Fuzzy logic permits settling on distinct choices in light of uncertain or equivocal
information, while ANN tries to incorporate human speculation procedure to tackle
issues without numerically displaying them. Despite the fact that both of these
techniques can be utilized to take care of nonlinear issues, and issues that are not
appropriately determined, they are not related. As opposed to Fuzzy logic, ANN tries
to apply the reasoning procedure in the human cerebrum to take care of issues.
Furthermore, ANN incorporates a learning procedure that includes learning
algorithms and requires preparing information [20].

16
2.4 Previous Case studies
2.4.1 Measurement of Local Elasticity of Human Carotid Arterial Walls and
Its Relationship with Risk Index of Atherosclerosis
Hideyuki Hasegawa et.al [10] agreed that atherosclerosis has been serious problem
due to its high influence on chronic diseases such as myocardial and cerebral
infarction. Atherosclerosis has been often diagnosed by measuring the thickness of
the arterial wall or the area of the lumen of carotid artery. However, it is difficult to
diagnose in early stage of atherosclerosis because there is not much different in the
thickness of arterial wall. Therefore, to overcome the problem, the authors has been
proposed the method to use ultrasound to measure elasticity of the arterial wall by
measuring the small velocity signal on intima and adventitia of the arterial wall.
Since the amplitude of change in thickness of the arterial wall is in several tenth
mircometers, the elastic property of the arterial wall is evaluated in each local area of
a few millimeters which corresponding to the width of ultrasonic beam instead of
using the B-mode and M-mode from standard ultrasound device.
In this project, the test was being evaluated on carotid artery of 54 male patients with
high risk factor of coronary heart diseases and 30 healthy male subjects. As a result,
the elastic modulus E is found to be increased with age. Moreover, the arterial walls
of the patients were found to be much stiffer than the healthy subjects as can be seen
in Figure 2.3 below.
Figure 2.3: The average of elastic modulus E of 54 patients and 30 healthy subjects.
Values are mean measured in 3 cardiac cycles.
(Hideyuki Hasegawa et al, 1998)
17
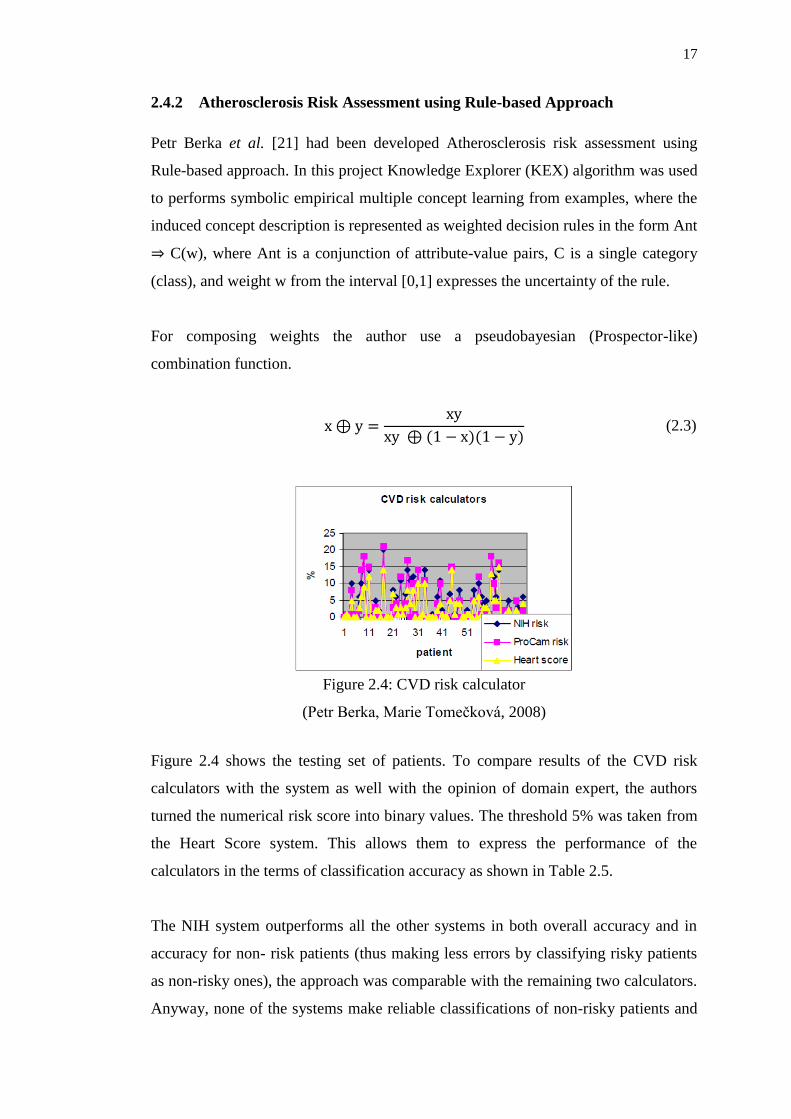
2.4.2 Atherosclerosis Risk Assessment using Rule-based Approach
Petr Berka et al. [21] had been developed Atherosclerosis risk assessment using
Rule-based approach. In this project Knowledge Explorer (KEX) algorithm was used
to performs symbolic empirical multiple concept learning from examples, where the
induced concept description is represented as weighted decision rules in the form Ant
⇒ C(w), where Ant is a conjunction of attribute-value pairs, C is a single category
(class), and weight w from the interval [0,1] expresses the uncertainty of the rule.
For composing weights the author use a pseudobayesian (Prospector-like)
combination function.
Figure 2.4: CVD risk calculator
(Petr Berka, Marie Tomečková, 2008)
Figure 2.4 shows the testing set of patients. To compare results of the CVD risk
calculators with the system as well with the opinion of domain expert, the authors
turned the numerical risk score into binary values. The threshold 5% was taken from
the Heart Score system. This allows them to express the performance of the
calculators in the terms of classification accuracy as shown in Table 2.5.
The NIH system outperforms all the other systems in both overall accuracy and in
accuracy for non- risk patients (thus making less errors by classifying risky patients
as non-risky ones), the approach was comparable with the remaining two calculators.
Anyway, none of the systems make reliable classifications of non-risky patients and
(2.3)

18
interesting trade-off between classification accuracies of both groups can be
observed.
Table 2.5: Classification accuracy system for risky and non-risky patient.
(Petr Berka, Marie Tomečková, 2008)
System Overall accuracy Accuracy Risk Accuracy NoRisk
NIH
0.76
0.84
0.63
ProCam 0.69 0.95 0.52
Heart 0.67 1.00 0.50
Our system 0.70 0.88 0.54

CHAPTER 3
METHODOLOGY
3.1 Introduction
This chapter discussed the steps and method that will be used in developing the
project. It consists of software and hardware implementation. In software
implementation, the data will be collected and analyzed meanwhile in hardware
implementation, the data will be inserted into the system and the output will be
displayed. In this chapter, the implementation of fuzzy logic control method also will
be discussed.
20
3.2 System development
3.2.1 Data collection
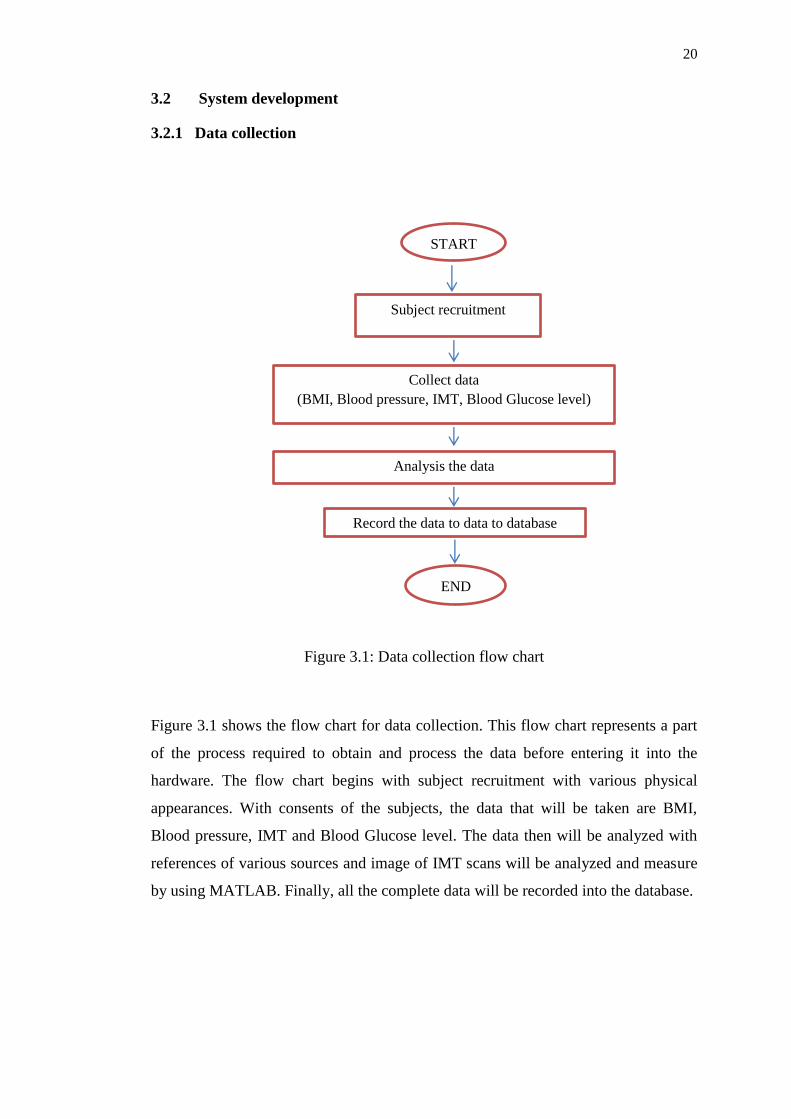
Figure 3.1: Data collection flow chart
Figure 3.1 shows the flow chart for data collection. This flow chart represents a part
of the process required to obtain and process the data before entering it into the
hardware. The flow chart begins with subject recruitment with various physical
appearances. With consents of the subjects, the data that will be taken are BMI,
Blood pressure, IMT and Blood Glucose level. The data then will be analyzed with
references of various sources and image of IMT scans will be analyzed and measure
by using MATLAB. Finally, all the complete data will be recorded into the database.
START
Subject recruitment
Collect data
(BMI, Blood pressure, IMT, Blood Glucose level)
Analysis the data
END
Record the data to data to database

21
Although the cause of atherosclerosis is unknown, a number of „risk factors‟ have
been identified [35], which have two types; reversible and irreversible. Reversible
risk factors are crucial due to they may affect the development or progression of
coronary artery disease, including cigarette smoking, hypertension,
hypercholesterolaemia, lipoprotein, homocysteine, obesity and physical inactivity.
Meanwhile, the irreversible risk factors are including the age, male sex, family
history and diabetes mellitus. Therefore, 20 people are being selected to be the
subject for this research which consisted of 10 male and 10 female of UTHM
students. The data to be obtained will be age, body mass index (BMI), intima-media
thickness (IMT), blood pressure (BP) and blood glucose level (BGL).
a. Age
The subjects selected in this research are in range age between 20 and 30.
However, the coronary disease rises with the increasing age.
b. Body mass index (BMI)
The increased risk of coronary artery disease in obese individuals is largely
due to associated hypertension, hypercholesterolaemia and diabetes. Obesity
is determined by calculating the BMI by using the height and weight of the
individuals.
c. Intima-media thickness (IMT)
To measure the IMT of the subject, ultrasound machine in the B- mode scan
is being used. Mean IMT is calculated in the CCA between two interfaces:
blood-intima and media-adventitia. IMT measurement can be performed
either manually or by computer. In manual method, the measurements are
being obtained by freezing the video monitor and using the cursor at multiple
sites and averaging the values. Meanwhile, for computerized method, three
measurements are being made which are on the far wall at anterior, lateral,
and posterior projections which then the values will be averaged. Figure 3.2
shows the location of far wall in the carotid artery, which needed to be
measured.

22
Figure 3.2: Carotid artery classification.
(Daniel H. O'Leary, Michiel L. Bots, 2010)
The value for normal IMT is less than 0.8mm [11]. As intima-media
thickness will be increase with age, the value of 0.8mm to 1.0mm is being
considered as intermediate or borderline. However, when the value of
thickness is 1.1mm or greater, that is the actual value to be accepted as
abnormal.
d. Blood pressure (BP)
Blood pressure each individual are being measured by blood pressure
monitor. This parameter is important as hypertension is a condition where the
blood pressure is high; for systolic (140-160mm Hg) than it should be
(normal; 90-120mm Hg). The risk of coronary artery disease rise in the
proportion to the level both systolic and diastolic blood pressure as
hypertension will increase the risk to 2-3 times greater [35].
However, in this research, the only data on blood pressure that will be
selected is systolic blood pressure due to elevation of systolic blood pressure
predicts the risk of cardiovascular disease better than increases in diastolic
blood pressure [37]. Figure 3.3 below shows the example of the blood
pressure reading (117/81 mm Hg) of the subject taken by using the blood
pressure monitor. To ensure the correct reading taken, the device must be on

23
the same level as the subject heart. Therefore, the subjects are required to be
seated on the chair and relax, with no talking while the hand with the device
is on the desk.
Figure 3.3: Blood pressure monitor
e. Blood glucose level (BGL)
Diabetes mellitus increases the risk of coronary artery disease in both men
and women. It is an independent risk factor for cardiovascular disease [38].
For this parameter, a blood sample is being taken from the subject by
pricking the finger using lancets in lancing pen and placed the blood on the
test strip which being inserted into Accu-check performa blood glucose meter
which can be shown in Figure 3.4.
There are two ideal conditions that must be considered before taking the
blood glucose, which are either taking on fasting (or before breakfast) or two
hours after lunch. This is because the number of glucose will be increase after
eating. Therefore, this will affect the actual value of glucose in the blood and
this value is not valid. However, these two conditions themselves have
different ideal value. Thus, in this research, the condition selected will be on
fasting (or before breakfast).

24
Figure 3.4: Accu-chek Performa blood glucose meter
3.2.2 Software Implementation
3.2.2.1 Fuzzy Logic
Fuzzy logic was introduced by Zadeh in the 1960s and is now well established as an
engineering discipline. Fuzzy logic is used for controlling a wide variety of devices,
Fuzzy logic has been used in applications that are amenable to conventional control
algorithms on the basis of mathematical models of the system being controlled, such
as the high-frequency mechanical ventilator of Noshiro and coworkers. However,
fuzzy logic has a particular advantage in areas where a precise mathematical
description of the control process is impossible and is thus especially suited to
support medical decision making [22].
Fuzzy logic is an approach to computing based on "degrees of truth" rather than the
usual "true or false" (1 or 0) Boolean logic on which the modern computer is based.
Fuzzy logic includes 0 and 1 as extreme cases of truth (or "the state of matters" or
"fact") but also includes the various states of truth in between so that, for example,
the result of a comparison between two things could be not "tall" or "short" but ".38
of tallness." Fuzzy logic seems closer to the way the brains work.
Lancing pen Accu-chek
Performa meter
Test strip
53
REFERENCES
1. Nhlbi, “Atherosclerosis”, (2015) retrieved at National Heart, Lung and Blood
Institute from http://www.nhlbi.nih.gov/health/health-
topics/topics/atherosclerosis.
2. Mayo clinic, “Atherosclerosis”, retrieved on September 2016 at Mayo Clinic
from http://www.mayoclinic.org/diseases-conditions/arteriosclerosis.
3. Noriyuki Sakata, “AGEs and Atherosclerosis”, Department of Pathology,
Faculty of Medicine, Fukuoka University, Anti-Aging Medicine 9 (3): 89-95,
2012.
4. Steven Lome, “Artherosclerosis review”, retrieved on June 2016 from
http://www.healio.com/cardiology/learn-the-heart/cardiology
review/atherosclerosis.
5. Webmd (2005), “Body Mass Index (BMI) for Adult, retrieved on September
2016 from http://www.webmd.com/a-to-z-guides/body-mass-index-bmi-for-
adults
6. Abel Romero-Corral, Victor M Montori, Virend K Somers, Josef Korinek,
Randal J Thomas, Thomas G Allison, Farouk Mookadam, Francisco Lopez-
Jimenez, (2006), "Association of bodyweight with total mortality and with
cardiovascular events in coronary artery disease: A systematic review of
cohort studies". The Lancet 368 (9536): 666–78.
7. Romero-Corral, A; Somers, V K; Sierra-Johnson, J; Thomas, R J; Collazo-
Clavell, M L; Korinek, J; et al. (2008). "Accuracy of body mass index in
diagnosing obesity in the adult general population". International Journal of
Obesity 32 (6): 959–66.
8. Retrieved on June 2016 from http://www.cedars-sinai.edu/Patients/Programs-
and-Services/Womens-Heart-Center/Services/Carotid-Intima-Media-
Thickness-Test.aspx.

54
9. Bonithon-Kopp C, Touboul PJ, Berr C, Leroux C, Mainard F, Courbon
D, Ducimetière P. Arterioscler Thromb Vasc Biol. (1996) “Relation of
intima-media thickness to atherosclerotic plaques in carotid arteries. The
Vascular Aging (EVA) Study”. Feb;16(2):310-6.
10. Hideyuki Hasegawa, Hiroshi Kanai, Nozomu Hoshimiya, Noriyoshi
Chubachi, Yoshiro Koiwa, (1998), “Measurement of Local Elasticity of
Human Carotid Arterial Walls and Its Relationship with Risk Index of
Atherosclerosis”, Tohoku Univcrdy, Sentlai 980-0872, Japan.
11. Carotidworld, retrieved on September 2016 from at
http://www.carotidworld.org/Pre_evaluation.html
12. Heart, retrieved on June 2016 from http://www.heart.org/
13. Priya R. Mohan, Timothy S. Phan, John K-J. Li, (2015), “Methods for
Analysis of Hemodynamic and Metabolic Risks Factors in Hypertension”,
Rutgers, The State University of New Jersey, Piscataway, NJ, USA.
14. Diabetes.co.uk, “Blood Sugar Level Ranges”, retrieved on September 2016
from http://www.diabetes.co.uk/diabetes_care/blood-sugar-level-ranges.html.
15. Mark A. Creager, Thomas F. Lüscher, Francesco Cosentino, Joshua A.
Beckman, (2013),“Diabetes and Vascular Disease, Pathophysiology, Clinical
Consequences, and Medical Therapy: Part I”, 108: 1527-1532.
16. Robert W. Stout, (1981), “Blood Glucose and Atherosclerosis: Review”,
Arterioscler Thromb Vasc Biol. 1981;1:227-234.
17. “A Basic Introduction To Neural Networks”, retrieved on October 2016 from
http://pages.cs.wisc.edu/~bolo/shipyard/neural/local.html.
18. Prof. Leslie Smith, (2001) “An Introduction to Neural Networks”, Centre for
Cognitive and Computational Neuroscience Department of Computing and
Mathematics University of Stirling.
19. Christos Stergiou and Dimitrios Siganos,„Neural Networks”, retrieved on Oct
2016 from
https://www.doc.ic.ac.uk/~nd/surprise_96/journal/vol4/cs11/report.html.
20. Indika, (2011), “Difference Between Fuzzy Logic and Neural Network”.

55
21. Petr Berka, Marie Tomečková, “Atherosclerosis Risk Assessment using Rule-
based Approach”, University of Economics, Prague & Centre of Biomedical
Informatics, Institute of Computer Science, Prague, 2008 IEEE.
22. Jason H. T. Bates and Michael P. Young "Applying Fuzzy Logic to Medical
Decision Making in the Intensive Care Unit", American Journal of
Respiratory and Critical Care Medicine, Vol. 167, No.7 (2003), pp. 948-952.
23. Rehana Parvin, Dr. Abdolreza Abhari, “Fuzzy Database for Heart Disease
Diagnosis”, Ryerson University Toronto, Ontario M5B2K3, Canada.
24. Smita Sushil Sikchi, Sushil Sikchi, Ali M. S., “Generic Medical Fuzzy Expert
System for Diagnosis of Cardiac Diseases”, Amravati, India, Volume 66– No.13,
March 2013.
25. "Using Atmel Studio for Arduino development", retrieved on November
2016 from Megunolink.com.
26. "Using AVR Studio for Arduino development", retrieved on November 2016
from Engblaze.com.
27. "Programming Arduino Getting Started with Sketches", (2011), McGraw-
Hill, retrieved on November 2016.
28. “Tutorial: Bare Minimum code needed”; arduino.cc, retrieved on November
2016 from https://www.arduino.cc/en/Tutorial/BareMinimum.
29. "MATLAB Documentation". MathWorks, retrieved on October 2016 from
https://www.mathworks.com/help/matlab/.
30. "Arduino - Introduction". arduino.cc. retrieved on November 2016 from
https://www.arduino.cc/en/Guide/Introduction.
31. "Optiboot Bootloader for Arduino and Atmel AVR", retrieved on October
2016.
32. Arduino Uno R3 board with labels, retrieved on November 2016 from
http://www.jtagelectronics.com/?p=75.
33. “4 4 Matrix keypad module”, retrieved on November 2016 from
https://www.sunfounder.com/wiki/index.php?title=4X4_Matrix_Keypad_Mo
dule.
34. ”LCD display”, retrieved on November 2016 from
http://www.engineersgarage.com/electronic-components/16x2-lcd-module-
datasheet.

56
35. Timmis, Adam D., “Essential cardiology”, 3rd ed., London : Blackwell
Science, 1997, ISBN: 9780632048434.
36. Daniel H. O'Leary, Michiel L. Bots, (2010), “Imaging of atherosclerosis:
carotid intima–media thickness, Volume 31, Issue 14Pp. 1682 – 1689.
37. Kannel WN, Schwartz MJ, Mcnamara PM., “Blood pressure and risk of
coronary heart disease”, The Framingham study. Dis Chest. 1969;56:43–52.
38. Branch, William T., “Cardiology in primary care”, New York : McGraw-Hill,
2000, ISBN: 9780070071629.
39. Koçyiğit A1, Doğan M, Yilmaz İ, Çağlar M, Hatipoğlu C, Koçyiğit F, Herek
D, Karabulut N,“Relation of age and sex with carotid intima media thickness
in healthy children”, Turk J Med Sci. 2014;44(3):422-6.
40. Bucciarelli P1, Srámek A, Reiber JH, Rosendaal FR.,“Arterial intima-media
thickness and its relationship with cardiovascular disease and atherosclerosis:
a possible contribution of medium-sized arteries”, Thromb Haemost. 2002
Dec;88(6):961-6.
41. Ma W1, Yang Y, Qi L, Zhang B, Meng L, Zhang Y, Jiang J, Li J, Wang S,
Huo Y2., “Relationship between high normal blood pressure and carotid
artery atherosclerosis in Beijing residents”, Zhonghua Xin Xue Guan Bing Za
Zhi. 2014 Jun;42(6):510-4.
42. Dirk Sander, Christian Kukla, Jürgen Klingelhöfer, Kerstin Winbeck and
Bastian Conrad,“Relationship Between Circadian Blood Pressure Patterns
and Progression of Early Carotid Atherosclerosis”, Circulation.
2000;102:1536-1541.
43. Lynne E. Wagenknecht, Daniel Zaccaro, Mark A. Espeland, Andrew J.
Karter, Daniel H. O‟Leary and Steven M. Haffner, “Diabetes and Progression
of Carotid Atherosclerosis”, Arteriosclerosis, Thrombosis, and Vascular
Biology. 2003;23:1035-1041.
44. Hanna Dis Margeirsdottir, Knut Haakon Stensaeth, Jakob Roald Larsen,
MD3, Cathrine Brunborg and Knut Dahl-Jørgensen, “Early Signs of
Atherosclerosis in Diabetic Children on Intensive Insulin Treatment”,
Diabetes Care 2010 Sep; 33(9): 2043-2048.
45. Sarah M. Camhi, Peter T. Katzmarzyk, Stephanie T. Broyles, Sathanur R.
Srinivasan, Wei Chen, Claude Bouchard and Gerald S. Berenson,
“Subclinical Atherosclerosis and Metabolic Risk: Role of Body Mass Index

57
and Waist Circumference”, Metab Syndr Relat Disord. 2011 Apr; 9(2): 119–
125.
46. Amit Shankar Singh, Virendra Atam, Munna Lal Patel, Shyam Chand
Chaudhary, Kamal Kumar Sawlani, and Liza Das, “Carotid Intima Media
Thickness as a Reflection of Generalized Atherosclerosis is Related to Body
Mass Index in Ischemic Stroke Patients”, N Am J Med Sci. 2013 Mar; 5(3):
228–234.
47. University of Rochester Medical Center. (2008, March 17). How Diabetes
Drives Atherosclerosis. ScienceDaily. Retrieved October, 2016 from website:
www.sciencedaily.com/releases/2008/03/080313124430.htm.
48. Markus Juonala1, Mika Ka¨ho¨nen, Tomi Laitinen, Nina Hutri-Ka¨ho¨nen,
Eero Jokinen, Leena Taittonen, Matti Pietika¨inen, Hans Helenius, Jorma
S.A. Viikari, and Olli T. Raitakari, “Effect of age and sex on carotid intima-
media thickness, elasticity and brachial endothelial function in healthy adults:
The Cardiovascular Risk in Young Finns Study”, European Heart Journal
(2008) 29, 1198–1206.