Embed Size (px)
DESCRIPTION
FY 2009-2010 Budget Preparation & Negotiations Part II – January 12, 2009. Top 4 Things to Know about School Finance in Iowa. Total amount of money available is based primarily on the number of children a district has. - PowerPoint PPT Presentation
Citation preview
FY 2009-2010 Budget Preparation & NegotiationsPart II – January 12, 2009
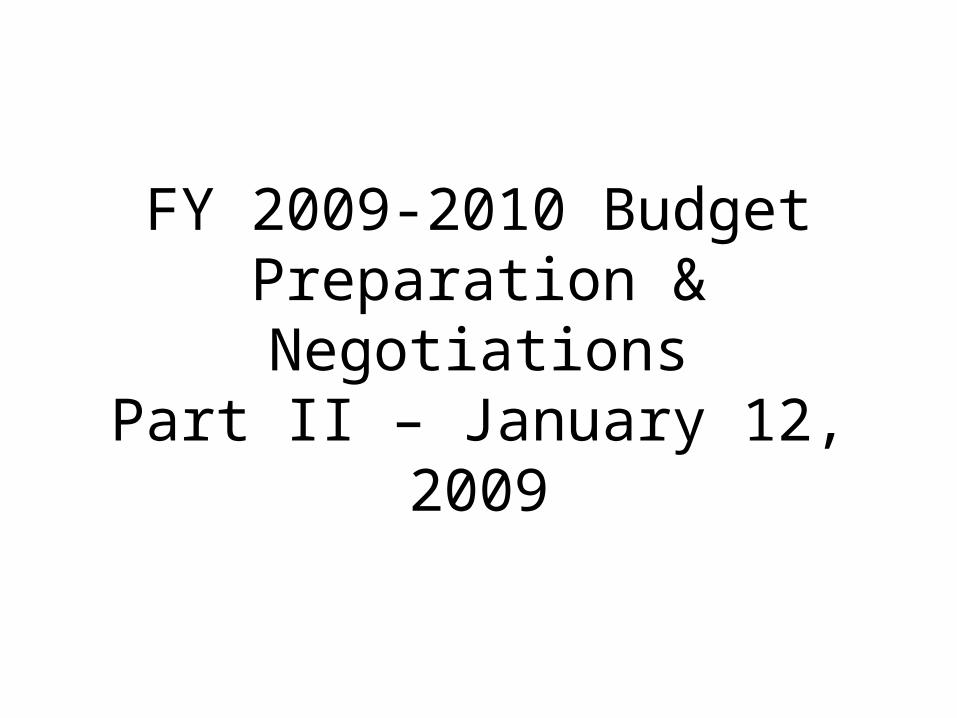
Top 4 Things to Know about School Finance in Iowa
• Total amount of money available is based primarily on the number of children a district has.
• The tax rate of a district is largely driven by formula. Only a small portion is impacted by the school board.
• Certain funds have to be spent on certain things.
• Most of our expenses are staff: 81% of ACSD General Fund is made up of staff salaries and benefits.

School Aid - Basics
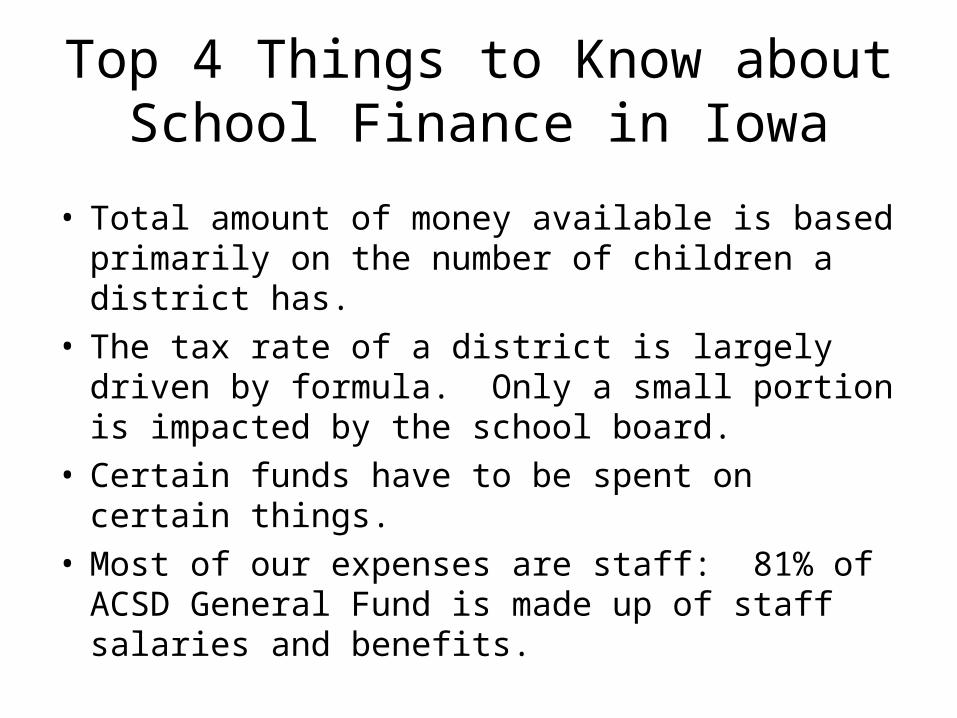
• Certain Funds have to be Spent on Certain Things– Educational program expenditures are
funded and equalized by the state foundation formula.
– Facility expenditures are funded locally (with some state assistance) and are not under the finance formula.
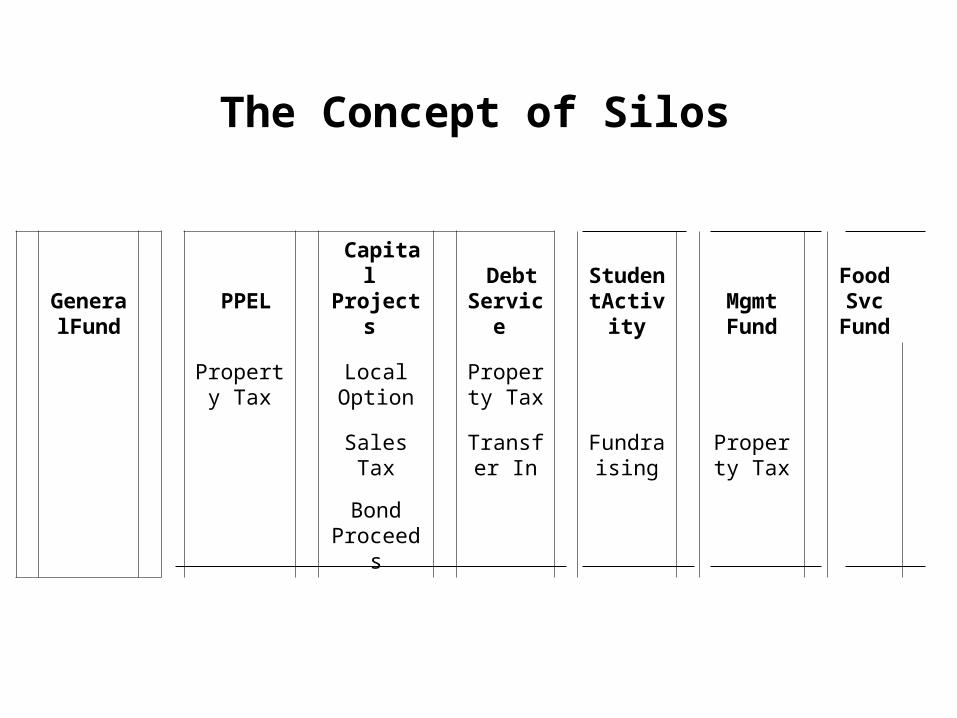
General
Fund PPEL
Capital Projects
Debt Service
StudentActivity
Mgmt Fund
Food Svc
Fund
Property
TaxLocal Option
Property Tax
Sales TaxTransfer
InFundrai
singProperty
Tax
Bond
Proceeds
The Concept of Silos

School Aid - Basics
• Basic Principles:– The school aid formula is a child-based
formula.– The formula provides funding on a per
child basis.– The total amount of foundation formula
revenue is the number of children times a cost per child.
School Aid - Basics
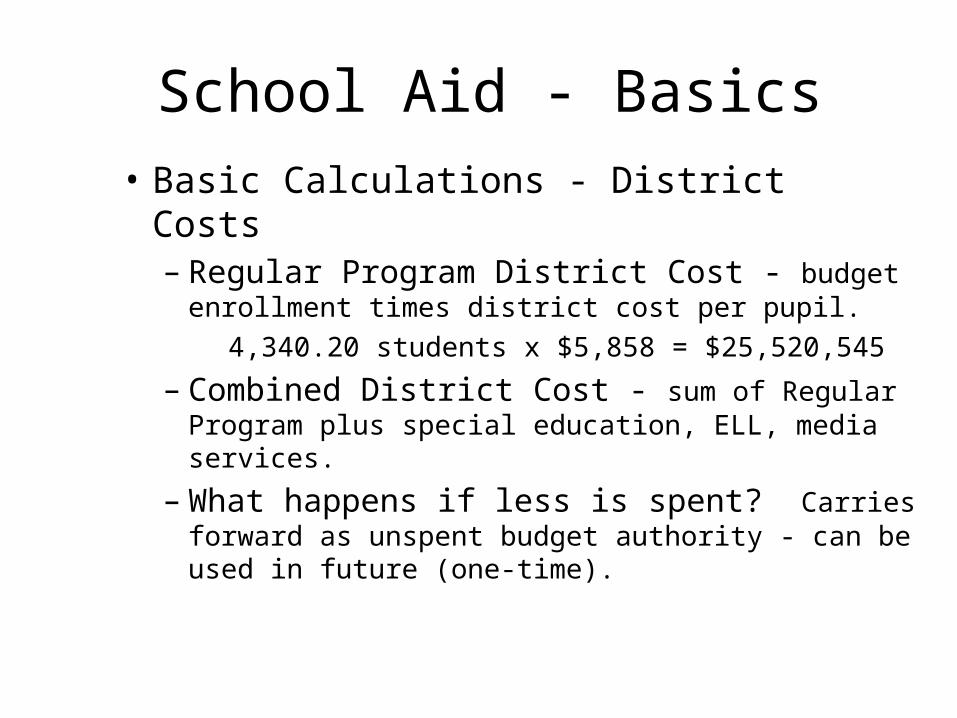
• Basic Calculations - District Costs – Regular Program District Cost - budget
enrollment times district cost per pupil.
4,340.20 students x $5,858 = $25,520,545
– Combined District Cost - sum of Regular Program plus special education, ELL, media services.
– What happens if less is spent? Carries forward as unspent budget authority - can be used in future (one-time).

The Concept of Spending Authority
SPENDING AUTHORITY CASH
Combined District Cost (Funding Formula)
District Cost per Pupil x Certified Enrollment plus additional
weightings for ELL, Spec Ed, Media Services
State Aid (Funding Formula)
Miscellaneous Income Property Taxes (Funding Formula)
Unspent Budget Authority Cash Reserves (Savings)
Consequence of Exceeding Budget Authority
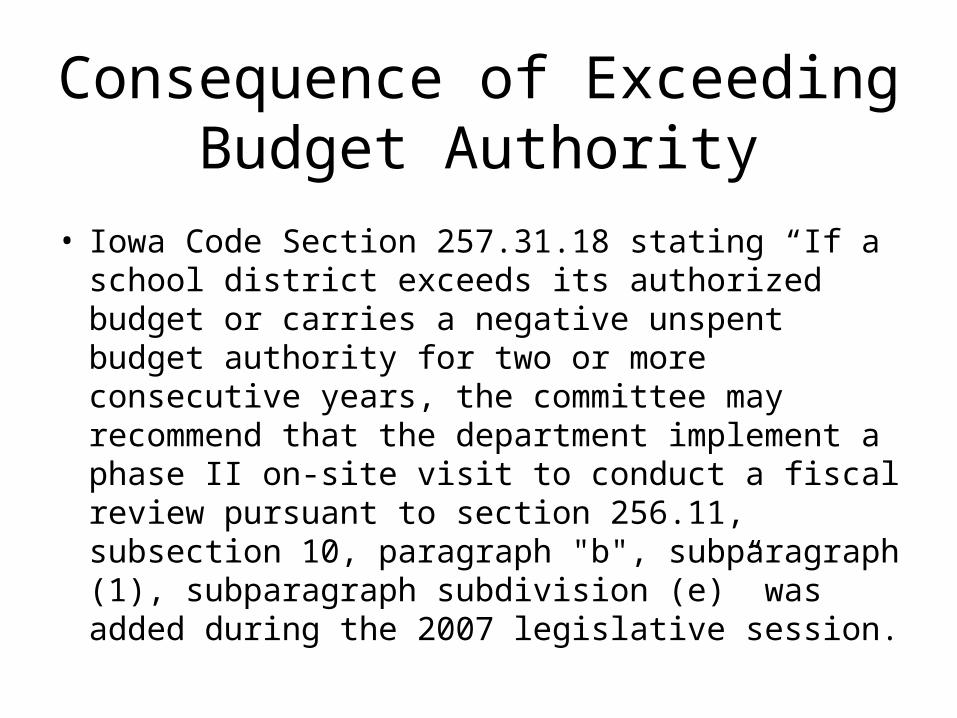
• Iowa Code Section 257.31.18 stating “If a school district exceeds its authorized budget or carries a negative unspent budget authority for two or more consecutive years, the committee may recommend that the department implement a phase II on-site visit to conduct a fiscal review pursuant to section 256.11, subsection 10, paragraph "b", subparagraph (1), subparagraph subdivision (e)” was added during the 2007 legislative session.
Allowable Growth
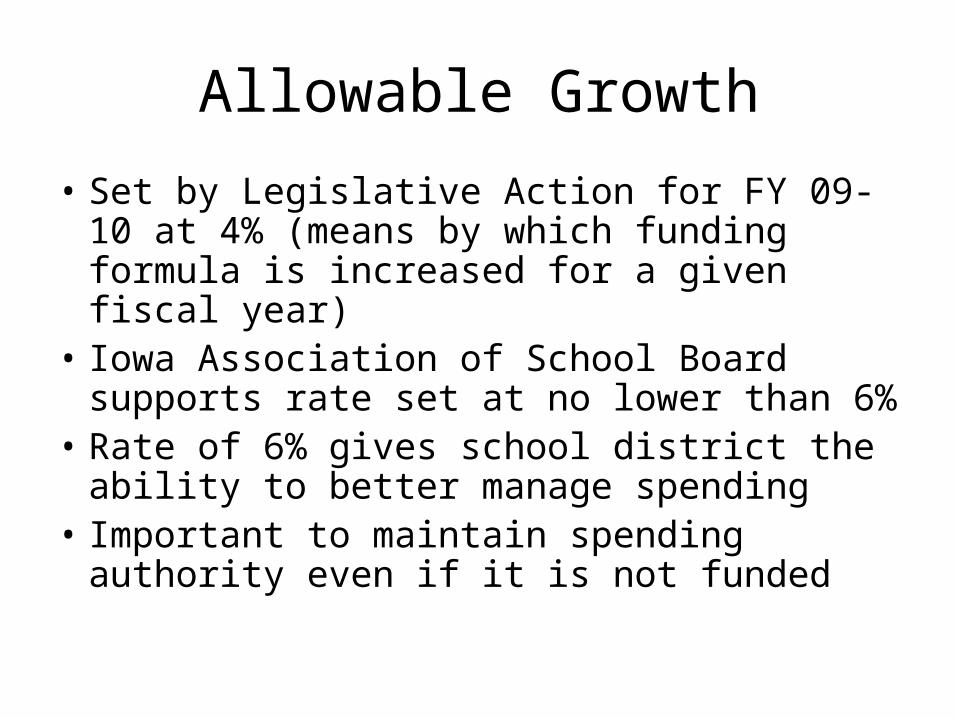
• Set by Legislative Action for FY 09-10 at 4% (means by which funding formula is increased for a given fiscal year)
• Iowa Association of School Board supports rate set at no lower than 6%
• Rate of 6% gives school district the ability to better manage spending
• Important to maintain spending authority even if it is not funded
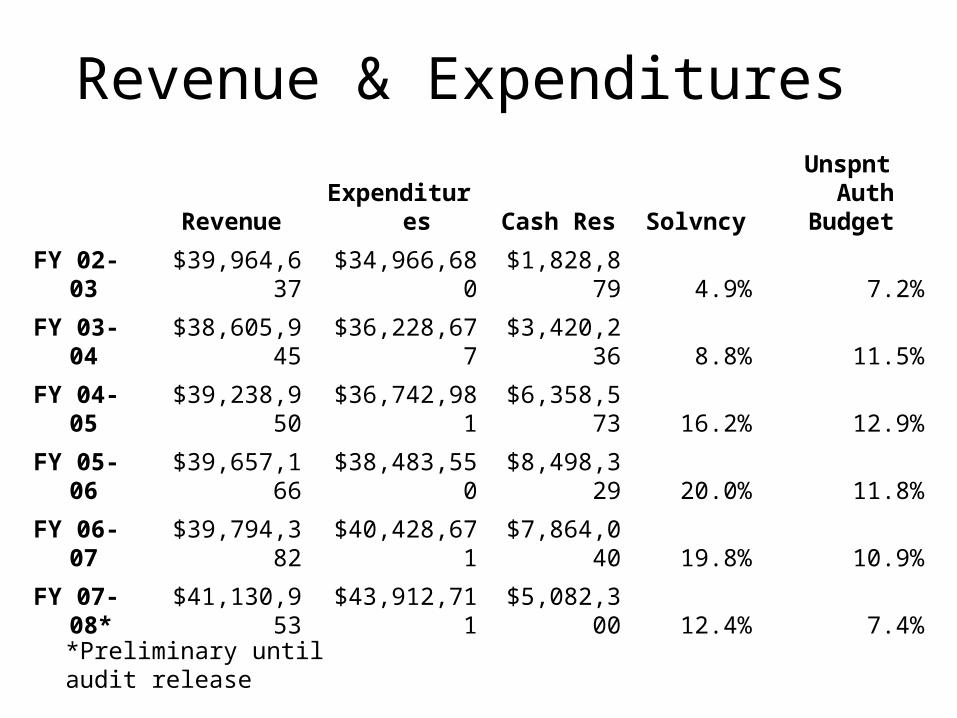
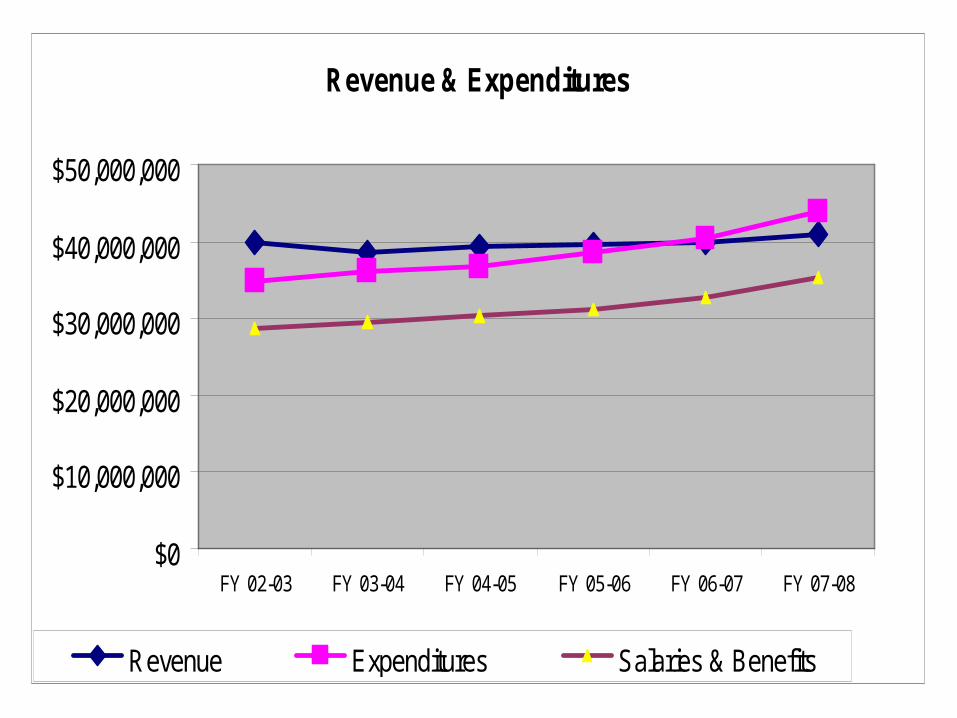
Revenue & Expenditures
Revenue Expenditures Cash Res SolvncyUnspnt Auth
Budget
FY 02-03 $39,964,637 $34,966,680 $1,828,879 4.9% 7.2%
FY 03-04 $38,605,945 $36,228,677 $3,420,236 8.8% 11.5%
FY 04-05 $39,238,950 $36,742,981 $6,358,573 16.2% 12.9%
FY 05-06 $39,657,166 $38,483,550 $8,498,329 20.0% 11.8%
FY 06-07 $39,794,382 $40,428,671 $7,864,040 19.8% 10.9%
FY 07-08* $41,130,953 $43,912,711 $5,082,300 12.4% 7.4%
*Preliminary until audit release

FY 07-08 Actual-Revenue
Property Taxes $16,752,957 40.7%
State Aid $12,472,358 30.3%
Income Surtax $1,956,497 4.8%
State Categorical Funds $3,832,267 9.3%
Federal Grants $1,393,518 3.4%
Tuition $3,238,304 7.9%
Investment Earnings $478,458 1.2%
Transportation Fees $181,018 0.4%
Other Local Revenue $825,575 2.0%
$41,130,952 100.0%
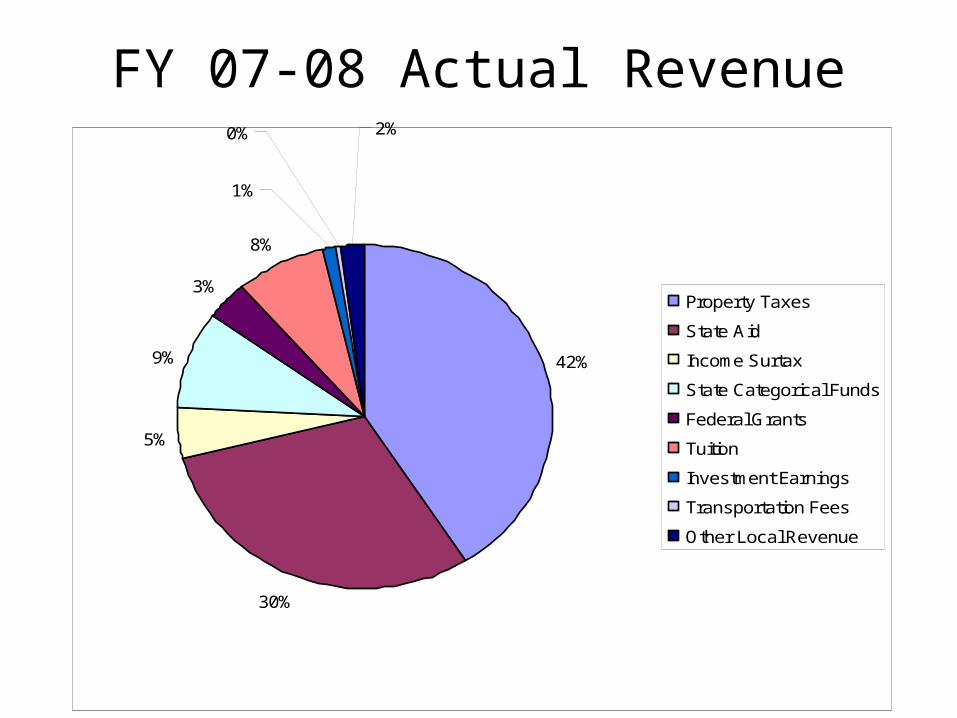
FY 07-08 Actual Revenue
42%
30%
5%
9%
3%
8%
2%0%
1%
Property Taxes
State Aid
Income Surtax
State Categorical Funds
Federal Grants
Tuition
Investment Earnings
Transportation Fees
Other Local Revenue
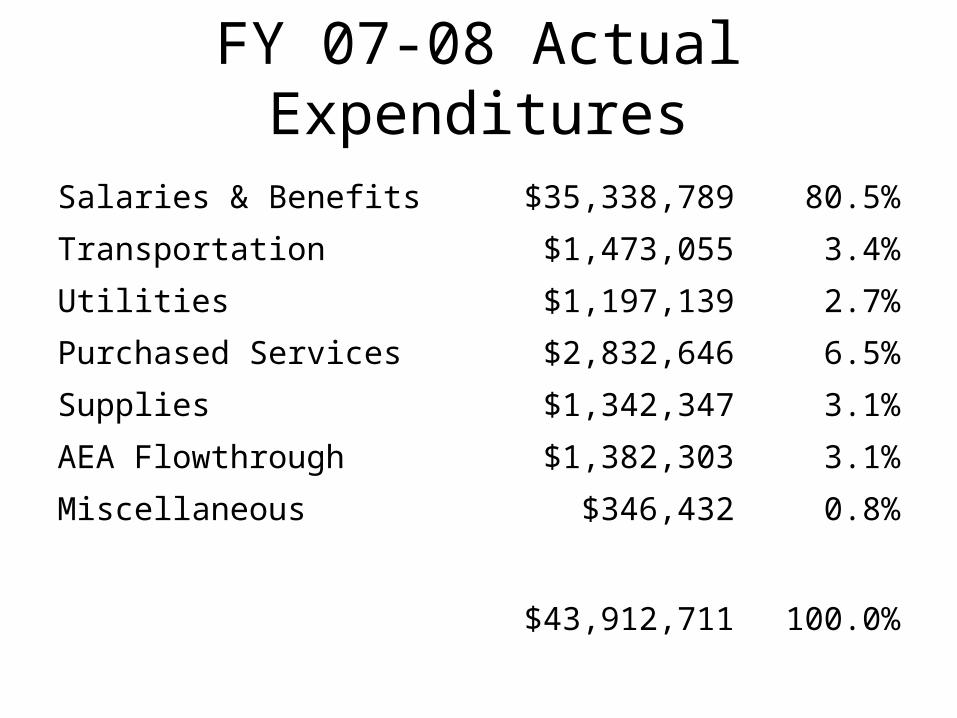
FY 07-08 Actual Expenditures
Salaries & Benefits $35,338,789 80.5%
Transportation $1,473,055 3.4%
Utilities $1,197,139 2.7%
Purchased Services $2,832,646 6.5%
Supplies $1,342,347 3.1%
AEA Flowthrough $1,382,303 3.1%
Miscellaneous $346,432 0.8%
$43,912,711 100.0%

FY 07-08 Actual Expenditures
81%
3%
3%
6%3% 3%
1%
Salaries & Benefits
Transportation
Utilities
Purchased Services
Supplies
AEA Flow through
Miscellaneous
3,800
4,000
4,200
4,400
4,600
4,800
5,000
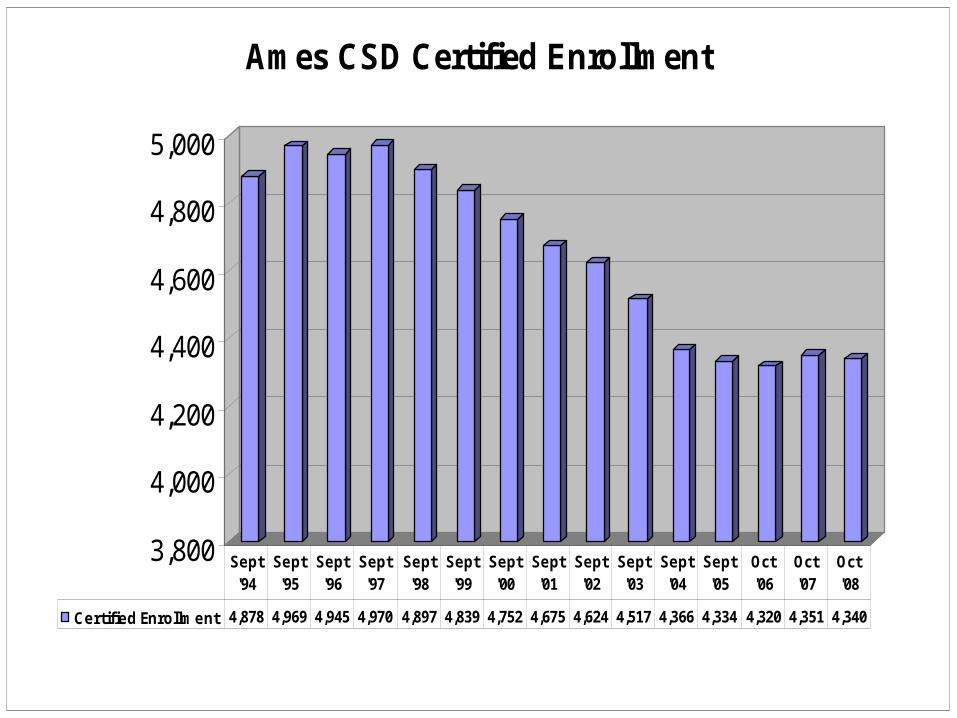
Ames CSD Certified Enrollment
Certified Enrollment 4,878 4,969 4,945 4,970 4,897 4,839 4,752 4,675 4,624 4,517 4,366 4,334 4,320 4,351 4,340
Sept '94
Sept '95
Sept '96
Sept '97
Sept '98
Sept '99
Sept '00
Sept '01
Sept '02
Sept '03
Sept '04
Sept '05
Oct '06
Oct '07
Oct '08
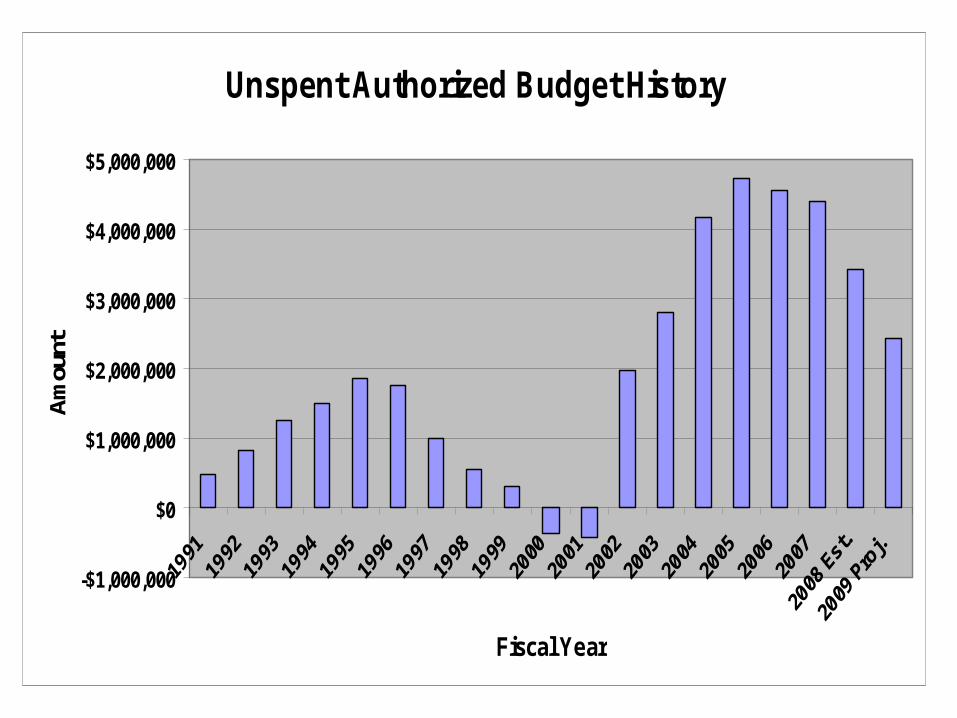
Unspent Authorized Budget History
-$1,000,000
$0
$1,000,000
$2,000,000
$3,000,000
$4,000,000
$5,000,000
Fiscal Year
Am
ount
Revenue & Expenditures
$0
$10,000,000
$20,000,000
$30,000,000
$40,000,000
$50,000,000
FY 02-03 FY 03-04 FY 04-05 FY 05-06 FY 06-07 FY 07-08
Revenue Expenditures Salaries & Benefits

Labor Costs as % of General Fund
Revenue ExpendituresSalaries &
Benefits % of Rev % of Exp
FY 02-03 $39,964,637 $34,966,680 $28,689,092 71.8% 82.0%
FY 03-04 $38,605,945 $36,228,677 $29,638,017 76.8% 81.8%
FY 04-05 $39,238,950 $36,742,981 $30,233,075 77.0% 82.3%
FY 05-06 $39,657,166 $38,483,550 $31,005,469 78.2% 80.6%
FY 06-07 $39,794,382 $40,428,671 $32,706,495 82.2% 80.9%
FY 07-08 $40,943,353 $43,912,711 $35,338,789 86.3% 80.5%
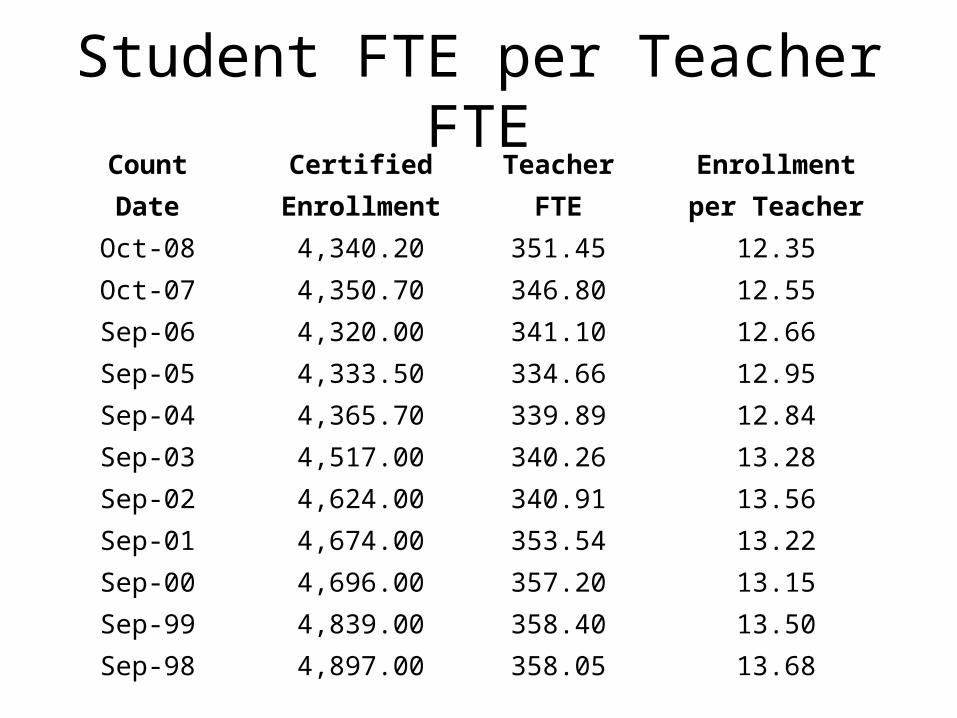
Student FTE per Teacher FTECount Certified Teacher Enrollment
Date Enrollment FTE per Teacher
Oct-08 4,340.20 351.45 12.35
Oct-07 4,350.70 346.80 12.55
Sep-06 4,320.00 341.10 12.66
Sep-05 4,333.50 334.66 12.95
Sep-04 4,365.70 339.89 12.84
Sep-03 4,517.00 340.26 13.28
Sep-02 4,624.00 340.91 13.56
Sep-01 4,674.00 353.54 13.22
Sep-00 4,696.00 357.20 13.15
Sep-99 4,839.00 358.40 13.50
Sep-98 4,897.00 358.05 13.68

Student to Teacher Ratio
Enrollment per Teacher
11.50
12.00
12.50
13.00
13.50
14.00
1998 1999 2000 2001 2002 2003 2004 2005 2006 2007 2008
Count Date
Students per Teacher
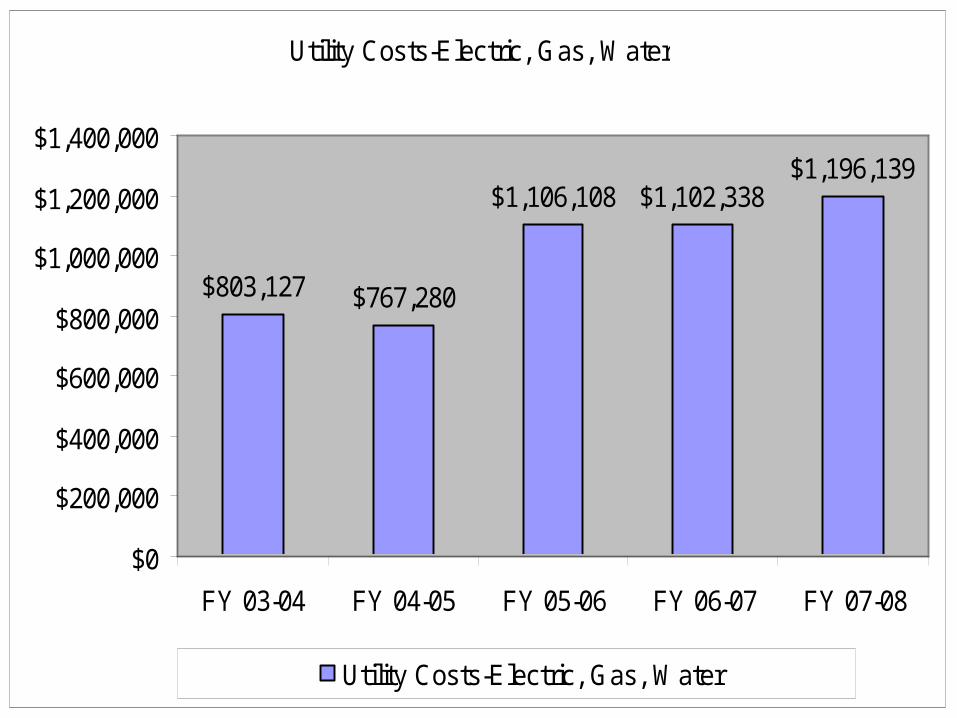
Utility Costs-Electric, Gas, Water
$803,127 $767,280
$1,106,108 $1,102,338$1,196,139
$0
$200,000
$400,000
$600,000
$800,000
$1,000,000
$1,200,000
$1,400,000
FY 03-04 FY 04-05 FY 05-06 FY 06-07 FY 07-08
Utility Costs-Electric, Gas, Water

Budget Outlook – New RevenueNew Revenue: FY 10 (2009-10)
New Money * $904,346
New Money dedicated to Spec Ed -$92,500
Turnover Savings $20,000
Cost Savings & Other Sources $ 831,846
New Costs:
Special Ed Transportation $250,000
Lost Fee Revenue $200,000
Lost State Aid $282,000
$ 732,000
Potential Shortfall/(Available Money) $99,846
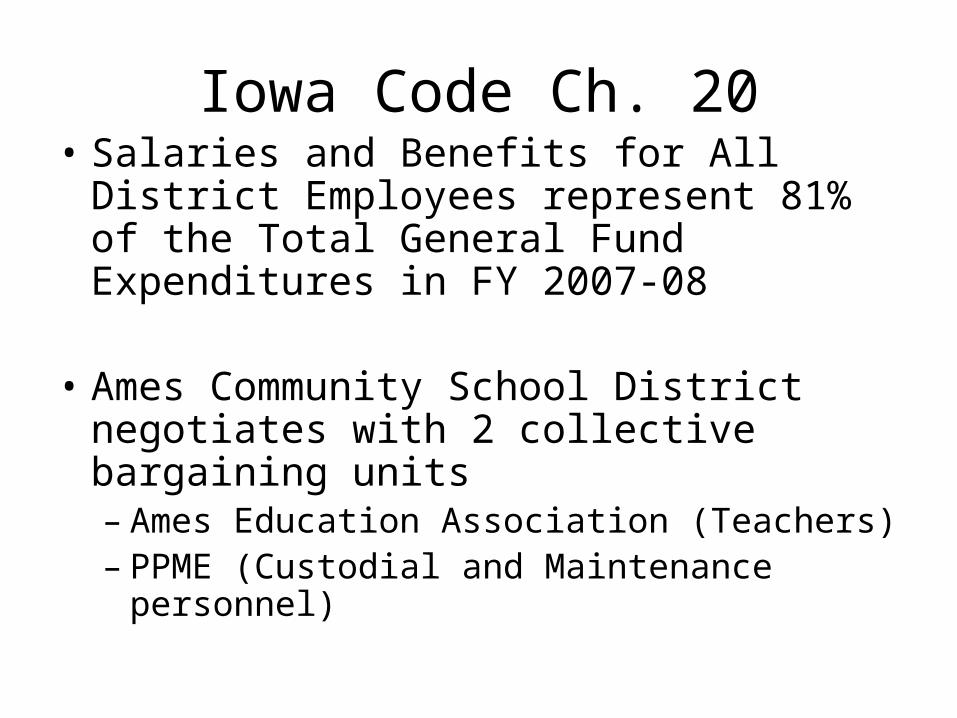
Iowa Code Ch. 20• Salaries and Benefits for All District
Employees represent 81% of the Total General Fund Expenditures in FY 2007-08
• Ames Community School District negotiates with 2 collective bargaining units– Ames Education Association (Teachers)– PPME (Custodial and Maintenance
personnel)
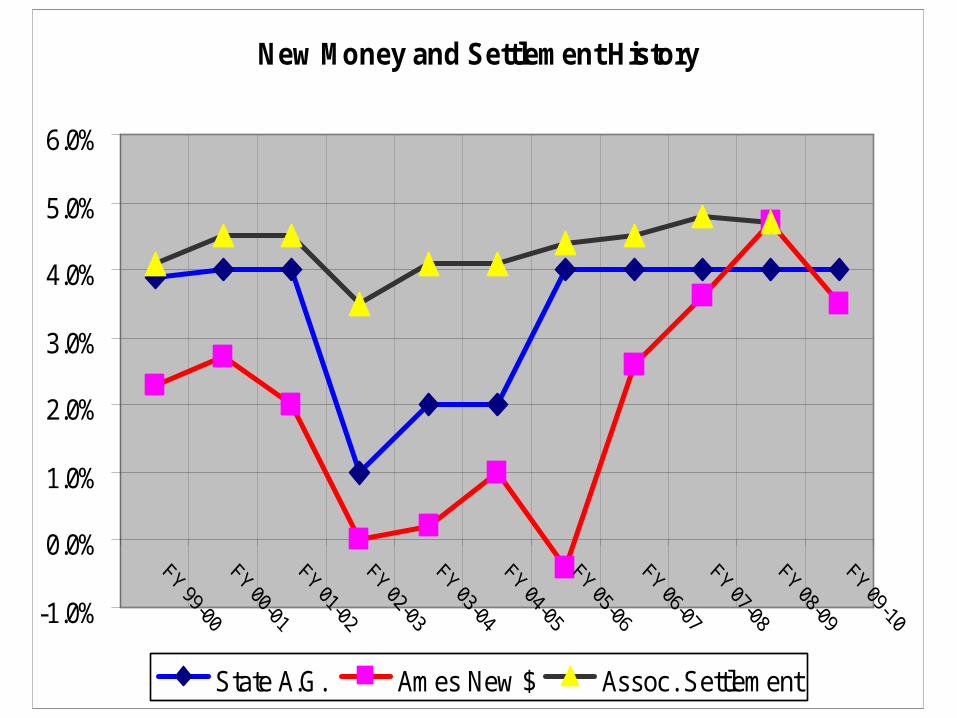
New Money and Settlement History
-1.0%
0.0%
1.0%
2.0%
3.0%
4.0%
5.0%
6.0%
State A.G. Ames New $ Assoc. Settlement