Embed Size (px)
Citation preview

FY 2015 Analysts’ Briefing19 February 2016

Outline
2
1. FY 2015 Results• Financial Statements• Margins• Capex• Operating Statistics
2. Updates on 2020-40 Plan
3. 2016 CAPEX

Outline
3
1. FY 2015 Results• Financial Statements• Margins• Capex• Operating Statistics
2. Updates on 2020-40 Plan
3. 2016 CAPEX

Key Messages
4
1. Steady net income growth of 19% to P17.6b
• Revenues increased 13% to P107.2b driven by the sustained performance of core businesses which grew 22% before intercompany adjustments
• Margins improved across product lines
2. Healthy balance sheet with a cash position of P19.5b and a net gearing of 0.74x
3. Capex spend reached P82.2b
4. Launched 3 estates and P120.4b worth of residential and leasing projects

Steady net income growth of 19% to P17.6b
5
• Revenues higher by 13%
• GAE ratio improved to 6.2% from 6.5%
• EBIT margin higher at 32% (vs. 31%)
*Includes interest income on accretion. Per statutory reporting (17A), interest income on accretion is classified under Interest Income
Income Statement FY 2015 FY 2014 Change %
(in Php millions) Total Revenues 107,183 95,197 11,986 13%Real Estate* 105,466 93,041 12,425 13%Interest & Other Income 1,717 2,156 (439) -20%
Equity in Net Earnings of Associates and JVs (140) 647 (787) -122%Interest & Investment Income 1,175 803 372 46%Other Income 683 706 (23) -3%
Expenses 79,432 71,340 8,092 11%Real Estate 65,335 59,396 5,939 10%GAE 6,592 6,203 389 6%Interest Expense, Financing and other charges 7,505 5,742 1,764 31%Income Before Income Tax 27,751 23,857 3,894 16%
Provision for Income Tax 6,854 6,142 712 12%Income before Non-Controlling Interest 20,897 17,715 3,182 18%Non-Controlling Interest 3,267 2,912 355 12%NIAT Attributable to ALI Equity Holders 17,630 14,803 2,828 19%

Revenue BreakdownFY 2015 FY 2014 Change %
(in P millions) Property Development 72,570 65,854 6,716 10%
Residential 62,711 55,877 6,835 12% New bookings and project completion
Office for Sale 6,907 5,258 1,649 31% Contribution of new launches and higher completion of HSS Corp Plaza
Comm’l/Ind’l lots 2,951 4,719 (1,768) -37% Higher Arca South and Nuvali commercial lot sales in 2014
Commercial Leasing 24,497 21,206 3,292 16%Shopping Center 13,366 11,359 2,007 18% Improved performance of new malls;
higher occupancy and average rental of existing malls
Office 5,157 4,229 929 22% Contribution of new offices; higher occupancy and average rental of existing offices
Hotels and Resorts 5,974 5,618 357 6% Higher occupancyServices 45,245 29,796 15,449 52%
Gross Construction 44,068 28,761 15,306 53% Increase in order bookProperty Mgmt. 1,177 1,034 142 14% Increase in managed properties
Sub -Total 142,312 116,855 25,456 22%Interco Adjustments (36,846) (23,814) (13,032) 55%Real Estate Revenues 105,466 93,041 12,425 13%Interest & Other Income 1,717 2,156 (439) -20% Lower equity in net earnings of FBDC
Total Revenues 107,183 95,197 11,986 13%
Sustained performance of core real estate businesses
6

Improved margins across product lines
7
Margin Performance 2015 2014
Property Development (Gross profit)
Residential
Horizontal 44% 43% Sale of higher margin horizontal projectsVertical 34% 33% Steady margins across vertical projects
Office for Sale 38% 38% Maintained office for sale marginsCommercial and Industrial Lots 50% 45% Sale of higher margin commercial lots in Arca
South, Nuvali and Westborough Park
Commercial Leasing (EBITDA)
Shopping Centers 69% 65% Higher occupancy, lower DOEs and improved performance of new malls
Office 90% 87% Higher occupancy and average rental of existing buildings, positive contribution of new offices
Hotels & Resorts 28% 28% Sustained performance of hotel operationsServices (EBITDA)
Construction and Property Management
14% 11% Higher margins from GAE savings and DOE efficiency

2011 2012 2013 2014 2015
Other Vismin
Other Luzon
Other MM
FTI
Manila
Vertis
Cebu
Alabang
BGC
Nuvali
Makati
8
Continued diversification into new growth centers
27%
24%
]]
]
32% ]36%
NIAT contribution per business center
]34%

9
Continued build up of recurring income business
* Excludes NIAT from services. Target is to increase the recurring income contribution to 50% by 2020
NIAT contribution per core business segment*
2011 2012 2013 2014 2015
Hotels & Resorts
Office
Malls
Comm'l / Ind'l Lots
Bellavita
Amaia
Avida
Alveo
ALP
]]
38% ]36%
29%
]27%
]34%

Healthy Balance Sheet to support growth
10
*Includes FVPL (financial assets at fair value through profit and loss) **Equity is inclusive of minority interest
Balance Sheet December DecemberChange %
(in P millions) 2015 2014
Cash & Cash Equivalents* 19,540 34,587 (15,047) -44%Total Borrowings 130,996 124,666 6,330 5%Stockholders’ Equity 149,825 121,996 27,829 23%
Current Ratio 1.14 1.22 - -Debt-to-Equity Ratio** 0.87 1.02 - -Net Debt-to-Equity Ratio** 0.74 0.74 - -Return on Equity 14.7% 14.4% - -

201320122011
Fixed58%
Float42%
Fixed53%
Float47%
Fixed69%
Float31%
Fixed74%
Float26%
2014
As of December 31, 2015Total Borrowings: Php131B, Short-term Php10.5B
11
Fixed84%
Float16%
2015
0.62.0
2.9 2.6
6.6
3.5
5.1
8.8
4.3
8.5
13.1
15.7
12.9
14.4
9.7
15.1
8.0 8.5
2.0
10.5
7.9%7.3%
6.2%
5.3% 5.1%4.5%
4.7%
0
2
4
6
8
10
12
14
16
18
0.0%
1.0%
2.0%
3.0%
4.0%
5.0%
6.0%
7.0%
8.0%
9.0%
09 10 11 12 13 14 15 16 17 18 19 20 21 22 23 24 25 26 27 28 29 30 31 32 33
Short-term Debt Maturity(in Php Billions)
Long-term Debt Maturity(in Php Billions)
Borrowing Cost
Debt mix and maturities at manageable levels

Capex spend at P82b
12
Historical Capex(In Php billions)
FY 2015 Capex Spend(In Php billions)
Land Acquisition
28%
Residential40%
Malls11%
Offices8%Hotels
2%
Estate Developme
nt4%
Others*7%
2531
39
5159
5
41 27
3223
2011 2012 2013 2014 2015
Project Completion Land Acquisition
P30b
P72bP66b
P83b P82b
* ALI Capital, Services and other investments e.g MCT BHd

2011 2012 2013 2014 2015
ALP
Alveo
Avida
Amaia
BellaVita
• Sales take-up of P105.3b (average of P8.8b in monthly sales)
• Overseas Filipino Sales : P26.7b (25% of total sales)
• Booked sales of P74.9b
Residential: Sales take-up 4% higher yoy
13
Sales Take-Up (In Php Bn)
51.7
77.6
91.9101.7 105.3
2011 2012 2013 2014 2015
ALP
Alveo
Avida
Amaia
BellaVita
Booked Sales (In Php Bn)
33..3
51.5
67.8
76.7 74.9

1219
48
65
99
122129
2009 2010 2011 2012 2013 2014 2015
Unbooked Revenues
14
• Unbooked revenues up 6% yoy (P129b vs P122b in 2014)
• 2.3x residential revenues in FY2014 (P55.9b)
Steady build-up of unbooked revenues
(in Php Billions)

15
Key Launches: Estates
Vermosa Estate (700 has.)Imus-Dasmarinas Cavite(September 2015)
700 has.• 400 (Residential)• 124 (CBD)• 10 (Institutions)• 165 (open space)
Mall
Avida
Qualimed
Alveo
Cloverleaf Estate (11 has.) Balintawak, QC (April 2015)• (Phase 1) 39,000 sqm Mall, Qualimed Hospital• 3 Avida Towers, 2 Alveo Towers
Capitol Central
Capitol Central (9 has.) Bacolod City, (Mar 2015)• 70K GLA Mall, 1 Office Tower, 154-room SEDA• 2 Amaia Towers

16
Key Launches: Residential
East Veranda (August 2015)Arca South Taguig(199 units, P1.7b), 47% cum take-up
One Union Place - Tower 2 (Mar 2015) Arca South Taguig(480units, Php1.7b), 76% cum. take-up
Atria – Tower 2 (May 2015)Atria Park District Iloilo(321 units, P949m) 59% cum. take-up
RioMonte (May 2015)Nuvali Laguna(520 lots, P4.8b), 74% cum. take-up
West Gallery Place (June 2015)BGC Taguig420 units, P10.3b, 29% cum. take-up
Montala Ph1 (June 2015)Alviera Porac(354 units, P1.4b) 72% cum. take-up

Key Launches: Residential
17
Steps Alabang A&B (August 2015)Alabang385 units, P985m, 89% cum. take-up
Scapes Gen Trias (March 2015)Cavite155 units, P275 m, 99% cum. take-up
Bellavita CDO (May 2015)Cagayan de Oro1,600 units, P720m, 69% cum. take-up
BellaVita Cabanatuan 2 (October 2015)Cabanatuan (2,263 units, Php1,018m), 11% cum. Take-up

Key Launches: Office for Sale
18
Alveo Financial Tower (Sept 2015)Makati CBD363 units, P9.2b, 63% cum. take-up
Stiles West Tower (Feb 2015)Circuit Makati287 units, P3.6b, 41% cum. take-up

• Key Mall Space Completed (2015): 124K – Solenad 3 (40K)
– UP Town Center Ph1B (23K)
– Serin (11K)
– Circuit Lane (12k)
– Atria (8K)
– Legazpi (3k)
– Expansion (Trinoma & Marquee) (27k)
• Average Occupancy Rate: 94%
• Average Mall Lease Rate:
P1,155/sqm/month (up 1% yoy)
• Same Store Sales Growth: 3%
• Same Mall Rental Growth: 8%
19
Shopping Centers: GLA up 8% to 1.45m sqm GLA
Circuit Lane Makati (Sep) 12KGLA
Serin Tagaytay (Mar) 11K GLA
Solenad 3 Nuvali (Aug) 40K GLA
UP Town Center 1B (Sep) 23k GLA
Shops Atria (May) 8K GLA

Manila Bay (Nov)232K GLA
Central Block Cebu IT (Mar)42K GLA
Park Triangle (Feb)24K GLA
Capitol Central Bacolod (Mar)74K GLA
20
Shopping Centers Update
Completion Mall GLA (in k sqm)
2016 Lio El Nido 3
(177k) Vertis North QC 47
Legaspi 15
Southpark alabang 47
Riverside 1
UPTC Ph2 33
BHS Central ear lot 3
The 30th/Sunrise 28
2017 Feliz 80
(152k) Cloverleaf* 39
Circuit Mall Ph1 33
2018 Citygate 10
(480k) Park Triangle Retail* 24
Arca South Ph1 73
Capitol Central* 74
Circuit Mall Ph2 25
Central Bloc* 42
Manila Bay Area* 232
2019 ATG retail T2* 9
(9k)
Under Construction: 818k sqmShopping spaces key launches in 2015: 419k GLA
ATG T2 Retail (Jun)9K GLA *Mall spaces launched in 2015
Cloverleaf Mall (Aug)39K GLA

• Key Office Space Completed (2015): 78K GLA– BGC Corporate Center (27K)
– ATC Alabang BPO (18K)
– Boni Stopover (17K)
– Ebloc 4 (16K)
• Total Offices GLA: 715k sqm
• Average Occupancy Rate: 84%*
• Average Lease Rate:
P698/sqm/month (up 3% yoy)
• Leased-out rate: 94%
21
BGC Corp Center(27kGLA)
ATC BPO Alabang(18k GLA)
Bonifacio Stopover(17k GLA)
Ebloc 4(16kGLA)
* Includes new office spaces leased for fit-out. Occupancy (stable) ~ 94%
Offices: GLA up 17% yoy to 715K sqm GLA

Offices Update
BGC Corporate Center (Feb)(34K GLA) 22
Under Construction: 715GLA
Completion Office GLA (in k sqm)
2016 The 30th Sunrise 47
(189k) Centrio 9
Boni Stopover 18
Vertis 1 41
PSE at BGC 29
ACC Cebu BPO 29
UP Technohub Bldg P* 10
UPIS 6
2017 Vertis 2 42
(177k) Circuit 1 45
Arca South BPO 1 33
Circuit 2 26
Citygate Ph1 HQ 19
Southpark BPO 12
2018 Arca South BPO 2 47
(193k) Citygate Ph1 BPO 37
Vertis 3 36
Manila Bay (BPO)* 18
BGC Corp Center 1 26
eBloc 5 29
2019 Arca South BPO 3 17
(90k) eBloc 6 39
BGC Corp Center 2* 34
2020 ATG T2* 66
(66k)
Offices spaces launches in 2015: 128k GLA
Manila Bay Area (Nov)(18k GLA)
ATG Tower 2 (Jun)(66k GLA)
UP Bldg P (May)(10k GLA)
*Office spaces launched in 2015

Hotels and Resorts: 2,324* rooms in operation
23
FY 2015 Hotels Resorts
No. of rooms in operation
Branded: 1,294*Seda: 817
El Nido Resorts: 213
Revpar/night P3,888(up 1%)
P7,557(up 13%)
Average room rate
P5,321(up 1%)
P13,078(down 7%)
Average occupancy
73% (up .4 pts)
58% (up 10 pts)
Key opening in 2015: 152 Rooms
Seda Iloilo(152 Rooms)
*includes Intercon (333 rooms) closed for redev on January 01, 2016

Completion Hotel No. ofRooms
2016 El Nido B&B 2* 42Seda Bacolod* 154
2017 Seda Vertis North 438Seda Lio 153
2018 Seda Circuit 255Seda Arca South 265Seda CITP 214Seda BGC Expansion 341
2019 Seda GatewayMakati
293
Seda Bay Area* 351
2020 Mandarin Oriental* 275
24
Hotels and Resorts UpdateUnder Construction: 2,781 RoomsKey Launches in 2015 : 822 Rooms
Mandarin Oriental (June)275 Rooms
SEDA Bay Area (Nov)351 Rooms
SEDA Bacolod (March)154 Rooms
Lio B&B (Dec)42 Rooms
*Hotels launched in 2015

Outline
26
1. FY 2015 Results• Financial Statements• Margins• Capex• Operating Statistics
2. Updates on 2020-40 Plan
3. 2016 CAPEX
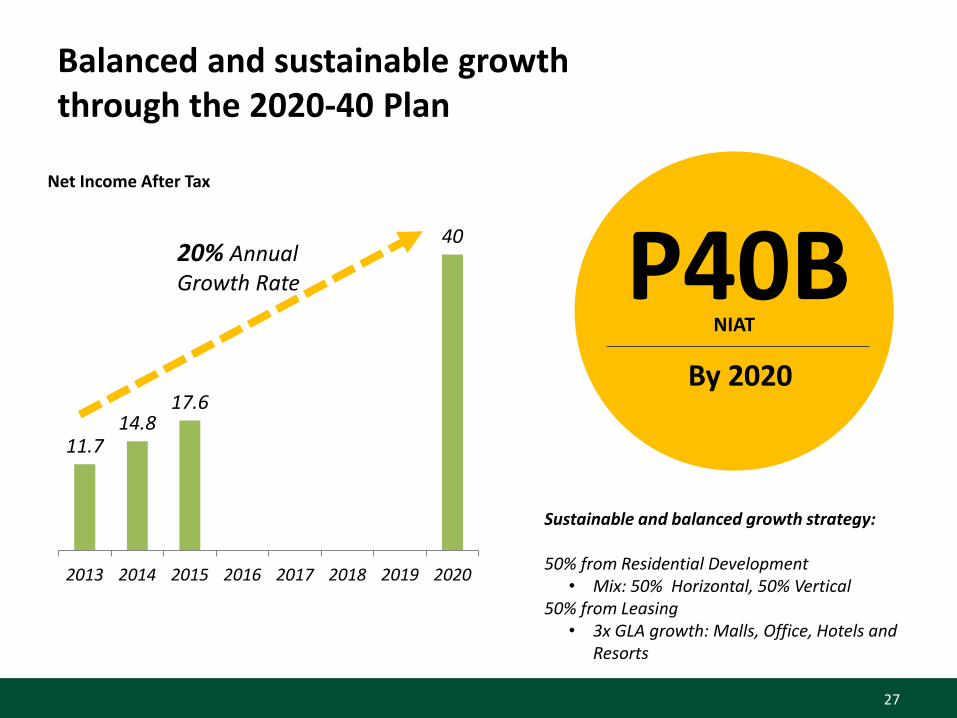
11.714.8
17.6
40
2013 2014 2015 2016 2017 2018 2019 2020
Net Income After Tax
P40BNIAT
By 2020
20% AnnualGrowth Rate
27
Sustainable and balanced growth strategy:
50% from Residential Development• Mix: 50% Horizontal, 50% Vertical
50% from Leasing• 3x GLA growth: Malls, Office, Hotels and
Resorts
Balanced and sustainable growth through the 2020-40 Plan
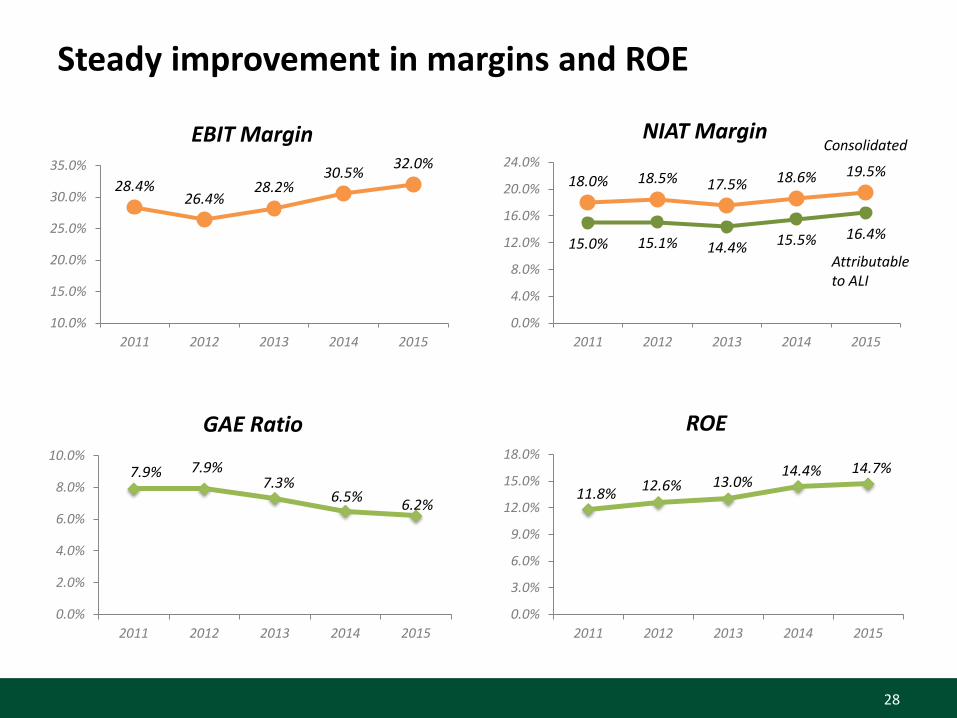
Steady improvement in margins and ROE
28
18.0% 18.5% 17.5% 18.6% 19.5%
15.0% 15.1% 14.4% 15.5% 16.4%
0.0%
4.0%
8.0%
12.0%
16.0%
20.0%
24.0%
2011 2012 2013 2014 2015
NIAT Margin
11.8%12.6% 13.0%
14.4% 14.7%
0.0%
3.0%
6.0%
9.0%
12.0%
15.0%
18.0%
2011 2012 2013 2014 2015
ROE
7.9% 7.9%7.3%
6.5%6.2%
0.0%
2.0%
4.0%
6.0%
8.0%
10.0%
2011 2012 2013 2014 2015
GAE Ratio
28.4%26.4%
28.2%30.5%
32.0%
10.0%
15.0%
20.0%
25.0%
30.0%
35.0%
2011 2012 2013 2014 2015
EBIT MarginConsolidated
Attributable to ALI

29
(35) Residential/Office for Sale(7) Shopping Centers(4) Offices(4) Hotel and Resorts(3) Estates
Cloverleaf Balintawak
ATG Redev Makati Park Triangle BGC
Central BlocCebu IT Park
Capitol Central Bacolod
Vermosa, Cavite
Manila Bay Area
Arca South (BPOs)
2015 Launches: 53 projects worth P120.4b

1,080 1,188 1,259 1,336 1,452
266 342 287
497
911
2011 2012 2013 2014 2015
Operational Under Construction
Expanded aggressively across all business segments
30
Malls
Offices Hotel Room Keys
Residential Sales Take-Up (In Php Bn)
2011 2012 2013 2014 2015
ALP
Alveo
Avida
Amaia
BellaVita
51.7
77.6
91.9
101.7105.3
429 509 562 612 715 162
240 237
693 715
2011 2012 2013 2014 2015
Operational Under Construction
591749 799
1,3051,430
784 1,467
2,001 2,162 2,324 765 462
893
2,066 2,781
2011 2012 2013 2014 2015
Operational Under Construction
1,5491,929
2,894
4,228
5,105
2,363
1,3461,530 1,546
1,782

31
Malls GLA : 1.2 to 3.6(in million sqm.)
• Regional Malls• Lifestyle Malls• Value Malls• Community Centers
Office GLA : 0.5 to 1.8(in million sqm.)
Hotels and Resorts : 2k to 6.0k(# of rooms in thousands )
• Headquarter Type Offices• BPO-Type Facilities
• SEDA Hotels• Island Resorts and Estates• International Brand
Formats
Leasing: Continued expansion of investment propertiesMalls, Offices and Hotels and Resorts growth
0.5 0.60.7
1.8
2013 2014 2015 2016 2017 2018 2019 2020
1.2 1.3 1.4
3.6
2013 2014 2015 2016 2017 2018 2019 2020
2.0 2.1 2.3
6.0
2013 2014 2015 2016 2017 2018 2019 2020
3x GLA3x GLA 3x Room Keys

• 8,948 hectares of developable land bank
• Presence in 55 growth centers across the Philippines
32
*Includes Makati, Bonifacio Global City, other Mega Manila, Metro Cebu, Metro Davao, Bacolod, Iloilo, Cagayan de Oro
4,325 4,986
7,459 7,749 7,964 560
708
994 890 984
2011 2012 2013 2014 2015
Suburban In City*
8,453
5,695
4,885
8,6398,948
Existing
Leisure
Legend:
8,948 has. of developable land bank in 55 growth centers
Cabanatuan
CDO
BacolodIloilo
Cebu
Metro Manila
Tuguegarao
Rizal
Naga
Legazpi
Bulacan
Davao
Sicogon
Cavite
Baguio
Anvaya, Bataan
Laguna Lucena
El Nido
Batangas
Pampanga SJDM
Pangasinan
Tarlac

Outline
33
1. FY 2015 Results• Financial Statements• Margins• Capex• Operating Statistics
2. Updates on 2020-40 Plan
3. 2016 CAPEX

Capex projection for FY16 of P85b
Capex Spend2016
(in Pb)
Land Acquisition 15
Residential development 34
Malls 14
Offices 7
Hotels and Resorts 3
Estate Development 4
Others* 7
Total 85
Land Acquisition,
18%
Residential development
40%
Malls 16%
Offices 8%
Hotels and Resorts 4%
Estate Development
5%Others* 9%
* ALI Capital, Services and other investments e.g MCT BHd

Key Messages
35
1. Steady net income growth of 19% to P17.6b
• Revenues increased 13% to P107.2b driven by the sustained performance of core businesses which grew 22% before intercompany adjustments
• Margins improved across product lines
2. Healthy balance sheet with a cash position of P19.5b and a net gearing of 0.74x
3. Capex spend reached P82.2b
4. Launched 3 estates and P120.4b worth of residential and leasing projects

Thank You.
INVESTOR RELATIONS
30F Tower One and Exchange Plaza, Ayala Triangle, Makati City
T +9083676 │ F +632 7506790
www.ayalaland.com.ph