Embed Size (px)
Citation preview

FY 2017 Adopted Budget
Finance Department P.O. Box 619428 DFW Airport, Texas 75261-9428


FY 2017 Adopted Budget Introduction
1 DFW International Airport
Table of Contents Introduction
DFW’s Vision Statement and Board of Directors.…..................................................................... 2 DFW Infrastructure....................................................................................................................... 4 Strategic Plan................................................................................................................................ 6 DFW's Airline Use Rate Agreement Model................................................................................... 8 DFW Fund Structure……….........................................................................................................10 FY 2017 Budget Comparisons to Other Periods………………...……………………………….... 11 Budget Schedule.....………………………………………………………………............................. 12
Executive Summary FY 2017 Key Performance Indicators…......................................................................................13 FY 2017 Budget Comparisons and Walkforward……………..……………………………………..13 FY 2017 102 Fund Exposures……………………........................................................................ 15 Passenger Airline Cost per Enplanement (CPE).........................................................................17 Revenues Overview………………………….....……………………………………………………... 20 Capital Programs and Debt Financing.….………….................................................................... 21
Airline Cost Centers Airfield Cost Center……………………………........................................................................... 22 Terminal Cost Center………………………................................................................................ 25 Transfers - Joint Capital Account Transfer................................................................................. 27 Transfers - DFW Terminal Contribution...................................................................................... 28 Cost Per Enplanement (CPE) Calculation...………………………………………………………... 28
DFW Cost Center DFW Cost Center Revenues and Expenses.............................................................................. 30 Parking Business Unit................................................................................................................. 31 Concessions Business Unit........................................................................................................ 33 Rental Car Center (RAC) Business Unit..................................................................................... 34 Commercial Development Business Unit................................................................................... 35 Other DFW Revenues and Expenses......................................................................................... 36
Operating Expenses FY 2017 Expense Budget by Major Cost Driver......................................................................... 37 Operating Budget by Category................................................................................................... 42 Contingency Outside of Rate Base............................................................................................ 44 Net Debt Service Budget............................................................................................................ 45 Positions..................................................................................................................................... 47
Departments Department Overview and Walkforwards…............................................................................... 48
Capital Budget Projected Capital - Uses of Cash by Capital Account................................................................ 66 DFW Capital Account….............................................................................................................. 72 Joint Capital Account.................................................................................................................. 73 Capital Project Sources of Cash .............................................................................................. 74
FY 2017 Adopted Budget Introduction
2 DFW International Airport
Board of Directors
Sam Coats William Meadows Bernice J. Washington Mayor Mayor Lillie M. Biggins Board Chair Vice Chair Secretary Betsy Price Mike Rawlings Fort Worth
Dallas Fort Worth Dallas Fort Worth Dallas
Henry Borbolla III Bridget M. Lopez Regina Montoya Curtis E. Ransom Amir Rupani Mayor Fort Worth Dallas Dallas Dallas Dallas Linda Martin
Euless
DFW Vision Statement Travel. Transformed.
DFW Mission Statement We provide an exceptional Airport experience for our customers and
connect our community to the world.

FY 2017 Adopted Budget Introduction
3 DFW International Airport
Airport Background
The Dallas/Fort Worth International Airport (the “Airport” or “DFW”) was created by a “Contract and Agreement” between the cities of Dallas, Texas, and Fort Worth, Texas (“the Cities”) on April 15, 1968 for the purpose of developing and operating an airport as a joint venture between the Cities. Although owned by Dallas and Fort Worth, DFW is located within the boundaries of the Cities of Grapevine, Coppell, Irving, Euless, and Fort Worth; and within Dallas and Tarrant Counties.
Source: DFW Airport Information Technology Services/GIS Group

FY 2017 Adopted Budget Introduction
4 DFW International Airport
DFW is located within a four-hour flight time of 98% of the U.S. population, and currently ranks third among the world’s busiest airports in terms of operations and tenth in terms of passengers. Its central location is the focal point of one of the nation’s largest intermodal hubs, connecting air, rail, and interstate highway systems. DFW currently operates daily passenger flights to 211 destinations worldwide, including 156 nonstop domestic destinations and 55 nonstop international destinations. There are 25 passenger carriers and 20 cargo carriers serving DFW. DFW is the primary economic engine for North Texas. According to a recent study, DFW drives $37 billion in annual economic activity, supporting approximately 60,000 on-airport employees and a total of 228,000 local jobs with an annual payroll of $12.5 billion.
DFW Infrastructure Terminals – DFW has 5 terminals (A, B, C, D, and E) totaling 6.3 million square feet of building space, including 165 aircraft boarding gates, 373 ticketing positions with 96 supporting self-service kiosks, and 15 security checkpoints. As of June 1, 2016, 20 of the gates were closed for renovation as part of the Terminal Renewal and Improvement Program (TRIP). Collectively, the airlines averaged 6.7 turns per active gate per day for the first six months of FY 2016.
DFW Terminal Complex
American Airlines (“AA”) operates domestic service and international departures in Terminals A and C, and both domestic and international service in Terminal D. Envoy Aviation Group f/k/a American Eagle (“Envoy”), Mesa Airlines, and ExpressJet operate AA’s regional domestic and international service in Terminals B, D, and E. All other domestic flights and certain Canadian pre-cleared flights operate from Terminal E. All international flights requiring U. S. Customs and Immigration clearance operate from DFW’s Terminals D and B (with the exception of some Spirit Airlines international flights that arrive at Terminal E, and their passengers are bussed to Terminal D for customs clearance). All terminal gate leases expire September 30, 2020 per the terms of the Airline Lease and Use Agreement which became effective on October 1, 2010. DFW’s Federal Inspection Service (FIS) facilities are located in Terminal D. The Airport’s FIS facility is approximately 406,000 square feet with 36 inspection booths, 54 automated passport control kiosks, and 8 baggage carousels.

FY 2017 Adopted Budget Introduction
5 DFW International Airport
DFW is responsible for all of the janitorial and facility maintenance in Terminals B, D and E, and baggage maintenance in Terminals B and E. Most of the maintenance and janitorial functions are contracted out to third parties. Costs associated with maintenance of these facilities are included in DFW’s operating budget. AA is responsible for the majority of the facilities maintenance, custodial services, and the jet-bridge and baggage system maintenance in Terminals A and C. In Terminal D, AA maintains its preferentially leased jet-bridges and the entire baggage system for the terminal. The maintenance cost is paid directly by AA and not included in DFW’s budget or financial statements. AA receives a maintenance credit in the rates and charges calculation.
Airfield – With 7 runways, DFW has more airfield capacity than any other airport in the world. Five runways are configured as north/south parallels with two diagonals. Four of DFW’s runways are 13,400 feet in length. DFW is focused on the future and continues to work to support next generation aircraft such as the Airbus A380 and the Boeing 747-8F. Per FAA benchmark studies, the Airport’s designated hourly capacity arrival/departure flow is approximately 170 aircraft operations per hour under reduced instrument flight rule (IFR) weather conditions and approximately 226-264 aircraft operations per hour under optimum visual flight rule (VFR) weather conditions, a condition that prevails approximately 82% of the time. Airport Operations Center/Emergency Operations Center (AOC/EOC) – The Airport Operations Center/Emergency Operations Center (AOC/EOC) and DPS 911 Dispatch Center serves as a single point of contact to centralize communications for DFW’s passengers, guests, tenants, employees, and contractors, with an emphasis on Communication, Collaboration and Coordination (C3). This includes the 9-1-1 call management of police, fire and emergency medical response teams and 3-1-1 non-emergency services. The AOC/EOC/911 facility is the fusion and coordination center that provides Executive Management and aviation stakeholders with the situational awareness needed to efficiently and quickly manage airport resources and partner with aviation stakeholders when responding not only to routine/daily infrastructure deficiencies, but also irregular operations and emergency incidents. The combined facility handles an average of 42,482 calls per month and generates an average of 4,337 work orders per month. Transit System – DFW’s people mover system (Skylink) transports passengers and employees between terminals on the secure side. DFW operates 16 to 24 fully automated cars on Skylink during normal operations. Skylink cars circle the 5 terminals in 2 directions, and trains arrive on an average of every 2 minutes at each terminal. There are 2 Skylink stations in each terminal. The average customer ride is about 5 minutes. DFW uses buses to transport passengers and employees between terminals on the non-secure side, the Grand Hyatt Hotel, parking lots and the Rental Car Center (RAC). DFW uses 29 buses to shuttle passengers between the terminals and Grand Hyatt (Terminal Link); 62 buses between remote and express parking lots and the terminals; 5 buses for various DFW activities and service between the Trinity Railway Express CenterPoint station and the terminals; 32 buses between employee parking lots and the terminals; and 54 buses between the terminals and the RAC. DFW has a Dallas Area Rapid Transit rail station at the north end of Terminal A that connects DFW to downtown Dallas. A new Tex Rail station is being designed at the north end of Terminal B that will connect DFW to downtown Fort Worth. This station is planned to be in operation in FY 2018.

FY 2017 Adopted Budget Introduction
6 DFW International Airport
DFW Controlling Documents In addition to the Contract and Agreement between the Cities, DFW is governed by several other key documents, including the Master Bond Ordinance and the Use Agreements between DFW and the Signatory Airlines. Collectively, these agreements are called the Controlling Documents. The Controlling Documents define how DFW manages its business affairs. DFW does not collect any local tax revenue to fund its operations. The Controlling Documents require that Gross Revenues of the Airport be deposited into the “102 Revenue and Expense Fund” (102 Fund). Gross Revenues are defined as all Airport revenues and receipts except: bond proceeds; Passenger Facility Charge (PFC) proceeds used to fund capital projects (rather than for debt service); interest earned on unspent bonds; proceeds in the Capital Accounts; grant proceeds used to fund capital projects; and sale of land or mineral rights, including natural gas royalties.
Strategic Plan DFW’s executive team is currently revising the organization’s Strategic Plan. The final document is expected to be published in the first quarter of FY 2017. DFW’s previous Strategic Plan focused on “Growing the Core Business,” with an emphasis on “Connecting the World.” DFW has achieved nearly all of the expected outcomes that were established five years ago in that Strategic Plan, including a 50% growth of international passenger air service. Management has finalized the high-level structure of the new Strategic Plan shown on the following page. The new Vision statement is Travel. Transformed. and is consistent with DFW’s new Brand Attributes and Mission Statement. The Strategic Plan includes six Key Results. Customer Experience is at the top of the structure because of its importance to the Vision and Mission. DFW will be focused on providing passengers an excellent customer experience. DFW’s goal is to be recognized as one of the premier airports in the world from a customer experience standpoint. Safe and Secure is the foundation of the new Strategic Plan and requires every person working at the airport to be aware of their responsibility for safety and security. The Business Performance Key Result is focused on improving financial results and growing air passenger and cargo service, domestic and international seats and passengers. Employee Engagement is essential to the Airport’s success. Management realizes it needs to have engaged employees to achieve Operational Excellence. Management added Community Engagement as a new Key Result given the importance of the community to DFW’s overall success. The Plan will include Strategic Objectives and multi-year High Priority Initiatives that will help management link the longer term plan with the annual goal setting process. A copy of DFW’s previous Strategic Plan is available at www.dfwairport.com.

FY 2017 Adopted Budget Introduction
7 DFW International Airport
FY 2017 Adopted Budget Introduction
8 DFW International Airport
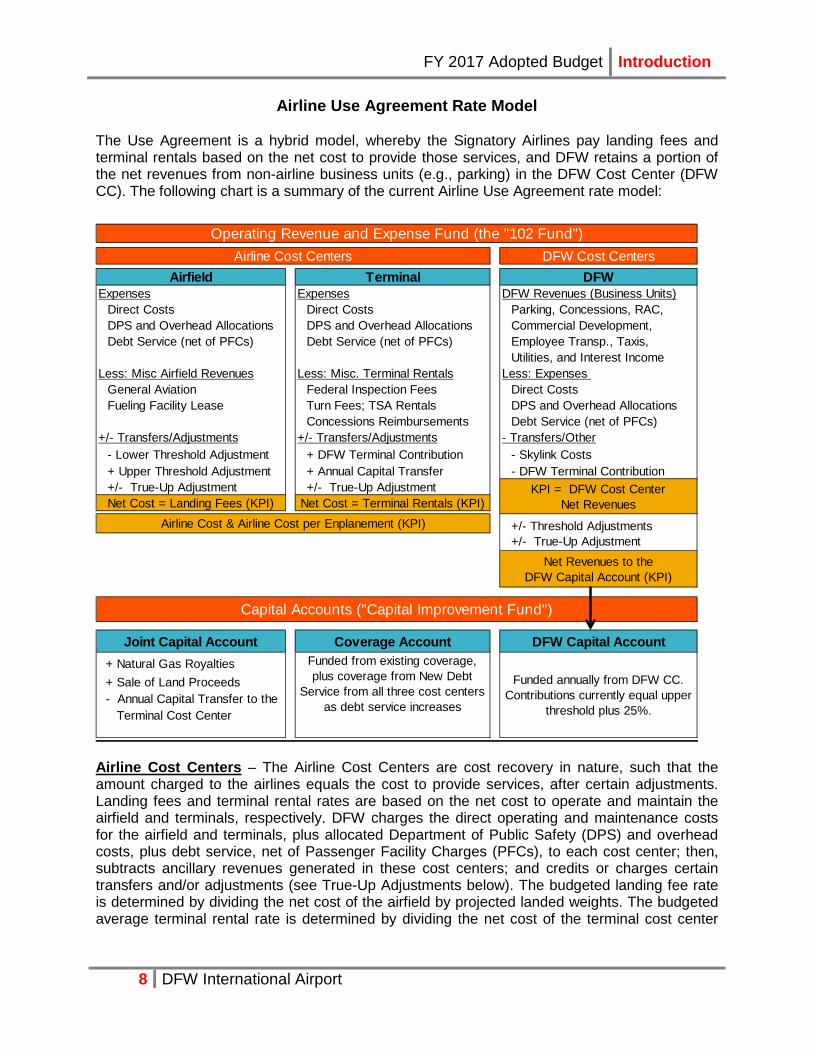
Airline Use Agreement Rate Model The Use Agreement is a hybrid model, whereby the Signatory Airlines pay landing fees and terminal rentals based on the net cost to provide those services, and DFW retains a portion of the net revenues from non-airline business units (e.g., parking) in the DFW Cost Center (DFW CC). The following chart is a summary of the current Airline Use Agreement rate model: 7
DFW Cost CentersAirfield Terminal DFW
Expenses Expenses DFW Revenues (Business Units)Direct Costs Direct Costs Parking, Concessions, RAC,DPS and Overhead Allocations DPS and Overhead Allocations Commercial Development,Debt Service (net of PFCs) Debt Service (net of PFCs) Employee Transp., Taxis,
Utilities, and Interest IncomeLess: Misc Airfield Revenues Less: Misc. Terminal Rentals Less: Expenses
General Aviation Federal Inspection Fees Direct CostsFueling Facility Lease Turn Fees; TSA Rentals DPS and Overhead Allocations
Concessions Reimbursements Debt Service (net of PFCs)+/- Transfers/Adjustments +/- Transfers/Adjustments - Transfers/Other
- Lower Threshold Adjustment + DFW Terminal Contribution - Skylink Costs+ Upper Threshold Adjustment + Annual Capital Transfer - DFW Terminal Contribution+/- True-Up Adjustment +/- True-Up AdjustmentNet Cost = Landing Fees (KPI) Net Cost = Terminal Rentals (KPI)
+/- Threshold Adjustments+/- True-Up Adjustment
Joint Capital Account Coverage Account DFW Capital Account + Natural Gas Royalties + Sale of Land Proceeds - Annual Capital Transfer to the Terminal Cost Center
Capital Accounts ("Capital Improvement Fund")
Funded from existing coverage, plus coverage from New Debt
Service from all three cost centers as debt service increases
Funded annually from DFW CC. Contributions currently equal upper
threshold plus 25%.
Operating Revenue and Expense Fund (the "102 Fund")Airline Cost Centers
KPI = DFW Cost Center Net Revenues
Airline Cost & Airline Cost per Enplanement (KPI)
Net Revenues to the DFW Capital Account (KPI)
Airline Cost Centers – The Airline Cost Centers are cost recovery in nature, such that the amount charged to the airlines equals the cost to provide services, after certain adjustments. Landing fees and terminal rental rates are based on the net cost to operate and maintain the airfield and terminals, respectively. DFW charges the direct operating and maintenance costs for the airfield and terminals, plus allocated Department of Public Safety (DPS) and overhead costs, plus debt service, net of Passenger Facility Charges (PFCs), to each cost center; then, subtracts ancillary revenues generated in these cost centers; and credits or charges certain transfers and/or adjustments (see True-Up Adjustments below). The budgeted landing fee rate is determined by dividing the net cost of the airfield by projected landed weights. The budgeted average terminal rental rate is determined by dividing the net cost of the terminal cost center
FY 2017 Adopted Budget Introduction
9 DFW International Airport
divided by leasable square footage. The Use Agreement requires the Airport to charge an equalized terminal rental rate for all 5 terminals. The amount paid by the airlines for landing fees and terminal rent fees less airline incentive payments equals airline cost, which is an airport industry Key Performance Indicator (KPI). Another common industry KPI is passenger airline cost per enplaned passenger or CPE. This KPI for passenger airlines is calculated by dividing the amount paid by passenger airlines for landing fees and terminal rent fees less airline new service incentive payments (i.e., collectively, airline cost) by the number of enplanements. DFW Cost Center – All non-airline business units, plus interest income, are included in the DFW Cost Center. The DFW Cost Center is also responsible for all costs associated with the Skylink people mover system. The net revenues from this cost center are transferred to the DFW Capital Account, and the net revenues cannot be lower than the Lower Threshold. Contributions currently equal the upper threshold plus 25%. One of DFW’s most important KPIs is Net Revenues from the DFW Cost Center. This KPI measures the net revenues generated by DFW’s non-airline business units, after adjusting for the cost of Skylink, and drives the amount of cash flow that can be transferred to the DFW Capital Account each year. Joint Capital Account – Funds in the Joint Capital Account (JCA) require DFW and airline approval before money can be spent. The JCA is funded from the proceeds from natural gas royalties and the sale of land, plus interest income on the account. Supplemental funding for projects paid from the JCA comes from grants and the issuance of debt. Per the terms of the Use Agreement, an Annual Capital Transfer (described below) is made from the JCA to the Terminal Cost Center to lower airline cost through FY 2017. Coverage Account – The Airport established the Coverage Account as part of the new Use Agreement in order to implement rolling coverage. Each year, the Coverage Account is rolled into the 102 Fund as a source of revenue, and then transferred back into the Coverage Account as excess revenue at the end of the year. The Coverage Account must equal 25% of aggregate debt service each year. If new debt is issued, each cost center must generate the incremental coverage required to fund 25% of the new debt service. These incremental coverage amounts are collected in the 102 Fund through rates and charges during the fiscal year. DFW Capital Account – This is DFW’s discretionary account and is funded primarily from the Net Revenues of the DFW Cost Center, plus interest income. Supplemental funding for projects paid from the DFW Capital Account comes from grants and the issuance of debt. Funds in this account may be used for any legal purpose without airline approval. Threshold Adjustments – The Use Agreement established a Lower Threshold and an Upper Threshold for Net Revenues from the DFW Cost Center to limit the amount transferred annually to the DFW Capital Account. If DFW Cost Center Net Revenues are budgeted to be less than the Lower Threshold ($43.4 million in FY 2017), an incremental charge (i.e., a Lower Threshold Adjustment) is collected through landing fees in an amount sufficient to achieve the Lower Threshold amount. Conversely, if DFW Cost Center Net Revenues are budgeted to be greater than the Upper Threshold ($64.9 million in FY 2017), then 75% of the excess is credited to the Airfield Cost Center as an Upper Threshold Adjustment. This reduces budgeted landing fees. The remaining 25% may be retained in the DFW Cost Center and transferred to the DFW Capital Account at the end of the fiscal year. The benefit of the Lower Threshold Adjustment is that it guarantees that DFW will have a minimum level of cash to transfer to the DFW Capital Account so that DFW can replace assets on a timely basis. Conversely, the Upper Threshold

FY 2017 Adopted Budget Introduction
10 DFW International Airport
limits the Airport’s ability to generate significantly more net revenues and serves to reduce airlines’ costs as non-airline revenues increase. It also places a limit on DFW’s ability to significantly increase its coverage ratios. The Threshold Amounts are adjusted annually for inflation. True-Up Adjustments – At the end of each fiscal year, DFW performs a reconciliation or true-up, such that revenues collected equal the actual net cost to operate and maintain the airfield and the terminals. Any difference becomes a True-Up Adjustment and is either charged or credited to that cost center in the next fiscal year. The True-Up Adjustments for the Airline Cost Centers are applied back to that cost center the following year beginning in January. DFW Cost Center True-Up Adjustments are applied against landing fees beginning in the following January. Annual Capital Transfer – Per the terms of the Use Agreement, an annual transfer is made from the Joint Capital Account to the Terminal Cost Center to reduce the cost of the terminals to the airlines for a period of 7 years. This transfer was $28 million in FY 2011 (first year of the new Use Agreement) and will be $4 million in FY 2017. The transfer will be eliminated in FY 2018. DFW Terminal Contribution – Per the terms of the Use Agreement, an annual transfer is made from the DFW Cost Center to the Terminal Cost Center to pay for DFW’s share of common use and leasable, but unleased space, in Terminals D and E. This amount is $3.8 million in FY 2017.W Cost Centers
DFW’s Fund Structure
Although DFW uses the word “fund” to describe the designation of the source and prospective use of proceeds, DFW is an Enterprise Fund and does not utilize traditional fund accounting commonly used by government organizations. The table below summarizes the primary funds used by DFW:
Number Fund Description Primary Use
101 Fixed Assets and Long Term Debt Capital Assets/Bonds102 Operating Revenues and Expenses Operations252 Passenger Facility Charges (PFC) Collections/Debt Service
320s/330s Joint Capital Account and Bond Funds Capital/Bond Proceeds340s DFW Capital Accounts and Bond Funds Capital/Bond Proceeds
500-600s Debt Service and Sinking Funds Principal and Interest907/910/914 Public Facility Improvement Corporation (PFIC) Rental Car Facility/Grand Hyatt and Hyatt Place Hotels
DFW’s financial statements are issued in conformance with Generally Accepted Accounting Principles (GAAP) and include all of DFW’s funds, whereas the Annual Budget focuses on revenues and expenses included in the 102 Fund. DFW manages its day-to-day operations primarily through the 102 Fund in accordance with the Controlling Documents.
Passenger Facility Improvement Corporation (PFIC) DFW has a PFIC which owns and operates the Grand Hyatt Hotel in Terminal D and the Hyatt Place Hotel in Southgate Plaza, as well as, the Rental Car Facility and rental car bus transportation services. Revenues, expenses, and capital projects of the PFIC are not included
FY 2017 Adopted Budget Introduction
11 DFW International Airport
in this budget. These businesses are specifically excluded from the airline rate base per the Use Agreement. DFW has issued bonds to finance the construction of the Grand Hyatt Hotel and Rental Car Facility. Each business transfers funds in an amount equal to the debt service so that there is no impact on the airline rate base.
Basis of Budgeting The 102 Fund Budget is commonly called the Operating Budget, but contains elements that are not expenses under GAAP such as debt service, reserve requirements, and certain expenditures that may be capitalized under GAAP. Capital expenditures are funded through Joint Revenue Bonds, grants, PFCs, or cash in the DFW or Joint Capital Accounts. From a process standpoint, the Board of Directors approves the Operating Revenue and Expense budget. The Board reviews the capital budget as part of the Annual Budget process and the Financial Plan process. The Board approves contracts associated with capital projects.
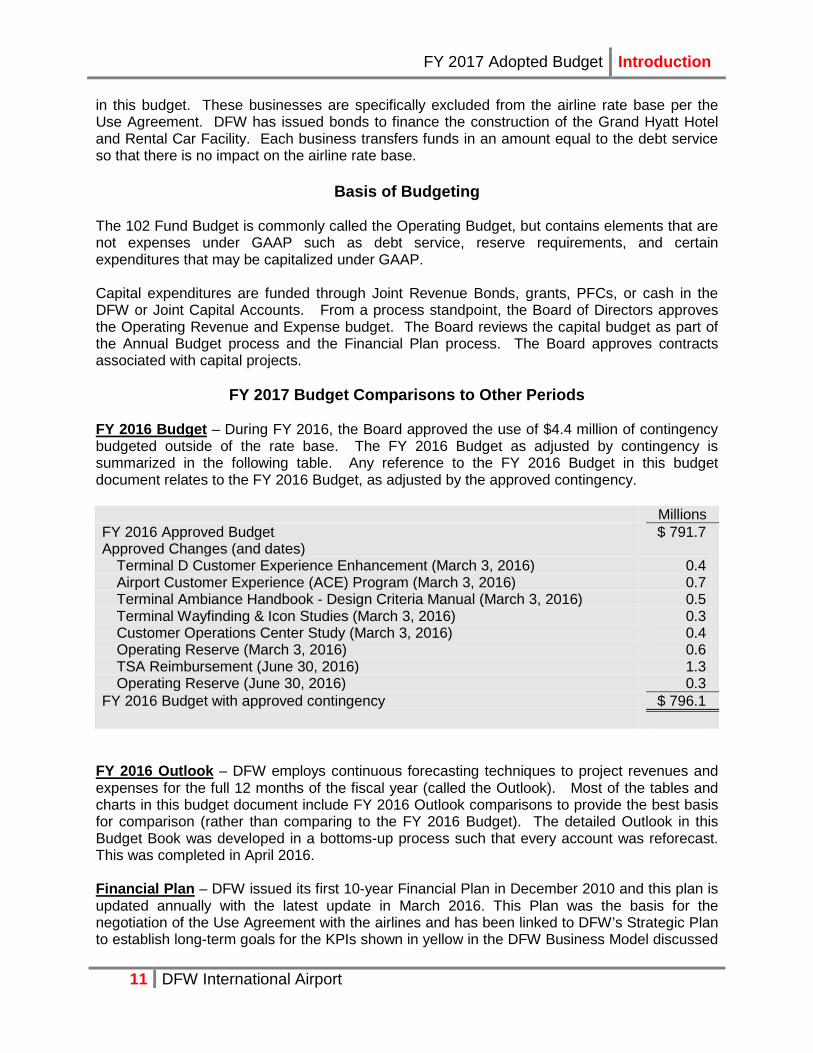
FY 2017 Budget Comparisons to Other Periods FY 2016 Budget – During FY 2016, the Board approved the use of $4.4 million of contingency budgeted outside of the rate base. The FY 2016 Budget as adjusted by contingency is summarized in the following table. Any reference to the FY 2016 Budget in this budget document relates to the FY 2016 Budget, as adjusted by the approved contingency. Millions FY 2016 Approved Budget $ 791.7 Approved Changes (and dates)
Terminal D Customer Experience Enhancement (March 3, 2016) 0.4 Airport Customer Experience (ACE) Program (March 3, 2016) 0.7 Terminal Ambiance Handbook - Design Criteria Manual (March 3, 2016) 0.5 Terminal Wayfinding & Icon Studies (March 3, 2016) 0.3 Customer Operations Center Study (March 3, 2016) 0.4 Operating Reserve (March 3, 2016) 0.6 TSA Reimbursement (June 30, 2016) 1.3 Operating Reserve (June 30, 2016) 0.3
FY 2016 Budget with approved contingency $ 796.1
FY 2016 Outlook – DFW employs continuous forecasting techniques to project revenues and expenses for the full 12 months of the fiscal year (called the Outlook). Most of the tables and charts in this budget document include FY 2016 Outlook comparisons to provide the best basis for comparison (rather than comparing to the FY 2016 Budget). The detailed Outlook in this Budget Book was developed in a bottoms-up process such that every account was reforecast. This was completed in April 2016. Financial Plan – DFW issued its first 10-year Financial Plan in December 2010 and this plan is updated annually with the latest update in March 2016. This Plan was the basis for the negotiation of the Use Agreement with the airlines and has been linked to DFW’s Strategic Plan to establish long-term goals for the KPIs shown in yellow in the DFW Business Model discussed
FY 2017 Adopted Budget Introduction
12 DFW International Airport
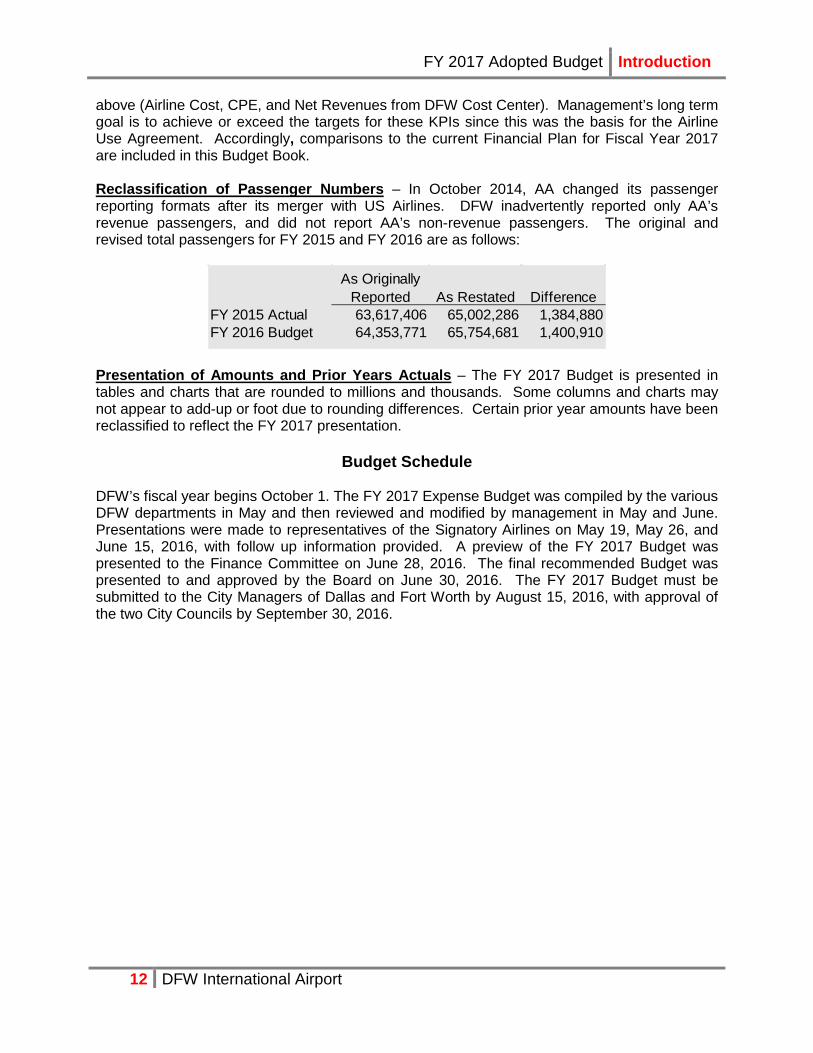
above (Airline Cost, CPE, and Net Revenues from DFW Cost Center). Management’s long term goal is to achieve or exceed the targets for these KPIs since this was the basis for the Airline Use Agreement. Accordingly, comparisons to the current Financial Plan for Fiscal Year 2017 are included in this Budget Book. Reclassification of Passenger Numbers – In October 2014, AA changed its passenger reporting formats after its merger with US Airlines. DFW inadvertently reported only AA’s revenue passengers, and did not report AA’s non-revenue passengers. The original and revised total passengers for FY 2015 and FY 2016 are as follows:
As Originally Reported As Restated Difference
FY 2015 Actual 63,617,406 65,002,286 1,384,880FY 2016 Budget 64,353,771 65,754,681 1,400,910
Presentation of Amounts and Prior Years Actuals – The FY 2017 Budget is presented in tables and charts that are rounded to millions and thousands. Some columns and charts may not appear to add-up or foot due to rounding differences. Certain prior year amounts have been reclassified to reflect the FY 2017 presentation.
Budget Schedule DFW’s fiscal year begins October 1. The FY 2017 Expense Budget was compiled by the various DFW departments in May and then reviewed and modified by management in May and June. Presentations were made to representatives of the Signatory Airlines on May 19, May 26, and June 15, 2016, with follow up information provided. A preview of the FY 2017 Budget was presented to the Finance Committee on June 28, 2016. The final recommended Budget was presented to and approved by the Board on June 30, 2016. The FY 2017 Budget must be submitted to the City Managers of Dallas and Fort Worth by August 15, 2016, with approval of the two City Councils by September 30, 2016.

FY 2017 Adopted Budget Executive Summary
13 DFW International Airport
FY 2017 Key Performance Indicators
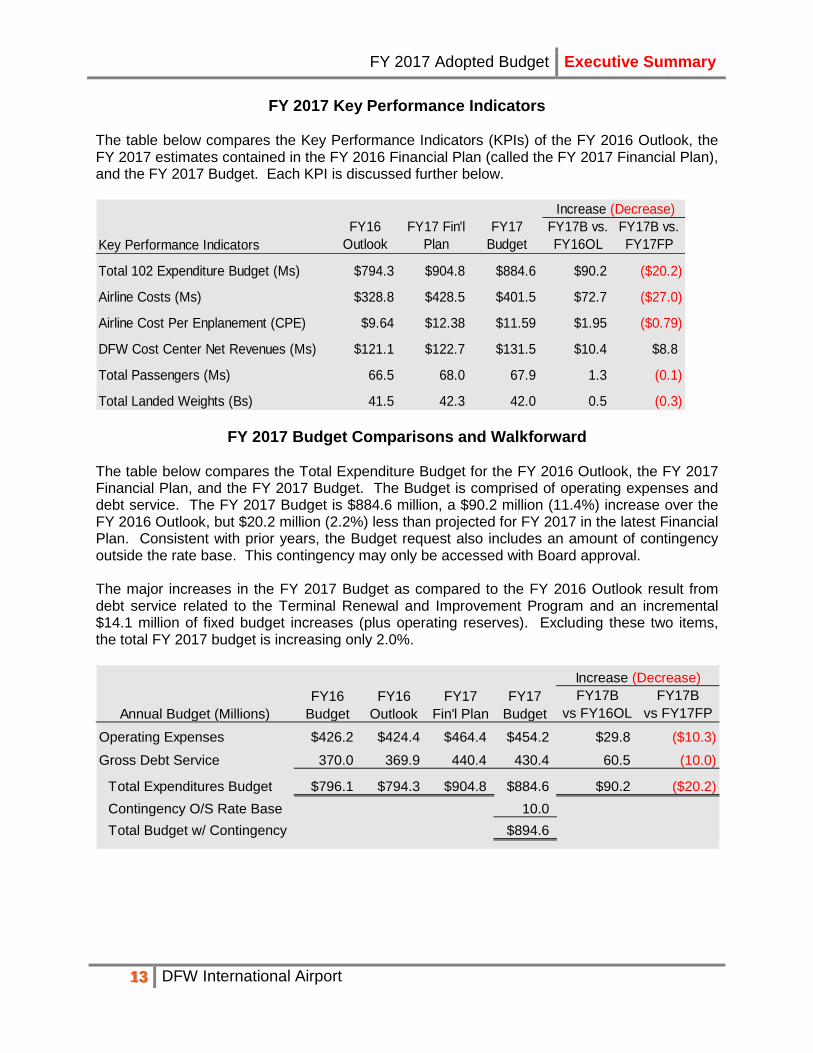
The table below compares the Key Performance Indicators (KPIs) of the FY 2016 Outlook, the FY 2017 estimates contained in the FY 2016 Financial Plan (called the FY 2017 Financial Plan), and the FY 2017 Budget. Each KPI is discussed further below.
Key Performance IndicatorsFY16
OutlookFY17 Fin'l
PlanFY17
BudgetFY17B vs. FY16OL
FY17B vs. FY17FP
Total 102 Expenditure Budget (Ms) $794.3 $904.8 $884.6 $90.2 ($20.2)
Airline Costs (Ms) $328.8 $428.5 $401.5 $72.7 ($27.0)
Airline Cost Per Enplanement (CPE) $9.64 $12.38 $11.59 $1.95 ($0.79)
DFW Cost Center Net Revenues (Ms) $121.1 $122.7 $131.5 $10.4 $8.8
Total Passengers (Ms) 66.5 68.0 67.9 1.3 (0.1)
Total Landed Weights (Bs) 41.5 42.3 42.0 0.5 (0.3)
Increase (Decrease)
FY 2017 Budget Comparisons and Walkforward
The table below compares the Total Expenditure Budget for the FY 2016 Outlook, the FY 2017 Financial Plan, and the FY 2017 Budget. The Budget is comprised of operating expenses and debt service. The FY 2017 Budget is $884.6 million, a $90.2 million (11.4%) increase over the FY 2016 Outlook, but $20.2 million (2.2%) less than projected for FY 2017 in the latest Financial Plan. Consistent with prior years, the Budget request also includes an amount of contingency outside the rate base. This contingency may only be accessed with Board approval. The major increases in the FY 2017 Budget as compared to the FY 2016 Outlook result from debt service related to the Terminal Renewal and Improvement Program and an incremental $14.1 million of fixed budget increases (plus operating reserves). Excluding these two items, the total FY 2017 budget is increasing only 2.0%.
Annual Budget (Millions)FY16
BudgetFY16
OutlookFY17
Fin'l PlanFY17
BudgetFY17B
vs FY16OLFY17B
vs FY17FP
Operating Expenses $426.2 $424.4 $464.4 $454.2 $29.8 ($10.3)
Gross Debt Service 370.0 369.9 440.4 430.4 60.5 (10.0)
Total Expenditures Budget $796.1 $794.3 $904.8 $884.6 $90.2 ($20.2)Contingency O/S Rate Base 10.0Total Budget w/ Contingency $894.6
Increase (Decrease)
FY 2017 Adopted Budget Executive Summary
14 DFW International Airport
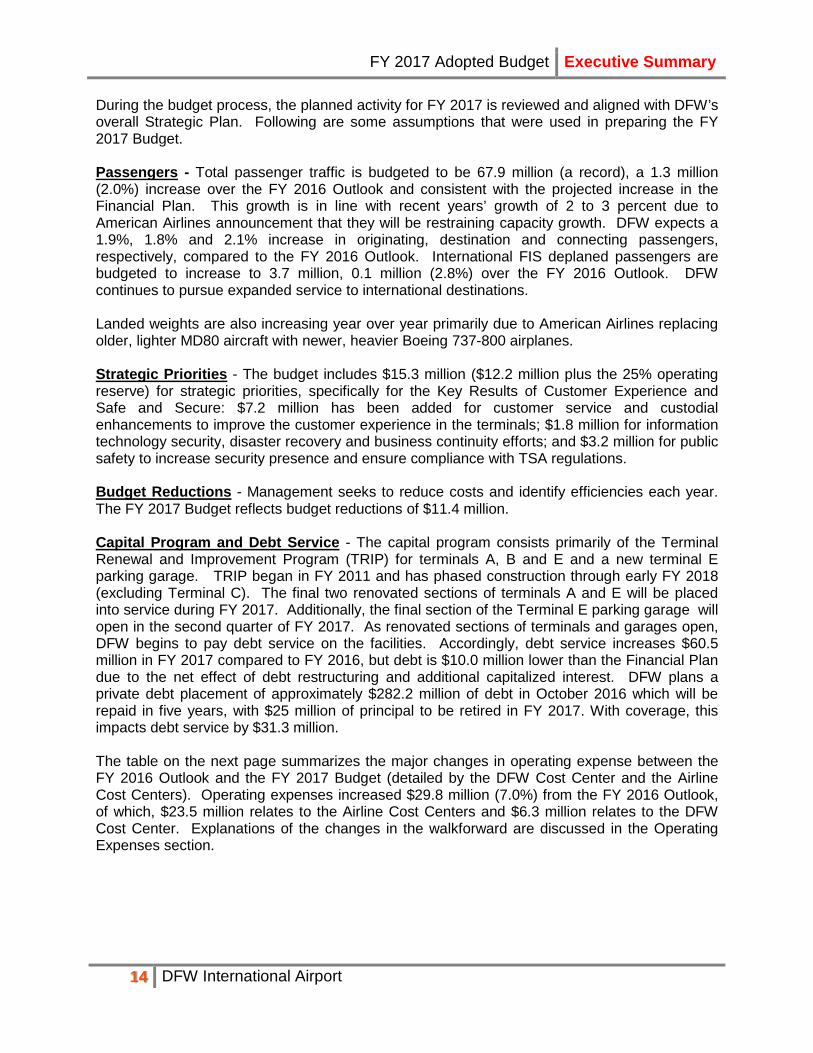
During the budget process, the planned activity for FY 2017 is reviewed and aligned with DFW’s overall Strategic Plan. Following are some assumptions that were used in preparing the FY 2017 Budget. Passengers - Total passenger traffic is budgeted to be 67.9 million (a record), a 1.3 million (2.0%) increase over the FY 2016 Outlook and consistent with the projected increase in the Financial Plan. This growth is in line with recent years’ growth of 2 to 3 percent due to American Airlines announcement that they will be restraining capacity growth. DFW expects a 1.9%, 1.8% and 2.1% increase in originating, destination and connecting passengers, respectively, compared to the FY 2016 Outlook. International FIS deplaned passengers are budgeted to increase to 3.7 million, 0.1 million (2.8%) over the FY 2016 Outlook. DFW continues to pursue expanded service to international destinations. Landed weights are also increasing year over year primarily due to American Airlines replacing older, lighter MD80 aircraft with newer, heavier Boeing 737-800 airplanes. Strategic Priorities - The budget includes $15.3 million ($12.2 million plus the 25% operating reserve) for strategic priorities, specifically for the Key Results of Customer Experience and Safe and Secure: $7.2 million has been added for customer service and custodial enhancements to improve the customer experience in the terminals; $1.8 million for information technology security, disaster recovery and business continuity efforts; and $3.2 million for public safety to increase security presence and ensure compliance with TSA regulations. Budget Reductions - Management seeks to reduce costs and identify efficiencies each year. The FY 2017 Budget reflects budget reductions of $11.4 million. Capital Program and Debt Service - The capital program consists primarily of the Terminal Renewal and Improvement Program (TRIP) for terminals A, B and E and a new terminal E parking garage. TRIP began in FY 2011 and has phased construction through early FY 2018 (excluding Terminal C). The final two renovated sections of terminals A and E will be placed into service during FY 2017. Additionally, the final section of the Terminal E parking garage will open in the second quarter of FY 2017. As renovated sections of terminals and garages open, DFW begins to pay debt service on the facilities. Accordingly, debt service increases $60.5 million in FY 2017 compared to FY 2016, but debt is $10.0 million lower than the Financial Plan due to the net effect of debt restructuring and additional capitalized interest. DFW plans a private debt placement of approximately $282.2 million of debt in October 2016 which will be repaid in five years, with $25 million of principal to be retired in FY 2017. With coverage, this impacts debt service by $31.3 million. The table on the next page summarizes the major changes in operating expense between the FY 2016 Outlook and the FY 2017 Budget (detailed by the DFW Cost Center and the Airline Cost Centers). Operating expenses increased $29.8 million (7.0%) from the FY 2016 Outlook, of which, $23.5 million relates to the Airline Cost Centers and $6.3 million relates to the DFW Cost Center. Explanations of the changes in the walkforward are discussed in the Operating Expenses section.
FY 2017 Adopted Budget Executive Summary
15 DFW International Airport
Operating Expenses (in Millions) Total DFW AirlineFY 2016 Outlook $424.4 $163.5 $260.9
Budget reductions (11.4) (4.1) (7.3)Strategic priorities 12.2 1.4 10.8Merit, annualization, and new positions 5.2 2.2 3.0Fixed contract increases 11.3 6.5 4.8Restore budget to prior year's levels 5.8 1.3 4.5Funding policy changes 1.4 0.5 0.9Other increases 5.2 (1.5) 6.7
Net increase 29.8 6.3 23.5FY 2017 Budget $454.2 $169.8 $284.3
Revenue and Expense Budget Exposures
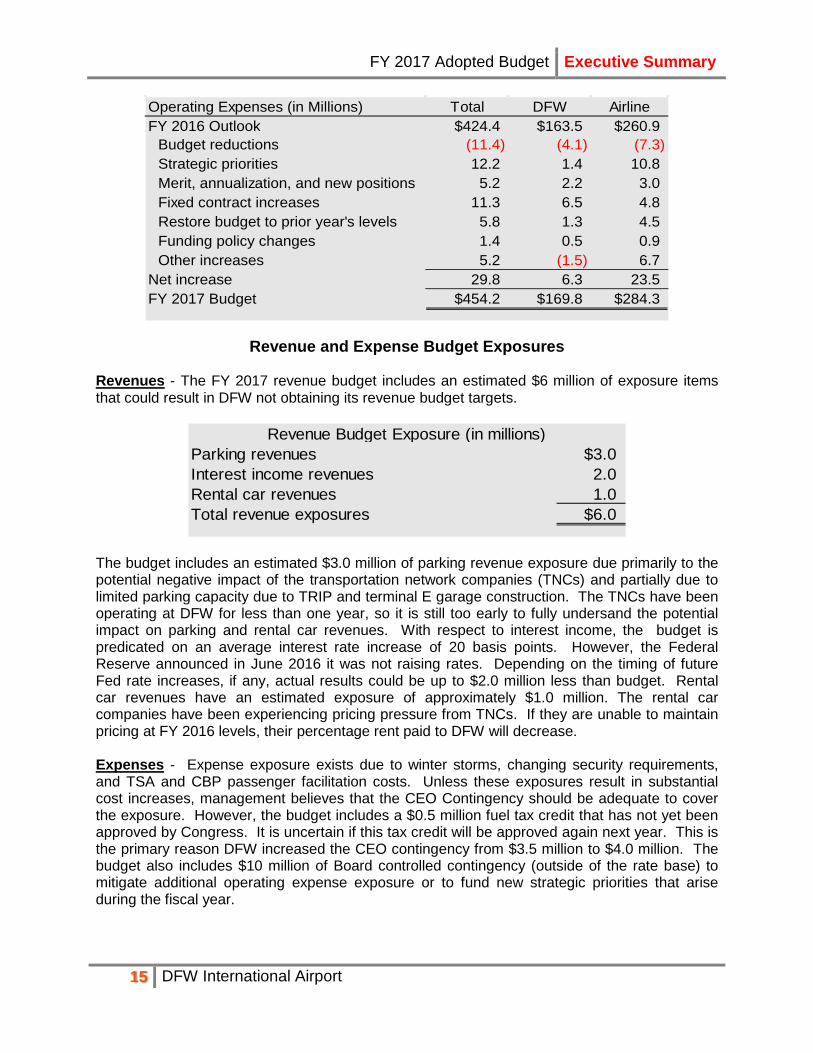
Revenues - The FY 2017 revenue budget includes an estimated $6 million of exposure items that could result in DFW not obtaining its revenue budget targets.
Parking revenues $3.0Interest income revenues 2.0Rental car revenues 1.0Total revenue exposures $6.0
Revenue Budget Exposure (in millions)
The budget includes an estimated $3.0 million of parking revenue exposure due primarily to the potential negative impact of the transportation network companies (TNCs) and partially due to limited parking capacity due to TRIP and terminal E garage construction. The TNCs have been operating at DFW for less than one year, so it is still too early to fully undersand the potential impact on parking and rental car revenues. With respect to interest income, the budget is predicated on an average interest rate increase of 20 basis points. However, the Federal Reserve announced in June 2016 it was not raising rates. Depending on the timing of future Fed rate increases, if any, actual results could be up to $2.0 million less than budget. Rental car revenues have an estimated exposure of approximately $1.0 million. The rental car companies have been experiencing pricing pressure from TNCs. If they are unable to maintain pricing at FY 2016 levels, their percentage rent paid to DFW will decrease. Expenses - Expense exposure exists due to winter storms, changing security requirements, and TSA and CBP passenger facilitation costs. Unless these exposures result in substantial cost increases, management believes that the CEO Contingency should be adequate to cover the exposure. However, the budget includes a $0.5 million fuel tax credit that has not yet been approved by Congress. It is uncertain if this tax credit will be approved again next year. This is the primary reason DFW increased the CEO contingency from $3.5 million to $4.0 million. The budget also includes $10 million of Board controlled contingency (outside of the rate base) to mitigate additional operating expense exposure or to fund new strategic priorities that arise during the fiscal year.
FY 2017 Adopted Budget Executive Summary
16 DFW International Airport
Airline Cost
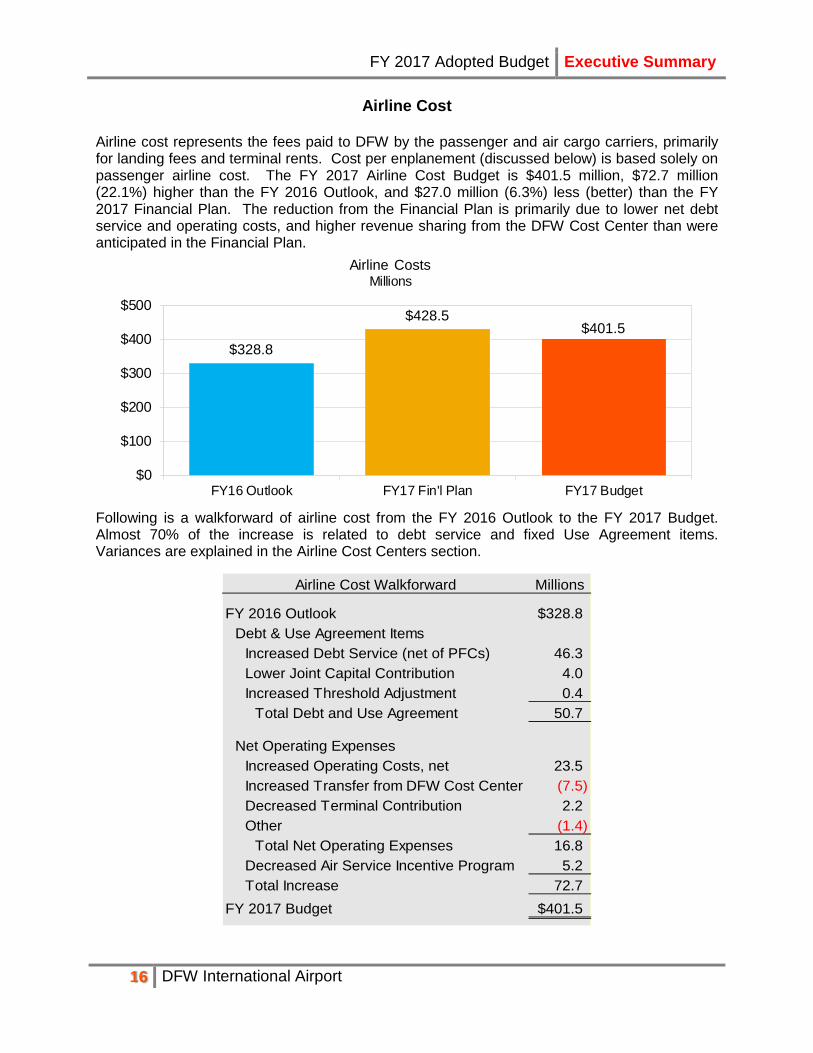
Airline cost represents the fees paid to DFW by the passenger and air cargo carriers, primarily for landing fees and terminal rents. Cost per enplanement (discussed below) is based solely on passenger airline cost. The FY 2017 Airline Cost Budget is $401.5 million, $72.7 million (22.1%) higher than the FY 2016 Outlook, and $27.0 million (6.3%) less (better) than the FY 2017 Financial Plan. The reduction from the Financial Plan is primarily due to lower net debt service and operating costs, and higher revenue sharing from the DFW Cost Center than were anticipated in the Financial Plan.
$328.8
$428.5$401.5
$0
$100
$200
$300
$400
$500
FY16 Outlook FY17 Fin'l Plan FY17 Budget
Airline CostsMillions
Following is a walkforward of airline cost from the FY 2016 Outlook to the FY 2017 Budget. Almost 70% of the increase is related to debt service and fixed Use Agreement items. Variances are explained in the Airline Cost Centers section.
Airline Cost Walkforward Millions
FY 2016 Outlook $328.8Debt & Use Agreement Items
Increased Debt Service (net of PFCs) 46.3Lower Joint Capital Contribution 4.0Increased Threshold Adjustment 0.4
Total Debt and Use Agreement 50.7
Net Operating ExpensesIncreased Operating Costs, net 23.5Increased Transfer from DFW Cost Center (7.5)Decreased Terminal Contribution 2.2Other (1.4)
Total Net Operating Expenses 16.8Decreased Air Service Incentive Program 5.2Total Increase 72.7
FY 2017 Budget $401.5

FY 2017 Adopted Budget Executive Summary
17 DFW International Airport
Passenger Airline Cost per Enplanement (CPE) CPE – CPE is defined as total passenger airline cost (i.e., revenue paid to DFW) divided by the number of enplaned passengers. CPE is a standard metric used by the airline industry. The denominator, enplaned passengers, is used because it is a key revenue/cost driver for the airlines. However, this is not the case for an airport. Airport costs are based on the cost to operate and maintain its facilities and runways. Notwithstanding this issue, DFW (and the industry) use this indicator as a cost performance metric.
$9.64
$12.38$11.59
$0
$3
$6
$9
$12
$15
FY16 Outlook FY17 Fin'l Plan FY17 Budget
Airline Cost per Enplanement
The FY 2017 CPE of $11.59 represents an increase of $1.95 (20.2%) from the FY 2016 Outlook. From the walkforward above, the increase is driven primarily by debt service and fixed Use Agreement adjustments. The FY 2017 CPE of $11.59 is $0.79 (6.4%) less (better) than the 2017 Financial Plan primarily due to lower net debt service, lower operating costs, increased sharing of DFW Cost Center Net Revenues ($49.9 million in FY 2017), and more enplanements.
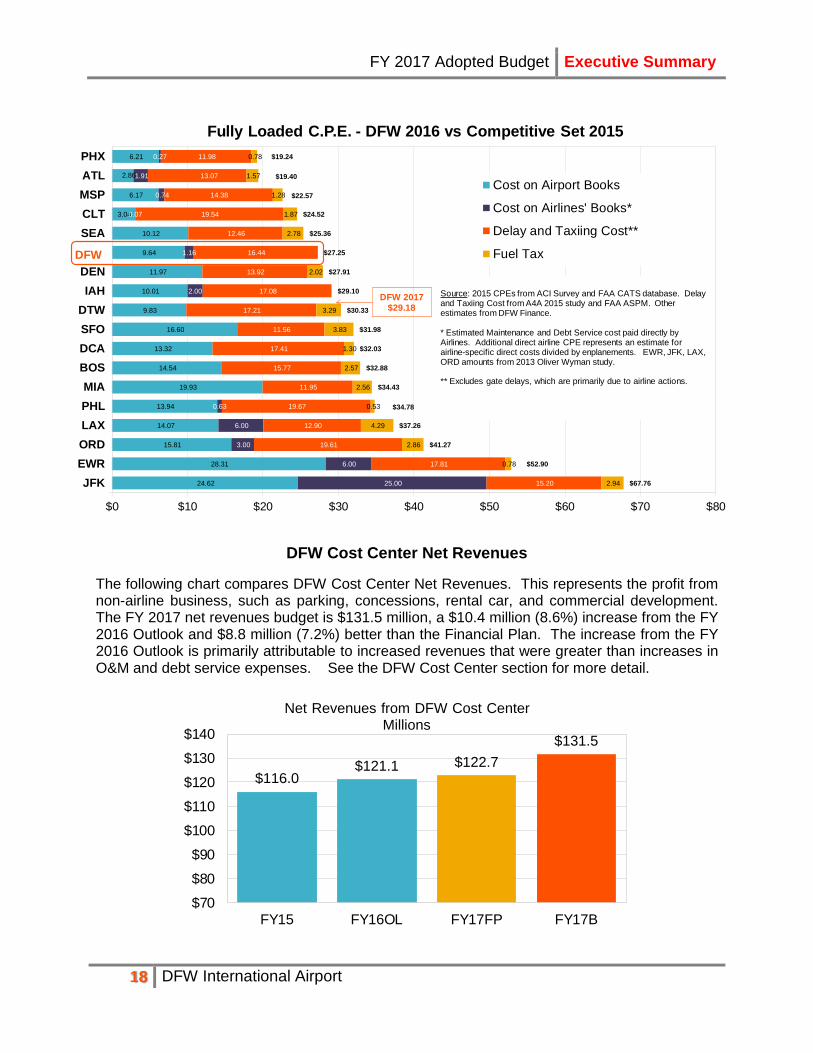
CPE Benchmarked to Other Airports – DFW’s goal is to have a competitive CPE. The following chart benchmarks DFW’s fully loaded CPE of the FY 2016 Outlook with the fully loaded CPE projections for DFW’s competitive set of 17 large U.S. hub airports using the latest data available from ACI surveys from FY 2015. Fully loaded cost is the most meaningful comparison because it includes most of the costs incurred by airlines to operate at an airport, including what they pay the airport (blue), what they pay directly for terminal maintenance and terminal debt service (purple), an estimate of what costs the airlines incur for delay and taxiing (orange), and an estimate for fuel taxes (yellow).
DFW’s cost structure is projected to continue to increase through the completion of TRIP due to higher debt services costs. The chart highlights that DFW is well-positioned from a cost standpoint compared to AA’s other major hubs and remains cost competitive.
FY 2017 Adopted Budget Executive Summary
18 DFW International Airport
DFW Cost Center Net Revenues
The following chart compares DFW Cost Center Net Revenues. This represents the profit from non-airline business, such as parking, concessions, rental car, and commercial development. The FY 2017 net revenues budget is $131.5 million, a $10.4 million (8.6%) increase from the FY 2016 Outlook and $8.8 million (7.2%) better than the Financial Plan. The increase from the FY 2016 Outlook is primarily attributable to increased revenues that were greater than increases in O&M and debt service expenses. See the DFW Cost Center section for more detail.
$116.0$121.1 $122.7
$131.5
$70
$80
$90
$100
$110
$120
$130
$140
FY15 FY16OL FY17FP FY17B
Net Revenues from DFW Cost Center Millions
24.62
28.31
15.81
14.07
13.94
19.93
14.54
13.32
16.60
9.83
10.01
11.97
9.64
10.12
3.04
6.17
2.86
6.21
25.00
6.00
3.00
6.00
0.63
2.00
1.16
0.07
0.74
1.91
0.27
15.20
17.81
19.61
12.90
19.67
11.95
15.77
17.41
11.56
17.21
17.08
13.92
16.44
12.46
19.54
14.38
13.07
11.98
2.94
0.78
2.86
4.29
0.53
2.56
2.57
1.30
3.83
3.29
2.02
2.78
1.87
1.28
1.57
0.78
$67.76
$52.90
$41.27
$37.26
$34.78
$34.43
$32.88
$32.03
$31.98
$30.33
$29.10
$27.91
$27.25
$25.36
$24.52
$22.57
$19.40
$19.24
$0 $10 $20 $30 $40 $50 $60 $70 $80
JFKEWRORDLAXPHLMIA
BOSDCASFODTWIAH
DENDFWSEACLTMSPATLPHX
Fully Loaded C.P.E. - DFW 2016 vs Competitive Set 2015
Cost on Airport Books
Cost on Airlines' Books*
Delay and Taxiing Cost**
Fuel Tax
Source: 2015 CPEs from ACI Survey and FAA CATS database. Delay and Taxiing Cost from A4A 2015 study and FAA ASPM. Other estimates from DFW Finance.
* Estimated Maintenance and Debt Service cost paid directly by Airlines. Additional direct airline CPE represents an estimate for airline-specific direct costs divided by enplanements. EWR, JFK, LAX, ORD amounts from 2013 Oliver Wyman study.
** Excludes gate delays, which are primarily due to airline actions.
DFW
DFW 2017$29.18

FY 2017 Adopted Budget Executive Summary
19 DFW International Airport
The following chart shows that DFW is budgeting to share $49.9 million from profits made in the DFW Cost Center with the airlines to reduce landing fees. The Use Agreement requires DFW to share 75% of revenues over the “upper threshold” of $64.9 million (in FY 2017) with the airlines. See more detail on the Use Agreement in the Introduction.
$81.6
$49.9
Net Revenues for DFW Cost CenterMillions
DFW Capital Account Shared with Airlines
Passengers
The FY 2017 Budget for passengers is 67.9 million, a 1.3 million (2.03%) increase over the FY 2016 Outlook primarily due to connecting traffic. This will be a record number of passengers for DFW. Passenger statistics can be divided into several categories as shown in the table. Originating passengers begin their trip at DFW. Destination passengers live elsewhere and fly to DFW for work or pleasure. People who travel through DFW to get to their final destination are connecting passengers. Enplanements represent all passengers boarding a plane at DFW.
FY16 FY17 FY17 FY17B vs FY17B vs.Passengers (Millions) Outlook Fin'l Plan Budget FY16OL FY17FPOriginating 15.3 15.6 15.6 0.3 (0.0)Destination 12.4 12.7 12.7 0.2 0.0Connecting 38.8 39.7 39.7 0.8 (0.1)
Total Passengers 66.5 68.0 67.9 1.3 (0.1)
Enplanements 33.3 34.0 33.9 0.6 (0.1)
Increase (Decrease)
Changes in these passenger metrics are important because they are the key revenue drivers for parking (originating passengers), concessions (enplanements), and rental car (destination passengers) revenues. See further discussion in the DFW Cost Center section.

FY 2017 Adopted Budget Executive Summary
20 DFW International Airport
Revenues Overview
The table below summarizes revenues by cost center and compares the FY 2016 Outlook, the FY 2017 Financial Plan, and the FY 2017 Budget.
MillionsFY16
OutlookFY17 Fin'l
PlanFY17
BudgetFY17B vs. FY16OL
FY17B vs. FY17FP
RevenuesAirfield Cost Center $147.1 $162.1 $161.5 $14.4 ($0.6)Terminal Cost Center 261.6 338.9 323.2 61.6 (15.6)DFW Cost Center 342.6 362.4 366.6 24.0 4.2PFCs/CFCs/Other 156.1 161.1 160.8 4.7 (0.3)
Total Revenues $907.4 $1,024.5 $1,012.1 $104.7 ($12.4)p
Increase (Decrease)
FY 2017 airfield and terminal cost center revenues are higher than the FY 2016 Outlook primarily due to increased landing fees and terminal rentals necessary to recover higher debt service and operating expenses attributable to these cost centers. However, the revenues are lower than the Financial Plan due to lower debt service and operating costs and higher DFW Cost Center Net Revenue sharing than assumed in the Plan.
FY 2017 DFW Cost Center revenues are higher than the FY 2016 Outlook primarily due to higher parking, concessions, and TNC revenues and interest income. Parking revenues increased $12.6 million from the FY 2016 Outlook primarily due to rate increases. The increased rates will help cover incremental debt service on $463 million of new parking facilities and systems opened over the last several years. Concessions revenue increased $9.2 million from the FY 2016 Outlook due to the impact of opening of new concessions and awarding new advertising/sponsorship contracts. TNC revenues increased $5.3 million primarily due to increased popularity of Uber and other TNCs. Interest income increased $3.2 million due to higher interest rates. These increases are offset by a $10 million decrease resulting from a one-time lease payment received in FY 2016 from American Airlines. See the DFW Cost Center section for a detail overview of these revenues. Passenger Facility Charges (PFCs) are collected from revenue enplaned passengers and are used to offset debt service on debt issued prior to TRIP. Customer Facility Charges (CFCs) are collected from rental car customers based on the number of transaction days and are used to pay debt service on the rental car facility. Other Revenues relate to funds transferred from the Public Facility Improvement Corporation (PFIC) to pay debt service associated with the Grand Hyatt Hotel and funds transferred from the DFW Capital Account to pay for debt service associated with the Terminal E garage and DFW’s headquarters facility. These revenues are higher than the FY 2016 Outlook and the Financial Plan primarily due to increased transfer from the DFW Capital Account.
In FY 2016, DFW established a budget practice to maintain a 2 month reserve of PFCs at the end of each fiscal year. It is projected that DFW will have an excess balance of approximately $9 million at the end of FY 2016 that could be applied to the rate base in FY 2017. Per the Use Agreement, PFCs are used to pay pre-TRIP debt service. If applied, this would reduce net debt
FY 2017 Adopted Budget Executive Summary
21 DFW International Airport
service charged to the Airline and DFW Cost Centers, lower Airline Cost, and increase DFWCC Net Revenues. This excess was generated primarily because AA accelerated its PFC reimbursement to DFW from two months to one resulting in an extra month collections in the last year. It is not clear if AA will continue this practice; accordingly, the use of incremental PFCs is not included in this budget.
Capital Programs and Debt Financing
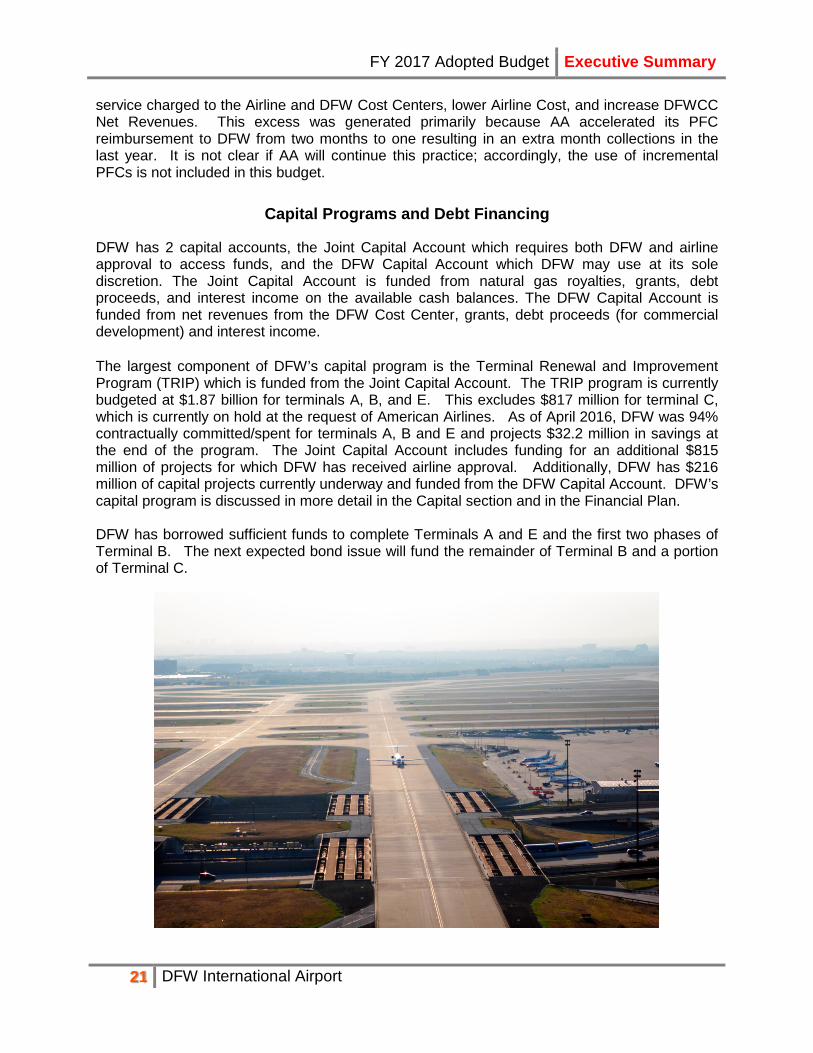
DFW has 2 capital accounts, the Joint Capital Account which requires both DFW and airline approval to access funds, and the DFW Capital Account which DFW may use at its sole discretion. The Joint Capital Account is funded from natural gas royalties, grants, debt proceeds, and interest income on the available cash balances. The DFW Capital Account is funded from net revenues from the DFW Cost Center, grants, debt proceeds (for commercial development) and interest income. The largest component of DFW’s capital program is the Terminal Renewal and Improvement Program (TRIP) which is funded from the Joint Capital Account. The TRIP program is currently budgeted at $1.87 billion for terminals A, B, and E. This excludes $817 million for terminal C, which is currently on hold at the request of American Airlines. As of April 2016, DFW was 94% contractually committed/spent for terminals A, B and E and projects $32.2 million in savings at the end of the program. The Joint Capital Account includes funding for an additional $815 million of projects for which DFW has received airline approval. Additionally, DFW has $216 million of capital projects currently underway and funded from the DFW Capital Account. DFW’s capital program is discussed in more detail in the Capital section and in the Financial Plan. DFW has borrowed sufficient funds to complete Terminals A and E and the first two phases of Terminal B. The next expected bond issue will fund the remainder of Terminal B and a portion of Terminal C.

FY 2017 Adopted Budget Airline Cost Centers
22 DFW International Airport
Airline Cost Centers
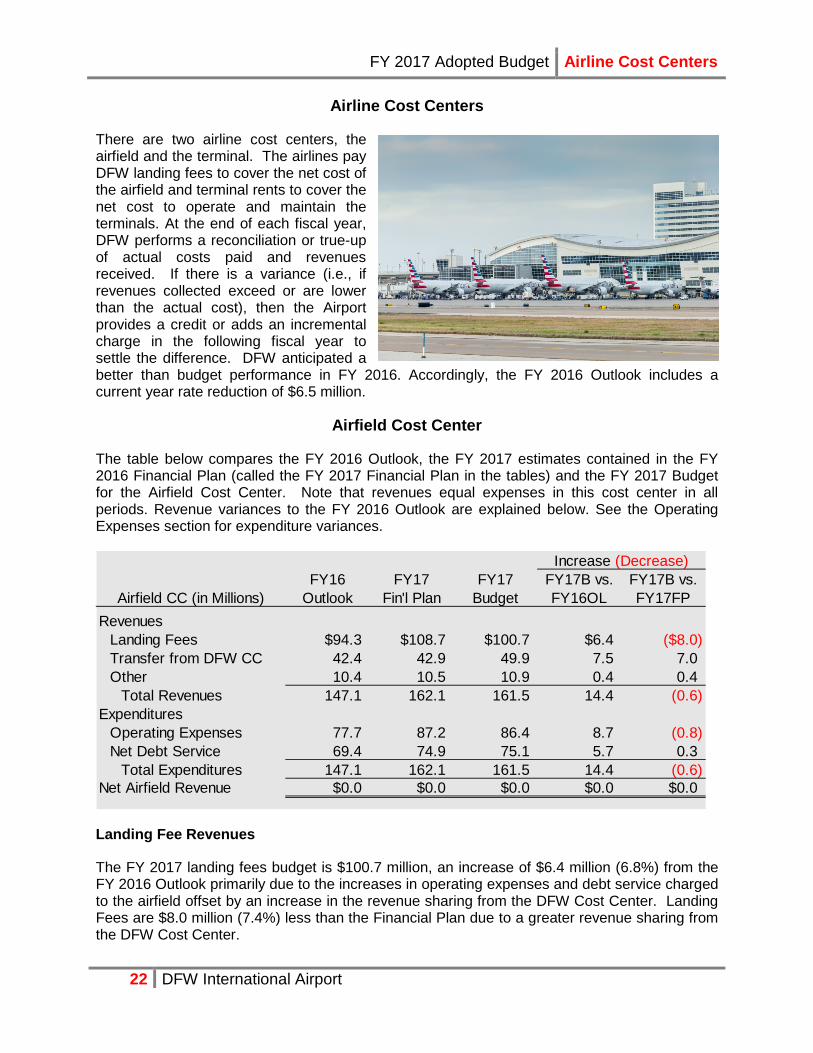
There are two airline cost centers, the airfield and the terminal. The airlines pay DFW landing fees to cover the net cost of the airfield and terminal rents to cover the net cost to operate and maintain the terminals. At the end of each fiscal year, DFW performs a reconciliation or true-up of actual costs paid and revenues received. If there is a variance (i.e., if revenues collected exceed or are lower than the actual cost), then the Airport provides a credit or adds an incremental charge in the following fiscal year to settle the difference. DFW anticipated a better than budget performance in FY 2016. Accordingly, the FY 2016 Outlook includes a current year rate reduction of $6.5 million.
Airfield Cost Center
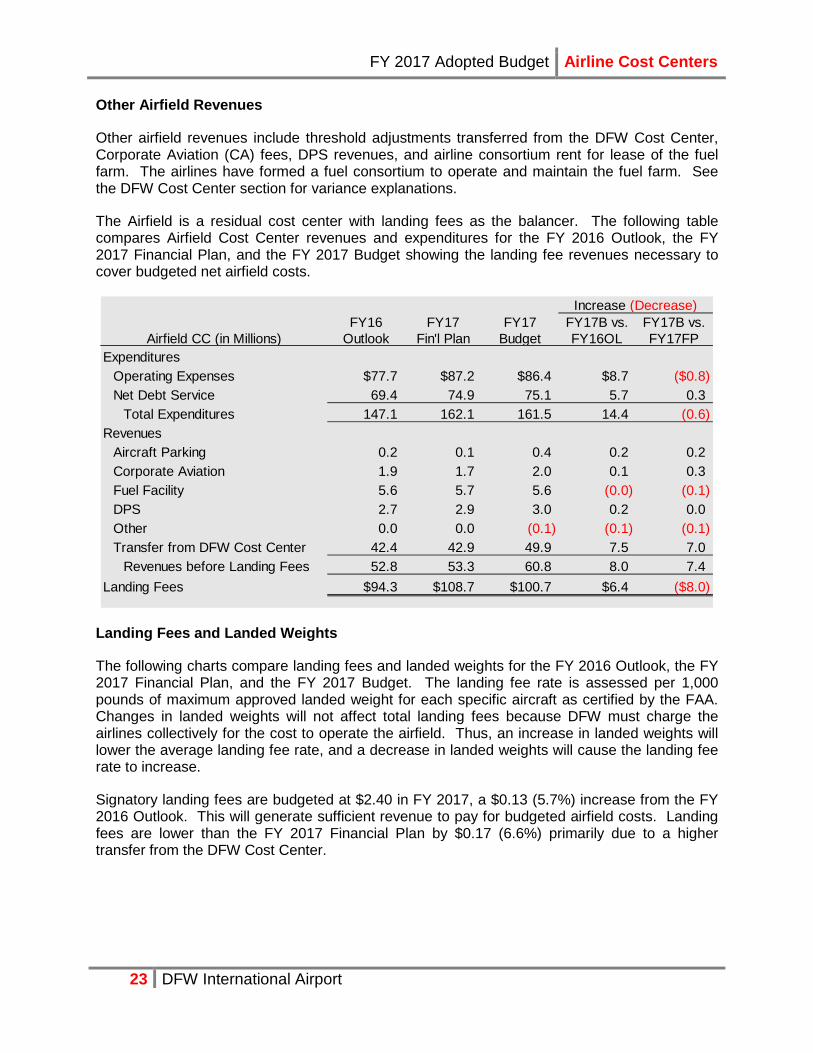
The table below compares the FY 2016 Outlook, the FY 2017 estimates contained in the FY 2016 Financial Plan (called the FY 2017 Financial Plan in the tables) and the FY 2017 Budget for the Airfield Cost Center. Note that revenues equal expenses in this cost center in all periods. Revenue variances to the FY 2016 Outlook are explained below. See the Operating Expenses section for expenditure variances.
FY16 FY17 FY17 FY17B vs. FY17B vs.Airfield CC (in Millions) Outlook Fin'l Plan Budget FY16OL FY17FP
RevenuesLanding Fees $94.3 $108.7 $100.7 $6.4 ($8.0)Transfer from DFW CC 42.4 42.9 49.9 7.5 7.0Other 10.4 10.5 10.9 0.4 0.4
Total Revenues 147.1 162.1 161.5 14.4 (0.6)Expenditures
Operating Expenses 77.7 87.2 86.4 8.7 (0.8)Net Debt Service 69.4 74.9 75.1 5.7 0.3
Total Expenditures 147.1 162.1 161.5 14.4 (0.6)Net Airfield Revenue $0.0 $0.0 $0.0 $0.0 $0.0
Increase (Decrease)
Landing Fee Revenues
The FY 2017 landing fees budget is $100.7 million, an increase of $6.4 million (6.8%) from the FY 2016 Outlook primarily due to the increases in operating expenses and debt service charged to the airfield offset by an increase in the revenue sharing from the DFW Cost Center. Landing Fees are $8.0 million (7.4%) less than the Financial Plan due to a greater revenue sharing from the DFW Cost Center.
FY 2017 Adopted Budget Airline Cost Centers
23 DFW International Airport
Other Airfield Revenues
Other airfield revenues include threshold adjustments transferred from the DFW Cost Center, Corporate Aviation (CA) fees, DPS revenues, and airline consortium rent for lease of the fuel farm. The airlines have formed a fuel consortium to operate and maintain the fuel farm. See the DFW Cost Center section for variance explanations.
The Airfield is a residual cost center with landing fees as the balancer. The following table compares Airfield Cost Center revenues and expenditures for the FY 2016 Outlook, the FY 2017 Financial Plan, and the FY 2017 Budget showing the landing fee revenues necessary to cover budgeted net airfield costs.
FY16 FY17 FY17 FY17B vs. FY17B vs.Airfield CC (in Millions) Outlook Fin'l Plan Budget FY16OL FY17FP
ExpendituresOperating Expenses $77.7 $87.2 $86.4 $8.7 ($0.8)Net Debt Service 69.4 74.9 75.1 5.7 0.3
Total Expenditures 147.1 162.1 161.5 14.4 (0.6)Revenues
Aircraft Parking 0.2 0.1 0.4 0.2 0.2Corporate Aviation 1.9 1.7 2.0 0.1 0.3Fuel Facility 5.6 5.7 5.6 (0.0) (0.1)DPS 2.7 2.9 3.0 0.2 0.0Other 0.0 0.0 (0.1) (0.1) (0.1)Transfer from DFW Cost Center 42.4 42.9 49.9 7.5 7.0
Revenues before Landing Fees 52.8 53.3 60.8 8.0 7.4Landing Fees $94.3 $108.7 $100.7 $6.4 ($8.0)
Increase (Decrease)
Landing Fees and Landed Weights
The following charts compare landing fees and landed weights for the FY 2016 Outlook, the FY 2017 Financial Plan, and the FY 2017 Budget. The landing fee rate is assessed per 1,000 pounds of maximum approved landed weight for each specific aircraft as certified by the FAA. Changes in landed weights will not affect total landing fees because DFW must charge the airlines collectively for the cost to operate the airfield. Thus, an increase in landed weights will lower the average landing fee rate, and a decrease in landed weights will cause the landing fee rate to increase.
Signatory landing fees are budgeted at $2.40 in FY 2017, a $0.13 (5.7%) increase from the FY 2016 Outlook. This will generate sufficient revenue to pay for budgeted airfield costs. Landing fees are lower than the FY 2017 Financial Plan by $0.17 (6.6%) primarily due to a higher transfer from the DFW Cost Center.

FY 2017 Adopted Budget Airline Cost Centers
24 DFW International Airport
$2.27$2.57
$2.40
$0.00
$1.00
$2.00
$3.00
$4.00
FY16 Outlook FY17 Fin'l Plan FY17 Budget
Landing Fee Rates (per 1,000 lbs.)
41.5 42.3 42.0
3032343638404244
FY16 Outlook FY17 Fin'l Plan FY17 Budget
Landed Weights(in Billions)
Cargo
DFW is recognized by the industry as one of the top cargo airports in the world. The Airport’s prime location allows assorted cargo to reach millions of U.S. customers by road, while also reaching several continents by plane in a matter of hours. Ninety eight percent of the Continental U.S. population can be reached via truck within 48 hours from DFW Airport. Approximately 8.6% of all landing fees are budgeted to come from cargo aircraft for the FY 2017 budget.

FY 2017 Adopted Budget Airline Cost Centers
25 DFW International Airport
Terminal Cost Center
The table below compares the FY 2016 Outlook, the FY2017 Financial Plan, and the FY 2017 Budget for the Terminal Cost Center. Note that revenues equal expenses in this cost center in all periods. Revenue variances between the FY 2017 Budget and the FY 2016 Outlook are explained below. See the Operating Expense section for expenditure variations.
FY16 FY17 FY17 FY17B vs. FY17B vs.Terminal CC (in Millions) Outlook Fin'l Plan Budget FY16OL FY17FP
RevenuesOperating Revenue
Terminal Leases $198.0 $266.8 $250.8 $52.8 ($16.0)FIS Fees 23.3 24.2 24.3 1.0 0.2Turn Fees & Office Rents 23.8 33.2 30.8 7.1 (2.4)Other 16.5 14.7 17.3 0.8 2.6
Total Operating Revenue 261.6 338.9 323.2 61.6 (15.6)Transfers
DFW Terminal Contribution 5.9 4.0 3.8 (2.2) (0.2)Joint Capital Transfer 8.0 4.0 4.0 (4.0) 0.0
Total Transfers 13.9 8.0 7.8 (6.2) (0.2)Total Revenues 275.6 346.8 331.0 55.4 (15.8)Expenditures
Operating Expenses 183.2 195.4 198.0 14.8 2.5Net Debt Service 92.4 151.4 133.0 40.7 (18.4)
Total Expenditures 275.6 346.8 331.0 55.4 (15.8)Net Terminal Revenue $0.0 $0.0 $0.0 $0.0 $0.0
Increase (Decrease)
The Terminal is a residual cost center with terminal leases as the balancer. The table on the following page compares Terminal Cost Center revenues and expenditures for the FY 2016 Outlook, the FY 2017 Financial Plan, and the FY 2017 Budget showing the terminal lease revenues necessary to cover budgeted net terminal costs.

FY 2017 Adopted Budget Airline Cost Centers
26 DFW International Airport
FY16 FY17 FY17 FY17B vs. FY17B vs.Terminal CC (in Millions) Outlook Fin'l Plan Budget FY16OL FY17FP
ExpendituresOperating Expenses $183.2 $195.4 $198.0 $14.8 $2.5Net Debt Service 92.4 151.4 133.0 40.7 (18.4)
Total Expenditures 275.6 346.8 331.0 55.4 (15.8)Revenues
Operating RevenueFIS Fees 23.3 24.2 24.3 1.0 0.2Turn Fees & Office Rents 23.8 33.2 30.8 7.1 (2.4)Other 16.5 14.7 17.3 0.8 2.6
Operating Revenues 63.6 72.1 72.4 8.8 0.3Transfers
DFW Terminal Contribution 5.9 4.0 3.8 (2.2) (0.2)Joint Capital Transfer 8.0 4.0 4.0 (4.0) 0.0
Total Transfers 13.9 8.0 7.8 (6.2) (0.2) Revenues before Leases 77.5 80.1 80.2 2.7 0.1
Terminal Leases Needed $198.0 $266.8 $250.8 $52.8 ($16.0)
Increase (Decrease)
Terminal Leases The FY 2017 Terminal Lease budget is $250.8 million, a $52.8 million (26.7%) increase from the FY 2016 Outlook due primarily to increases in net debt service charged to the terminals, operating costs, and a reduced Joint Capital Transfer. Terminal lease fees are charged to airlines based on the direct and allocated costs to operate the terminals. Total terminal operations and maintenance cost, including HVAC and other utilities for all 5 terminals, are divided by leasable square feet to calculate an average lease rate per square foot. American Airlines pays directly for the maintenance costs of Terminals A and C. These costs are added into the numerator of this formula to derive the fully loaded average rate. American Airlines receives rent credit for their costs. The amount of the rent credit was negotiated as part of the Use Agreement ($39.0 million in FY 2017).
Average Terminal Rents before Credits The following chart compares average terminal rents before credits for the FY 2016 Outlook, the FY 2017 Financial Plan, and the FY 2017 Budget. The increase in the FY 2017 Budget compared to the FY 2016 Outlook is due to increases in net debt service charged to the terminals, increases in operating costs, and a reduction of $4 million in the transfer credit from the Joint Capital Account compared to FY 2016 as described in the Use Agreement.

FY 2017 Adopted Budget Airline Cost Centers
27 DFW International Airport
$194
$273 $259
$0
$50
$100
$150
$200
$250
$300
FY16 Outlook FY17 Fin'l Plan FY17 Budget
Average Terminal Rents before Creditsper square foot
Federal Inspection Services (FIS) Fees Costs are allocated to the FIS based on its percent share of terminal square footage. The FIS budget for FY 2017 is $24.3 million, a $1.0 million (4.3%) increase from the FY 2016 Outlook. The FY 2017 rate is based upon terminal costs excluding new debt service. The rate for FIS per international passenger clearing customs at DFW is budgeted at $6.64, compared to a rate of $6.95 in the Financial Plan. DFW expects 3.7 million International FIS deplaned passengers in FY 2017 compared to 3.6 million in FY 2016. FIS passengers do not include arriving passengers from a limited number of countries in which passengers clear U. S. Customs in the departing country (e.g., Canada and Abu Dhabi).
Turn Fees and Office Rents Turn fees are paid by airlines for common use gates in Terminals D and E in lieu of permanently renting space. Per the terms of the Use Agreement, turn fee rates must change at the same percentage as terminal lease rates. The turn fees and office rents budget for FY 2017 is $30.8 million, a $7.1 million (29.8%) increase from the FY 2016 Outlook.
Other Terminal Revenues Other terminal revenues include TSA rents, concessions O & M reimbursements, catering fees, and allocable miscellaneous DPS revenues. Concessionaires are required to reimburse the Airport (for Terminals B, D and E) and American Airlines (for Terminals A and C) for the allocated maintenance cost per square foot of the terminals. The other terminal revenues budget for FY 2017 is $17.3 million, a $0.8 million (4.8%) increase from the FY 2016 Outlook primarily due to increases in catering fees and concessions O&M reimbursements, and a $2.6 million (17.7%) increase over the FY 2017 Financial Plan primarily due to increases in catering fees and TSA rents.
Transfers - Joint Capital Account Transfer Per the terms of the Use Agreement, an annual transfer is made from the Joint Capital Account to the Terminal Cost Center to subsidize terminal rates. The annual transfer was $28 million in FY 2011 and is reduced by $4 million each year until it is phased-out completely in FY 2018. Accordingly, the FY 2017 amount is $4 million.
FY 2017 Adopted Budget Airline Cost Centers
28 DFW International Airport
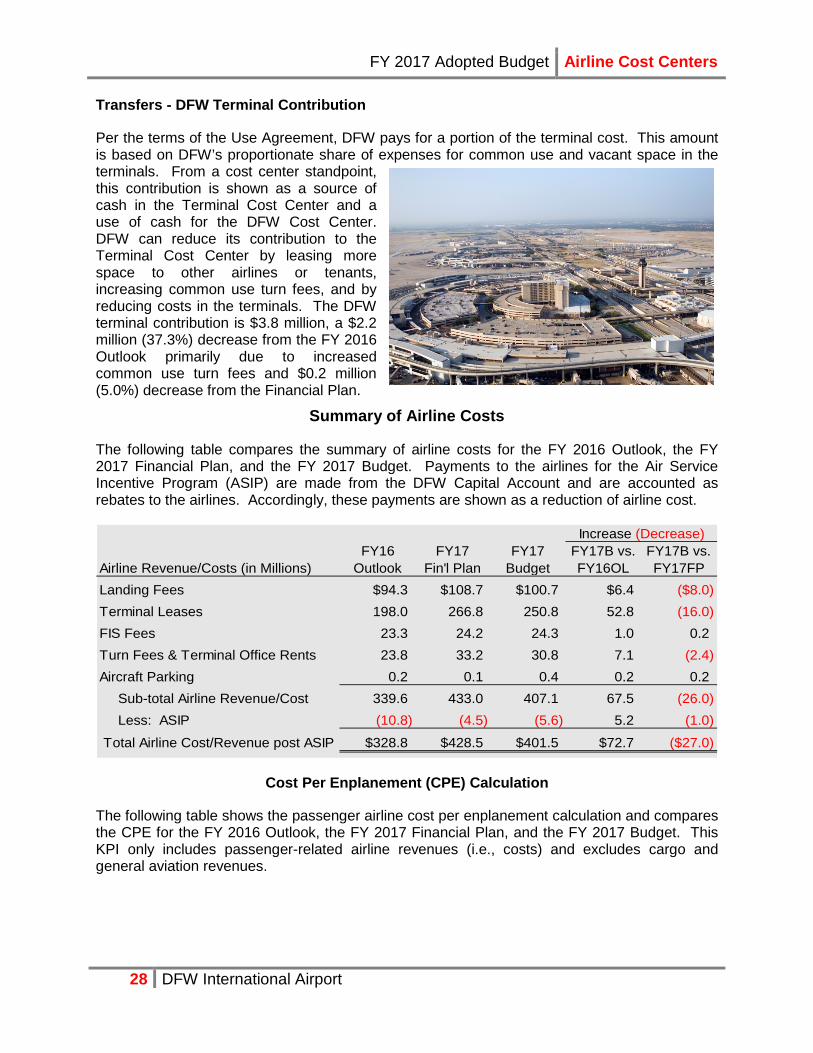
Transfers - DFW Terminal Contribution
Per the terms of the Use Agreement, DFW pays for a portion of the terminal cost. This amount is based on DFW’s proportionate share of expenses for common use and vacant space in the terminals. From a cost center standpoint, this contribution is shown as a source of cash in the Terminal Cost Center and a use of cash for the DFW Cost Center. DFW can reduce its contribution to the Terminal Cost Center by leasing more space to other airlines or tenants, increasing common use turn fees, and by reducing costs in the terminals. The DFW terminal contribution is $3.8 million, a $2.2 million (37.3%) decrease from the FY 2016 Outlook primarily due to increased common use turn fees and $0.2 million (5.0%) decrease from the Financial Plan.
Summary of Airline Costs
The following table compares the summary of airline costs for the FY 2016 Outlook, the FY 2017 Financial Plan, and the FY 2017 Budget. Payments to the airlines for the Air Service Incentive Program (ASIP) are made from the DFW Capital Account and are accounted as rebates to the airlines. Accordingly, these payments are shown as a reduction of airline cost.
Airline Revenue/Costs (in Millions)FY16
OutlookFY17
Fin'l PlanFY17
BudgetFY17B vs. FY16OL
FY17B vs. FY17FP
Landing Fees $94.3 $108.7 $100.7 $6.4 ($8.0)Terminal Leases 198.0 266.8 250.8 52.8 (16.0)FIS Fees 23.3 24.2 24.3 1.0 0.2Turn Fees & Terminal Office Rents 23.8 33.2 30.8 7.1 (2.4)Aircraft Parking 0.2 0.1 0.4 0.2 0.2
Sub-total Airline Revenue/Cost 339.6 433.0 407.1 67.5 (26.0)Less: ASIP (10.8) (4.5) (5.6) 5.2 (1.0)
Total Airline Cost/Revenue post ASIP $328.8 $428.5 $401.5 $72.7 ($27.0)
Increase (Decrease)
Cost Per Enplanement (CPE) Calculation
The following table shows the passenger airline cost per enplanement calculation and compares the CPE for the FY 2016 Outlook, the FY 2017 Financial Plan, and the FY 2017 Budget. This KPI only includes passenger-related airline revenues (i.e., costs) and excludes cargo and general aviation revenues.

FY 2017 Adopted Budget Airline Cost Centers
29 DFW International Airport
Cost Per Enplanement (in Millions)FY16
OutlookFY17
Fin'l PlanFY17
BudgetFY167 vs. FY16OL
FY17B vs. FY17FP
Passenger Airline Enplanements(1) 33.3 34.0 33.9 0.6 (0.1)
Passenger Airline Cost per Enplanement
Airline Cost/Revenue $339.6 $433.0 $407.1 $67.5 ($26.0)
Less: Cargo (8.1) (8.9) (8.7) (0.6) 0.2
Sub-total PAX Airline Revenue 331.4 424.2 398.4 66.9 (25.8)
Less ASIP - Passenger Airlines (10.8) (4.5) (5.6) 5.2 (1.0)
Total PAX Airline Revenue post ASIP 320.6 419.6 392.8 72.2 (26.8)Cost per Enplanement (CPE)(2) $9.64 $12.38 $11.60 $1.95 ($0.78)
1General Aviation enplanements are excluded from CPE calculation2Actual rates, not in millions
Increase (Decrease)

FY 2017 Adopted Budget DFW Cost Center
30 DFW International Airport
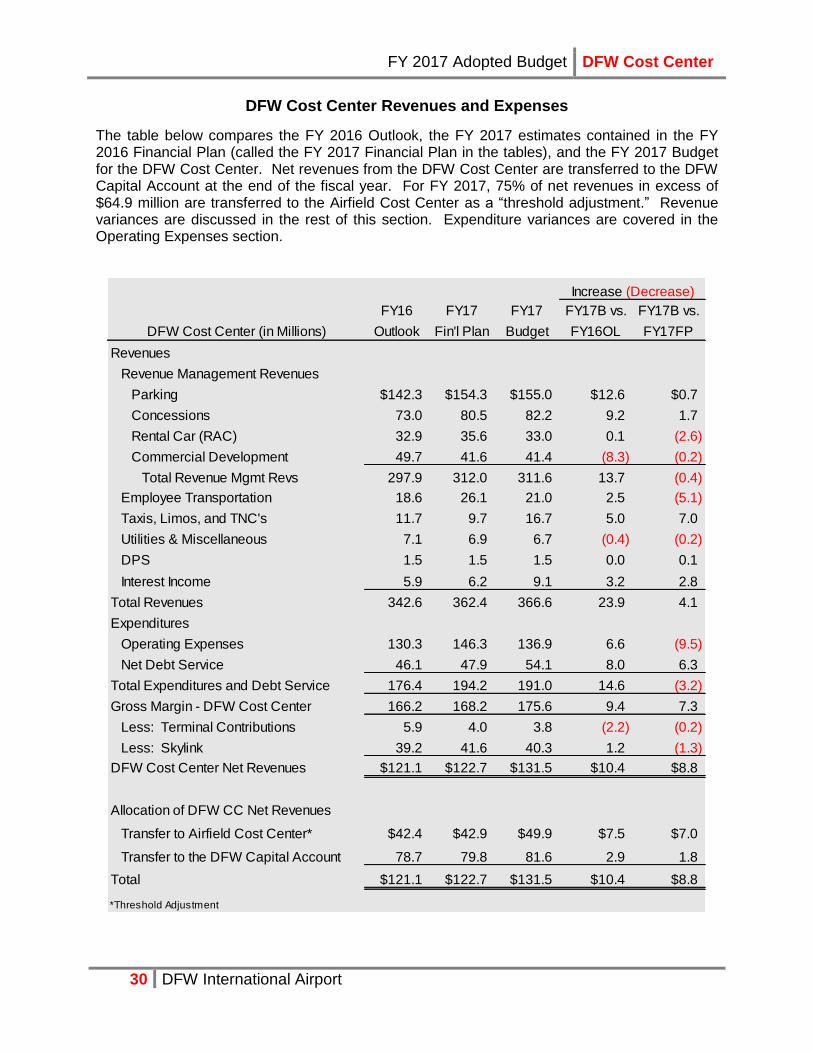
DFW Cost Center Revenues and Expenses
The table below compares the FY 2016 Outlook, the FY 2017 estimates contained in the FY 2016 Financial Plan (called the FY 2017 Financial Plan in the tables), and the FY 2017 Budget for the DFW Cost Center. Net revenues from the DFW Cost Center are transferred to the DFW Capital Account at the end of the fiscal year. For FY 2017, 75% of net revenues in excess of $64.9 million are transferred to the Airfield Cost Center as a “threshold adjustment.” Revenue variances are discussed in the rest of this section. Expenditure variances are covered in the Operating Expenses section.
FY16 FY17 FY17 FY17B vs. FY17B vs.
DFW Cost Center (in Millions) Outlook Fin'l Plan Budget FY16OL FY17FP
Revenues
Revenue Management Revenues
Parking $142.3 $154.3 $155.0 $12.6 $0.7
Concessions 73.0 80.5 82.2 9.2 1.7
Rental Car (RAC) 32.9 35.6 33.0 0.1 (2.6)
Commercial Development 49.7 41.6 41.4 (8.3) (0.2)
Total Revenue Mgmt Revs 297.9 312.0 311.6 13.7 (0.4)
Employee Transportation 18.6 26.1 21.0 2.5 (5.1)
Taxis, Limos, and TNC's 11.7 9.7 16.7 5.0 7.0
Utilities & Miscellaneous 7.1 6.9 6.7 (0.4) (0.2)
DPS 1.5 1.5 1.5 0.0 0.1
Interest Income 5.9 6.2 9.1 3.2 2.8
Total Revenues 342.6 362.4 366.6 23.9 4.1
Expenditures
Operating Expenses 130.3 146.3 136.9 6.6 (9.5)
Net Debt Service 46.1 47.9 54.1 8.0 6.3
Total Expenditures and Debt Service 176.4 194.2 191.0 14.6 (3.2)
Gross Margin - DFW Cost Center 166.2 168.2 175.6 9.4 7.3
Less: Terminal Contributions 5.9 4.0 3.8 (2.2) (0.2)
Less: Skylink 39.2 41.6 40.3 1.2 (1.3)
DFW Cost Center Net Revenues $121.1 $122.7 $131.5 $10.4 $8.8
Allocation of DFW CC Net Revenues
Transfer to Airfield Cost Center* $42.4 $42.9 $49.9 $7.5 $7.0
Transfer to the DFW Capital Account 78.7 79.8 81.6 2.9 1.8
Total $121.1 $122.7 $131.5 $10.4 $8.8
*Threshold Adjustment
Increase (Decrease)
FY 2017 Adopted Budget DFW Cost Center
31 DFW International Airport
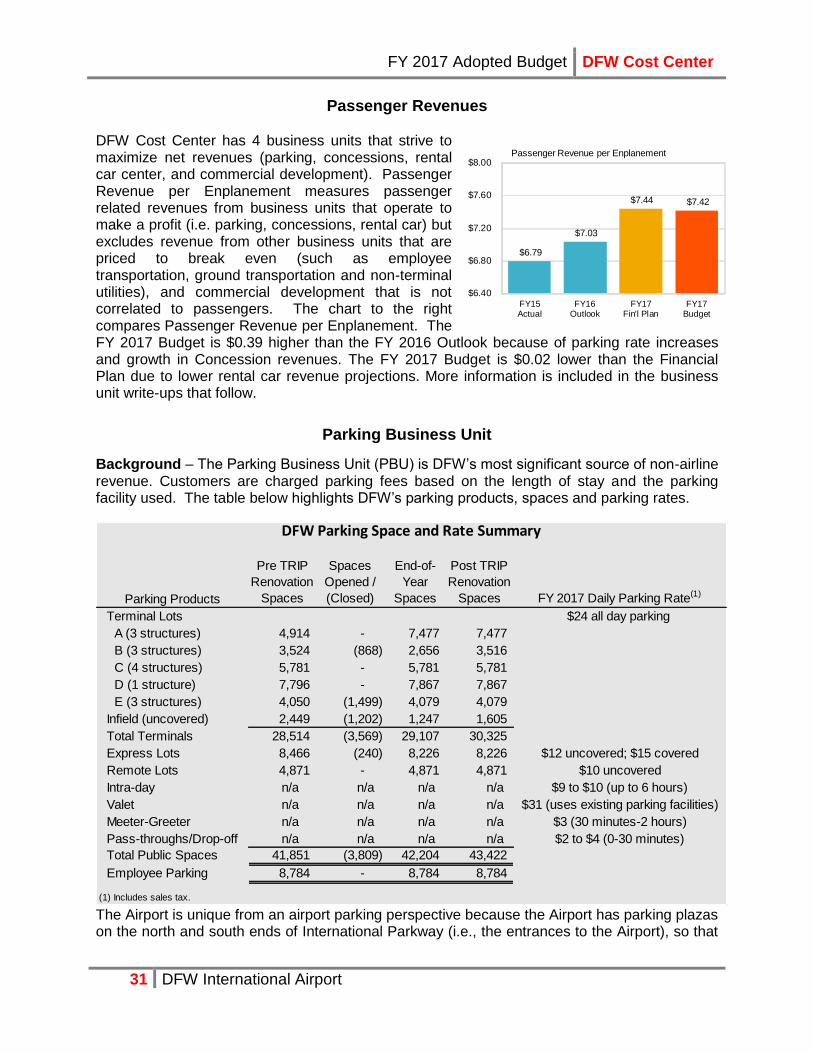
Passenger Revenues
DFW Cost Center has 4 business units that strive to maximize net revenues (parking, concessions, rental car center, and commercial development). Passenger Revenue per Enplanement measures passenger related revenues from business units that operate to make a profit (i.e. parking, concessions, rental car) but excludes revenue from other business units that are priced to break even (such as employee transportation, ground transportation and non-terminal utilities), and commercial development that is not correlated to passengers. The chart to the right compares Passenger Revenue per Enplanement. The FY 2017 Budget is $0.39 higher than the FY 2016 Outlook because of parking rate increases and growth in Concession revenues. The FY 2017 Budget is $0.02 lower than the Financial Plan due to lower rental car revenue projections. More information is included in the business unit write-ups that follow.
Parking Business Unit
Background – The Parking Business Unit (PBU) is DFW’s most significant source of non-airline revenue. Customers are charged parking fees based on the length of stay and the parking facility used. The table below highlights DFW’s parking products, spaces and parking rates.
The Airport is unique from an airport parking perspective because the Airport has parking plazas on the north and south ends of International Parkway (i.e., the entrances to the Airport), so that
$6.79
$7.03
$7.44 $7.42
$6.40
$6.80
$7.20
$7.60
$8.00
FY15Actual
FY16Outlook
FY17Fin'l Plan
FY17Budget
Passenger Revenue per Enplanement
Parking Products
Pre TRIP
Renovation
Spaces
Spaces
Opened /
(Closed)
End-of-
Year
Spaces
Post TRIP
Renovation
Spaces FY 2017 Daily Parking Rate(1)
Terminal Lots $24 all day parking
A (3 structures) 4,914 - 7,477 7,477
B (3 structures) 3,524 (868) 2,656 3,516
C (4 structures) 5,781 - 5,781 5,781
D (1 structure) 7,796 - 7,867 7,867
E (3 structures) 4,050 (1,499) 4,079 4,079
Infield (uncovered) 2,449 (1,202) 1,247 1,605
Total Terminals 28,514 (3,569) 29,107 30,325
Express Lots 8,466 (240) 8,226 8,226 $12 uncovered; $15 covered
Remote Lots 4,871 - 4,871 4,871 $10 uncovered
Intra-day n/a n/a n/a n/a $9 to $10 (up to 6 hours)
Valet n/a n/a n/a n/a $31 (uses existing parking facilities)
Meeter-Greeter n/a n/a n/a n/a $3 (30 minutes-2 hours)
Pass-throughs/Drop-off n/a n/a n/a n/a $2 to $4 (0-30 minutes)
Total Public Spaces 41,851 (3,809) 42,204 43,422
Employee Parking 8,784 - 8,784 8,784
(1) Includes sales tax.
DFW Parking Space and Rate Summary

FY 2017 Adopted Budget DFW Cost Center
32 DFW International Airport
all customers and visitors must go through the plazas to access the Airport. In addition, many patrons drive through the Airport while traveling from north to south or south to north. These patrons pay a $4 pass-through fee for the first 8 minutes. Intra-Day fees graduate to $10 with daily rates beginning at 6 hours. Any stay over 6 hours is considered one full day.
Over the past few years, DFW has made substantial investments in new parking garages, systems, and improvements. By the end of FY 2017, DFW will have spent over $460 million on such investments. These investments include new garages for Terminals A and E, a Parking Control System, new Parking Plazas, a new Parking Guidance System in Terminals A, D, and E, and the expanded Express lots. These investments require an annual debt service of almost $30 million annually. The annual operating costs on the new parking control system and new parking guidance system will be $1.3 million in FY 2017, an increase of $0.9 million from FY 2016 and will increase to $1.9 million in FY 2018.
DFW collects a privilege fee of 10% (of sales) from off-airport parking and valet providers. The Airport contracts directly with a third party to provide a DFW branded valet service.
The chart below shows the Proposed Vehicle Parking Fees for FY 2017.
FY 2017 Budget – The FY 2017 parking revenue budget is $155.0 million, a $12.6 million (8.9%) increase from the FY 2016 Outlook. This reflects a full year impact of $2 increase for 0 - 8 minutes parking, $2 increase for 2 - 4 hour parking in the central terminal area, $1 increase for 4 – 6 hour parking in the central terminal area, $2 increase for full day parking in the central terminal area, $2 increase in Express covered parking, $1 increase in Express uncovered and Remote parking, and $2 increase for valet customers. The proposed rate increases are expected to generate incremental revenues of $10.3 million net of elasticity impact. The FY 2017 Budget is $0.7 million (0.4%) higher than the Financial Plan. The FY 2017 Budget has an exposure of $3 million due to competition from Transportation Network Companies (TNCs) such as Uber and Lyft. Section B of the Terminal E opened in April 2016 and section C of Terminal E garage closed and demolished in April 2016. The new section C of Terminal E garage is expected to be completed in April 2017.
Duration Terminal
Express
Covered
Express
Uncovered Remote
0 min - 8 min $4 $2 $2 $1
8 min - 30 min $2 $2 $2 $1
30 min - 2 hours $3 $2 $2 $1
2 - 4 hours $9 $3 $3 $2
4 - 6 hours $10 $4 $4 $3
6 - 24 hours $24 $15 $12 $10
(1) All Parking fees, excluding valet parking, include sales tax. The sales tax is based on applicable tax jurisdiction.
Proposed Vehicle Parking Fees(1)
FY 2017 Adopted Budget DFW Cost Center
33 DFW International Airport
Parking Revenue per Originating Passenger The primary drivers for parking revenues are originating passengers, parking prices, and average length of stay. The goal is to maximize revenue per originating passenger. The increase in parking revenue per originating passenger for the FY 2017 Budget versus the FY 2016 Outlook is due to rate increases.
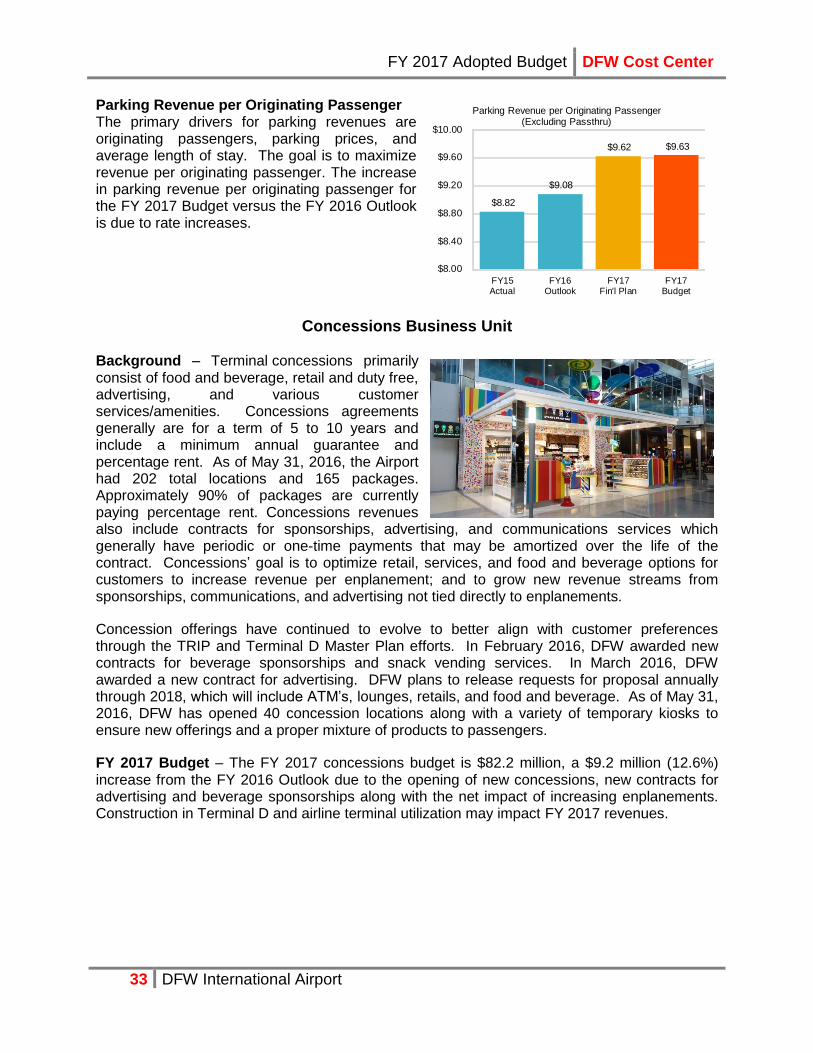
Concessions Business Unit
Background – Terminal concessions primarily consist of food and beverage, retail and duty free, advertising, and various customer services/amenities. Concessions agreements generally are for a term of 5 to 10 years and include a minimum annual guarantee and percentage rent. As of May 31, 2016, the Airport had 202 total locations and 165 packages. Approximately 90% of packages are currently paying percentage rent. Concessions revenues also include contracts for sponsorships, advertising, and communications services which generally have periodic or one-time payments that may be amortized over the life of the contract. Concessions’ goal is to optimize retail, services, and food and beverage options for customers to increase revenue per enplanement; and to grow new revenue streams from sponsorships, communications, and advertising not tied directly to enplanements.
Concession offerings have continued to evolve to better align with customer preferences through the TRIP and Terminal D Master Plan efforts. In February 2016, DFW awarded new contracts for beverage sponsorships and snack vending services. In March 2016, DFW awarded a new contract for advertising. DFW plans to release requests for proposal annually through 2018, which will include ATM’s, lounges, retails, and food and beverage. As of May 31, 2016, DFW has opened 40 concession locations along with a variety of temporary kiosks to ensure new offerings and a proper mixture of products to passengers.
FY 2017 Budget – The FY 2017 concessions budget is $82.2 million, a $9.2 million (12.6%) increase from the FY 2016 Outlook due to the opening of new concessions, new contracts for advertising and beverage sponsorships along with the net impact of increasing enplanements. Construction in Terminal D and airline terminal utilization may impact FY 2017 revenues.
$8.82
$9.08
$9.62 $9.63
$8.00
$8.40
$8.80
$9.20
$9.60
$10.00
FY15Actual
FY16Outlook
FY17Fin'l Plan
FY17Budget
Parking Revenue per Originating Passenger (Excluding Passthru)
FY 2017 Adopted Budget DFW Cost Center
34 DFW International Airport
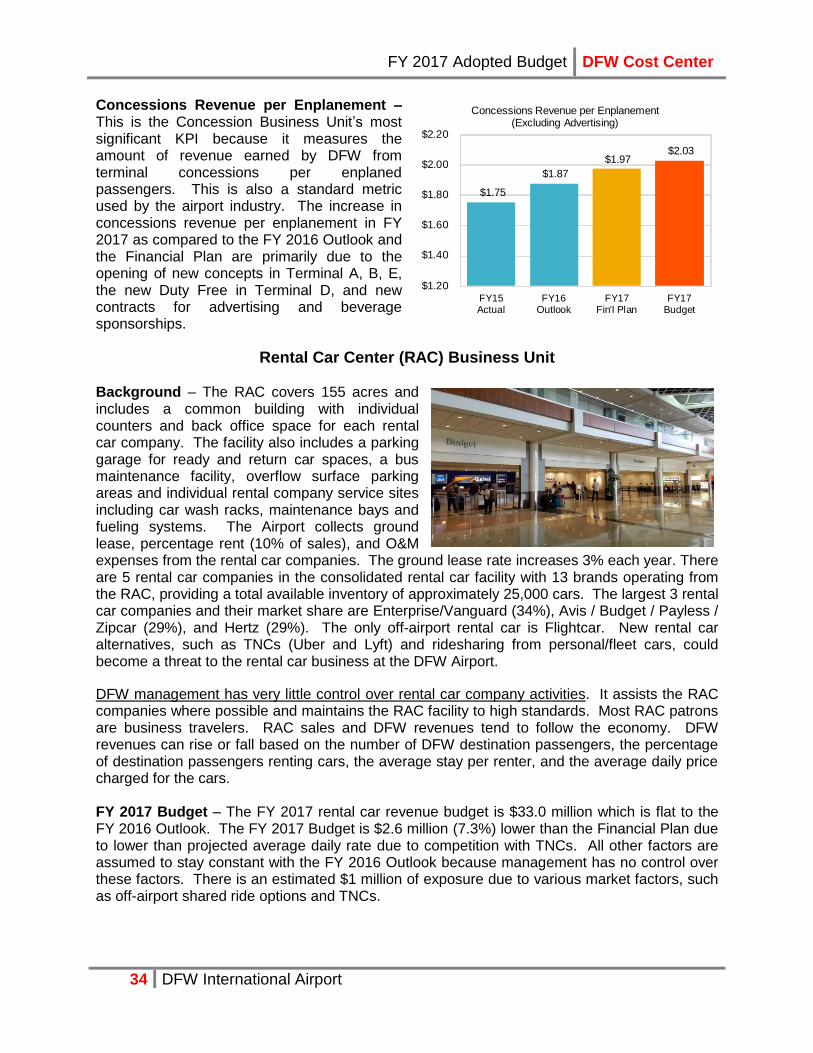
Concessions Revenue per Enplanement – This is the Concession Business Unit’s most significant KPI because it measures the amount of revenue earned by DFW from terminal concessions per enplaned passengers. This is also a standard metric used by the airport industry. The increase in concessions revenue per enplanement in FY 2017 as compared to the FY 2016 Outlook and the Financial Plan are primarily due to the opening of new concepts in Terminal A, B, E, the new Duty Free in Terminal D, and new contracts for advertising and beverage sponsorships.
Rental Car Center (RAC) Business Unit
Background – The RAC covers 155 acres and includes a common building with individual counters and back office space for each rental car company. The facility also includes a parking garage for ready and return car spaces, a bus maintenance facility, overflow surface parking areas and individual rental company service sites including car wash racks, maintenance bays and fueling systems. The Airport collects ground lease, percentage rent (10% of sales), and O&M expenses from the rental car companies. The ground lease rate increases 3% each year. There are 5 rental car companies in the consolidated rental car facility with 13 brands operating from the RAC, providing a total available inventory of approximately 25,000 cars. The largest 3 rental car companies and their market share are Enterprise/Vanguard (34%), Avis / Budget / Payless / Zipcar (29%), and Hertz (29%). The only off-airport rental car is Flightcar. New rental car alternatives, such as TNCs (Uber and Lyft) and ridesharing from personal/fleet cars, could become a threat to the rental car business at the DFW Airport.
DFW management has very little control over rental car company activities. It assists the RAC companies where possible and maintains the RAC facility to high standards. Most RAC patrons are business travelers. RAC sales and DFW revenues tend to follow the economy. DFW revenues can rise or fall based on the number of DFW destination passengers, the percentage of destination passengers renting cars, the average stay per renter, and the average daily price charged for the cars. FY 2017 Budget – The FY 2017 rental car revenue budget is $33.0 million which is flat to the FY 2016 Outlook. The FY 2017 Budget is $2.6 million (7.3%) lower than the Financial Plan due to lower than projected average daily rate due to competition with TNCs. All other factors are assumed to stay constant with the FY 2016 Outlook because management has no control over these factors. There is an estimated $1 million of exposure due to various market factors, such as off-airport shared ride options and TNCs.
$1.75
$1.87
$1.97 $2.03
$1.20
$1.40
$1.60
$1.80
$2.00
$2.20
FY15Actual
FY16Outlook
FY17Fin'l Plan
FY17Budget
Concessions Revenue per Enplanement (Excluding Advertising)

FY 2017 Adopted Budget DFW Cost Center
35 DFW International Airport
RAC Revenues per Destination Passenger This KPI measures the amount of percentage rent paid by the rental car companies to DFW divided by destination passengers (i.e. passengers from other cities that fly to DFW for business or pleasure). The FY 2017 Budget for RAC revenues per destination passenger is projected to be lower than the FY 2016 Outlook and the Financial Plan primarily due to lower daily rate assumption and other market factors.
Commercial Development Business Unit
Background – The Airport has a total land mass of 17,207 acres. As of June 14, 2016, 2,209 acres have been commercially developed. Management estimates that approximately 4,170 acres of additional land is available for future development. A commercial development land use plan has been completed and approved by the Board. The Airport focuses primarily on developing land that has airport synergy such as logistics and warehousing. Commercial development revenues include ground leases, foreign trade zone tariff and facility rents generated from non-terminal Airport facilities, and property and surface use fees primarily from natural gas drilling. Multi-year lease agreements are negotiated with tenants on a square foot or acre basis. Some facilities such as the Hyatt Regency Hotel and Bear Creek Golf Course also have percentage rent components. Industrial space demand has been consistent in the northern part of the airport specifically in the Coppell Industrial, International Commerce Park and Northwest Logistics areas. Current construction in mixed-use developments close to Main Street and Highway 114 includes automobile dealerships. The airport is increasingly focused on the southern region in response to market driven space demand, particularly the Passport Park, Bear Creek and Walnut Hill areas. The key drivers for commercial development revenues are acres developed and the average ground rental rate. Approximately 62% of the ground lease revenue is based on negotiated rates and 38% on the airport services ground rental rate which are primarily older leases that have airfield access. The airport services ground rental rate per acre changes with inflation and will be $27,058 in FY 2017.
FY 2017 Budget – The FY 2017 commercial development revenue budget is $41.4 million, a $8.3 million (16.6%) decrease from the FY 2016 Outlook due to one-time ground lease proceeds received in FY 2016 for AA’s new headquarter facility. FY 2017 reflects an increase of $1.0 million in new ground lease rents and $0.7 million from existing contracted leases.
$2.61 $2.65 $2.80
$2.61
$1.20
$1.60
$2.00
$2.40
$2.80
FY15Actual
FY16Outlook
FY17Fin'l Plan
FY17Budget
Rental Car Revenue per Destination Passenger

FY 2017 Adopted Budget DFW Cost Center
36 DFW International Airport
Other DFW Revenues and Expenses The fees charged in this category are established to recover costs (except interest income). Employee Transportation – DFW charges fees for employees to access the transportation system that takes employees from the employee parking lots to the terminals. For most employees, the employer (airlines, concessionaires) pays these fees for their employees. The FY 2017 Budget is $21.0 million, a $2.5 million (13.2%) increase from the FY 2016 Outlook due to AA’s reimbursement of additional bussing routes, and a $5.1 million (19.5%) decrease from the Financial Plan primarily due to assumption in the Plan that all AA routes would be in effective for the full year. Taxis, Limos, and TNCs – These fees are paid by taxis, limos, Transportation Network Companies (TNCs) and other shared-ride transportation companies that require airport access to drop-off and pick-up passengers. In 2015, DFW changed its rules to permit TNCs, such as Uber and Lyft, to operate at DFW at fees similar to rates charged to taxis. The FY 2017 Budget is $16.7 million, a $5.0 million (42.5%) increase from the FY 2016 Outlook and $7.0 million (72.2%) increase from the Financial Plan due to anticipated growth in TNCs, partially offset by lost revenue from taxis and limos.
Utilities & Miscellaneous – This revenue category represents fees charged to non-airline users of utilities, HVAC, trash removal, water, and certain permit and accounting fees. Utility charges to users are based on the cost to provide the services. The FY 2017 Budget is $6.6 million, a $0.4 million (6.4%) decrease from the FY 2016 Outlook primarily due to a non-recurring audit adjustment.
DPS Revenues – The Department of Public Safety (DPS) receives reimbursements from the TSA, badging, fire training, and other services. Interest Income – Interest income includes interest earned on investments from the Operating Revenue and Expense Fund, the three-month Operating Reserve, and Debt Service Reserve Fund, and the Rolling Coverage Account. The FY 2017 interest income budget is $9.1 million, a $3.2 million (53.7%) increase from the FY 2016 Outlook and $2.8 million (45.5%) from the Financial Plan due higher assumed interest rates and higher reserve balances. There is a $2 million exposure due to interest rate increase assumption of rate increasing by 20 base points over current rates.
Skylink – Expenses related to Skylink are covered in the DFW Cost Center so that bonds related to Skylink can remain non-AMT which lowers interest rate. The FY 2017 Budget is $40.3 million, a $1.2 million (2.8%) increase from the FY 2016 Outlook primarily due to bridge inspections that occur in alternating years.
Terminal Contributions – Per the terms of the Use Agreement, DFW pays terminal cost based on common use space and its share of vacant leasable space. The FY 2017 Budget is $3.8 million, a $2.2 million (37.3%) decrease from the FY 2016 Outlook due to increased common use turn fees.

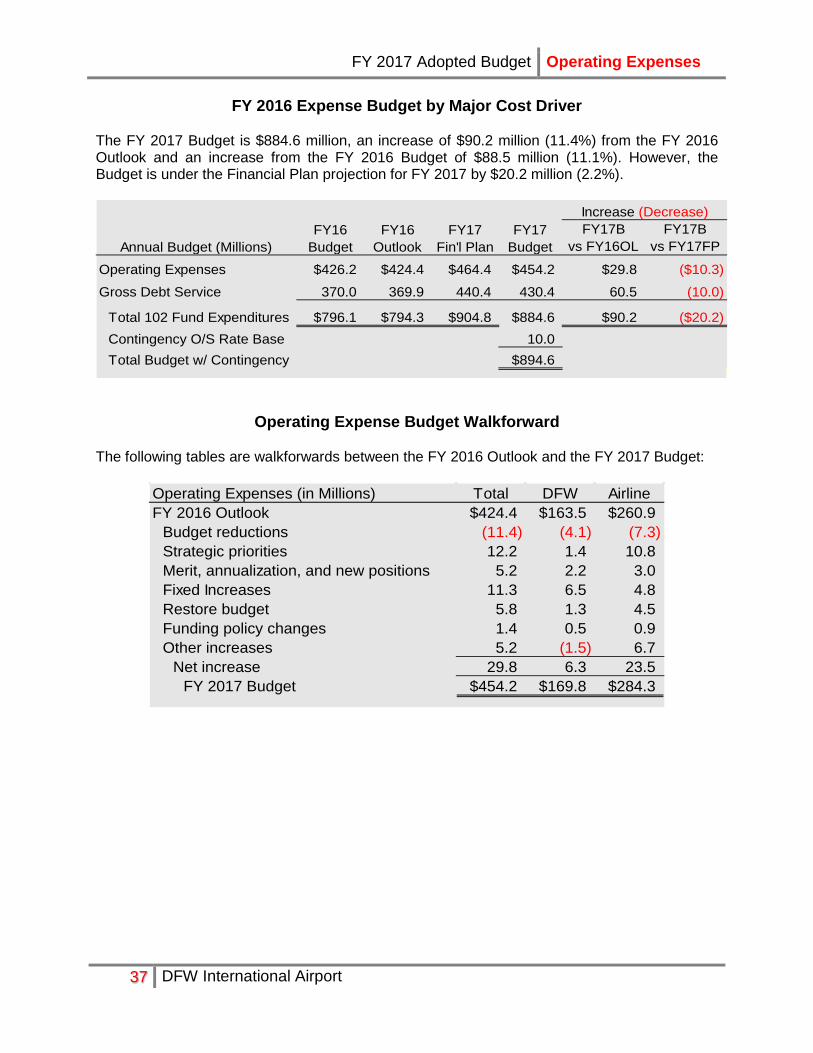
FY 2017 Adopted Budget Operating Expenses
37 DFW International Airport
FY 2016 Expense Budget by Major Cost Driver The FY 2017 Budget is $884.6 million, an increase of $90.2 million (11.4%) from the FY 2016 Outlook and an increase from the FY 2016 Budget of $88.5 million (11.1%). However, the Budget is under the Financial Plan projection for FY 2017 by $20.2 million (2.2%).
Annual Budget (Millions)FY16
BudgetFY16
OutlookFY17
Fin'l PlanFY17
BudgetFY17B
vs FY16OLFY17B
vs FY17FP
Operating Expenses $426.2 $424.4 $464.4 $454.2 $29.8 ($10.3)
Gross Debt Service 370.0 369.9 440.4 430.4 60.5 (10.0)
Total 102 Fund Expenditures $796.1 $794.3 $904.8 $884.6 $90.2 ($20.2)Contingency O/S Rate Base 10.0Total Budget w/ Contingency $894.6
Increase (Decrease)
Operating Expense Budget Walkforward The following tables are walkforwards between the FY 2016 Outlook and the FY 2017 Budget:
Operating Expenses (in Millions) Total DFW AirlineFY 2016 Outlook $424.4 $163.5 $260.9
Budget reductions (11.4) (4.1) (7.3)Strategic priorities 12.2 1.4 10.8Merit, annualization, and new positions 5.2 2.2 3.0Fixed Increases 11.3 6.5 4.8Restore budget 5.8 1.3 4.5Funding policy changes 1.4 0.5 0.9Other increases 5.2 (1.5) 6.7
Net increase 29.8 6.3 23.5FY 2017 Budget $454.2 $169.8 $284.3

FY 2017 Adopted Budget Operating Expenses
38 DFW International Airport
Detailed Operating Expense Budget Walkforward
Budget Category (in Millions) Total DFW AirlineFY 2016 Outlook $424.4 $163.5 $260.9
A. Budget reductions (11.4) (4.1) (7.3)B. StrategicPriorities
Customer ExperienceCustodial 4.5 0.2 4.3Passenger services 0.8 0.0 0.8Information Zone programming study 0.5 0.0 0.5Other customer experience enhancements 1.4 0.0 1.4
Total Customer Experience 7.2 0.2 7.0Safe and Secure
DPS security 3.2 0.6 2.7ITS security/disaster recovery 1.8 0.7 1.1
Total Safe and Secure 5.0 1.2 3.8Total Strategic Priorities 12.2 1.4 10.8
C. Merit, annualization, and new positionsMerit 3.0 1.1 1.9Annualization 1.1 0.5 0.7New positions 1.0 0.6 0.4
Total Merit, annualization, and new positions 5.2 2.2 3.0D. Fixed contract increases
Defined contribution pension & OPEB 4.2 1.7 2.5Employee busing 3.1 3.1 0.0ITS contracts 2.7 1.2 1.5Facility maintenance 0.8 0.3 0.5Insurance premiums 0.5 0.2 0.3
Total Fixed Increases 11.3 6.5 4.8E. Restore Budget
Contingency 3.5 1.2 2.3Winter weather 1.9 0.1 1.8Business development 0.4 0.0 0.4
Total Restore Budget 5.8 1.3 4.5F. Funding Policy Changes
First-year software maintenance 1.1 0.4 0.7Cloud solutions 0.3 0.1 0.2
Total Funding Policy Changes 1.4 0.5 0.9G. Other increases
FY17 one-time expenses 2.1 0.4 1.7Asset management projects 0.9 0.0 0.8Computer contracts 0.8 0.4 0.4Training 0.7 (0.0) 0.7Terminal contribution, cost center shift 0.0 (2.2) 2.2Other, net 0.7 (0.2) 0.9
Total Other increases 5.2 (1.5) 6.7Net increase 29.8 6.3 23.5
FY 2017 Budget $454.2 $169.8 $284.3
Note: The reference letters in the previous table are cross-referenced to the variance explanations in the Expense Comparison by Summary Account discussed further in this section.

FY 2017 Adopted Budget Operating Expenses
39 DFW International Airport
A. Budget Reductions ($11.4) million Budget reductions related to FY 2016 non-recurring, reimbursable, and various other savings have been removed from the FY 2017 Budget.
• FY 2016 one-time projects ($3.2 million) were eliminated from the FY 2017 Budget. These projects were completed in FY 2016 and are non-recurring.
• Capitalized salaries and benefits in Information Technology Services related to internally developed software ($2.3 million) and reduction of TSA reimbursable costs in FY 2017 as compared to FY 2016 ($0.8 million).
• Reductions in contract labor ($1.8 million) due to elimination or reduction of contract labor in the Access Control office, Parking Operations, and Customer Experience which are partially being replaced with permanent positions.
• Other reductions ($3.3 million) are from a variety of projects, contracts, and services including reductions in Terminal Link busing, non-terminal facility maintenance, planning projects, and marketing.
B. Strategic Priorities $12.2 million New strategic priorities included in the FY 2017 Budget are focused on improving the overall customer experience for passengers and enhancing safety and security at the Airport. These initiatives include:
• Customer experience enhancements ($7.2 million) which include increases in contrac-tual custodial requirements for terminals, new quality control team for Terminal B custodial operations, and a full year of the Airport Customer Experience (ACE) program which identifies and addresses issues impacting customer experience as they occur ($4.5 million). Passenger service increases include wheelchair assistance and Customs and Border Protection reimbursement ($0.8 million). Also included is an Information Zone programming study to redesign the current customer information displays in the terminals using consistent technology and best practices ($0.5 million). Other customer experience enhancements include expanded meet and greet services, digital security checkpoint management, customer centricity training, and customer experience consultants ($1.4 million).
• Safe and secure initiatives ($5.0 million) include Department of Public Safety (DPS) security increases to provide increased security presence and resources necessary to support the continually evolving TSA security requirements including changes to badging and background check procedures ($3.2 million). Also included is an incremental $1.8 million for ITS security, disaster recovery, and business continuity costs in response to continued compliance, audit, and best practices. Other incremental ITS activities include security services for network segmentation, perimeter intrusion
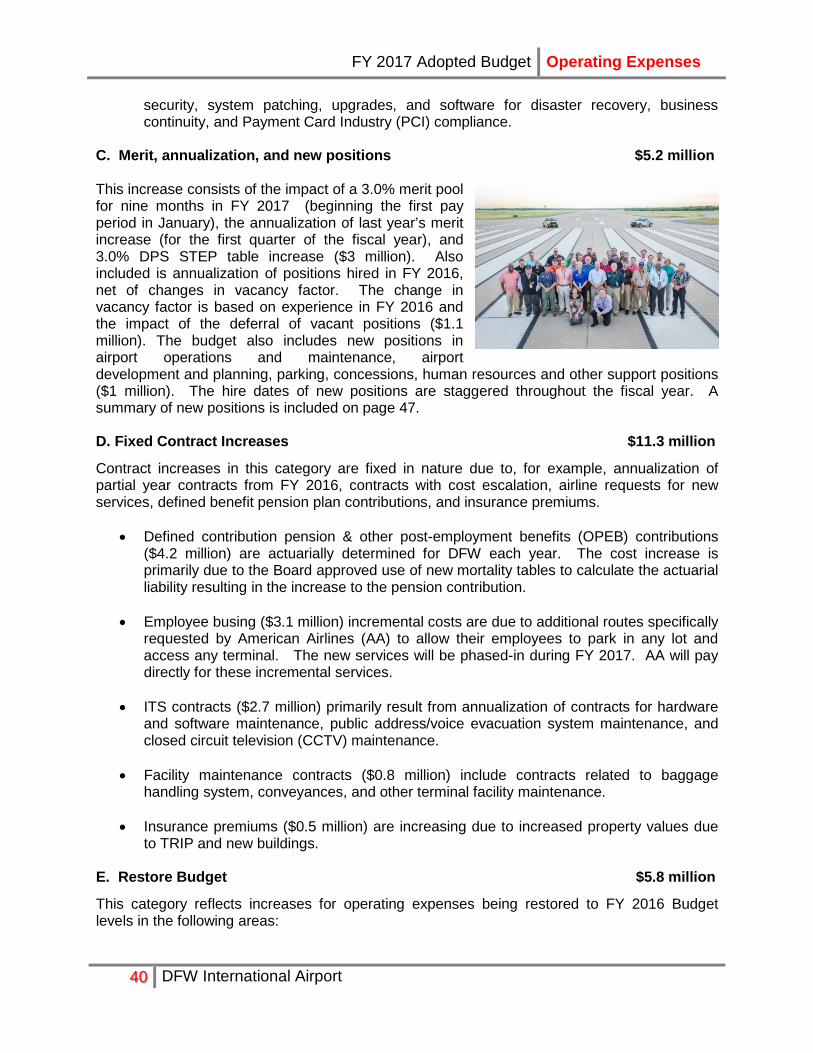
FY 2017 Adopted Budget Operating Expenses
40 DFW International Airport
security, system patching, upgrades, and software for disaster recovery, business continuity, and Payment Card Industry (PCI) compliance.
C. Merit, annualization, and new positions $5.2 million This increase consists of the impact of a 3.0% merit pool for nine months in FY 2017 (beginning the first pay period in January), the annualization of last year’s merit increase (for the first quarter of the fiscal year), and 3.0% DPS STEP table increase ($3 million). Also included is annualization of positions hired in FY 2016, net of changes in vacancy factor. The change in vacancy factor is based on experience in FY 2016 and the impact of the deferral of vacant positions ($1.1 million). The budget also includes new positions in airport operations and maintenance, airport development and planning, parking, concessions, human resources and other support positions ($1 million). The hire dates of new positions are staggered throughout the fiscal year. A summary of new positions is included on page 47. D. Fixed Contract Increases $11.3 million Contract increases in this category are fixed in nature due to, for example, annualization of partial year contracts from FY 2016, contracts with cost escalation, airline requests for new services, defined benefit pension plan contributions, and insurance premiums.
• Defined contribution pension & other post-employment benefits (OPEB) contributions ($4.2 million) are actuarially determined for DFW each year. The cost increase is primarily due to the Board approved use of new mortality tables to calculate the actuarial liability resulting in the increase to the pension contribution.
• Employee busing ($3.1 million) incremental costs are due to additional routes specifically requested by American Airlines (AA) to allow their employees to park in any lot and access any terminal. The new services will be phased-in during FY 2017. AA will pay directly for these incremental services.
• ITS contracts ($2.7 million) primarily result from annualization of contracts for hardware and software maintenance, public address/voice evacuation system maintenance, and closed circuit television (CCTV) maintenance.
• Facility maintenance contracts ($0.8 million) include contracts related to baggage handling system, conveyances, and other terminal facility maintenance.
• Insurance premiums ($0.5 million) are increasing due to increased property values due to TRIP and new buildings.
E. Restore Budget $5.8 million This category reflects increases for operating expenses being restored to FY 2016 Budget levels in the following areas:
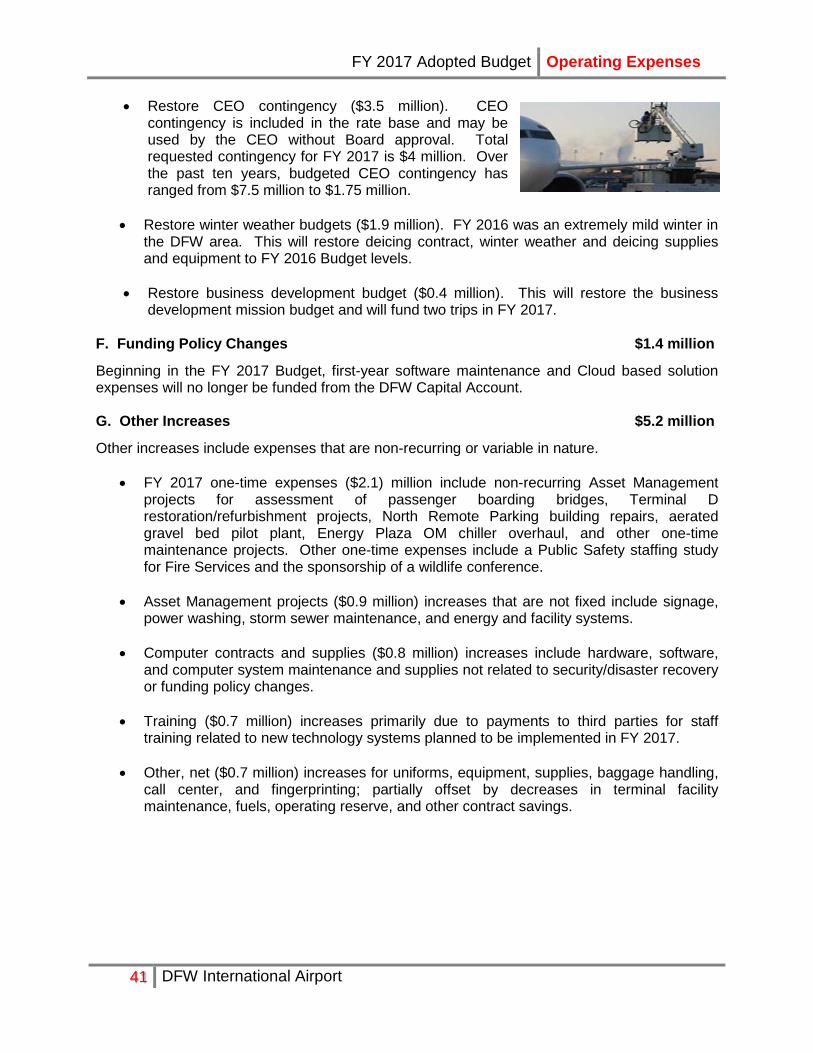
FY 2017 Adopted Budget Operating Expenses
41 DFW International Airport
• Restore CEO contingency ($3.5 million). CEO contingency is included in the rate base and may be used by the CEO without Board approval. Total requested contingency for FY 2017 is $4 million. Over the past ten years, budgeted CEO contingency has ranged from $7.5 million to $1.75 million.
• Restore winter weather budgets ($1.9 million). FY 2016 was an extremely mild winter in
the DFW area. This will restore deicing contract, winter weather and deicing supplies and equipment to FY 2016 Budget levels.
• Restore business development budget ($0.4 million). This will restore the business development mission budget and will fund two trips in FY 2017.
F. Funding Policy Changes $1.4 million Beginning in the FY 2017 Budget, first-year software maintenance and Cloud based solution expenses will no longer be funded from the DFW Capital Account. G. Other Increases $5.2 million Other increases include expenses that are non-recurring or variable in nature.
• FY 2017 one-time expenses ($2.1) million include non-recurring Asset Management
projects for assessment of passenger boarding bridges, Terminal D restoration/refurbishment projects, North Remote Parking building repairs, aerated gravel bed pilot plant, Energy Plaza OM chiller overhaul, and other one-time maintenance projects. Other one-time expenses include a Public Safety staffing study for Fire Services and the sponsorship of a wildlife conference.
• Asset Management projects ($0.9 million) increases that are not fixed include signage, power washing, storm sewer maintenance, and energy and facility systems.
• Computer contracts and supplies ($0.8 million) increases include hardware, software, and computer system maintenance and supplies not related to security/disaster recovery or funding policy changes.
• Training ($0.7 million) increases primarily due to payments to third parties for staff training related to new technology systems planned to be implemented in FY 2017.
• Other, net ($0.7 million) increases for uniforms, equipment, supplies, baggage handling, call center, and fingerprinting; partially offset by decreases in terminal facility maintenance, fuels, operating reserve, and other contract savings.
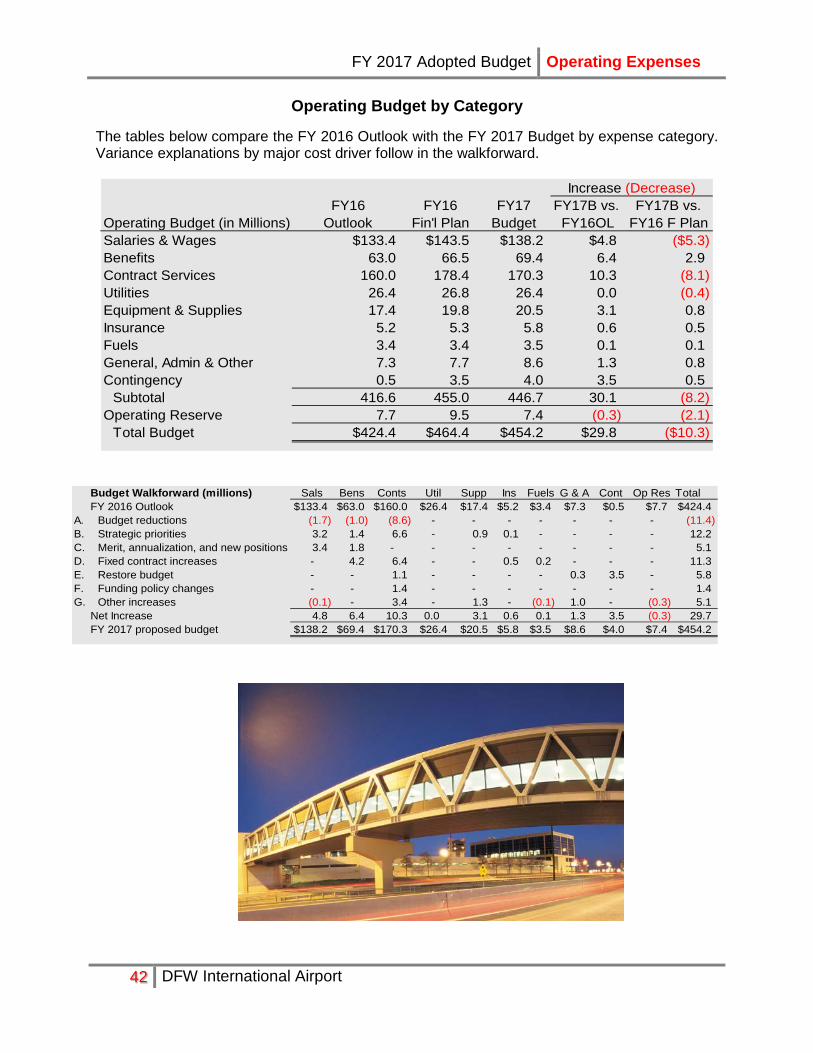
FY 2017 Adopted Budget Operating Expenses
42 DFW International Airport
Operating Budget by Category
The tables below compare the FY 2016 Outlook with the FY 2017 Budget by expense category. Variance explanations by major cost driver follow in the walkforward.
FY16 FY16 FY17 FY17B vs. FY17B vs.Operating Budget (in Millions) Outlook Fin'l Plan Budget FY16OL FY16 F PlanSalaries & Wages $133.4 $143.5 $138.2 $4.8 ($5.3)Benefits 63.0 66.5 69.4 6.4 2.9Contract Services 160.0 178.4 170.3 10.3 (8.1)Utilities 26.4 26.8 26.4 0.0 (0.4)Equipment & Supplies 17.4 19.8 20.5 3.1 0.8Insurance 5.2 5.3 5.8 0.6 0.5Fuels 3.4 3.4 3.5 0.1 0.1General, Admin & Other 7.3 7.7 8.6 1.3 0.8Contingency 0.5 3.5 4.0 3.5 0.5
Subtotal 416.6 455.0 446.7 30.1 (8.2)Operating Reserve 7.7 9.5 7.4 (0.3) (2.1)
Total Budget $424.4 $464.4 $454.2 $29.8 ($10.3)
Increase (Decrease)
Budget Walkforward (millions) Sals Bens Conts Util Supp Ins Fuels G & A Cont Op Res TotalFY 2016 Outlook $133.4 $63.0 $160.0 $26.4 $17.4 $5.2 $3.4 $7.3 $0.5 $7.7 $424.4
A. Budget reductions (1.7) (1.0) (8.6) - - - - - - - (11.4)B. Strategic priorities 3.2 1.4 6.6 - 0.9 0.1 - - - - 12.2C. Merit, annualization, and new positions 3.4 1.8 - - - - - - - - 5.1D. Fixed contract increases - 4.2 6.4 - - 0.5 0.2 - - - 11.3E. Restore budget - - 1.1 - - - - 0.3 3.5 - 5.8F. Funding policy changes - - 1.4 - - - - - - - 1.4G. Other increases (0.1) - 3.4 - 1.3 - (0.1) 1.0 - (0.3) 5.1
Net Increase 4.8 6.4 10.3 0.0 3.1 0.6 0.1 1.3 3.5 (0.3) 29.7FY 2017 proposed budget $138.2 $69.4 $170.3 $26.4 $20.5 $5.8 $3.5 $8.6 $4.0 $7.4 $454.2
FY 2017 Adopted Budget Operating Expenses
43 DFW International Airport
Salaries and Wages The FY 2017 salaries and wages budget is $138.2 million, a $4.8 million (3.6%) increase from the FY 2016 Outlook of $133.4 million due to a 3.0% merit pool and a 3.0% DPS STEP table increase ($3.0 million), new positions ($3.8 million), annualization of FY 2016 merit increase ($0.6 million), ITS reimbursable salaries savings ($1.7 million), deferral of vacant positions ($0.8 million) , and overtime reduction ($0.1 million). The hiring of new and vacant positions was staggered throughout FY 2017 based upon operational need and strategic priority. Benefits The FY 2017 benefits budget is $69.4 million, a $6.4 million (10.1%) increase from the FY 2016 Outlook of $63.0 million. This is the result of increase to defined contribution pension & OPEB ($4.2 million) due to the use of new mortality tables, benefits for new positions ($1.4 million), and annualization of vacant and new FY 2016 positions ($0.8 million). Contract Services The FY 2017 contract services budget is $170.3 million, a $10.3 million (6.4%) increase from the FY 2016 Outlook of $160.0 million due to restoring winter weather deicing contract to FY 2016 Budget ($0.9 million); increases in Customer Experience strategic initiatives for custodial contracts, an Information Zone programming study, wheelchair assistance, consultants, and Customs and Border Protection reimbursement ($5.2 million); employee busing contract for additional routes requested by American Airlines ($2.9 million); computer systems for security/disaster recovery, fixed and variable contracts for hardware, software and maintenance, first-year software maintenance, and cloud solutions ($6.2 million); FY 2017 one-time expenses for asset management projects, Public Safety Fire staffing study, and wildlife conference sponsorship ($2.1 million); asset management contracts for signage, power washing, storm sewer maintenance, and energy and facility systems ($0.9 million) reduced by FY 2016 one-time project savings ($3.2 million); contract labor savings ($1.8 million); Terminal Link busing contract savings ($0.8); planning projects savings ($0.8 million), security checkpoint augmentation costs savings ($0.8 million); and marketing and rebranding savings ($.06). Utilities The FY 2017 utilities budget is $26.4 million, no change from the FY 2016 Outlook of $26.4 million. Increases in electricity ($0.6 million) and sanitary sewer and solid waste ($0.2 million) were offset by decreases in water ($0.2 million), gas service ($0.1 million), and communications costs ($0.5 million). Equipment and Supplies The FY 2017 equipment and supplies budget is $20.5 million, a $3.1 million (17.8%) increase from the FY 2016 Outlook of $17.4 million primarily due to increases related to the winter weather ($1.0 million) for deicing, winter weather supplies and equipment, Customer Experience strategic initiative supplies ($0.9 million), computer equipment ($0.8 million), and general supplies and equipment ($0.7 million). Insurance The FY 2017 insurance budget is $5.8 million, a $0.6 million (11.5%) increase from the FY 2016 Outlook of $5.2 million primarily due to increased premiums based on claims experience and the value of DFW’s assets primarily due to TRIP improvements

FY 2017 Adopted Budget Operating Expenses
44 DFW International Airport
Fuels The FY 2017 fuels budget is $3.5 million, a $0.1 million (2.9%) increase from the FY 2016 Outlook of $3.4 million due to increased fuel utilization for incremental employee transportation requested by AA ($0.2 million) and a retroactive CNG fuel tax credit for 15 months in the FY 2016 Outlook versus 12 months in the FY 2017 Budget ($0.3 million); reduced by CNG/propane projected rate decreases of 28 cents per DGE ($0.4 million). The FY 2017 Budget assumes Congress extends the CNG tax credit beyond December 31, 2016. If Congress does not do so, fuel expense will increase by $0.5 million over the amount reflected in the FY 2017 Budget. General and Administrative (G&A) The FY 2017 general and administrative budget is $8.6 million, a $1.3 million (17.8%) increase from the FY 2016 Outlook of $7.3 million due to restoring business development related mission trips to FY 2016 budget levels ($0.4 million), staff training ($0.7 million) primarily related to new ITS systems, and other net increases ($0.2 million) such as fingerprinting, postage, and other miscellaneous administrative expenses. Contingency The FY 2017 Budget includes $4.0 million of contingency inside the rate base to be spent at the CEO’s discretion for projects and unforeseen events that come up during the fiscal year. The FY 2016 Budget included $3.5 million for contingency. Over the last ten years, the CEO contingency has ranged from $7.5 million to $1.75 million. In prior years, DFW has experienced extreme abnormal weather which was not included in the budget. This increase will allow for the support of incremental winter weather operations by the airlines and other unforeseen events and cover the risk that Congress will not extend the CNG fuel tax credit. Operating Reserve DFW is required to have a 90-day cash reserve for operating expenses. The FY 2017 operating reserve budget of $7.4 million is the amount necessary to fund the reserve.
Contingency Outside of Rate Base
Beginning in FY 2010, DFW began to add contingency outside of the rate base to the budget. This is done so that the airlines do not have to pay for the contingency during the year in the rate base, but provides management with flexibility should costs rise unexpectedly and an incentive to budget costs more accurately. This also allows management to make investments in the DFW cost center or to pursue marketing initiatives if incremental revenues are generated. Management must obtain Board of Directors’ approval prior to using this contingency. Contingency outside the rate base is recommended to be $10.0 million for FY 2017, consistent with the prior years.

FY 2017 Adopted Budget Operating Expenses
45 DFW International Airport
Net Debt Service Budget
The FY 2017 net debt service budget is $269.7 million, a $55.9 million (26.1%) increase from the FY 2016 Outlook and a $9.6 million (3.4%) decrease from the FY 2017 Financial Plan as shown in the table below.
Debt Service (in Millions)FY16
OutlookFY17
Fin'l PlanFY17
BudgetFY17B vs. FY16OL
FY17B vs. FY17FP
Debt Service and CoverageExisting Debt Service $242.0 $249.2 $247.2 $5.2 ($2.0)New Debt Service1 102.2 161.4 153.4 51.2 (8.0)PFIC Related Debt Service2 18.4 18.5 18.5 0.1 (0.0)DFWCA Debt Service3 7.3 11.3 11.3 4.0 0.0Less Interest Income (0.0) 0.0 0.0 0.0 0.0
Gross Debt Service and Coverage $369.9 $440.4 $430.4 $60.5 ($10.0)Offsets to Debt Service
PFCs for Pre-TRIP Debt Service $130.4 $131.3 $131.0 $0.5 ($0.3)PFIC Transfers2 18.4 18.5 18.5 0.1 (0.0)DFWCA Transfers3 7.3 11.3 11.3 4.0 0.0
Total Offsets 156.1 161.1 160.7 4.6 (0.4)Net Debt Service Paid by Rate Base $213.8 $279.2 $269.7 $55.9 ($9.6)
1Shown net of Capitalized Interest2RAC, Grand Hyatt Hotel, and Hyatt Place Hotel infrastructure3Consolidated Headquarters and Terminal E Garage
Increase (Decrease)
The Net Debt Service increase of $55.9 million over the FY 2016 Outlook is primarily due to the increase in New Debt Service. Existing Debt Service is scheduled to gradually increase through FY 2017 as agreed upon in the Use Agreement. Passenger Facility Charges (PFCs) are collected from revenue enplaned passengers and are used to offset debt service from debt issued prior to TRIP. In FY 2016, DFW established a budget practice to maintain a 2 month reserve of PFCs at the end of each fiscal year. It is projected that DFW will have an excess balance of approximately $9 million at the end of FY 2016 that could be applied to the rate base in FY 2017. Per the Use Agreement, PFCs are used to pay pre-TRIP debt service. If applied, this would reduce net debt service charged to the Airline and DFW Cost Centers, lower Airline Cost, and increase DFWCC Net Revenues. This excess was generated primarily because AA accelerated its PFC reimbursement to DFW from two months to one resulting in an extra month collections in the last year. It is not clear if AA will continue this practice; accordingly, the use of incremental PFCs is not included in this budget.
The increase in New Debt Service is a result of completion of capital projects in FY 2016 and FY 2017. New Debt Service is not PFC eligible. Additionally, DFW will issue $282 million of bonds later this summer that will include principal repayment of $25 million in FY 2017 (plus $6 million of coverage).

FY 2017 Adopted Budget Operating Expenses
46 DFW International Airport
Public Facility Improvement Corporation (PFIC) debt service relates to debt associated with the RAC, Grand Hyatt Hotel, and Hyatt Place Hotel infrastructure. This debt service is funded from the PFIC so that the debt service does not impact the rate base. Similarly, DFW Capital Account Debt Service is related to the consolidated headquarters and Terminal E garage. This is funded with transfers from the DFW Capital Account so it does not impact the rate base.

FY 2017 Adopted Budget Operating Expenses
47 DFW International Airport
Positions The table below summarizes the total number of operating and capital positions assumed in the FY 2017 Budget. Operating positions are paid out of the 102 Fund. Salaries and benefits of capital positions are capitalized and paid from the capital accounts. A summary of positions by department is included at the end of the Department section.
FY 2016 Budget
FY 2016 Changes*
FY 2016 Adjusted Budget
FY 2017 New
positionsFY 2017 Attrition
FY 2017 Budget
Operating 1,872 39 1,911 115 (5) 2,021
Capital 112 1 113 7 0 120
Total 1,984 40 2,024 122 (5) 2,141
* FY 2016 Changes include 6 positions added in FY 2015 after the FY 2016 Budget was approved, 3 ITS positions eliminated through attrition, 1 capital position that was omitted from the FY 2016 Budget Book headcount in error, and 36 new positions, primarily related to conversion of contractors to employees, a departmental reorganization, and security related functions.
One hundred seventeen net new positions have been added for FY 2017, 110 positions are 102 funded and seven positions are capital funded. This is comprised of one hundred twenty-two new positions and the reduction of five ITS positions through assumed attrition during FY 2017. Forty-two new permanent positions are replacing temporary staff in the Access Control Office, Airport Customer Experience (ACE) program, and curbside assistance.
Position Summary by Division
FY 2016
DivisionAdjusted Budget* Transfers Changes Budget**
Administration & Diversity 125 0 6 131CFO, Airline Business and Technology 241 (1) (5) 235Revenue Management 433 0 26 459Operations 755 0 69 824Global Strategy & Development 19 0 0 19Airport Development and Planning 421 1 21 443Legal 3 0 0 3Audit Services 15 0 0 15Executive Office 12 0 0 12Total DFW 2,024 0 117 2,141
** Includes 122 new positions reduced by 5 current positions that are assumed to be vacant by the end of FY 2017.
FY 2017
* Includes 40 positions not included in the FY 2016 Budget - 6 positions added in FY 2015 after the FY 2016 Budget was approved, 3 ITS positions eliminated through attrition, 1 capital position that was omitted from the FY 2016 Budget Book headcount in error, and 36 new FY 2016 positions.

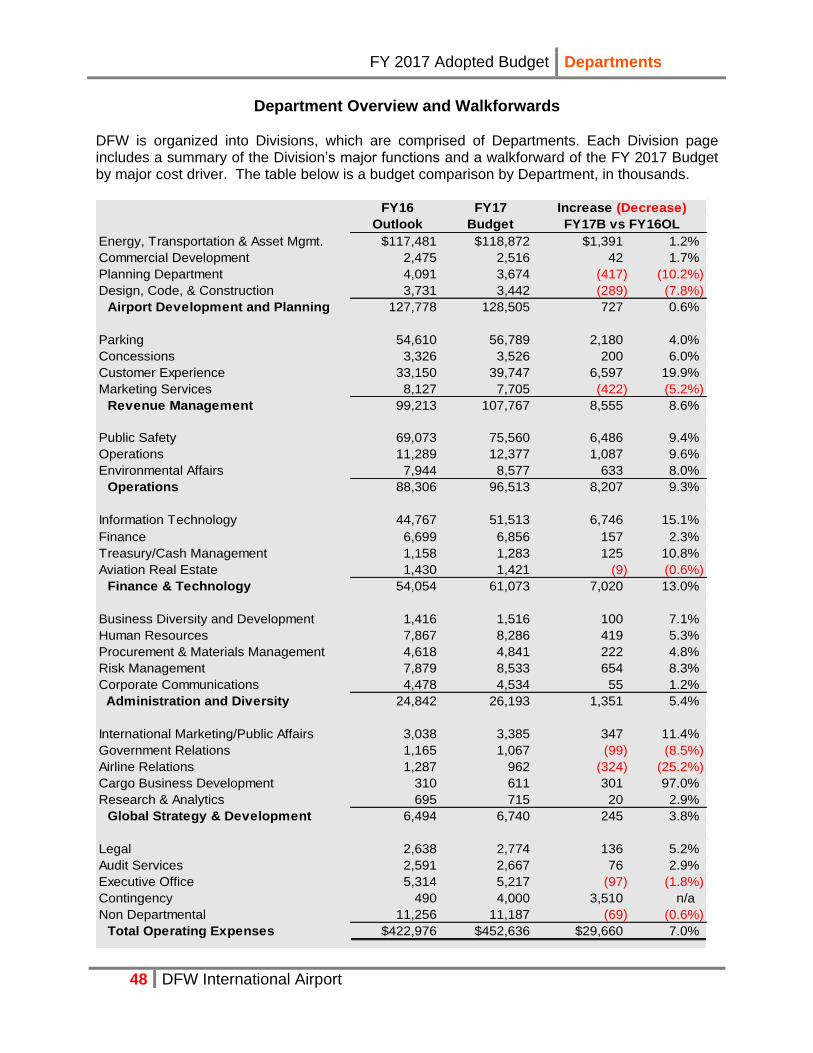
FY 2017 Adopted Budget Departments
48 DFW International Airport
Department Overview and Walkforwards
DFW is organized into Divisions, which are comprised of Departments. Each Division page includes a summary of the Division’s major functions and a walkforward of the FY 2017 Budget by major cost driver. The table below is a budget comparison by Department, in thousands.
FY16 FY17
Outlook Budget
Energy, Transportation & Asset Mgmt. $117,481 $118,872 $1,391 1.2%
Commercial Development 2,475 2,516 42 1.7%
Planning Department 4,091 3,674 (417) (10.2%)
Design, Code, & Construction 3,731 3,442 (289) (7.8%)
Airport Development and Planning 127,778 128,505 727 0.6%
Parking 54,610 56,789 2,180 4.0%
Concessions 3,326 3,526 200 6.0%
Customer Experience 33,150 39,747 6,597 19.9%
Marketing Services 8,127 7,705 (422) (5.2%)
Revenue Management 99,213 107,767 8,555 8.6%
Public Safety 69,073 75,560 6,486 9.4%
Operations 11,289 12,377 1,087 9.6%
Environmental Affairs 7,944 8,577 633 8.0%
Operations 88,306 96,513 8,207 9.3%
Information Technology 44,767 51,513 6,746 15.1%
Finance 6,699 6,856 157 2.3%
Treasury/Cash Management 1,158 1,283 125 10.8%
Aviation Real Estate 1,430 1,421 (9) (0.6%)
Finance & Technology 54,054 61,073 7,020 13.0%
Business Diversity and Development 1,416 1,516 100 7.1%
Human Resources 7,867 8,286 419 5.3%
Procurement & Materials Management 4,618 4,841 222 4.8%
Risk Management 7,879 8,533 654 8.3%
Corporate Communications 4,478 4,534 55 1.2%
Administration and Diversity 24,842 26,193 1,351 5.4%
International Marketing/Public Affairs 3,038 3,385 347 11.4%
Government Relations 1,165 1,067 (99) (8.5%)
Airline Relations 1,287 962 (324) (25.2%)
Cargo Business Development 310 611 301 97.0%
Research & Analytics 695 715 20 2.9%
Global Strategy & Development 6,494 6,740 245 3.8%
Legal 2,638 2,774 136 5.2%
Audit Services 2,591 2,667 76 2.9%
Executive Office 5,314 5,217 (97) (1.8%)
Contingency 490 4,000 3,510 n/a
Non Departmental 11,256 11,187 (69) (0.6%)
Total Operating Expenses $422,976 $452,636 $29,660 7.0%
FY17B vs FY16OL
Increase (Decrease)

FY 2017 Adopted Budget Departments
49 DFW International Airport
Expense Budget Walkforward
Budget Category (in Millions) Total DFW Airline
FY 2016 Outlook $424.4 $163.5 $260.9
A. Budget reductions (11.4) (4.1) (7.3)
B. Strategic Priorities
Customer Experience
Custodial 4.5 0.2 4.3
Passenger services 0.8 0.0 0.8
Information Zone programming study 0.5 0.0 0.5
Other customer experience enhancements 1.4 0.0 1.4
Total Customer Experience 7.2 0.2 7.0
Safe and Secure
DPS security 3.2 0.6 2.7
ITS security/disaster recovery 1.8 0.7 1.1
Total Safe and Secure 5.0 1.2 3.8
Total Strategic Priorities 12.2 1.4 10.8
C. Merit, annualization, and new positions
Merit 3.0 1.1 1.9
Annualization 1.1 0.5 0.7
New positions 1.0 0.6 0.4
Total Merit, annualization, and new positions 5.2 2.2 3.0
D. Fixed contract increases
Defined contribution pension & OPEB 4.2 1.7 2.5
Employee busing 3.1 3.1 0.0
ITS contracts 2.7 1.2 1.5
Facility maintenance 0.8 0.3 0.5
Insurance premiums 0.5 0.2 0.3
Total Fixed Increases 11.3 6.5 4.8
E. Restore Budget
Contingency 3.5 1.2 2.3
Winter weather 1.9 0.1 1.8
Business Development 0.4 0.0 0.4
Total Restore Budget 5.8 1.3 4.5
F. Funding Policy Changes
First-year software maintenance 1.1 0.4 0.7
Cloud solutions 0.3 0.1 0.2
Total Funding Policy Changes 1.4 0.5 0.9
G. Other increases
FY17 one-time expenses 2.1 0.4 1.7
Asset management projects 0.9 0.0 0.8
Computer contracts 0.8 0.4 0.4
Training 0.7 (0.0) 0.7
Terminal contribution, cost center shift 0.0 (2.2) 2.2
Other, net 0.7 (0.2) 0.9
Total Other increases 5.2 (1.5) 6.7
Net increase 29.8 6.3 23.5
FY 2017 Budget $454.2 $169.8 $284.3
Note: The reference letters in the previous table are cross-referenced to the variance explanations in the following budget comparison and walkforward tables in this section.

FY 2017 Adopted Budget Departments
50 DFW International Airport
Airport Development & Planning Division
Energy, Transportation and Asset Management (ETAM) ETAM manages the operation, maintenance, repair and renewal of DFW’s infrastructure asset portfolio including energy & utility systems, passenger terminals, facilities, airfield, public works, vehicle fleet and the Skylink automated transit system.
Commercial Development The Commercial Development Department plans, develops, markets and leases aviation-related industrial/warehouse, cargo/distribution facilities, mixed-use office, retail and hospitality spaces and available land at DFW. Commercial Development also evaluates and implements business opportunities that diversify DFW’s revenue stream such as the exploration and production of natural gas, the Bear Creek Golf Course, management of Foreign Trade Zones and negotiations of ROW for highway, utilities and passenger rail. Planning Planning plays an integral role in defining Airport development initiatives to ensure complete, comprehensive and sustainable solutions. Planning provides analysis and assessment of conditions that affect the Airport’s layout, operations, development and facilities in support of the Airport’s strategic plan. The department is structured to focus on; Airside, Facilities, Land Use, Signage, Strategic and Surface Transportation Planning, with a primary focus on establishing and maintaining compliance with the airport’s short-term and long-term vision.
Design, Code and Construction (DCC) Design, Code and Construction (DCC) has overall responsibility for the efficient, economical delivery of design and construction of capital and O&M funded developments, improvements, and major rehabilitation projects at DFW. DCC also provides technical support services and/or personnel to other DFW departments as needed to fulfill DFW’s mission. With the exception of uncapitalized projects and Code Compliance activities related to third party building permits, all costs are funded by the capital funds.

FY 2017 Adopted Budget Departments
51 DFW International Airport
Budget Comparison and Walkforward
FY16 FY17
Outlook Budget
Energy, Transportation & Asset Mgmt. $117,481 $118,872
Commercial Development 2,475 2,516
Planning Department 4,091 3,674
Design, Code, and Construction 3,731 3,442
Total Airport Development Division $127,778 $128,505
Salaries & Wages $21,343 $21,204
Benefits 10,159 10,970
Contract Services 64,008 62,699
Equipment & Supplies 10,426 11,378
Insurance 0 0
Utilities 21,359 21,776
Administrative 483 478
Total Airport Development Division $127,778 $128,505
Walkforward from FY 2016 Outlook Reference
FY 2016 Outlook $127,778
Salaries and Wages (139) C
Benefits 811 A, C, D
Contract Services (1,309) A,D,E,G
Equipment & Supplies 952 E, G
Utilities 417
Administrative (5)
Total FY 2017 Proposed Budget $128,505
Airport Development and Planning Division
(in thousands)

FY 2017 Adopted Budget Departments
52 DFW International Airport
Revenue Management Division
Parking Operations Parking Operations consists of Operations, Customer Relations, Ground Transportation Service, and Busing. Parking Operations is responsible for parking products, pricing, service delivery and reporting, handling customer feedback, monitoring electronic parking transactions, billing, and providing transportation services to DFW Remote Lots, Trinity Railway Express, Terminal Link, Express Parking and the Employee Shuttle. Concessions
The Concessions Department provides the public with high quality goods and services that are competitively priced, conveniently located, and reflects the needs and desires of the traveling public with the goal of exceeding customer expectations while maximizing revenue for the DFW Airport. This includes all of the passenger-related concessions and associated revenues within the airport terminals, Rental Car Center (RAC), telecommunications, and selected properties outside the terminals.
Customer Experience
The Customer Experience Department drives the day to day operation within the Terminals, ultimately aiming to provide all customers an elevated experience in a clean, working and friendly environment. It consists of the following three sections:
Service Delivery – focuses on frontline staff including managing the custodial function, as well as, services provided by all business partners, based on agreed service standards which are measured and reported throughout the day.
Experience Development – ensures each day is planned from a customer experience perspective, and there is a regular review function to ensure continuous improvement. This includes innovations and improvements proactively designed and implemented to drive overall Customer Experience excellence, and Terminal Managers to drive customer experience performance through stakeholder management, with a focus on relationship management.
Customer Relations – provides a suite of products and services to streamline DFW’s customer services to engage with customers to deliver moments of WOW. This includes the Ambassador Volunteer Program and Meet & Greet services.
Marketing Services
Marketing Services is responsible for increasing awareness of and loyalty for DFW’s products and services in order to drive increased revenue and customer satisfaction, and ensuring that a consistent and enhanced brand image is portrayed to every one of DFW’s audiences. The Department is also responsible for conducting primary and secondary consumer research to address the needs of our customers, as well as, opportunities facing DFW Airport in order to enhance the customer's experience at every stage of his/her visit.
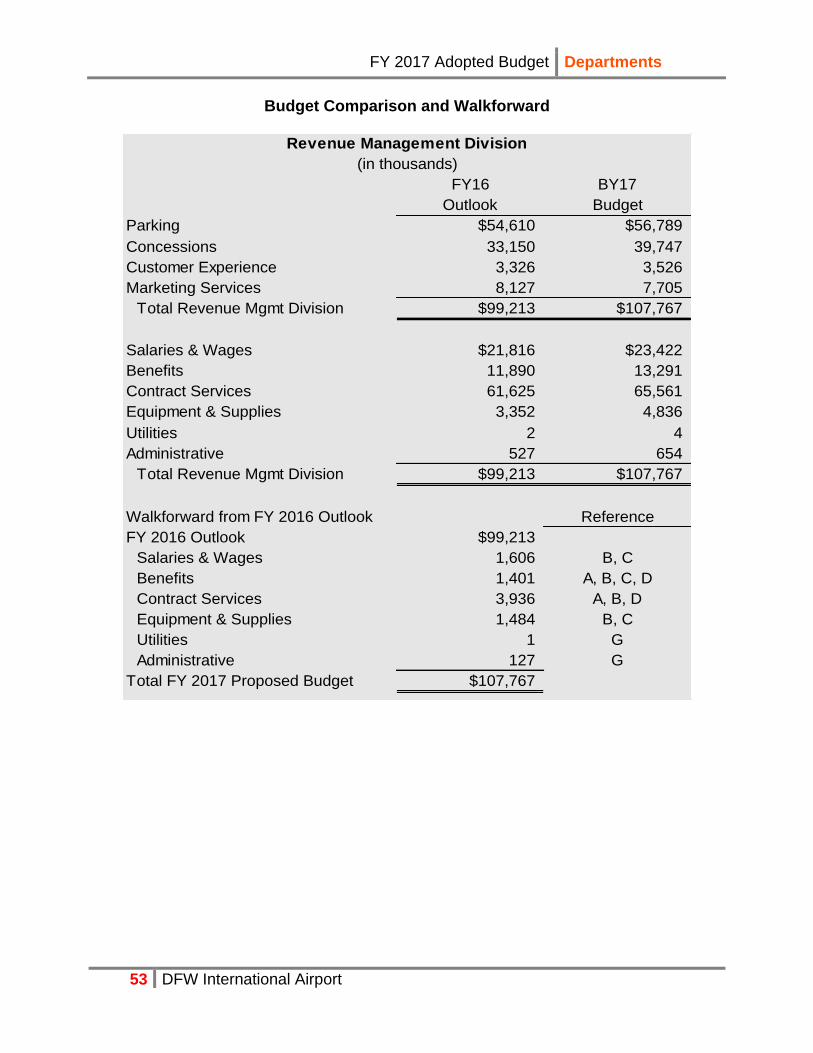
FY 2017 Adopted Budget Departments
53 DFW International Airport
Budget Comparison and Walkforward
FY16 BY17
Outlook Budget
Parking $54,610 $56,789
Concessions 33,150 39,747
Customer Experience 3,326 3,526
Marketing Services 8,127 7,705
Total Revenue Mgmt Division $99,213 $107,767
Salaries & Wages $21,816 $23,422
Benefits 11,890 13,291
Contract Services 61,625 65,561
Equipment & Supplies 3,352 4,836
Utilities 2 4
Administrative 527 654
Total Revenue Mgmt Division $99,213 $107,767
Walkforward from FY 2016 Outlook Reference
FY 2016 Outlook $99,213
Salaries & Wages 1,606 B, C
Benefits 1,401 A, B, C, D
Contract Services 3,936 A, B, D
Equipment & Supplies 1,484 B, C
Utilities 1 G
Administrative 127 G
Total FY 2017 Proposed Budget $107,767
Revenue Management Division
(in thousands)
FY 2017 Adopted Budget Departments
54 DFW International Airport
Operations Division
Public Safety (DPS)
It is the mission of the DFW Airport Department of Public Safety to provide the highest level of professional services to the Airport community through efficient planning, mitigation, response, and recovery from natural and manmade events that threaten lives, critical assets, or business continuity. Public Safety carries out this mission through three divisions of Police, Fire, and Security and Emergency Management. Operations The Airport Operations Department is responsible for managing and directing the landside and airside operations of the Airport, to include Airfield Operations, the Airport Operations Center, Corporate Aviation, Terminals D&E Towers and associated ramp management, Wildlife Management, Safety Management Systems (SMS), and Technical and Simulated Training. Environmental Affairs
DFW has committed to achieving environmental excellence by embedding the principles of sustainability throughout the corporate culture of the organization and by establishing environmental compliance as a priority in achieving sustainable economic growth. DFW’s Environmental Affairs Department (EAD) implements a comprehensive environmental program by providing regulatory and technical guidance to DFW departments, tenants, and contractors, which ensures that airport activities and operations are conducted in a manner that conforms to various environmental laws, policies and requirements regulated by the Environmental Protection Agency, the Texas Commission on Environmental Quality, the Texas State Department of Health, the Federal Aviation Administration, and local governments. The comprehensive Environmental Management System (EMS) covers five major programs (Water Resources, Waste, Environmental Planning & Development, Environmental Design & instruction, and Sustainability) that house a subset of 21 core, compliance-based programs.

FY 2017 Adopted Budget Departments
55 DFW International Airport
Budget Comparison and Walkforward
FY16 FY17
Outlook Budget
Public Safety $69,073 $75,560
Operations 11,289 12,377
Environmental Affairs 7,944 8,577
Total Operations Division $88,306 $96,513
Salaries & Wages $52,594 $55,615
Benefits 24,509 28,044
Contract Services 6,135 7,018
Equipment & Supplies 2,768 2,904
Insurance 0 0
Utilities 1,534 1,623
Administrative 766 1,310
Total Operations Division $88,306 $96,513
Walkforward from FY 2016 Outlook Reference
FY 2016 Outlook $88,306
Salaries and Wages 3,021 B, C
Benefits 3,535 A, B, C, D
Contract Services 883 G
Equipment & Supplies 136 G
Utilities 88 G
Administrative 544 G
Total Proposed FY 2017 Budget $96,513
Operations Division
(in thousands)
FY 2017 Adopted Budget Departments
56 DFW International Airport
Finance and Technology Division
Information Technology
Information Technology Services (ITS) is responsible for supporting the technical needs of the DFW Airport community by providing reliable systems, proactively responding to issues, and implementing a wide range of viable technologies that represent meaningful choices in terms of cost and functionality. ITS is currently divided into 8 functional sections:
The Technology Lab is responsible for future innovation and the research, development, and piloting of new technologies at the Airport.
Customer Support manages the Help Desk, Field Technicians, and the frontline ITS Business Consultants.
IT Programs is responsible for long running technology programs like Disaster Recovery, Asset Management, and Training.
The IT Project Management Office manages new initiatives and projects to a successful completion.
Development and Delivery is responsible for the software development and implementation of executive decision support systems, records management, CADD/GIS, web development, and the implementation of work-flow technologies.
Enterprise Systems is responsible for the support and maintenance of the entire DFW Software Portfolio.
Infrastructure Operations is responsible for the maintenance and administration of the voice and data communications infrastructure, desktop and server computing environments, databases, storage, and Terminal syst
Technology Security is responsible for the management and compliance of DFW's security programs and the analysis, management, and monitoring of the perimeter security devices.
Finance Finance is comprised of 3 groups: Accounting, Financial Planning, and Capital Planning & Accounting. Accounting is responsible for financial reporting, general ledger accounting, internal controls, revenue collections, accounts payable, accounts receivable, payroll, and fixed assets. Financial Planning is responsible for developing and monitoring DFW’s Operating Budget and Outlook for revenues and expenses. This group is also responsible for establishing DFW’s rates, fees and charges, and performing departmental financial analysis. In addition, Financial Planning analyzes DFW’s business units to determine profitability, implementation of activity based costing, project analysis, process improvement and management methodologies for proper allocations of revenues and expenses. Capital Planning and Accounting are responsible for developing and monitoring DFW’s Capital Budget and forecast. Treasury/Cash Management
Treasury/Cash Management is responsible for providing strategic financial management for the Airport. This includes overseeing debt issuance/management, cash management, banking relations, DFW investments, retirement fund investments, and grants and PFC administration.

FY 2017 Adopted Budget Departments
57 DFW International Airport
Aviation Real Estate Aviation Real Estate serves as the liaison between the Airport and the tenants of all passenger terminals and aviation-related facilities, including air cargo and hangars. Through permits and leases, Aviation Real Estate manages the contractual relationship with the tenants. The department is also responsible for aviation facilities’ strategic planning, with the goal of maximizing efficiency within the terminals and other aviation facilities.
Budget Comparison and Walkforward
FY16 FY17
Outlook Budget
Information Technology $44,767 $51,513
Finance 6,699 6,856
Treasury/Cash Management 1,158 1,283
Aviation Real Estate 1,430 1,421
Total CFO Division $54,054 $61,073
Salaries & Wages $19,329 $18,728
Benefits 8,333 8,761
Contract Services 18,520 25,379
Equipment & Supplies 3,574 4,217
Utilities 3,517 3,043
Administrative 781 945
Total Finance & Technology Division $54,054 $61,073
Walkforward from FY 2016 Outlook Reference
FY 2016 Outlook $54,054
Salaries and Wages (602) A, B, C,
Benefits 429 A, B, C, D,
Contract Services 6,859 B, D, F, G
Equipment & Supplies 643 G
Utilities (473) G
Administrative 164 G
Total FY 2017 Proposed Budget $61,073
Finance & Technology
(in thousands)

FY 2017 Adopted Budget Departments
58 DFW International Airport
Administration and Diversity Division
Business Diversity and Development The Business Diversity & Development Department (BDDD) is responsible for administering the Board’s Disadvantaged, Small, Minority, and Women-owned Business Enterprise Programs. BDDD has the overall responsibility to administer, monitor and enforce the policies and procedures associated with the Programs and engage the diverse business community with airport contracting opportunities. Human Resources
The Human Resources (HR) Department at DFW partners with line managers to identify, hire, train, and provide ongoing coaching and support to the employees. Specific functional areas of focus for HR include talent acquisition, talent development, diversity and inclusion, employee records and information, employee relations, compensation, benefits, and employee health and wellness. The department supports these functions through policy development and revision (where appropriate), extensive training (both online and in-person), and through one-on-one coaching with leaders, where appropriate. Procurement & Materials Management Procurement & Materials Management (PMM) provides DFW-wide centralized procurement, materials management, and reprographic services. PMM manages professional services contracts/procurements and P-card program, and prepares Official Board Actions (OBAs) for Board meetings. The Central Warehouse provides central receipt, financial and physical management of inventory, management of excess and obsolete property, and provides DFW-wide mail service. Print Services provides centralized reproduction, printing, and binding services for departments within the Airport. Risk Management Risk Management identifies, analyzes and evaluates exposures, intervenes with loss prevention measures that reduce costs, and ensures compliance with applicable laws and regulations and DFW Board Policies. Areas of general administration include claims management, safety training, management of self-funded, fully insured, and partial claims programs involving property and casualty liability, general liability, errors and omissions, employment liability, fiduciary/fidelity exposures, contractual review/interpretation, breach of contract, auto liability, driver safety and workers’ compensation liability. Corporate Communications The Corporate Communications Department is responsible for elevating the reputation of DFW Airport. In this role, the Department will provide DFW Airport’s collective voice through communications, outreach, engagement and collaboration to support the Airport in achieving its business objectives. The Department is responsible for delivering impactful and results-oriented communications and creating advocacy among the audiences it serves. Corporate Communications consists of day-to-day media relations, social media, community engagement, business communications, Board and Owner city relations, and internal communications.

FY 2017 Adopted Budget Departments
59 DFW International Airport
Budget Comparison and Walkforward
FY16 FY17
Outlook Budget
Business Diversity and Development 1,416 1,516
Human Resources 7,867 8,286
Procurement & Materials Management 4,618 4,841
Risk Management 7,879 8,533
Corporate Communications 4,478 4,534
Total Admin & Diversity Division $24,842 $26,193
Salaries & Wages $9,301 $9,613
Benefits 5,059 5,343
Contract Services 3,869 3,868
Equipment & Supplies 631 633
Insurance 5,203 5,765
Utilities 0 0
Administrative 2,196 2,487
Total Admin & Diversity Division $26,258 $27,709
Walkforward from FY 2016 Outlook Reference
FY 2016 Outlook $26,258
Salaries and Wages 311 C,
Benefits 285 A, C, D
Contract Services (1) G
Equipment & Supplies 2 G
Insurance 563 B, D
Administrative 291 G
Total FY 2017 Proposed Budget $27,709
Administration and Diversity Division
(in thousands)

FY 2017 Adopted Budget Departments
60 DFW International Airport
Global Strategy and Development Division
International Marketing and Public Relations International Marketing and Public Relations is responsible for developing and executing DFW’s international communications strategy to drive airline and cargo business development and customer retention for international audiences, this department also ensures a consistent brand image, manages media relations, and leads international trade missions with Dallas Fort Worth stakeholders and businesses.
Government Relations The Government Relations area directs the government affairs function at the airport; provides strategic expertise to airport staff and board members related to state and federal governmental issues; and serves as a point of contact for congressional and legislative representatives and staff, and state and federal agencies. The work involves monitoring and interpreting legislative and regulatory action at all levels, keeping executive staff informed of impact to DFW Airport and/or the aviation industry, and leading the Airport’s educational and advocacy advocates to state and federal government entities. Airline Relations Works to create an airport business environment where airline partners stay, succeed and grow. The primary business goal is to position DFW as the airport of choice for passenger and cargo services. The Airline Relations group has two essential purposes: Retention, which focuses on the growth of existing carriers and New Business that focuses on developing new airline business. Airline Relations as a group focuses on strengthening relationships with the airlines’ Network, Sales, and Commercial departments and formulates strategies to increase airline services. We also monitor traffic trends, work to increases less than daily services, expand the use and utilization of the Customer Relations Management System and record relationship activities using Sales force.com to monitor and improve overall airport service experience. Cargo Business Development
The recently-created Cargo Business Development group oversees and coordinates DFW’s multi-departmental effort to develop and execute the airport’s cargo and logistics strategy, and the pursuit of new revenue-generating business opportunities. This group seeks to shift the airport’s cargo business development efforts from a historical focus on airlines that supply cargo capacity, and instead concentrate DFW’s efforts on persuading key decision-makers among freight forwarders, logistics companies, customs brokers, and shippers who can drive cargo traffic itself to and through the airport (i.e., a “demand side” business development approach).
Research and Analytics
The role of the Research & Analytics group is to grow DFW’s global brand through a targeted focus on KPIs, powered by advanced research and analytics. The group is responsible for providing actionable intelligence to support both internal and external customers. This includes supporting the growth of new air service by developing sophisticated quantitative and qualitative business cases to pitch new air service to target airlines.

FY 2017 Adopted Budget Departments
61 DFW International Airport
Budget Comparison and Walkforward
FY16 FY17
Outlook Budget
International Marketing/Public Affairs $3,038 $3,385
Government Relations 1,165 1,067
Airline Relations 1,287 962
Cargo Business Development 310 611
Research & Analytics 695 715
Total Global Strategy Division $6,494 $6,740
Salaries & Wages $1,723 $1,638
Benefits 555 575
Contract Services 2,592 2,736
Equipment & Supplies 46 47
Insurance 0 0
Utilities 0 0
Administrative 1,578 1,744
Total Global Strategy Division $6,494 $6,740
Walkforward from FY 2016 Outlook Reference
FY 2016 Outlook $6,494
Salaries and Wages (85) C
Benefits 20 A, C, D
Contract Services 143 E
Equipment & Supplies 0 G
Administrative 167 E, G
Total FY 2017 Proposed Budget $6,740
Global Strategy & Development
(in thousands)

FY 2017 Adopted Budget Departments
62 DFW International Airport
Legal The Legal Department is responsible for providing advice and counsel to the Airport Board and Staff and for overseeing the prosecution and defense of litigation involving DFW Airport. Legal Department attorneys are provided by the Dallas and Fort Worth City Attorney’s Offices in accordance with the 1968 Contract and Agreement.
Budget Comparison and Walkforward
FY16 FY17
Outlook Budget
Salaries & Wages $210 $217
Benefits 113 119
Contract Services 2,155 2,376
Equipment & Supplies 7 7
Insurance 0 0
Utilities 0 0
Administrative 78 56
Total Legal $2,563 $2,774
Walkforward from 2016 Outlook Reference
FY 2016 Outlook $2,563
Salaries & Wages 7 C
Benefits 5 A. C, D
Contract Services 220 G
Administrative (22) G
Total FY 2017 Proposed Budget $2,774
Legal
(in thousands)

FY 2017 Adopted Budget Departments
63 DFW International Airport
Audit Services The Department of Audit Services is an independent appraisal function that reviews and evaluates DFW activities as a service to the Board of Directors and management. The Department of Audit Services reports directly to the Board of Directors through the Finance/Audit Committee. The Department performs work contributing to the safeguarding of assets; economical and efficient use of resources; accomplishment of established objectives and goals; compliance with laws, regulations, and DFW policies; and the reliability and integrity of information used by decision-makers.
Budget Comparison and Walkforward
FY16 FY17
Outlook Budget
Salaries & Wages $1,534 $1,568
Benefits 664 691
Contract Services 325 338
Equipment & Supplies 20 21
Insurance 0 0
Utilities 0 0
Administrative 47 49
Total Audit Services $2,591 $2,667
Walkforward from 2016 Outlook Reference
FY 2016 Outlook $2,591
Salaries & Wages 34 C
Benefits 27 A, C, D
Contract Services 13 G
Equipment & Supplies 1 G
Administrative 1 G
Total FY 2017 Proposed Budget $2,667
Audit Services
(in thousands)

FY 2017 Adopted Budget Departments
64 DFW International Airport
Executive Office The Chief Executive Officer, as the chief administrator and executive officer of the DFW Airport Board, recommends policies to the Board of Directors for the planning, constructing, maintaining, operating and regulating of DFW. The Chief Executive Officer, along with the Executive Staff (6 Executive Vice Presidents and support staff), oversees the implementation of adopted policies and is responsible for conducting monthly and special meetings with the Board of Directors. This budget also includes salaries and wages of support staff for the CEO and Executive Staff and the CEO Contingency.
Budget Comparison and Walkforward
FY16 FY17
Outlook Budget
Salaries & Wages $2,672 $2,790
Benefits 1,086 1,193
Contract Services 679 339
Equipment & Supplies 22 20
Administrative 856 875
CEO Contingency 490 4,000
Total Executive Office $5,804 $9,217
Walkforward from 2016 Outlook Reference
FY 2016 Outlook $5,804
Salaries & Wages 118 C
Benefits 107 A, C, D
Contract Services (340) A
Equipment & Supplies (1) G
Administrative 20 G
CEO Contingency 3,510 E
Total FY 2017 Proposed Budget $9,217
Executive Office
(in thousands)

FY 2017 Adopted Budget Departments
65 DFW International Airport
Airport Non-Departmental The Airport Non-Departmental budget reflects the change in operating reserve, payroll accruals, incentive compensation, affordable health care act fees, supplemental retirement, and any other expenses that are recognized at a Board-wide, rather than a departmental, level. These include Outlook adjustments made at a high level, medical insurance claims stop loss reimbursement, and medical claim overruns.
Budget Comparison and Walkforward
FY16 FY17
Outlook Budget
Salaries & Wages $2,856 $3,383
Benefits 649 393
Contract Services 1 1
Equipment & Supplies 0 0
Insurance 0 0
Utilities 0 0
Administrative (0) 0
Operating Reserve 7,749 7,409
Total Non-Departmental $11,256 $11,187
Walkforward from 2016 Outlook Reference
FY 2016 Outlook $11,256
Salaries & Wages 527 Management Incentive
Benefits (255) Benefit adjustmens made in Outlook and LHD over/under
Contract Services 0
Equipment & Supplies 0
Administrative 0
Operating Reserve (340) Operating Reserve requirement decrease
Total FY 2017 Proposed Budget $11,187
Airport Non-Departmental
(in thousands)
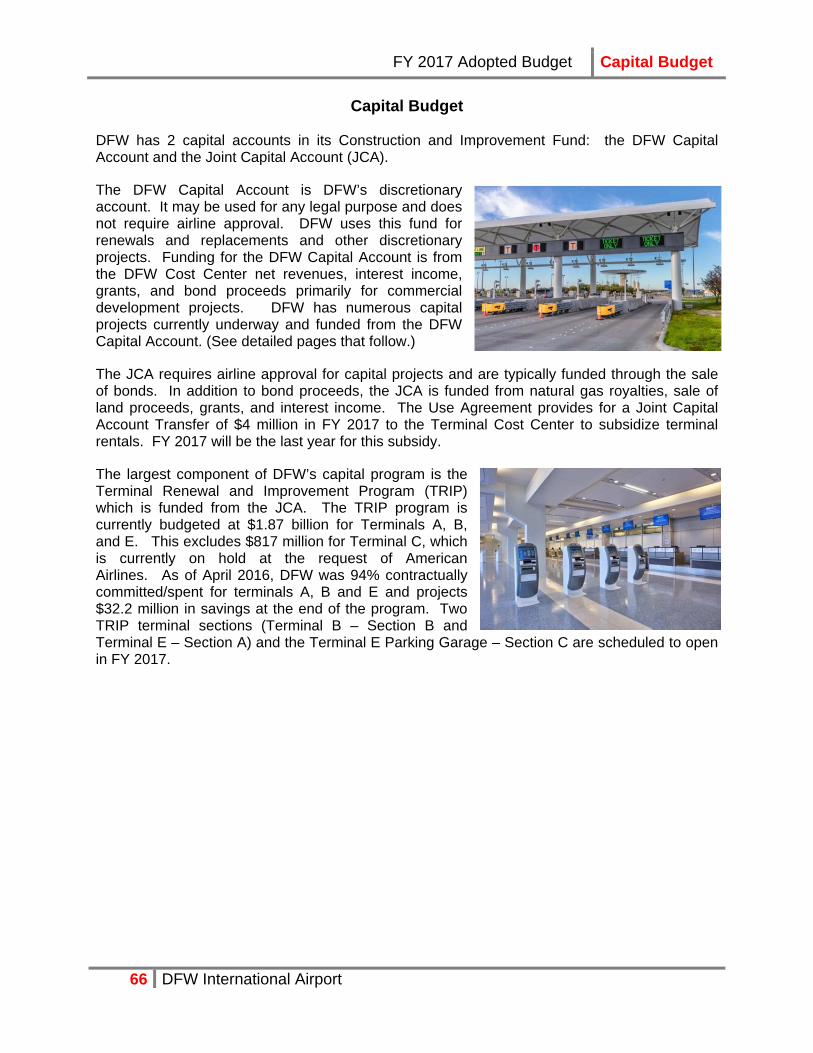
FY 2017 Adopted Budget Capital Budget
66 DFW International Airport
Capital Budget DFW has 2 capital accounts in its Construction and Improvement Fund: the DFW Capital Account and the Joint Capital Account (JCA).
The DFW Capital Account is DFW’s discretionary account. It may be used for any legal purpose and does not require airline approval. DFW uses this fund for renewals and replacements and other discretionary projects. Funding for the DFW Capital Account is from the DFW Cost Center net revenues, interest income, grants, and bond proceeds primarily for commercial development projects. DFW has numerous capital projects currently underway and funded from the DFW Capital Account. (See detailed pages that follow.)
The JCA requires airline approval for capital projects and are typically funded through the sale of bonds. In addition to bond proceeds, the JCA is funded from natural gas royalties, sale of land proceeds, grants, and interest income. The Use Agreement provides for a Joint Capital Account Transfer of $4 million in FY 2017 to the Terminal Cost Center to subsidize terminal rentals. FY 2017 will be the last year for this subsidy.
The largest component of DFW’s capital program is the Terminal Renewal and Improvement Program (TRIP) which is funded from the JCA. The TRIP program is currently budgeted at $1.87 billion for Terminals A, B, and E. This excludes $817 million for Terminal C, which is currently on hold at the request of American Airlines. As of April 2016, DFW was 94% contractually committed/spent for terminals A, B and E and projects $32.2 million in savings at the end of the program. Two TRIP terminal sections (Terminal B – Section B and Terminal E – Section A) and the Terminal E Parking Garage – Section C are scheduled to open in FY 2017.

FY 2017 Adopted Budget Capital Budget
67 DFW International Airport
Projected Capital – Uses of Cash by Capital Account
DFW projects to spend approximately $697.3 million on capital expenditures in FY 2017 as summarized in the following chart.
The following table summarizes projected capital expenditures for projects to be in progress during FY 2017.
Joint Capital Account - TRIP
$255.0
Joint Capital Account - Non-
TRIP$209.4
DFW Capital Account*$212.6
Joint Capital Account
Transfer to 102 Fund$4.0
DFW Capital Account
Transfer to 102 Fund$11.4
FY 2017 Projected Capital Expenditures ($692.3M)
*$56.3M is debt financed for Commercial Development and other projects.
Actual Forecast Prior Projected Future TotalCapital Budget (Millions) FY 2015 FY 2016 Years FY 2017 Years BudgetDFW Capital Account $83.8 $76.2 $31.1 $212.6 $314.0 $557.7Joint Capital Acccount
TRIP 331.8 268.2 1,594.4 255.0 873.6 2,723.0 **Non-TRIP 178.0 63.0 100.7 209.4 611.1 921.1Transfers to 102 15.0 15.3 118.7 15.4 34.1 168.3Total Capital $608.5 $422.7 $1,844.9 $692.3 $1,832.9 $4,370.1
** Includes $4.7M of projects pending MII approval
Active Projects in FY 2017

FY 2017 Adopted Budget Capital Budget
68 DFW International Airport
Capital Project Approval Process
DFW has a Financial Plan that includes a long term Capital Plan. In FY 2010, DFW management developed a 10-year capital plan as the basis for negotiating the Use Agreement. Some of the FY 2017 projects from the list on the prior page were derived from that plan. Many of the new projects highlighted in blue are new projects which are officially in a “planning status.” When a project manager is ready to initiate one of the projects from the Capital Plan, a detailed capital worksheet is prepared including alternatives, and presented to the Capital Committee for review and approval. CEO approval is required for projects equal to or greater than $750,000. Projects on this list may be modified or eliminated if planning assumptions on costs and benefits do not materialize upon more detailed analysis. It is possible that new projects may arise during the fiscal year due to the dynamic nature of an airport. This “just-in-time” capital planning process provides flexibility to manage changes most effectively. From a process standpoint, the Board of Directors does not approve an overall capital budget. Instead, the Board generally reviews projects to be funded with bond proceeds before the bonds are sold and reviews individual capital projects as contracts for those projects are brought to the Board for approval.
Major Capital Project Descriptions
There are several major capital initiatives in the FY 2017 Capital Budget including:
Terminal Renewal and Improvement Program (TRIP) – DFW’s domestic terminals A, B, and E continue to undergo major rehabilitation/ redevelopment of terminal facilities which are at end-of-useful life. The current approved TRIP budget remains at $2.7 billion and includes $816.7 million for Terminal C, which remains on hold as previously described. Each TRIP terminal contains 3 sections, which are being reconstructed 1 terminal section at a time to maintain sufficient gate capacity to meet airline operational requirements. The first terminal section was completed in March 2013 with the final 2 terminal sections coming on line during FY 2017 and 2018. As of mid-FY 2016, an estimated $32.2 million of savings is forecasted for Terminals A, B, and E. Approximately $255 million is anticipated to be spent during FY 2017. This assumes no further capital expenditures for TRIP Terminal C.
Parking Expansion –Terminal E parking garage capacity is being expanded by approximately 40% through the reconstruction of a new more efficient parking garage in sections B and C with approximately 5,672 spaces to replace the prior 4,050 space parking garage. The B section opened in March 2016. Completion of the C section is scheduled for April 2017. Approximately $35 million is anticipated to be spent during FY 2017 on the C Section garage for an expected total cost of $53 million including a parking guidance system.
DFW has requested airline MII funding approval for preliminary programming and design to expand the existing employee surface lots to accommodate increased airlines and tenant headcount working in the Central Terminal Area (CTA). For a longer-term solution, DFW has also requested airline MII for preliminary programming of employee parking garages that would be located in the infield of one or two terminals. This would

FY 2017 Adopted Budget Capital Budget
69 DFW International Airport
replace the three surface employee parking lots which require busing. Approximately $5.6 million is anticipated to be spent on Employee Parking programming, design, and buildout during FY 2017.
Gate Expansion and Terminal D Passenger Processing Capacity Expansion – Additional gate capacity is planned in D-South. Projects include programming and schematic design for future gate expansion south of Terminal D which was pre-approved in the Use Agreement. Gate expansion is being analyzed as part of a holistic CTA study that includes expansion of passenger processing capacity in Terminal D, expansion/optimization of international bag claim, bag makeup, customs, and the D-south airline ticket hall. DFW will use hardstand operations until additional contact gates can be constructed so DFW is constructing an additional bus gate at D5 (shown in picture to right).
Airfield Reconstruction and Expansion – As part of a recent update to DFW’s 10-Year Capital Improvement Program, $47.3 million of design funding has been requested for airline MII approval to reconstruct critical airfield infrastructure which is approaching end-of-useful life. The major airfield reconstruction involves Runway 17C and related airfield reconstruction, including high speed exits and fillet modifications, Taxiway “M” and “B” rehabilitation, and north and south Hold Pads rehabilitation. The budget also includes a $51 million project ($15.3 million net of AIP grants) for reconstruction of Taxiway “L.” Construction is underway with a 75% FAA AIP grant reimbursement of eligible costs with completion anticipated in Spring of FY 2018. Approximately $9.4 million ($2.8 million net of grants) is anticipated to be spent during FY 2017.
A $51 million expansion of the Terminal D - South aircraft ramp adjacent to the west of the future Terminal “F” is programmed with 75% AIP grant funding. This expansion is required to meet current and future demand for additional aircraft parking positions for hardstand operations. Approximately $27 million is anticipated to be spent in FY 2017, $8.7M net of grants.
A $14 million project to strengthen Taxiway “Y” bridge has been added. This is the north crossover taxiways for aircraft movements over International Parkway between the west and east sides of the airfield. This is needed to accommodate heavier Aircraft Design Group (ADG) VI aircraft, (i.e., A-380 and 747-800) which exceeds the load bearing capacity of current bridges. Approximately $7.4M is anticipated to be spent in FY 2017, $3 million net of grants.
DFW plans to build a southwest end-around taxiway (EAT), to mirror the expansion in the southeast quadrant. This is an airfield safety and capacity project which will minimize the likelihood of runway incursions and increase runway capacity of the west side of the airfield. Airline MII approval has been requested for $9M for design. Additionally, DFW Airport is also planning on pursuing an

FY 2017 Adopted Budget Capital Budget
70 DFW International Airport
FAA Letter of Intent (LOI) for this EAT as well as the remaining two EAT’s on the north side to complete the larger program for EAT’s at DFW Airport.
Landside Roads, Bridges, and Rail - As a portion of DFW’s landside infrastructure approaches end-of-life, DFW has requested airline MII approval for design of roads and bridges reconstruction. Approximately $4 million is estimated to be spent on design during FY 2017. DFW will construct a rail station adjacent to Terminal B to accommodate the “T” Rail service from downtown Fort Worth. Design for this rail station is almost complete. DFW is seeking airline MII approval for the construction. Approximately $16 million is anticipated to be spent during FY 2017.
Expand Winter Weather Deicing Capacity – DFW has requested MII approval to fund the expansion of deicing capacity in two major areas: 1) Expansion of facilities to maintain and store the numerous pieces of large airfield and landside deicing equipment, 2) Expansion of infrastructure to store and treat aircraft deicing fluid. DFW’s deicing capacity expansion will ensure airfield capacity to meet airline operational demand during winter storm events. Approximately $5.3 million is anticipated to be spent in FY 2017.
Commercial Development and Other Facilities – Infrastructure to support several new planned Commercial Development projects including Passport Park in southeast quadrant of DFW, Bear Creek, Coppell Industrial, and others. Additionally, construction will continue into FY 2017 on Southgate development to complete the US Post Office. Approximately $25 million is anticipated to be spent on Commercial Development during FY 2017.
Other facility plans includes various expansion/consolidation projects for DFW facilities. Airline MII approval has been requested for several facility expansions as follows: DPS Station #1 expansion to accommodate planned growth, expansion of Airport Operations Center/Emergency Operations Center (AOC/EOC) to expand the role of the AOC to more of an integrated operations center, development of a back-up/second command center site for the parking system, and a relocation/consolidation of the Design/Code & Construction department and Energy Transportation & Asset Management administrative staff into a consolidated facility in Southgate. Approximately $8.3 million is anticipated to be spent on these other facility developments during FY 2017.
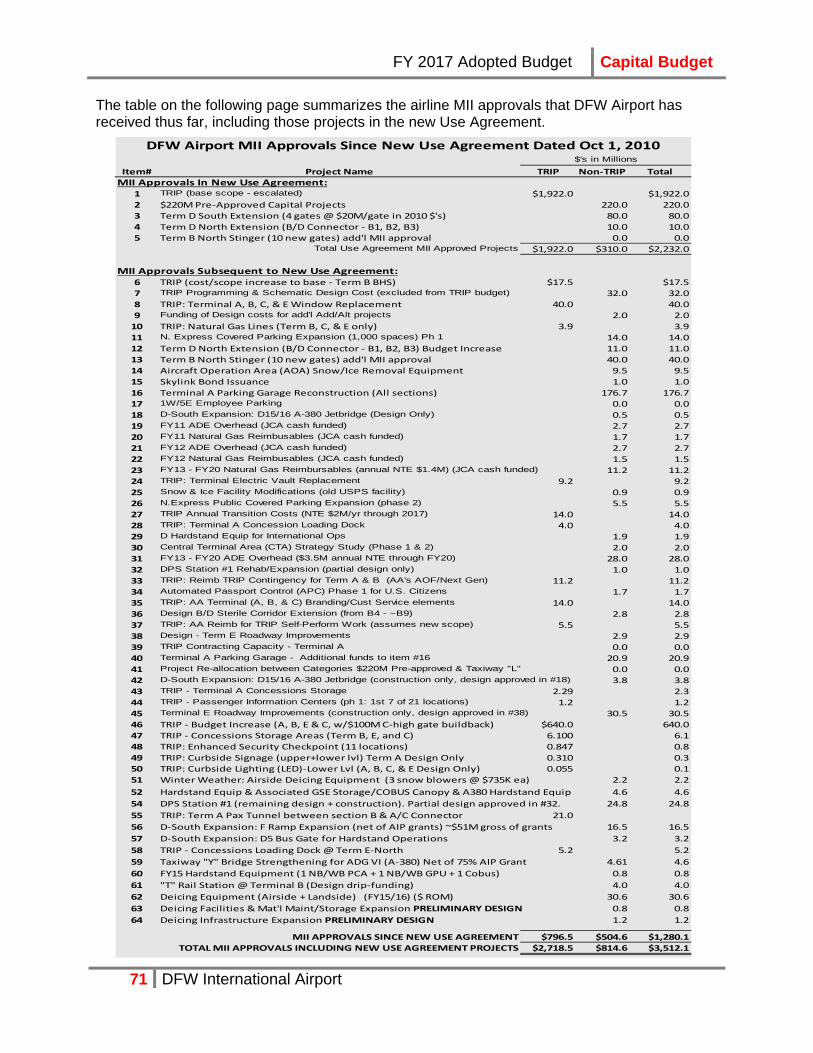
FY 2017 Adopted Budget Capital Budget
71 DFW International Airport
The table on the following page summarizes the airline MII approvals that DFW Airport has received thus far, including those projects in the new Use Agreement.
Item# Project Name TRIP Non‐TRIP Total
MII Approvals In New Use Agreement:1 TRIP (base scope - escalated) $1,922.0 $1,922.0
2 $220M Pre‐Approved Capital Projects 220.0 220.0
3 Term D South Extension (4 gates @ $20M/gate in 2010 $'s) 80.0 80.0
4 Term D North Extension (B/D Connector ‐ B1, B2, B3) 10.0 10.0
5 Term B North Stinger (10 new gates) add'l MII approval 0.0 0.0Total Use Agreement MII Approved Projects $1,922.0 $310.0 $2,232.0
MII Approvals Subsequent to New Use Agreement:6 TRIP (cost/scope increase to base ‐ Term B BHS) $17.5 $17.5
7 TRIP Programming & Schematic Design Cost (excluded from TRIP budget) 32.0 32.0
8 TRIP: Terminal A, B, C, & E Window Replacement 40.0 40.0
9 Funding of Design costs for add'l Add/Alt projects 2.0 2.0
10 TRIP: Natural Gas Lines (Term B, C, & E only) 3.9 3.9
11 N. Express Covered Parking Expansion (1,000 spaces) Ph 1 14.0 14.0
12 Term D North Extension (B/D Connector ‐ B1, B2, B3) Budget Increase 11.0 11.0
13 Term B North Stinger (10 new gates) add'l MII approval 40.0 40.0
14 Aircraft Operation Area (AOA) Snow/Ice Removal Equipment 9.5 9.5
15 Skylink Bond Issuance 1.0 1.0
16 Terminal A Parking Garage Reconstruction (All sections) 176.7 176.7
17 1W/5E Employee Parking 0.0 0.0
18 D-South Expansion: D15/16 A-380 Jetbridge (Design Only) 0.5 0.5
19 FY11 ADE Overhead (JCA cash funded) 2.7 2.7
20 FY11 Natural Gas Reimbusables (JCA cash funded) 1.7 1.7
21 FY12 ADE Overhead (JCA cash funded) 2.7 2.7
22 FY12 Natural Gas Reimbusables (JCA cash funded) 1.5 1.5
23 FY13 - FY20 Natural Gas Reimbursables (annual NTE $1.4M) (JCA cash funded) 11.2 11.2
24 TRIP: Terminal Electric Vault Replacement 9.2 9.2
25 Snow & Ice Facility Modifications (old USPS facility) 0.9 0.9
26 N.Express Public Covered Parking Expansion (phase 2) 5.5 5.5
27 TRIP Annual Transition Costs (NTE $2M/yr through 2017) 14.0 14.0
28 TRIP: Terminal A Concession Loading Dock 4.0 4.0
29 D Hardstand Equip for International Ops 1.9 1.9
30 Central Terminal Area (CTA) Strategy Study (Phase 1 & 2) 2.0 2.0
31 FY13 - FY20 ADE Overhead ($3.5M annual NTE through FY20) 28.0 28.0
32 DPS Station #1 Rehab/Expansion (partial design only) 1.0 1.0
33 TRIP: Reimb TRIP Contingency for Term A & B (AA's AOF/Next Gen) 11.2 11.2
34 Automated Passport Control (APC) Phase 1 for U.S. Citizens 1.7 1.7
35 TRIP: AA Terminal (A, B, & C) Branding/Cust Service elements 14.0 14.0
36 Design B/D Sterile Corridor Extension (from B4 - ~B9) 2.8 2.8
37 TRIP: AA Reimb for TRIP Self-Perform Work (assumes new scope) 5.5 5.5
38 Design - Term E Roadway Improvements 2.9 2.9
39 TRIP Contracting Capacity - Terminal A 0.0 0.0
40 Terminal A Parking Garage - Additional funds to item #16 20.9 20.9
41 Project Re-allocation between Categories $220M Pre-approved & Taxiway "L" 0.0 0.0
42 D-South Expansion: D15/16 A-380 Jetbridge (construction only, design approved in #18) 3.8 3.8
43 TRIP - Terminal A Concessions Storage 2.29 2.3
44 TRIP - Passenger Information Centers (ph 1: 1st 7 of 21 locations) 1.2 1.2
45 Terminal E Roadway Improvements (construction only, design approved in #38) 30.5 30.5
46 TRIP ‐ Budget Increase (A, B, E & C, w/$100M C‐high gate buildback) $640.0 640.0
47 TRIP ‐ Concessions Storage Areas (Term B, E, and C) 6.100 6.1
48 TRIP: Enhanced Security Checkpoint (11 locations) 0.847 0.8
49 TRIP: Curbside Signage (upper+lower lvl) Term A Design Only 0.310 0.3
50 TRIP: Curbside Lighting (LED)‐Lower Lvl (A, B, C, & E Design Only) 0.055 0.1
51 Winter Weather: Airside Deicing Equipment (3 snow blowers @ $735K ea) 2.2 2.2
52 Hardstand Equip & Associated GSE Storage/COBUS Canopy & A380 Hardstand Equip 4.6 4.6
54 DPS Station #1 (remaining design + construction). Partial design approved in #32. 24.8 24.8
55 TRIP: Term A Pax Tunnel between section B & A/C Connector 21.0
56 D‐South Expansion: F Ramp Expansion (net of AIP grants) ~$51M gross of grants 16.5 16.5
57 D‐South Expansion: D5 Bus Gate for Hardstand Operations 3.2 3.2
58 TRIP ‐ Concessions Loading Dock @ Term E‐North 5.2 5.2
59 Taxiway "Y" Bridge Strengthening for ADG VI (A‐380) Net of 75% AIP Grant 4.61 4.6
60 FY15 Hardstand Equipment (1 NB/WB PCA + 1 NB/WB GPU + 1 Cobus) 0.8 0.8
61 "T" Rail Station @ Terminal B (Design drip‐funding) 4.0 4.0
62 Deicing Equipment (Airside + Landside) (FY15/16) ($ ROM) 30.6 30.6
63 Deicing Facilities & Mat'l Maint/Storage Expansion PRELIMINARY DESIGN 0.8 0.8
64 Deicing Infrastructure Expansion PRELIMINARY DESIGN 1.2 1.2
MII APPROVALS SINCE NEW USE AGREEMENT $796.5 $504.6 $1,280.1
TOTAL MII APPROVALS INCLUDING NEW USE AGREEMENT PROJECTS $2,718.5 $814.6 $3,512.1
$'s in MillionsDFW Airport MII Approvals Since New Use Agreement Dated Oct 1, 2010

FY 2017 Adopted Budget Capital Budget
72 DFW International Airport
The following table shows cash flow projections, gross of grant reimbursements, for the DFW capital projects.
DFW CAPITAL ACCOUNT (In Millions) Prior FutureProject Name Years FY17 YearsTerm E Parking Garage (section C) 15.7 35.4 .0Other Discretionary .0 15.0 130.0Rehab Airfield Pavements FY14 8.6 10.6 4.0Replace Employee Buses .0 10.4 31.2Passport Park - DFW (Ph I) .0 10.0 5.6TSA Checked Bag Resolution Area (CBRA) .0 7.5 22.5Rehabilitate Airfield Pavements FY15 1.2 6.4 7.7Air Service Incentive Plan (ASIP) & Marketing Rebates 8.4 5.6 31.8Rehab Airfield Lighting Systems FY15 1.5 4.8 .0SH 161 Mixed Use (East of 161) Ph 1 .0 3.9 3.9Install Electrical Ductbank West Airfield Drive .2 3.6 .2Replace Remote Buses .0 3.3 24.8Coppell Freeway Commercial DD#3 .0 3.3 3.3Rehab Airfield Lighting Systems FY16 1.0 3.0 5.6Term B&E PBB Replacement .1 3.0 1.3Rehabilitate Storm Water Treatment Plant 1.5 2.5 2.5Southgate:USPS (Post Office) .6 2.5 .4Bear Creek - DFW (Ph II) 2.3 2.5 14.7Rehab Airfield Lighting Systems FY17 .7 2.3 .0ITS Sys Ops Annual Technology Purchase .6 2.2 2.2Rehabilitate Airfield Pavements FY16 .5 2.0 3.7IT/DPS Sys Ops: Replace Access Control Mgt Sys .0 2.0 5.1New Parking Technology - Yield Mgt .4 1.9 2.8Retaining Wall SB Svc Rd by Term D Crossunder #4 .3 1.8 1.4Replace TRE/Special Ops Buses .0 1.7 .5Bear Creek - DFW (Ph I) .1 1.6 .6Airport Master Plan Update .3 1.5 .6Term D Concessions Master Plan "White Box" 1.4 1.4 1.4Facility Renewal (planning reserve) .0 1.4 11.9Skylink Renewal Program - Skylink Car 3.8 1.2 7.6IT Term Sys: EVIDS Monitors & Related Equip .0 1.2 8.9Rehabilitate Airfield Pavements FY17 .1 1.2 13.8Term D APC - Ph 4 Kiosk Expansion 1.5 1.1 .0Bag Makeup Unit Renewal .0 1.1 2.4Term D Annual Capital Renewal: .0 1.1 70.1IT/Parking Ops: PCS - "Chip & Pin" 2.1 1.1 .0Passport Park - Drive Nation Youth Sports Complex .0 1.0 .0Landside Roads/Bridges .0 1.0 8.0NW Logistics (Ph III) DD#4 .0 1.0 .0IT Bus Solutions: Cloud Software & Prof Development .3 1.0 4.0Projects <1M 13.6 47.5 144.7
TOTAL DFW CAPITAL ACCOUNT 31.1 212.6 314.0ADD: TRANSFER TO 102 (Debt Service for Airport 10.7 11.4 34.1
TOTAL USES OF DFW CAPITAL ACCOUNT $41.8 $224.0 $348.1
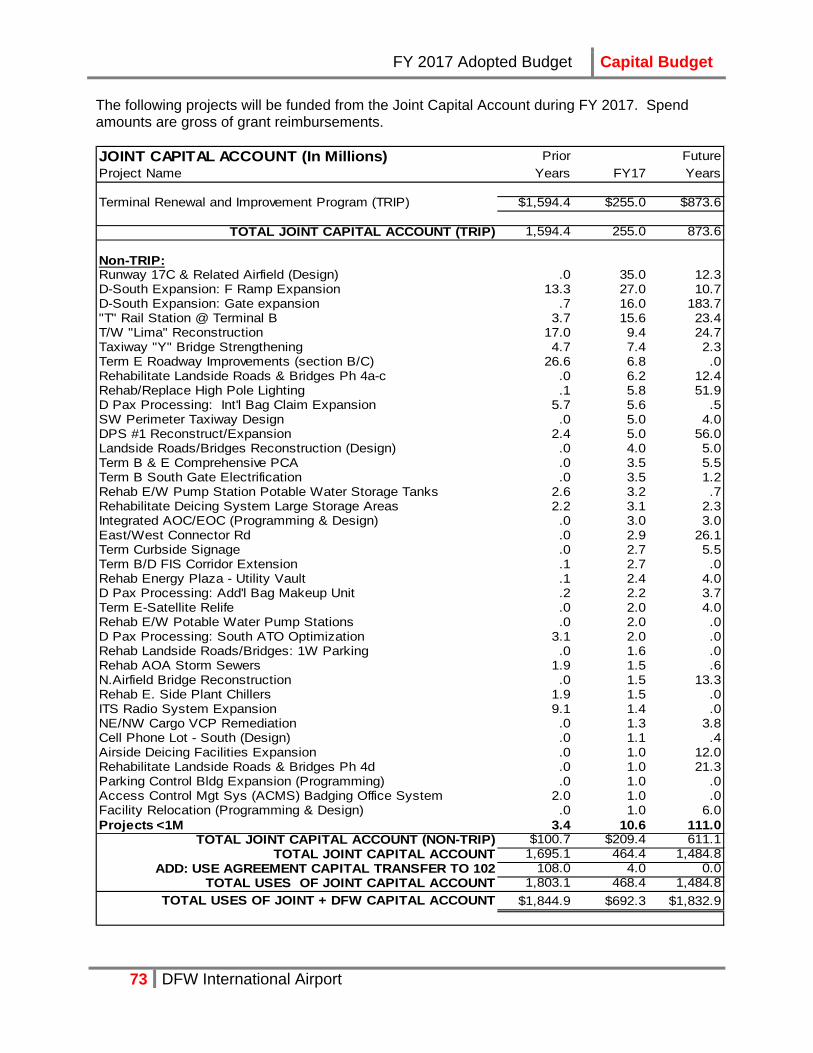
FY 2017 Adopted Budget Capital Budget
73 DFW International Airport
The following projects will be funded from the Joint Capital Account during FY 2017. Spend amounts are gross of grant reimbursements.
JOINT CAPITAL ACCOUNT (In Millions) Prior FutureProject Name Years FY17 Years
Terminal Renewal and Improvement Program (TRIP) $1,594.4 $255.0 $873.6
TOTAL JOINT CAPITAL ACCOUNT (TRIP) 1,594.4 255.0 873.6
Non-TRIP:Runway 17C & Related Airfield (Design) .0 35.0 12.3D-South Expansion: F Ramp Expansion 13.3 27.0 10.7D-South Expansion: Gate expansion .7 16.0 183.7"T" Rail Station @ Terminal B 3.7 15.6 23.4T/W "Lima" Reconstruction 17.0 9.4 24.7Taxiway "Y" Bridge Strengthening 4.7 7.4 2.3Term E Roadway Improvements (section B/C) 26.6 6.8 .0Rehabilitate Landside Roads & Bridges Ph 4a-c .0 6.2 12.4Rehab/Replace High Pole Lighting .1 5.8 51.9D Pax Processing: Int'l Bag Claim Expansion 5.7 5.6 .5SW Perimeter Taxiway Design .0 5.0 4.0DPS #1 Reconstruct/Expansion 2.4 5.0 56.0Landside Roads/Bridges Reconstruction (Design) .0 4.0 5.0Term B & E Comprehensive PCA .0 3.5 5.5Term B South Gate Electrification .0 3.5 1.2Rehab E/W Pump Station Potable Water Storage Tanks 2.6 3.2 .7Rehabilitate Deicing System Large Storage Areas 2.2 3.1 2.3Integrated AOC/EOC (Programming & Design) .0 3.0 3.0East/West Connector Rd .0 2.9 26.1Term Curbside Signage .0 2.7 5.5Term B/D FIS Corridor Extension .1 2.7 .0Rehab Energy Plaza - Utility Vault .1 2.4 4.0D Pax Processing: Add'l Bag Makeup Unit .2 2.2 3.7Term E-Satellite Relife .0 2.0 4.0Rehab E/W Potable Water Pump Stations .0 2.0 .0D Pax Processing: South ATO Optimization 3.1 2.0 .0Rehab Landside Roads/Bridges: 1W Parking .0 1.6 .0Rehab AOA Storm Sewers 1.9 1.5 .6N.Airfield Bridge Reconstruction .0 1.5 13.3Rehab E. Side Plant Chillers 1.9 1.5 .0ITS Radio System Expansion 9.1 1.4 .0NE/NW Cargo VCP Remediation .0 1.3 3.8Cell Phone Lot - South (Design) .0 1.1 .4Airside Deicing Facilities Expansion .0 1.0 12.0Rehabilitate Landside Roads & Bridges Ph 4d .0 1.0 21.3Parking Control Bldg Expansion (Programming) .0 1.0 .0Access Control Mgt Sys (ACMS) Badging Office System 2.0 1.0 .0Facility Relocation (Programming & Design) .0 1.0 6.0Projects <1M 3.4 10.6 111.0
TOTAL JOINT CAPITAL ACCOUNT (NON-TRIP) $100.7 $209.4 611.1TOTAL JOINT CAPITAL ACCOUNT 1,695.1 464.4 1,484.8
ADD: USE AGREEMENT CAPITAL TRANSFER TO 102 108.0 4.0 0.0TOTAL USES OF JOINT CAPITAL ACCOUNT 1,803.1 468.4 1,484.8
TOTAL USES OF JOINT + DFW CAPITAL ACCOUNT $1,844.9 $692.3 $1,832.9
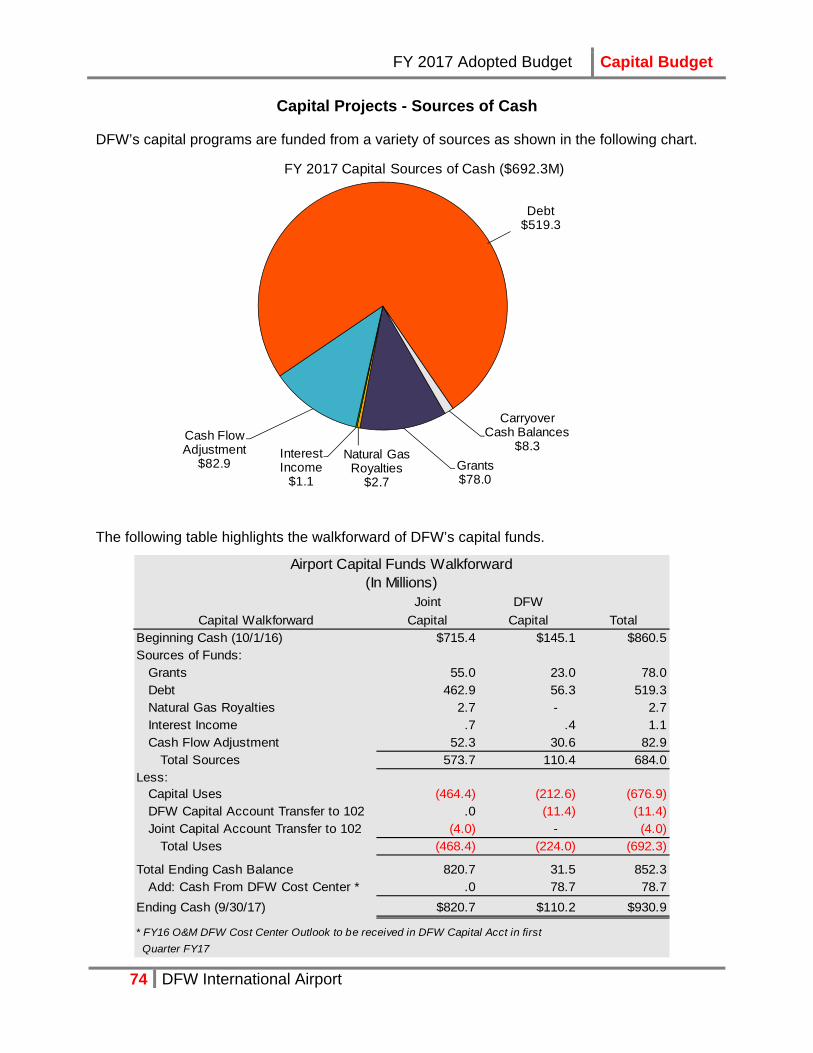
FY 2017 Adopted Budget Capital Budget
74 DFW International Airport
Capital Projects - Sources of Cash
DFW’s capital programs are funded from a variety of sources as shown in the following chart.
The following table highlights the walkforward of DFW’s capital funds.
Grants$78.0
Natural Gas Royalties
$2.7
Interest Income
$1.1
Cash Flow Adjustment
$82.9
Debt$519.3
Carryover Cash Balances
$8.3
FY 2017 Capital Sources of Cash ($692.3M)
Joint DFWCapital Walkforward Capital Capital Total
Beginning Cash (10/1/16) $715.4 $145.1 $860.5Sources of Funds:
Grants 55.0 23.0 78.0Debt 462.9 56.3 519.3Natural Gas Royalties 2.7 - 2.7Interest Income .7 .4 1.1Cash Flow Adjustment 52.3 30.6 82.9
Total Sources 573.7 110.4 684.0Less:
Capital Uses (464.4) (212.6) (676.9)DFW Capital Account Transfer to 102 .0 (11.4) (11.4)Joint Capital Account Transfer to 102 (4.0) - (4.0)
Total Uses (468.4) (224.0) (692.3)
Total Ending Cash Balance 820.7 31.5 852.3Add: Cash From DFW Cost Center * .0 78.7 78.7
Ending Cash (9/30/17) $820.7 $110.2 $930.9
* FY16 O&M DFW Cost Center Outlook to be received in DFW Capital Acct in first
Quarter FY17
Airport Capital Funds Walkforward(In Millions)