Embed Size (px)
Citation preview

Petra Diamonds Limited
14 September 2021
FY 2021 Prelim Results

Important Notice
These Presentation Materials are being supplied to you by Petra Diamonds Limited (the “Company”) solely for your information and use at thispresentation.
These Presentation Materials may contain information that is confidential, legally privileged or otherwise protected by law. These Presentation Materialsmay not be reproduced in any form, redistributed or passed on, directly or indirectly, to any person or published, in whole or in part, by any medium or forany purpose. Failure to comply with this restriction may constitute a violation of applicable securities law.
These Presentation Materials are exclusively for the purposes of raising awareness about the Company. These Presentation Materials are not intended tosolicit the dealing in securities or securities financing nor do they form part of any invitation, offer for sale or subscription or any solicitation for any offer tobuy or subscribe for any securities in the Company (“Company Securities”) nor shall they or any part of them form the basis of, or be relied upon inconnection therewith or act as any inducement to enter into, any contract or commitment with respect to Company Securities.
These Presentation Materials must not be used or relied upon for the purpose of making any investment decision or engaging in an investment activity.Accordingly, neither the Company nor any of its subsidiary undertakings (as defined in the Bermuda Companies Act 2006) (together, the “Group”), nor anyof their respective directors, employees, agents or advisors makes any representation or warranty in respect of the contents of the Presentation Materialsor otherwise in relation to the Group or any of its businesses.
The information contained in the Presentation Materials is subject to amendment, revision and updating, and such information may change materially. Noperson is under any obligation to update, or keep current, the information contained in these Presentation Materials, and any opinions expressed inrelation thereto are subject to change without notice. The Presentation Materials contain forward-looking statements which involve risk and uncertaintiesand actual results and developments may differ materially from those expressed or implied by these statements depending on a variety of factors. ThePresentation Materials have not been independently verified and no representation or warranty, express or implied, is made as to the fairness, accuracyor completeness of the information or opinions contained herein. The forward-looking information contained in these Presentation Materials is expresslyqualified by this cautionary statement.
The delivery of these Presentation Materials shall not at any time or in any circumstance create any implication that there has been no adverse change, orany event reasonably likely to involve any adverse change, in the condition (financial or otherwise) of the Company or any other member of the Groupsince the date of these Presentation Materials.
Any securities mentioned herein have not been and will not be registered under the United States Securities Act of 1933, as amended (the “SecuritiesAct”) or under the securities laws of any state or other jurisdiction of the United States and may not be offered, sold, resold or delivered, directly orindirectly, in or into the United States absent registration except pursuant to an exemption from, or in a transaction not subject to, the registrationrequirements of the Securities Act and applicable states securities laws. The distribution of these Presentation Materials in other jurisdictions may also berestricted by law, and persons into whose possession these materials come should inform themselves about, and observe, any such restrictions. Nopublic offering of securities is being made in the United States or any other jurisdiction.
By attending this presentation or by accepting a copy of the Presentation Materials, you agree to be bound by the foregoing limitations and conditions.
2

CEO Overview

A Resilient Business and Market in FY 2021
4
“We enter FY 2022 with some momentum from a considerably strengthened balance sheet, ongoing optimisation of our asset base and a positive outlook for the diamond market.”
• Completion of major capital restructuring coupled with US$62.0
million in sales from exceptional stones served to reduce
consolidated net debt by roughly two thirds from US$693.2
million (30 June 2020) to US$228.2 million (30 June 2021),
thereby considerably strengthening the balance sheet
• Project 2022 delivered record production at Cullinan and helped
to contain operating cost pressures
• Delivery of significant operational free cashflow of US$120.1
million due to higher diamond sales, recovery of exceptional
diamonds and an improving diamond market and prices
• Cullinan continued to produce world-class Type II blue and white
diamonds
• Successful conclusion of a 3 year labour agreement with NUM
• Continued management of COVID-19 across the Group without
material impact on production

Relentless Focus on Zero Harm
5
Safety remains our first priority
Ongoing focus on safety to address rise in LTIs:
• LTIs identified as behavioural in nature and of low severity, but
nevertheless require significant focus to achieve turnaround
• South African mining industry saw significant increase in
fatalities and injuries during 2020/21 believed to be related to
disruption to workforce caused by COVID-19
• Petra has a behaviour-based intervention campaign in place:
- in-shift safety stops
- visible leadership and management walkabouts
- awareness campaigns
- safety discipline enforcement
- safety inspection processes
Fatalities
Lost Time
Injuries
Lost Time Injury
Frequency Rate
Non Lost
Time Injuries
Total
Injuries
Severity
Rate
FY 2021 0 25 0.44 17 42 10.50
FY 2020 0 19 0.29 26 45 13.13
Vaccination drive underway at all Petra’s South African operations
in partnership with the Department of Health
Management leading by example

FY 2021 KPIs
6
Strong operating performance
PRODUCTION¹
Million carats
3.2
• Record performance at Cullinan
partially offset by lower
production at Finsch due to
unexpected waste ingress, and
excessive rainfall impacting
Finsch and Koffiefontein in Q3;
Williamson remained on care
and maintenance
-2%
REVENUE¹
US$ million
402.3
• FY 2021 revenue driven by
record contribution from
Exceptional Stones of US$62.0
million, a 51% increase in
diamonds sold and rough
diamond prices realised by Petra
rising ca. 9%
+65%
OPERATIONAL CAPEX¹
US$ million
22.5
28.6
22.5
FY 2020 FY 2021
• Capital expenditure was
significantly reduced in FY
2021 reflecting Management’s
response to capital allocation
in light of the COVID-19
impact on the business
-21%
243.3
402.3
FY 2020 FY 2021
3.3
3.2
FY 2020 FY 2021
1 All figures exclude Williamson; the Board has decided to review its strategic options at Williamson and the asset has therefore been classified as an asset
held for sale

The Unique Heritage of Cullinan
Petra Diamonds Limited: FY 2019 Prelims Presentation 7
Cullinan continues to produce historic diamonds
The Letlapa Tala Collection of five blue diamonds sold for US$40.36 million
A 299 carat white diamond sold for US$12.18 million ($40.7k per carat)
FY 2021
US$1.0
million per
carat
39.34ct blue diamond sold for US$40.18 million – being the most
valuable diamond sold in Petra’s history and likely the most valuable
rough stone per carat in the history of diamonds
A 342.92ct white diamond and an 18.30ct blue diamond sold into a
partnership – Petra to receive total upfront payment of US$13.5
million, as well as retaining a 50% interest in the profit uplift of the
polished proceeds, after costs
FY 2022 YTD

FY 2021 Financial KPIs
8
Delivering increased EBITDA and Operational FCF in FY 2021
ADJUSTED EBITDA¹,2
US$ million
135.4
67.3
135.4
FY 2020 FY 2021
• Higher EBITDA driven by
Exceptional Stone sales and
improved diamond prices
• Adjusted EBITDA margin of 34%
(FY 2020: 28%)
OPERATIONAL FREE CASHFLOW1
US$ million
120.1
• Generation of significant positive
Operational FCF assisted by
stronger pricing, sales proceeds
from Exceptional Stones and cost
efficiencies delivered by Project
2022.
-12.3
120.1
FY 2020 FY 2021
+101%
1. All figures exclude Williamson
2. Refer to preliminary results announcement dated 14 September 2021 for detailed notes regarding non-IFRS adjusted disclosures
ADJUSTED NET LOSS AFTER TAX¹,2
US$ million
(16.1) FY 2020: (54.7)
BASIC PROFIT / (LOSS) PER SHARE
from continuing operations1
US$ cents
6.67 FY 2020: (15.26)
ADJUSTED LOSS PER SHARE from
continuing operations1,2
US$ cents
(0.46) FY 2020: (5.04)

Responsible Mining – ESG Performance in FY 2021
9
Scholars supported by the Cullinan mine
Ongoing aid to local communities further
impoverished by COVID-19, funded by the Petra
Hardship Fund
New and upgraded classrooms constructed at the
Danielskuil High School near Finsch; the project
created 42 jobs while construction was underway
FY 2021 FY 2020
Employee training spend (US$m) 5.8 5.8 0%
Social investment and community training spend
(US$m)
1.0 1.9 -47%
Women in the workforce (%) 20 19 +5%
Women on the Board (%) 252 22 +14%
Major / significant environmental incidents 0 0 n/a
Total carbon emissions (tCO2-e) 405,807 484,182 -16%
Carbon emitted per carat (tCO2-e/ct) 0.125 0.134 -7%
Total energy usage (million gigajoules) 1.5 1.9 -21%
Energy usage per tonne (kWh/t) 46.6 37.0 +26%
Total water usage (million m3) 2.0 9.2 -78%
Water usage per tonne (m3/t) 0.56 0.97 -42%
Percentage of recycled water used (%) 82 81 +1%
Volume of waste generated (t) 6,335 5,483 +15%
1. Historically disadvantaged South Africans
2. This percentage increased to 34% post Year end
Continued focus on educational projects, the advancement of
women and HDSAs¹, and the efficient use of resources

Update on Human Rights at Williamson
10
Compensation
• In May 2021, agreed total settlement figure of $6.1m: for Leigh Day to distribute to claimants, to contribute towards claimants’ legal fees and fund restorative justice projects around mine
Independent Grievance Mechanism
• Based on UN Guiding Principles on Business and Human Rights
• Address further claims of severe human rights violations
Restorative justice measures
• Fund to establish broad spectrum of socio-economic initiatives locally
• Medical support
• ASM and agribusiness feasibility studies & projects
• Mine delineation, grazing, and firewood access
Human Rights Defender Policy
• Non-harassment and victimisation policy to safeguard victims and human rights defenders against future harm
SGBV initiative
• Sexual and Gender-Based Violence (SGBV) initiative
• In addition to projects agreed to under Leigh Day Settlement
• Support to victims of SGBV in local communities surrounding WDL
Design and implementing partner:
20-year old global consulting company specialising in business and human rights,
including human rights due diligence, security and human rights, human rights remedy,
grievance mechanisms, and grievance process design, implementation, and monitoring.
Previous work with ICMM, RMI, OECD, IFC, Anglo American, Rio Tinto, and Vedanta, as
well as Independent Monitor for Gemfields grievance mechanism in Mozambique.
Petra and Williamson Diamonds Limited acted swiftly to address the human rights abuse allegations with comprehensive action plan

Independent Grievance Mechanism
Scope
• Prioritisation of human rights
grievances linked to WDL since PDL
became WDL owner (2009)
• Older grievances should be heard,
acknowledged, and recorded for a
separate reconciliatory process
Safeguards and supports
• Ensuring effective access to
remedy for victims
• Complainant access to
independent lawyers
• Confidentiality of claims
• Sensitive to gender and other
vulnerability
Dialogue-based
• Built upon long-term WDL
stakeholder engagement and
relationship-building
• Including consultation with
stakeholders for whom it is intended
on design and performance
• Dialogue with claimants as key
aspect of remedy process
Independent
• Independent of WDL / PDL
• Legally compliant but independent
of Courts
• Independent Panel of Tanzanians
to run process,
• Accountable to an Appeals Panel
and an Independent Monitor
A Tanzanian solution that is trusted, safe to use, and provides fair remedy

Financial Results

FY 2021
(US$m)
Restated2
FY 2020
(US$m)
Revenue 402.3 243.3
Adjusted mining and processing costs1 (261.2) (169.3)
Other direct income / (expense) 1.7 1.0
Profit from mining activity¹ 142.8 75.0
Exploration expense — (0.5)
Corporate overhead¹ (7.4) (7.2)
Adjusted EBITDA¹ 135.4 67.3
Depreciation and amortisation (76.8) (69.8)
Share-based expense (0.5) (0.7)
Net finance expense (67.0) (70.8)
Adjusted loss before tax (8.9) (74.0)
Tax (expense) / credit (excluding taxation credit / charge on impairment charge and unrealised foreign exchange
gain / (loss))¹ (7.2) 19.3
Adjusted net loss after tax (16.1) (54.7)
Impairment charge – operations and other receivables¹ (17.7) (50.5)
Impairment of BEE loans receivable - expected credit loss release / (charge)1 5.8 (10.9)
Gain on extinguishment of Notes net of unamortised costs 213.3 —
Profit on disposal¹ 14.7 —
Costs and fees relating to investigation and settlement of human rights abuse claims (12.7) —
Net unrealised foreign exchange gain / (loss) 77.1 (82.1)
Taxation (charge) / credit on unrealised foreign exchange gain / (loss)¹ (19.9) 22.2
Taxation credit on impairment charge 4.2 11.0
Profit / (loss) from continuing operations 248.7 (165.0)
Loss on discontinued operations, net of tax¹ (52.1) (58.0)
Net profit / (loss) after tax 196.6 (223.0)
Earnings per share attributable to equity holders of the Company:
Basic profit / (loss) per share from continuing and discontinued operations – US$ cents 5.22 (21.96)
Basic profit / (loss) per share from continuing operations – US$ cents 6.67 (15.26)
Adjusted loss per share – from continuing operations¹ (0.46) (5.04)
FY 2021 Summary of Results1
131. Refer to Preliminary results announcement dated 14 September 2021 for detailed notes and explanations regarding non-IFRS adjusted disclosures
2. The financial results in the Preliminary results announcement are adjusted to exclude the assets and liabilities of Williamson, which has been reclassified as an asset held for sale, and
the operating results of Williamson have been reclassified as a discontinued operation for FY 2020 and FY 2021

Balance Sheet Snapshot
14
Unit 30 June 2021 30 Jun 2020
Closing exchange rate used for conversion R14.27:US$1 R17.32:US$1
Cash at bank (incl. restricted amounts) US$m 163.8 67.66
Diamond inventories1 US$m
Carats
45.1
560,699
84.16
1,357,5846
Diamond debtors US$m 38.3 4.86
US$336.7 million loan notes (issued March 2021)2 US$m 327.3 -
US$650 million loan notes (including deferred coupon payments)3 US$m - 676.9
Bank loans and borrowings4 US$m 103.0 52.1
BEE partner bank facilities US$m - 40.0
Bank facilities undrawn and available4 US$m 7.7 -
Consolidated Net debt5 US$m 228.2 693.2
1. Recorded at the lower of cost and net realisable value
2. The US$336.7 million loan notes have a carrying value of US$327.3 million which represents gross capital of US$336.7 million (30 June 2020: US$nil), plus US$11.3 million
accrued interest (30 June 2020: US$nil) net of unamortised transaction costs capitalised of US$20.7 million. These loan notes were issued following the debt restructuring
completed during March 2021
3. The US$650 million loan note represents the gross capital of nil (30 June 2020: US$650 million), including US$nil accrued interest (30 June 2020: US$26.9 million). These loan
notes were settled in full following the debt restructuring completed during March 2021
4. Bank loans and borrowings represent amounts drawn under the Group’s refinanced South African bank facilities as part of the restructuring and comprises the ZAR1.068 billion
term loan (US$74.8 million), net of unamortised transaction costs capitalised of US$1.7 million and ZAR402.1 million (US$28.2 million) drawn (including accrued interest) under the
ZAR509.6 million (US$35.7 million) revolving credit facility. Under the revolving credit facility, ZAR109.6 million (US$7.7 million) remains undrawn and available
5. Consolidated Net Debt is bank loans and borrowings plus loan notes, less cash, less diamond debtors and includes the Black Economic Empowerment guarantees of ZARnil
(US$nil) as at 30 June 2021 (ca. US$40.0 million (ZAR693.6 million) as at 30 June 2020)
6. Including Williamson

Net Debt Movement in FY 2021
15

Operating Costs
16
FY 2021 costs in line with expectations
• Absolute on-mine cash costs in FY 2021 increased by 3.3% vs FY 2020 due to:
– effect of translating ZAR denominated costs at SA
operations at a stronger ZAR/USD exchange rate (1.7%
increase)
– inflationary increases, including impact of electricity and
labour costs (6.0% increase)
Partially offset by:
– variable cost impact of changing production volumes
across SA operations (0.8% decrease)
– net savings, including Project 2022 initiatives (3.6%
decrease)
All in US$m
On-mine
cash
costs1
Diamond
Royalties
Diamond inventory
and stockpile
movement
Group technical,
support and
marketing costs2
Adjusted
mining and
processing costs Depreciation3
Total mining and
processing costs
(IFRS)
FY 2021 197.6 2.9 39.1 21.7 261.2 76.0 337.2
FY 2020 191.2 2.6 (42.6) 18.1 169.3 68.9 238.2
1 Includes all direct cash operating expenditure at operational level , i.e. labour, contractors & services, consumables, utilities and on-mine overheads2 Certain technical, support and marketing activities are conducted on a centralised basis3 Includes amortisation of right-of-use assets under IFRS 16 of US$0.6 million (FY 2020: US$0.2 million) and excludes exploration and corporate/administration.
45%
20%
15%
7%
13%
FY 2021 On-mine cash cost breakdown (South Africa operations)
Labour Stores
Power Other costs
Services

Market Update

Favourable Market Fundamentals
18
Supply experienced one of the most severe contractions on record in 2020
• Rough diamond production fell 22% by volume to 107.1 Mcts in 2020 (2019: 138.2 Mcts)
• Closure of the Argyle mine in Australia in 2020; the mine produced around 10% of world supply by volume in 2019 and was
only major source of pink diamonds globally
• The success rate in diamond exploration is estimated as less than 1% and there have been no major new finds since the
early 1990s
• World supply projected to remain ‘almost flat’ at 2021-type levels over the next 10yrs with few new projects coming on line
Source: Bain & Company Diamond Report 2020-21
19
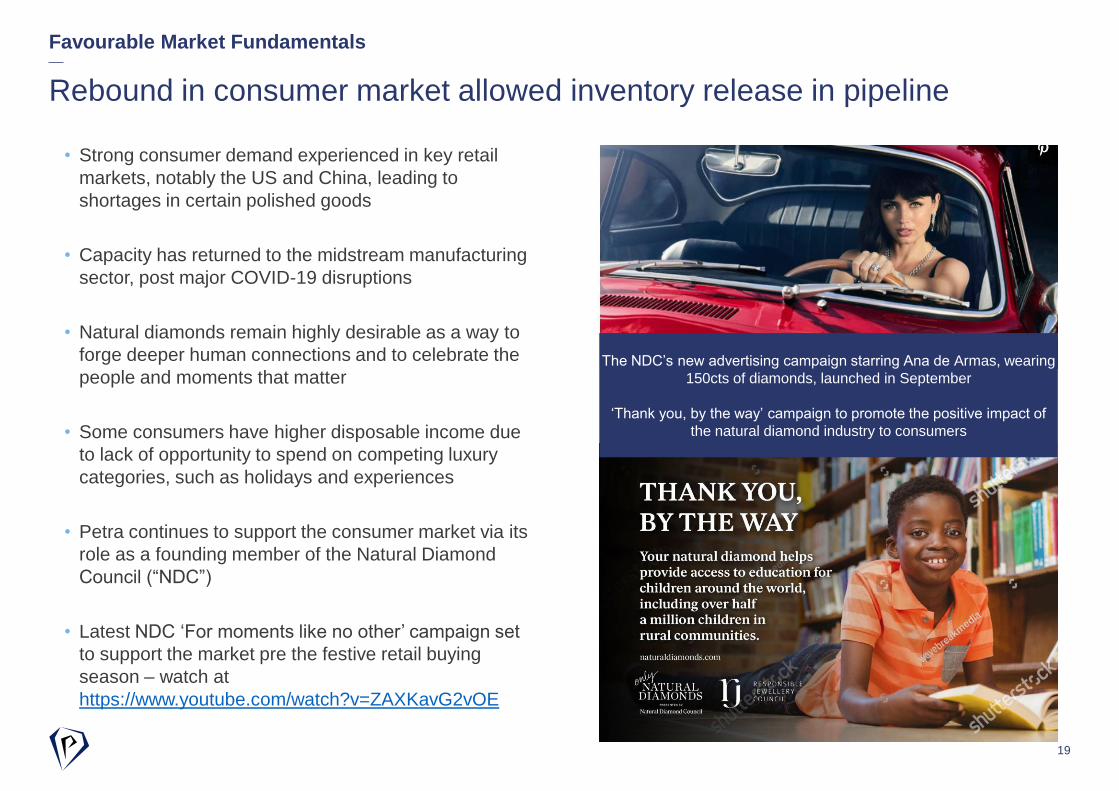
• Strong consumer demand experienced in key retail
markets, notably the US and China, leading to
shortages in certain polished goods
• Capacity has returned to the midstream manufacturing
sector, post major COVID-19 disruptions
• Natural diamonds remain highly desirable as a way to
forge deeper human connections and to celebrate the
people and moments that matter
• Some consumers have higher disposable income due
to lack of opportunity to spend on competing luxury
categories, such as holidays and experiences
• Petra continues to support the consumer market via its
role as a founding member of the Natural Diamond
Council (“NDC”)
• Latest NDC ‘For moments like no other’ campaign set
to support the market pre the festive retail buying
season – watch at
https://www.youtube.com/watch?v=ZAXKavG2vOE
Rebound in consumer market allowed inventory release in pipeline
Favourable Market Fundamentals
The NDC’s new advertising campaign starring Ana de Armas, wearing
150cts of diamonds, launched in September
‘Thank you, by the way’ campaign to promote the positive impact of
the natural diamond industry to consumers

Operations Update

60%
38%
2%
Cullinan
Finsch
Koffiefontein
Williamson
44%
46%
2% 8%
Mine Contribution Split
Production by mine Revenue by mine
21
62%
30%
7%
1%
FY 2020:
3.6 million carats¹
FY 2020
$295.8 million¹39%
34%
9%
18%
FY 2021:
3.2 million carats¹
FY 2021:
$406.9 million¹
1. While Petra’s FY 2021 financial results reflect Williamson as an ‘asset held for sale’, the above charts above includes include
Williamson’s contribution to FY 2021 and FY 2020 gross production and revenue
Strong production despite operational challenges and COVID-19 impact
0%

Cullinan
Project 2022 throughput initiatives saw volumes increase to 5.06 Mt
22
FY 2021 FY 2020
Cts sold (Mcts) 2.3 1.2
US$/ct 111 98
Revenue (US$m) 250.6 116.5
ROM tonnes (Mt) 4.6 4.0
ROM grade (cpht) 38.2 37.3
ROM cts (Mcts) 1.8 1.5
Total tonnes (Mt) 5.1 4.2
Total cts (Mcts) 1.9 1.6
ZAR/t Opex 260 270
Capex (US$m) 16.8 16.4

Finsch
23
• Re-engineering project initiated to re-set cost base and enhance operating margins
Production impaired by unexpected waste ingress and excessive rainfall
FY 2021 FY 2020
Cts sold (Mcts) 1.6 1.3
US$/ct 77 75
Revenue (US$m) 123.5 101.1
ROM tonnes (Mt) 2.3 2.7
ROM grade (cpht) 53.5 59.0
ROM cts (Mcts) 1.2 1.6
Total tonnes (Mt) 2.3 2.9
Total cts (Mcts) 1.2 1.6
ZAR/t Opex 536 477
Capex (US$m) 4.0 8.4
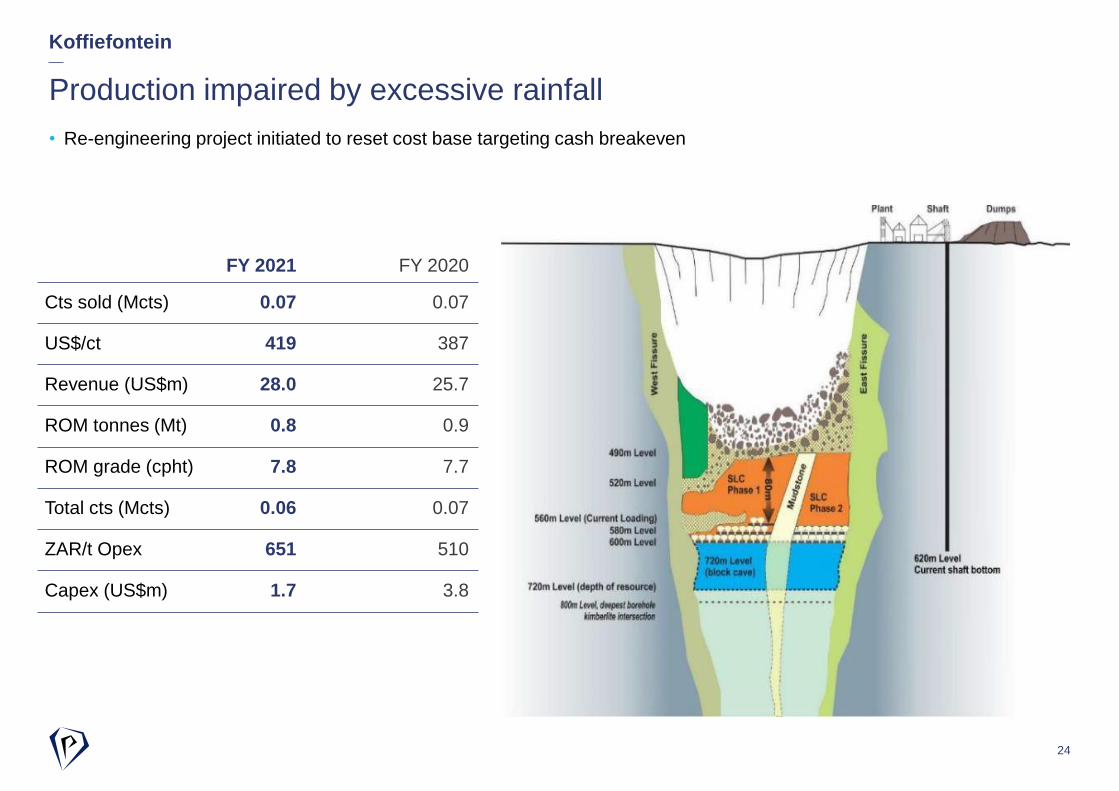
Koffiefontein
24
• Re-engineering project initiated to reset cost base targeting cash breakeven
Production impaired by excessive rainfall
FY 2021 FY 2020
Cts sold (Mcts) 0.07 0.07
US$/ct 419 387
Revenue (US$m) 28.0 25.7
ROM tonnes (Mt) 0.8 0.9
ROM grade (cpht) 7.8 7.7
Total cts (Mcts) 0.06 0.07
ZAR/t Opex 651 510
Capex (US$m) 1.7 3.8

SHALE
MUDSTONE
BVK
BVK
RVK
SIL_GB
GB
GB
GB2
GB
2
O_RVK
BOUMA
NCL_RVK
RVK
SIL_GB
RVK
NF_RVK
500m
Inpit Failure
Area
Williamson Update
25
• Mine put on care and maintenance in April 2020 to preserve liquidity Plans
are currently being refined to restart during H1 FY 2022
• Board considering its strategic options at Williamson; classified as “asset
held for sale’” for financial reporting purposes
• Discussions ongoing with Government of Tanzania and local advisers in
relation to the overdue VAT receivables and the blocked parcel; US$10m
of VAT refunds received from TRA in Q4 FY 2021
Mine remained on care and maintenance in FY 2021
FY 2021 FY 2020
Cts sold (Mcts) 0.03 0.3
US$/ct 150 177
Revenue (US$m) 4.6 52.5
ROM tonnes (Mt) 0 4.0
ROM grade (cpht) n/a 7.2
Total cts (Mcts) 0 0.3
USD/t Opex n/a 10.2
Capex (US$m) 0.3 8.0

Project 2022
26
Optimising production and driving cost efficiencies
• Project 2022 remains a key focus to further stabilise our operations and ensure that continuous improvement
is embedded in our operating model and culture
• Project 2022 key drivers are throughput capacity and utilisation increases and improving cost efficiencies
• Expectations of annualised contribution from throughput initiatives of ca. US$50 million due to reduced
throughput at Finsch, Koffiefontein and Williamson – this target remains in place, supported by measures to
curtail waste ingress at Finsch
• Organisational Design Review Phase 1 completed during FY 2021 resulting in updated role descriptions that
will facilitate performance and talent pool management, providing for clearer line of site and improved
accountability
• Cost efficiencies targeted to deliver ca. US$20 million per annum going in to H1 FY 2022

Outlook

FY 2022 Guidance
28
Cullinan Finsch Koffiefontein Williamson(assuming
production restart
in H1 FY 2022)
Group
ROM tonnes (Mt) 4.2 – 4.4 2.75 – 2.85 0.72 – 0.75 3.6 – 4.0
ROM grade (cpht) 37 – 39 48 – 50 8.0 – 8.5 6.2 – 6.7
Tailings tonnes (Mt) 0.44 0.07 n/a n/a
Tailings grade 36 – 37 16 – 17 n/a n/a
Total carats recovered (Mcts) 1.70 – 1.90 1.32 – 1.40 0.06 – 0.07 0.22 – 0.27 3.3 – 3.6
Cash on-mine costs (US$m) 95 – 105 90 – 98 30 – 34 52 – 56 267 – 293
Expansion Capex (US$m) 37 – 41 13 – 16 0 – 1 n/a 50 – 58
Sustaining Capex (US$m) 11 – 13 8 – 9 1 – 2 8 – 10 28 – 34
Total Capex (US$m) 48 – 54 21 – 25 1 – 3 8 – 10 78 – 92
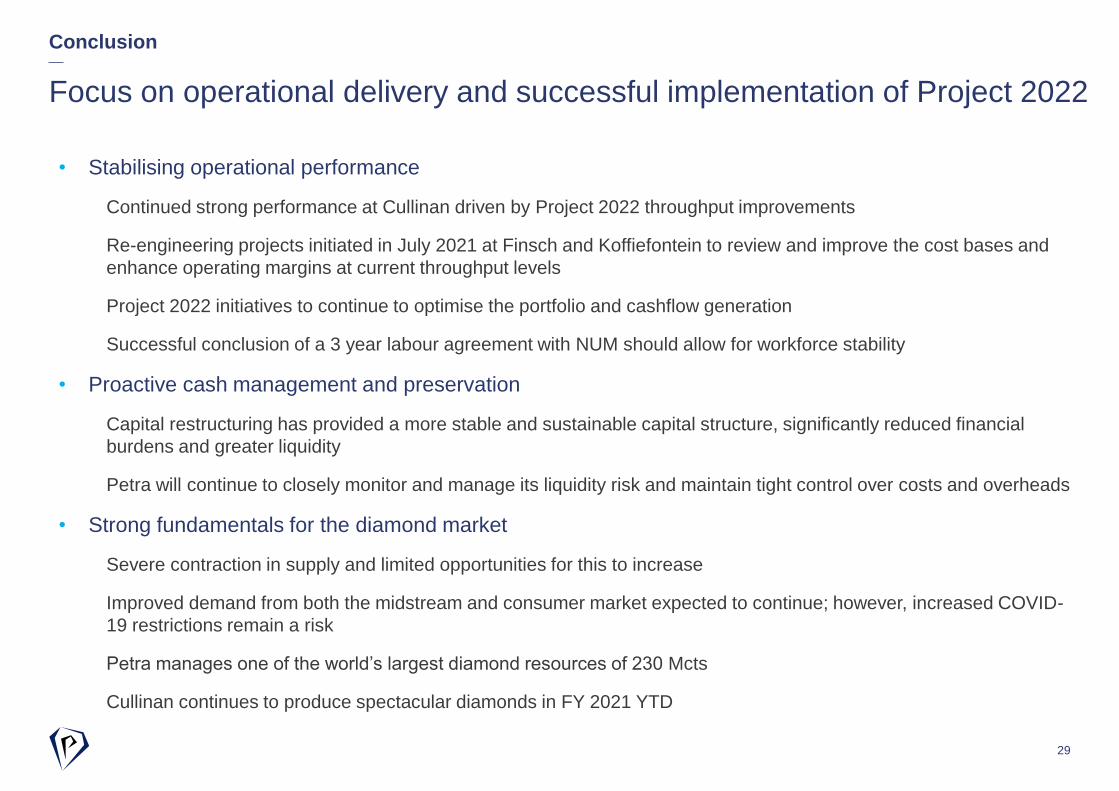
Conclusion
29
• Stabilising operational performance
Continued strong performance at Cullinan driven by Project 2022 throughput improvements
Re-engineering projects initiated in July 2021 at Finsch and Koffiefontein to review and improve the cost bases and
enhance operating margins at current throughput levels
Project 2022 initiatives to continue to optimise the portfolio and cashflow generation
Successful conclusion of a 3 year labour agreement with NUM should allow for workforce stability
• Proactive cash management and preservation
Capital restructuring has provided a more stable and sustainable capital structure, significantly reduced financial
burdens and greater liquidity
Petra will continue to closely monitor and manage its liquidity risk and maintain tight control over costs and overheads
• Strong fundamentals for the diamond market
Severe contraction in supply and limited opportunities for this to increase
Improved demand from both the midstream and consumer market expected to continue; however, increased COVID-
19 restrictions remain a risk
Petra manages one of the world’s largest diamond resources of 230 Mcts
Cullinan continues to produce spectacular diamonds in FY 2021 YTD
Focus on operational delivery and successful implementation of Project 2022

Appendix

Capital Structure
31
Listing LSE: PDL
Average daily trading volume across all
platforms (shares) – (LTM) 4.14m
Shares in issue 9,710.1m
Market cap @ 1.7p (7 September 2021) $229m
Major Shareholders % Voting rights
Vontobel Holding AG 16.81%
Monarch Master Funding 2 (Luxembourg)
S.a r.l. 12.00%
Invesco Ltd. 8.43%
Bank of America Corporation 7.61%
Franklin Templeton Investment
Management Ltd. 6.37%
Share Price (1 year to 7 September 2021)
Petra Diamonds Corporate Bond
Issue date: May 2021
Issue size: US$337million
Coupon: 10.5% – 9.75%
Maturity: May 2026
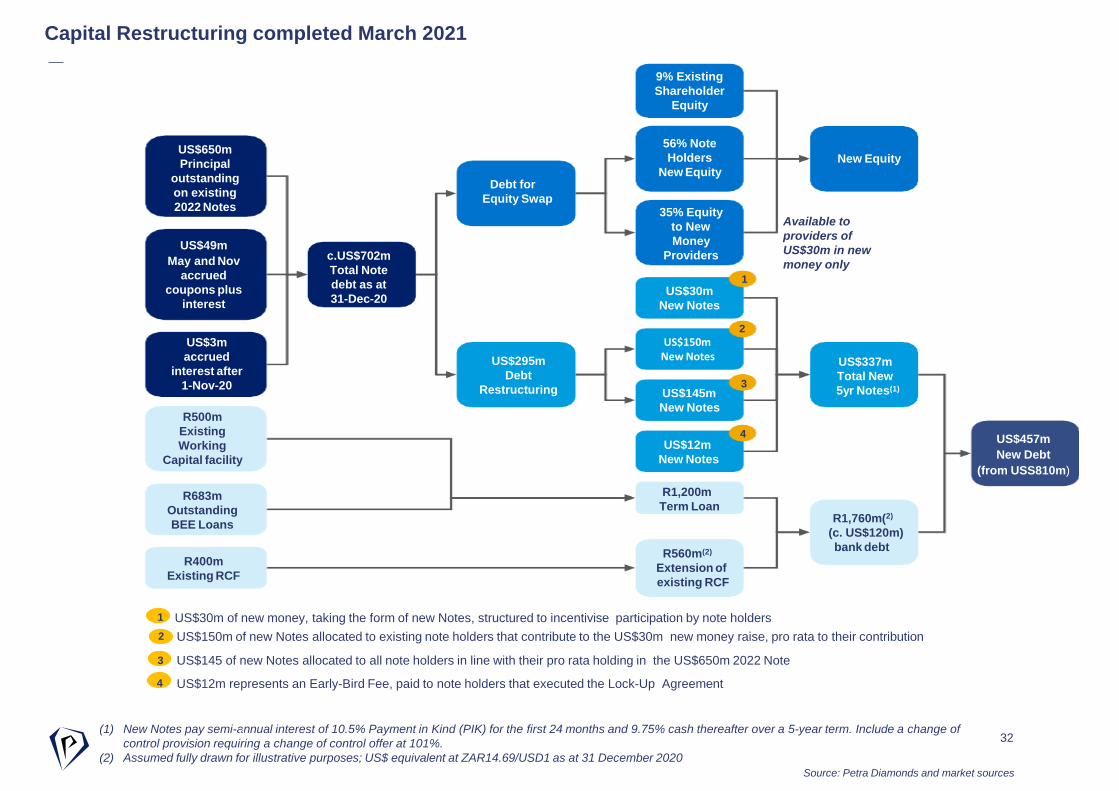
Capital Restructuring completed March 2021
32
USD
USD
ZAR
US$30m of new money, taking the form of new Notes, structured to incentivise participation by note holders
(1) New Notes pay semi-annual interest of 10.5% Payment in Kind (PIK) for the first 24 months and 9.75% cash thereafter over a 5-year term. Include a change of
control provision requiring a change of control offer at 101%.
(2) Assumed fully drawn for illustrative purposes; US$ equivalent at ZAR14.69/USD1 as at 31 December 2020
US$650m
Principal
outstanding
on existing
2022 Notes
US$49m
May and Nov
accrued
coupons plus
interest
US$3m
accrued
interest after
1-Nov-20
c.US$702m
Total Note
debt as at
31-Dec-20
R500m
Existing
Working
Capital facility
R683m
Outstanding
BEE Loans
R400m
Existing RCF
R1,200m
Term Loan
R560m(2)
Extension of
existing RCF
R1,760m(2)
(c. US$120m)
bank debt
US$443m
New Debt
US$295m
Debt
Restructuring
US$150mNewNotes
US$145m
New Notes
US$12m
New Notes
US$337m
Total New
5yr Notes(1)
4
Debt for
Equity Swap
9% Existing
Shareholder
Equity
56% Note
Holders
New EquityNew Equity
2US$150m of new Notes allocated to existing note holders that contribute to the US$30m new money raise, pro rata to their contribution
US$145 of new Notes allocated to all note holders in line with their pro rata holding in the US$650m 2022 Note
US$12m represents an Early-Bird Fee, paid to note holders that executed the Lock-Up Agreement
Available to
providers of
US$30m in new
money only
1
2
3
4
1
2
4
4
35% Equity
to New
Money
Providers
US$30m
New Notes
US$457m
New Debt
(from USS810m)
Source: Petra Diamonds and market sources
3

Board of Directors
33
Peter HillNon-Executive Chairman Appointed January 2020
Nomination (Chair) and Investment (Chair) Committees
Johannes BhattNon-Independent NED
HSE and SED Committees
Varda ShineSenior Independent NED
Remuneration (Chair), Audit & Risk, Nomination, HSE and SED Committees
Jacques BreytenbachFinance Director
Executive and Investment Committees
Richard DuffyChief ExecutiveAppointed April 2019
Executive, HSE, SED and Investment Committees
Matthew GlowaskyNon-Independent NED
Investment Committee
Gordon HamiltonIndependent NED
Audit & Risk (Chair), Nomination,Remuneration and Investment Committees
Octavia MatloaIndependent NED
Audit & Risk, SED (Chair), Remuneration, Nomination and Investment Committees
Bernard PryorIndependent NED
HSE (Chair), Audit & Risk, Remuneration, Nomination and Investment Committees
Alexandra WatsonNon-Independent NED
SED and Investment Committees
Note: Following the completion of the capital restructuring, on 1 July 2021 Marius Kraemer was appointed to the Board as an Observer, having been
nominated by Monarch Master Funding 2 (Luxembourg) S.a.r.l.
Deborah GudgeonIndependent NED
Audit & Risk (Chair-Designate), Remuneration, Nomination and Investment Committees

Our Assets
34
• Achieving steady state production at the end of +10 year heavy capital investment phase
• Petra’s mines produce the full spectrum of diamonds from small stones to the very large, highest quality gemstones across the colour range, from Type II white to yellow, champagne, pink and blue
• ‘Smalls’ (-9 sieve size), account for 45% of production vs. 8-9% of value
Koffiefontein
Acquired July 2007
74% Petra; 26% BEE
Sub-level / Block Cave
Mine Plan to 2024
+20yr Potential Life
Cullinan
Acquired July 2008
74% Petra; 26% BEE
Block Cave
Mine Plan to 2029
+50yr Potential Life
Finsch
Acquired September 2011
74% Petra; 26% BEE
Sub-level / Block Cave
Mine Plan to 2030
+25yr Potential Life
Williamson
Acquired February 2009
75% Petra; 25% Gov of Tanzania
Open Pit
Mine Plan to 2031
+50yr Potential Life
Producing the full spectrum of stones from our diversified portfolio

Iconic Diamonds from Petra’s mines
Petra Diamonds Limited: CEO Presentation 35
The Star of
Josephine
26.6ct rough,
7.0ct polished
Cullinan, 2009
The Golden Jubilee
755.5ct rough,
545.6ct polished
Cullinan, 1986
The Taylor Burton
240.8ct rough,
69.4ct polished
Cullinan, 1966
The Cullinan Heritage
507.5 carats rough
Cullinan, 2009
The Oppenheimer
253.7ct rough
Perfect yellow diamond
Dutoitspan Mine,
Kimberley U/G, 1964
The Cullinan
3,106 carats rough
Largest gem diamond ever discovered
Cullinan, 1905
The Greater Star of
Africa
Largest polished yield
from the Cullinan at
530ct; sits in the Royal
Sceptre
Cullinan, 1905
The Blue Moon
29.6ct rough,12.0ct polished
Cullinan, 2014
The Williamson Pink
55ct rough; 24ct polished;
gifted to Princess Elizabeth
on her engagement
Williamson, 1947

36
Consistent producers of world-class diamonds with exceptional heritage
A Unique Portfolio
The Cullinan Heritage
507.5ct rough, 104ct polished
sold for $35.3m
Cullinan, 2009
The Blue Moon of Josephine
29.6ct rough, 12.0ct polished
Rough sold for $25.5m
($862k/ct) and polished sold for
$48.5m (+$4m/ct = world record)
Cullinan, 2014
The Cullinan Dream
122.5ct rough, 24.1ct polished
Rough sold for $27.6m
Cullinan, 2014
32.3ct pink diamond
sold for $15.0m ($463k/ct)
Williamson, 2016
20.0ct blue diamond
sold for $14.9m ($741k/ct)
Cullinan, 2019
The Legacy of the Cullinan
Diamond Mine
424.8ct rough sold for $15.0m
Cullinan, 2019
The Letlapa Tala Collection
sold for $40.36m
Cullinan, 2020
39.34ct blue diamond
sold for just over $40m
($1,021,357/ct - the highest
price Petra has received for a
singe stone)
Cullinan, 2021
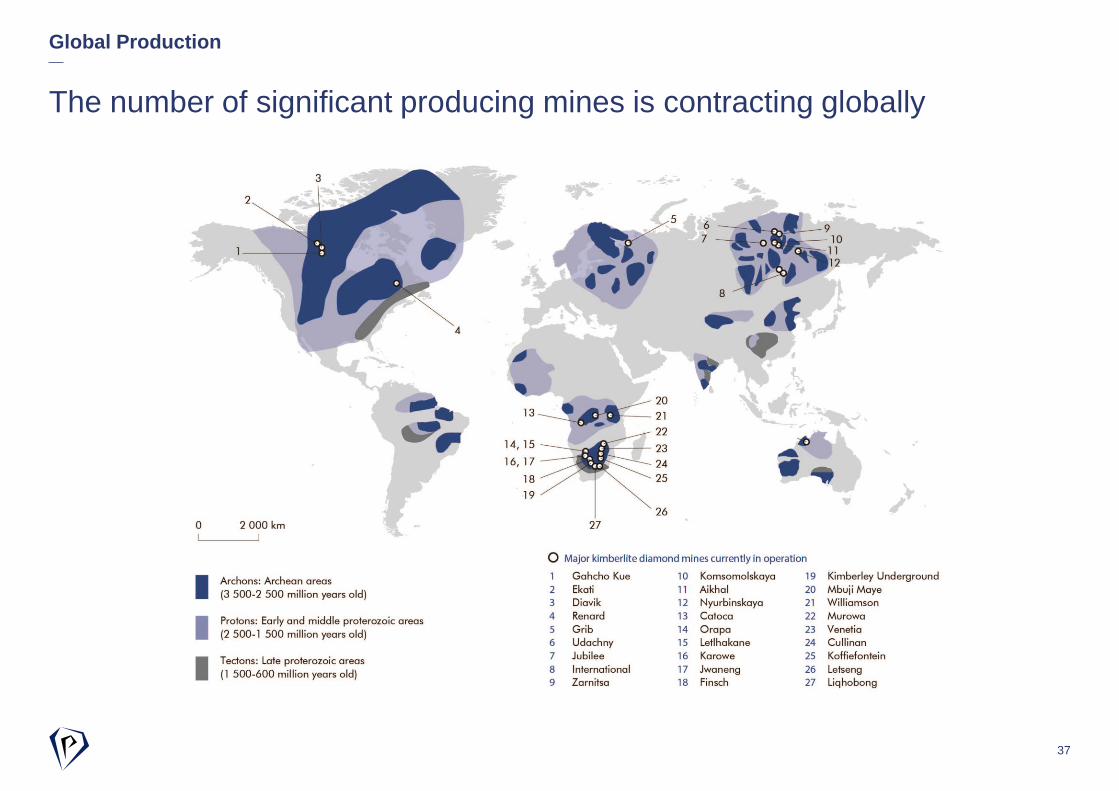
Global Production
37
The number of significant producing mines is contracting globally

Completion of Heavy Capital Intensive Phase
38
• Petra completed a major capital expansion programme across each of its assets in FY 2019 and is now bedding down
steady state production, whilst continuing to invest in life extension projects at CDM (CC1E) and FDM (Block 5)
0
50
100
150
200
250
300
350
2010
2011
2012
2013
2014
2015
2016
2017
2018
2019
2020
2021
2022
US$

10 11 12 13 14 15 16 17 18 19 20
Ju
l 20
19
Au
g 2
019
Se
p 2
019
Oct 2
019
No
v 2
01
9
De
c 2
01
9
Ja
n 2
02
0
Feb
202
0
Ma
r 2
02
0
Ap
r 2
02
0
Ma
y 2
020
Ju
n 2
02
0
Ju
l 20
20
Au
g 2
020
Se
p 2
020
Oct 2
020
No
v 2
02
0
De
c 2
02
0
Ja
n 2
02
1
Feb
202
1
Ma
r 2
02
1
Ap
r 2
02
1
Ma
y 2
021
Ju
n 2
02
1
FY20 – R17.32
Impact of ZAR/USD Movement on Petra
39
90-95%
ZAR
USD
• Exchange rate volatility over the past 24 months:
– ZAR weakness in first half of 2020 impacted by COVID19 and global
sentiment
– ZAR strength / USD weakness experienced over the past 12 months
– FY 2021 closing exchange rate (US$1:ZAR14.27) ca. 17.6% stronger
compared to FY 2020 (US$1:ZAR17.32)
• Increase / decrease of ZAR1 equates to:
– ca. US$8 – 10 million on EBITDA
– ca. US$8 – 10 million on operational FCF
USD:ZAR exchange rate – 1 July 2019 to 30 June 2021
90-95% of operating costs are ZAR denominated*
USD
ZAR
90-95%
90-95% of Capex is ZAR denominated*
USD
USD
ZAR
ZAR
* Impacted by Williamson care & maintenance during H1 FY 21
FY21 Q1 – R16.73
FY21 Q2 – R14.69
FY21 Q3 – R14.77
FY21 Q4 – R14.27

Debt Facilities
40
1 Term Loan amortizes in quarterly instalments and the commitments under the New RCF will also reduce on a quarterly basis, starting from June 2021, over the life of
the facilities.
2 Converted to USD using exchange rate of ZAR14.27/USD1
3 Covenants include a minimum debt service cover ratio (DSCR) of 1.3:1 in addition to a minimum liquidity requirement of ZAR200 million (US$14.0 million) based on
covenant measurement every half year.
4 Maturity date three years from the Restructuring Effective Date for the New Term Loan, New RCF and ancillary facilities being 9 March 2024
New SA Bank debt facilities post restructuring as at 30 June 2021:
Facility TypeSize
ZARM 1Size US$m 2 Utilised at 30
June US$m 2 Covenants 3 Maturity 4
RCF ZAR Revolving credit facility 509.6 35.7 28.0DSCR;
Minimum LiquidityMarch 2024
Term Loan ZAR amortising term loan 1,092 76.5 76.5DSCR;
Minimum Liquidity
March 2024
The Group’s refinanced South African bank facilities comprised a ZAR1.2bn term loan (US$84.1
million) and a ZAR560 million (US$39.2 million) revolving credit facility. As part of the Restructuring, the
BEE partner bank facilities (which comprised the BEE guarantees) were settled by the Group through
proceeds of the ZAR1.2 billion term loan.

Thank you Furtherenquiries:
+44 20 74948203
www.petradiamonds.com