Embed Size (px)
Citation preview
2007 Annual Results2007 Annual Results
2
DisclaimerDisclaimer
This Presentation does not constitute or form part of and should not be construed as, an offer to sell or issue or the solicitation of an offer to buy or acquire securities of OJSC Magnit (the “Company”) or any of its subsidiaries in any jurisdiction or an inducement to enter into investment activity. No part of this Presentation, nor the fact of its distribution, should form the basis of, or be relied on in connection with, any contract or commitment or investment decision whatsoever.
The materials comprised in this Presentation have been prepared solely for use at the Presentation and have not been independently verified. No representation, warranty or undertaking, express or implied, is made as to, and no reliance should be placed on, the fairness, accuracy, completeness or correctness of the information or the opinions contained herein. None of the Company, nor any shareholder of the Company, nor any of its or their affiliates, advisors or representatives shall have any liability whatsoever (in negligence or otherwise) for any loss howsoever arising from any use of this Presentation or its contents or otherwise arising in connection with the Presentation.
This Presentation is directed only at (i) persons outside the United Kingdom, (ii) persons in the United Kingdom falling within Articles 19, 47 and/or 49 of the Financial Services and Markets Act 2000 (Financial Promotion) Order 2005 and only where the conditions contained in these Articles have been, or will at the relevant time be, satisfied.
Neither this Presentation nor any copy of it may be taken or transmitted into the United States of America, its territories or possessions, or distributed, directly or indirectly, in the United States of America, its territories or possessions, except in reliance on an exemption from the registration requirements of the Securities Act of 1933, as amended. Any failure to comply with this restriction may constitute a violation of United States securities laws. The presentation is not an offer of securities for sale in the United States.
Neither this Presentation nor any copy of it may be taken or transmitted into Canada, Australia or Japan or to Canadian persons or to any securities analyst or other person in any of those jurisdictions. Any failure to comply with this restriction may constitute a violation of Australian, Canadian or Japanese securities law. The distribution of this Presentation in other jurisdictions may be restricted by law and persons into whose possession this document comes should inform themselves about, and observe, any such restrictions. The Company has not registered and does not intend to register any of its securities under the applicable securities laws of Canada, Australia or Japan.
This Presentation is not an offer to the public or an advertisement of any securities in the Russian Federation.
This Presentation is not directed to, or intended for distribution to or use by, any person or entity that is a citizen or resident or located in any locality, state, country or other jurisdiction where such distribution, publication, availability or use would be contrary to law or regulation or which would require any registration or licensing within such jurisdiction.
The information contained in this Presentation does not constitute a public offer under any applicable legislation, or an offer to sell or solicitation of an offer to buy any securities.
Matters discussed in this Presentation may constitute forward-looking statements. Forward-looking statements include statements concerning plans, objectives, goals, strategies, future events or performance, and underlying assumptions and other statements, which are other than statements of historical facts. The words “believe,” “expect,” “anticipate,” “intends,” “estimate,” “forecast,” “project,” “will,” “may,” “should” and similar expressions identify forward-looking statements. Forward-looking statements include statements regarding: strategies, outlook and growth prospects; future plans and potential for future growth; liquidity, capital resources and capital expenditures; growth in demand for products; economic outlook and industry trends; developments of markets; the impact of regulatory initiatives; and the strength of competitors.
The forward-looking statements in this Presentation are based upon various assumptions, many of which are based, in turn, upon further assumptions, including without limitation, management’s examination of historical operating trends, data contained in the Company’s records and other data available from third parties. These assumptions are inherently subject to significant uncertainties and contingencies which are difficult or impossible to predict and are beyond its control and it may not achieve or accomplish these expectations, beliefs or projections. In addition, important factors that, in the view of the Company, could cause actual results to differ materially from those discussed in the forward-looking statements include the achievement of the anticipated levels of profitability, growth, cost and its recent acquisitions, the timely development of new projects, the impact of competitive pricing, the ability to obtain necessary regulatory approvals, and the impact of general business and global economic conditions. Past performance should not be taken as an indication or guarantee of future results, and no representation or warranty, express or implied, is made regarding future performance.
Neither the Company, nor any of its agents, employees or advisors intend or have any duty or obligation to supplement, amend, update or revise any of the forward-looking statements contained in this Presentation or to update or to keep current any other information contained in this Presentation. The information and opinions contained in this document are provided as at the date of this Presentation and are subject to change without notice.
By viewing this Presentation, you acknowledge and agree to be bound by the foregoing.
3
Table of ContentsTable of Contents
1.1. IntroductionIntroduction
2.2. Business OverviewBusiness Overview-- Convenience FormatConvenience Format-- Hypermarket FormatHypermarket Format-- General OverviewGeneral Overview
3.3. Financial OverviewFinancial Overview
4.4. Summary ConclusionsSummary Conclusions
4
Our HistoryOur History
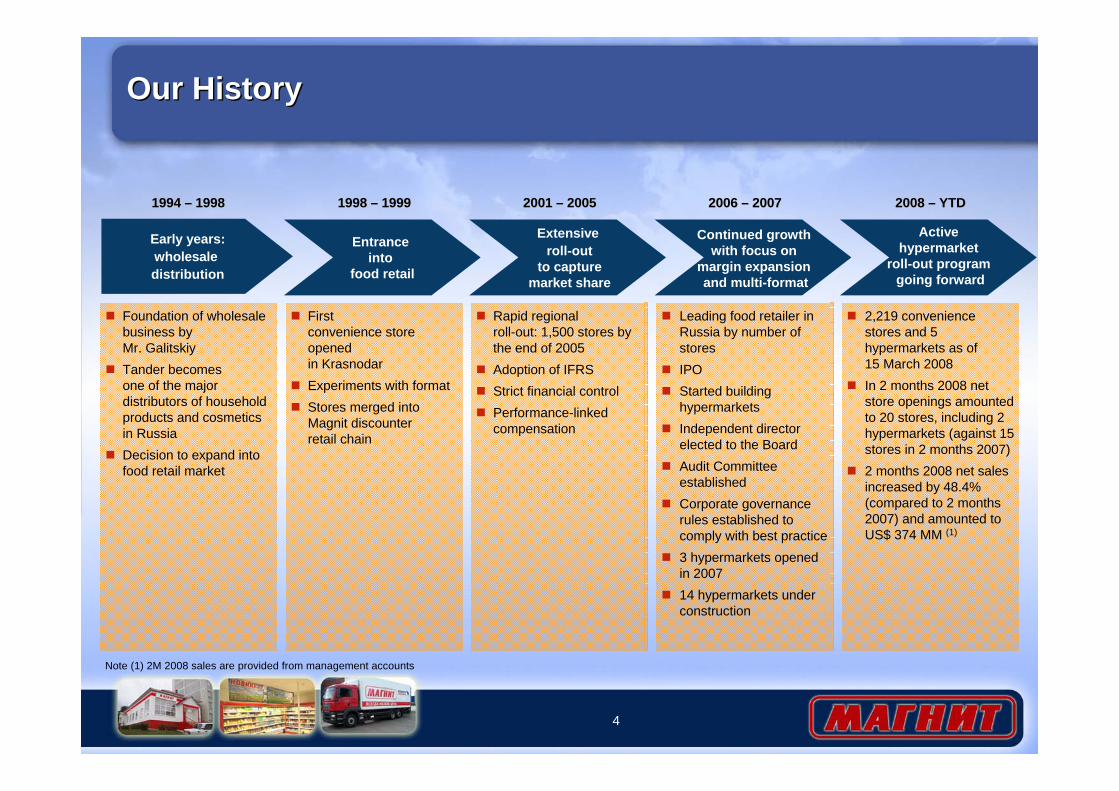
Foundation of wholesale business by Mr. GalitskiyTander becomesone of the major distributors of household products and cosmetics in RussiaDecision to expand into food retail market
1994 1994 –– 19981998
Early years:wholesale distribution
Firstconvenience store opened in KrasnodarExperiments with formatStores merged into Magnit discounter retail chain
1998 1998 –– 19991999
Entrance into
food retail
Rapid regionalroll-out: 1,500 stores by the end of 2005Adoption of IFRSStrict financial controlPerformance-linked compensation
2001 2001 –– 20052005
Extensive roll-out
to capturemarket share
Leading food retailer in Russia by number of storesIPOStarted building hypermarketsIndependent director elected to the BoardAudit Committee establishedCorporate governance rules established to comply with best practice3 hypermarkets openedin 200714 hypermarkets under construction
2006 2006 –– 20072007
Continued growth with focus on
margin expansion and multi-format
2,219 convenience stores and 5 hypermarkets as of 15 March 2008In 2 months 2008 net store openings amounted to 20 stores, including 2 hypermarkets (against 15 stores in 2 months 2007)2 months 2008 net sales increased by 48.4% (compared to 2 months 2007) and amounted to US$ 374 MM (1)
2008 2008 –– YTDYTD
Active hypermarket
roll-out program going forward
Note (1) 2M 2008 sales are provided from management accounts
5
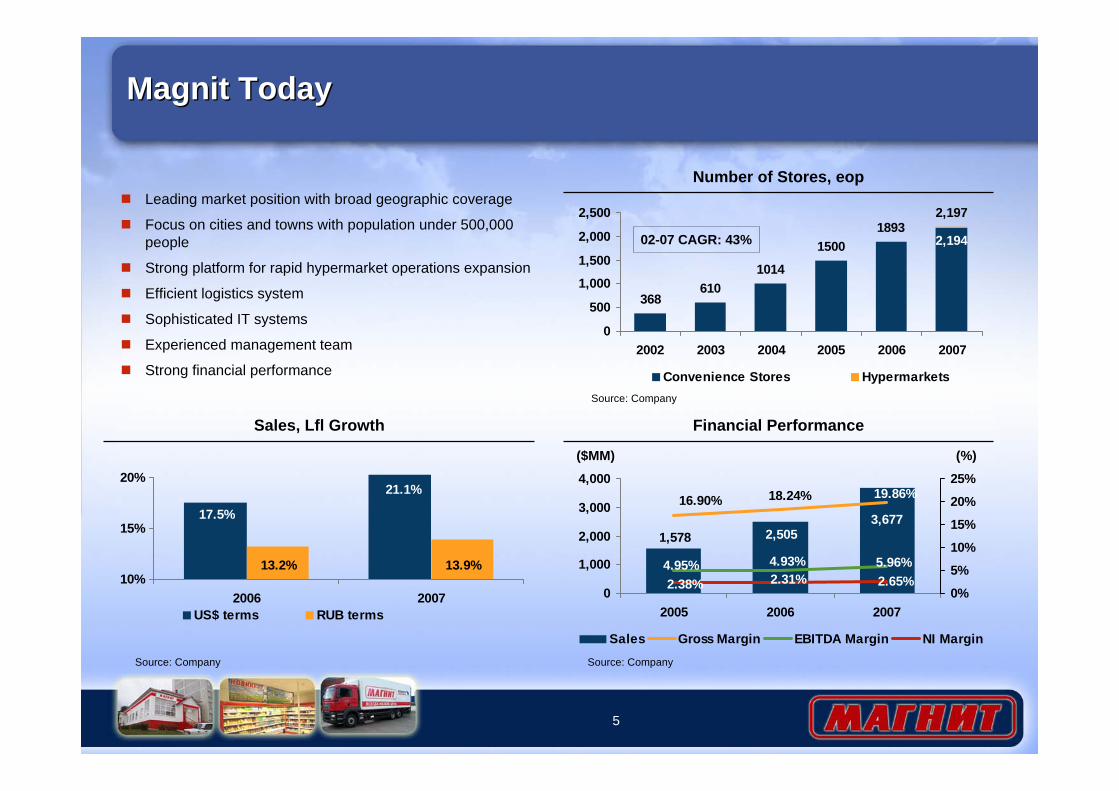
Magnit TodayMagnit Today
Leading market position with broad geographic coverage
Focus on cities and towns with population under 500,000 people
Strong platform for rapid hypermarket operations expansion
Efficient logistics system
Sophisticated IT systems
Experienced management team
Strong financial performance
Number of Stores, eop
2,194
2,1971893
1500
1014610
368
0
500
1,000
1,500
2,000
2,500
2002 2003 2004 2005 2006 2007
Convenience Stores Hypermarkets
Financial Performance
3,6772,5051,578
19.86%18.24%16.90%
5.96%4.93%4.95%2.65%2.31%2.38%
0
1,000
2,000
3,000
4,000
2005 2006 20070%
5%
10%
15%
20%
25%
Sales Gross Margin EBITDA Margin NI Margin
($MM) (%)
Source: Company Source: Company
Source: Company
02-07 CAGR: 43%
Sales, Lfl Growth
21.1%
17.5%
13.9%13.2%10%
15%
20%
2006 2007US$ terms RUB terms
6
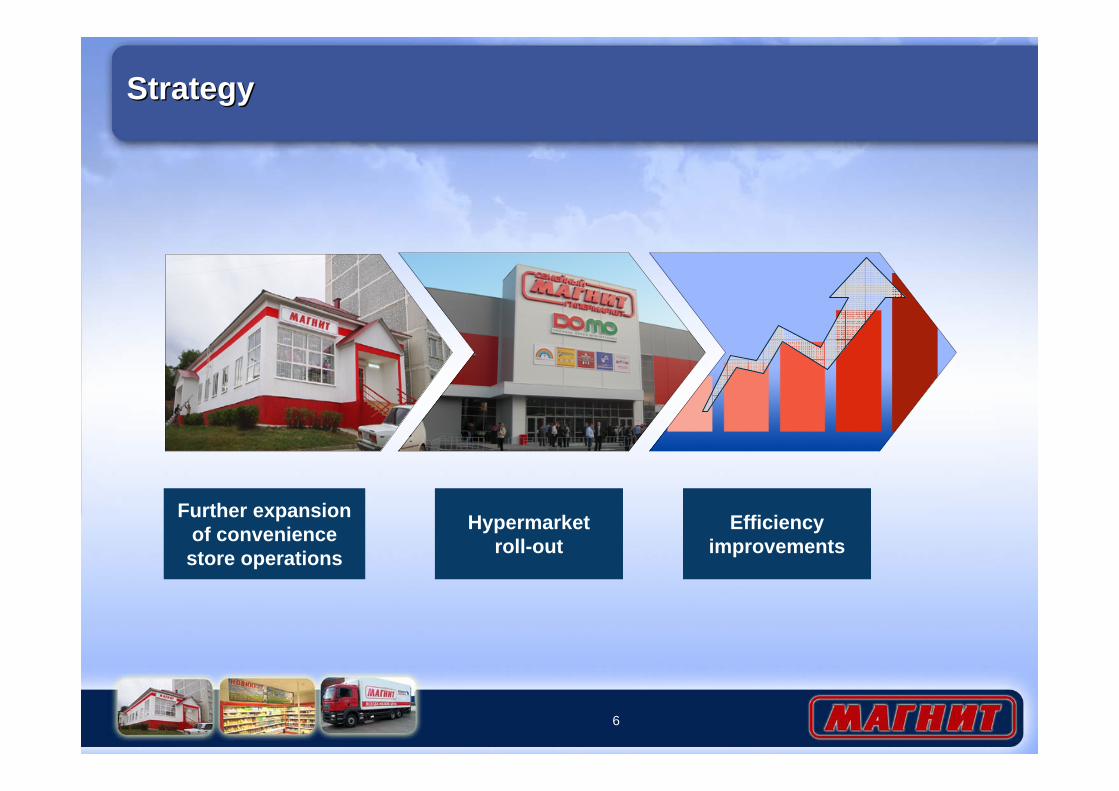
Further expansionof convenience
store operations
StrategyStrategy
Hypermarketroll-out
Efficiency improvements
7
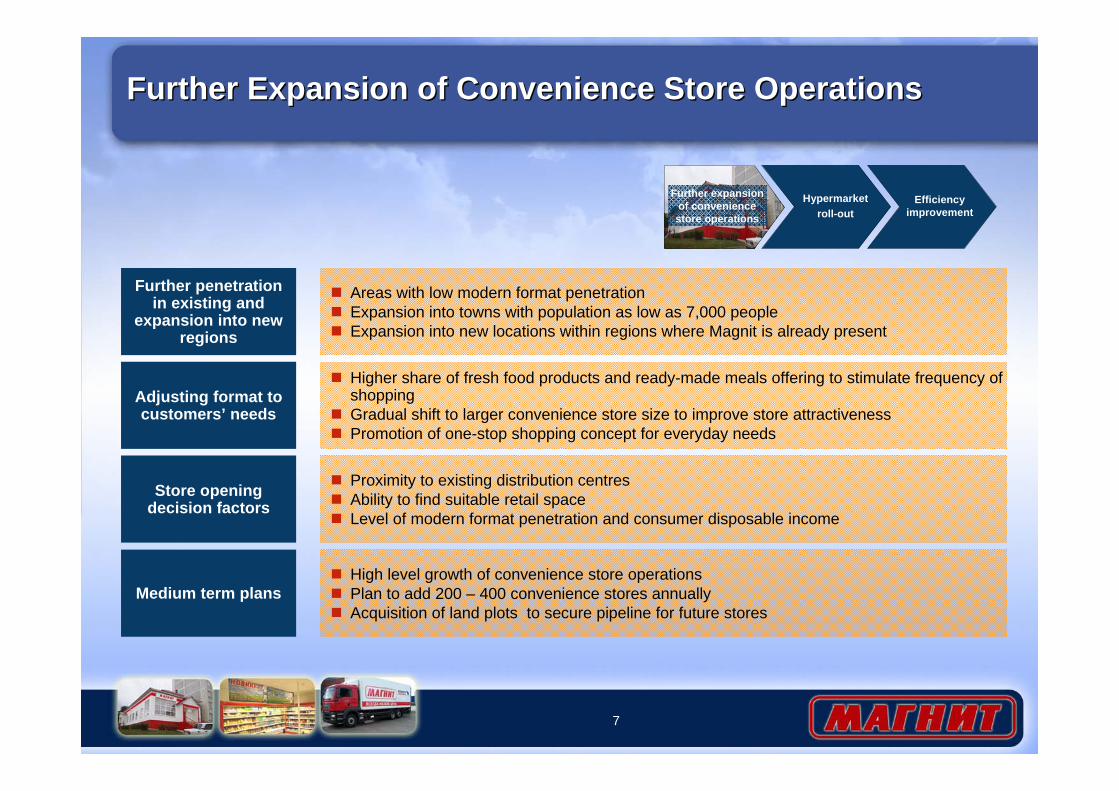
Medium term plansHigh level growth of convenience store operationsPlan to add 200 – 400 convenience stores annuallyAcquisition of land plots to secure pipeline for future stores
Store opening decision factors
Proximity to existing distribution centresAbility to find suitable retail spaceLevel of modern format penetration and consumer disposable income
Further Expansion of Convenience Store OperationsFurther Expansion of Convenience Store Operations
Further penetration in existing and
expansion into new regions
Areas with low modern format penetrationExpansion into towns with population as low as 7,000 peopleExpansion into new locations within regions where Magnit is already present
Further expansion of convenience store operations
Hypermarketroll-out
Efficiency improvement
Adjusting format to customers’ needs
Higher share of fresh food products and ready-made meals offering to stimulate frequency of shopping Gradual shift to larger convenience store size to improve store attractivenessPromotion of one-stop shopping concept for everyday needs
8
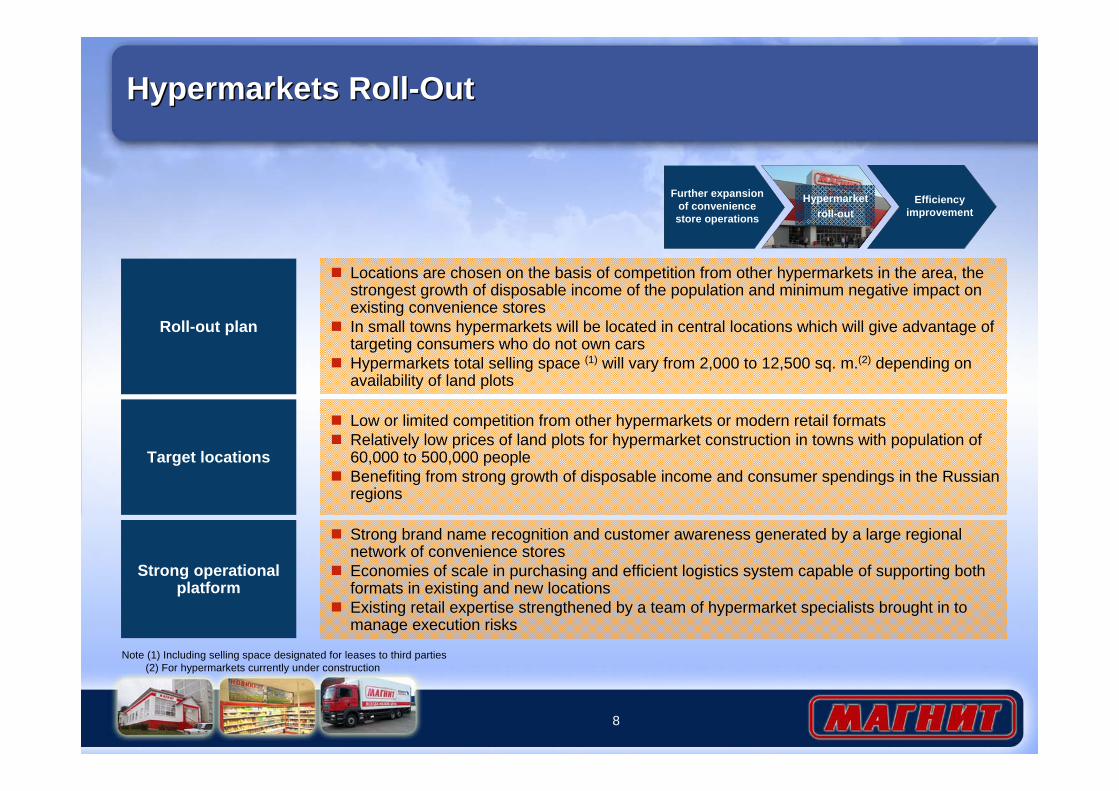
Strong operational platform
Strong brand name recognition and customer awareness generated by a large regional network of convenience storesEconomies of scale in purchasing and efficient logistics system capable of supporting both formats in existing and new locationsExisting retail expertise strengthened by a team of hypermarket specialists brought in to manage execution risks
Target locations
Low or limited competition from other hypermarkets or modern retail formatsRelatively low prices of land plots for hypermarket construction in towns with population of 60,000 to 500,000 peopleBenefiting from strong growth of disposable income and consumer spendings in the Russian regions
Hypermarkets Roll-OutHypermarkets Roll-Out
Roll-out plan
Locations are chosen on the basis of competition from other hypermarkets in the area, the strongest growth of disposable income of the population and minimum negative impact on existing convenience storesIn small towns hypermarkets will be located in central locations which will give advantage of targeting consumers who do not own carsHypermarkets total selling space (1) will vary from 2,000 to 12,500 sq. m.(2) depending on availability of land plots
Further expansion of convenience store operations
Hypermarketroll-out
Efficiency improvement
Note (1) Including selling space designated for leases to third parties (2) For hypermarkets currently under construction
9
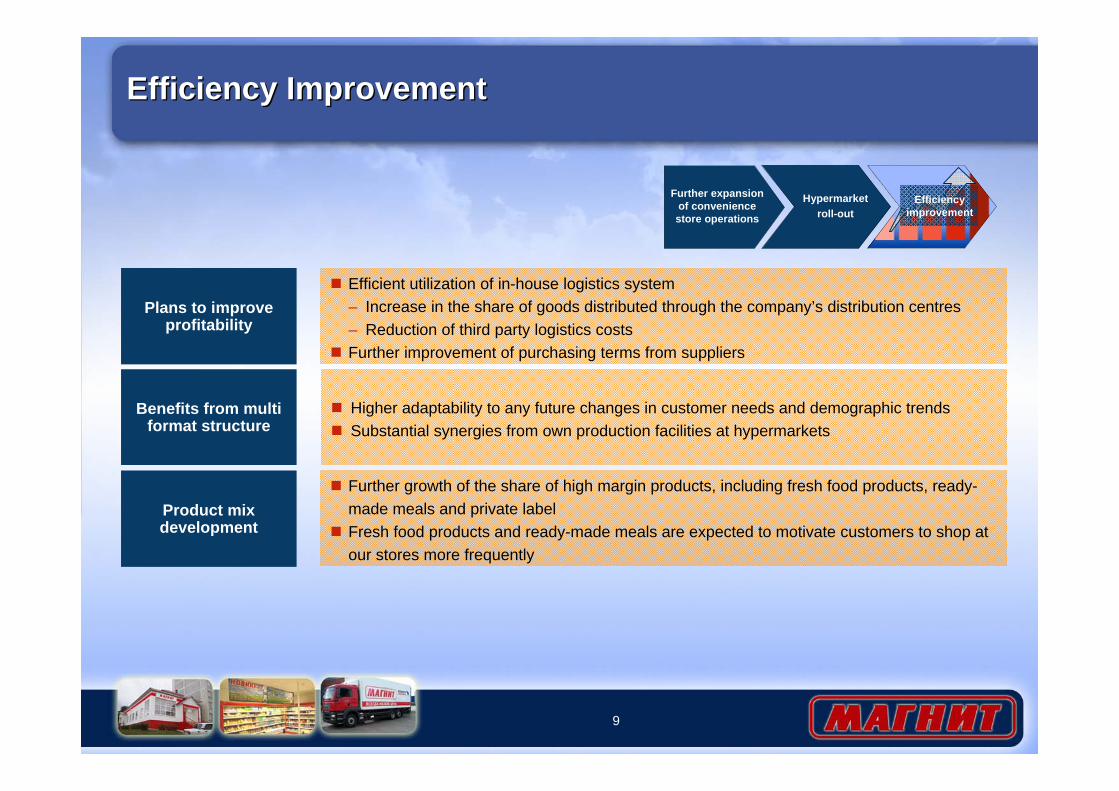
Product mix development
Further growth of the share of high margin products, including fresh food products, ready-made meals and private labelFresh food products and ready-made meals are expected to motivate customers to shop at our stores more frequently
Efficiency ImprovementEfficiency Improvement
Benefits from multi format structure
Higher adaptability to any future changes in customer needs and demographic trendsSubstantial synergies from own production facilities at hypermarkets
Further expansion of convenience store operations
Hypermarketroll-out
Efficiency improvement
Plans to improve profitability
Efficient utilization of in-house logistics system– Increase in the share of goods distributed through the company’s distribution centres– Reduction of third party logistics costsFurther improvement of purchasing terms from suppliers

Business OverviewBusiness Overview
11
A Shift to Multi FormatA Shift to Multi Format
HypermarketConvenience Store
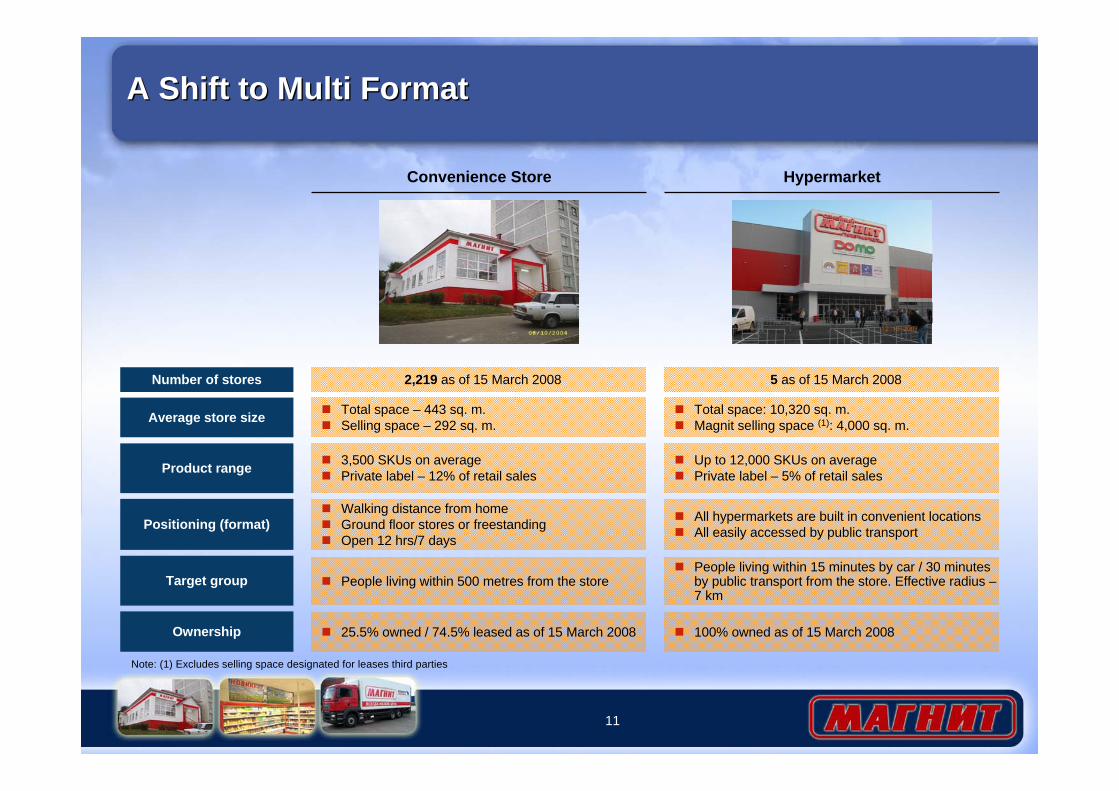
Number of stores 2,219 as of 15 March 2008 5 as of 15 March 2008
Average store size Total space – 443 sq. m.Selling space – 292 sq. m.
Total space: 10,320 sq. m.Magnit selling space (1): 4,000 sq. m.
Product range 3,500 SKUs on averagePrivate label – 12% of retail sales
Up to 12,000 SKUs on averagePrivate label – 5% of retail sales
Positioning (format)Walking distance from homeGround floor stores or freestandingOpen 12 hrs/7 days
All hypermarkets are built in convenient locationsAll easily accessed by public transport
Target group People living within 500 metres from the storePeople living within 15 minutes by car / 30 minutes by public transport from the store. Effective radius –7 km
Ownership 25.5% owned / 74.5% leased as of 15 March 2008 100% owned as of 15 March 2008
Note: (1) Excludes selling space designated for leases third parties

Convenience FormatConvenience Format
13
Format DescriptionFormat Description
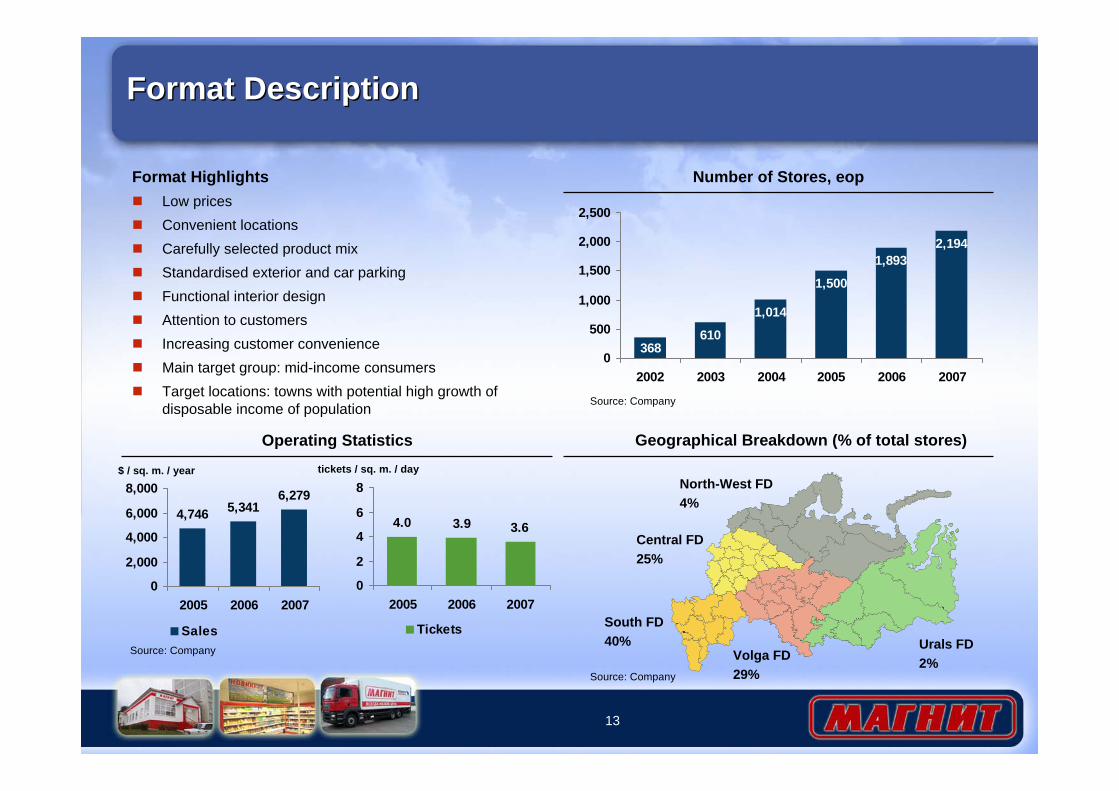
Format HighlightsLow pricesConvenient locationsCarefully selected product mixStandardised exterior and car parkingFunctional interior designAttention to customersIncreasing customer convenienceMain target group: mid-income consumersTarget locations: towns with potential high growth of disposable income of population
Geographical Breakdown (% of total stores)
South FD40% Urals FD
2%Volga FD29%
Central FD25%
North-West FD4%
Number of Stores, eop
610
1,014
1,500
1,8932,194
3680
500
1,000
1,500
2,000
2,500
2002 2003 2004 2005 2006 2007
Operating Statistics
4,746 5,3416,279
0
2,000
4,000
6,000
8,000
2005 2006 2007
Sales
3.63.94.0
0
2
4
6
8
2005 2006 2007
Tickets
$ / sq. m. / year
Source: Company
Source: Company
Source: Company
tickets / sq. m. / day
14
Typical Store Opening ProcessTypical Store Opening Process
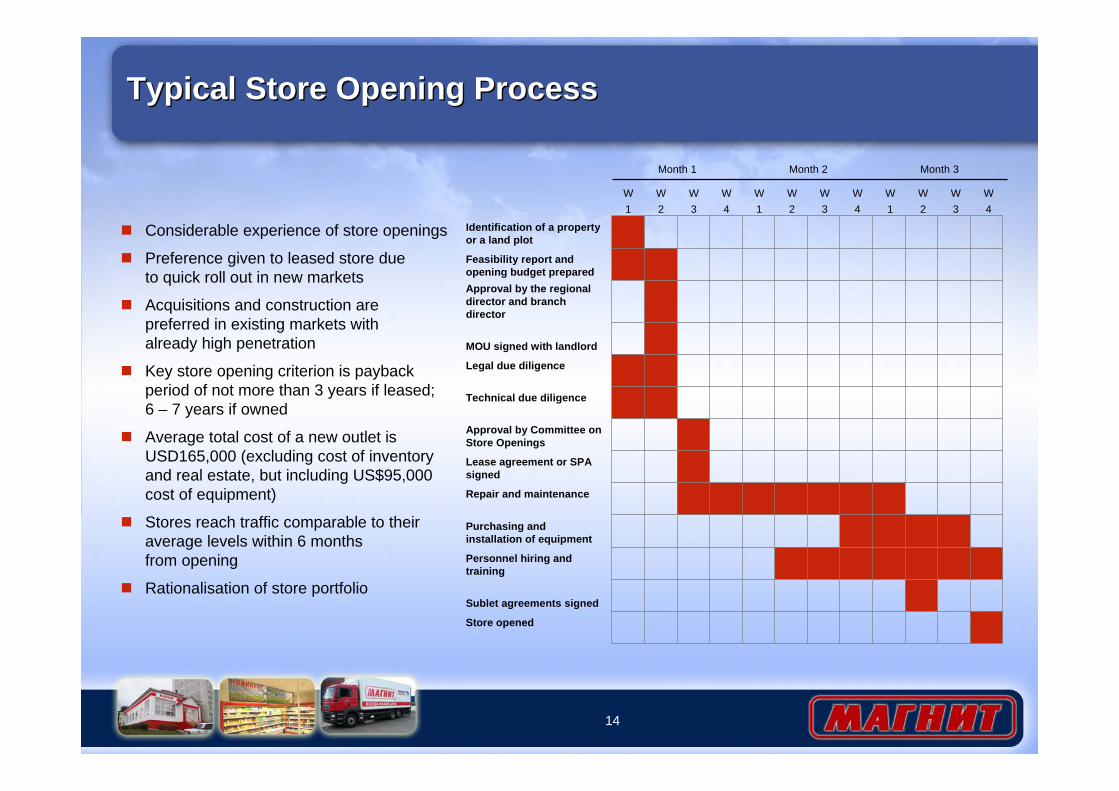
Considerable experience of store openings
Preference given to leased store due to quick roll out in new markets
Acquisitions and construction are preferred in existing markets with already high penetration
Key store opening criterion is payback period of not more than 3 years if leased; 6 – 7 years if owned
Average total cost of a new outlet is USD165,000 (excluding cost of inventory and real estate, but including US$95,000 cost of equipment)
Stores reach traffic comparable to their average levels within 6 months from opening
Rationalisation of store portfolio
Approval by Committee on Store Openings
MOU signed with landlord
Store opened
Sublet agreements signed
Personnel hiring and training
Purchasing and installation of equipment
Repair and maintenance
Lease agreement or SPA signed
Technical due diligence
Legal due diligence
Approval by the regional director and branch director
Feasibility report and opening budget prepared
Identification of a property or a land plot
W1
W2
W3
W4
W1
W2
W3
W4
W1
W2
W3
W4
Month 1 Month 2 Month 3
15
Store Opening DynamicsStore Opening Dynamics
486
64
550
1,500
8
61
368
379
684
2005
393
120
513
1,893
29
84
536
461
783
2006
304
108
412
2,197
45
89
628
546
889
2007
3417Closings
Net openings
New openings
Total
Urals
North West
Volga
Central
Southern
242
259
610
9
114
100
387
2003
404
438
1,014
26
214
224
550
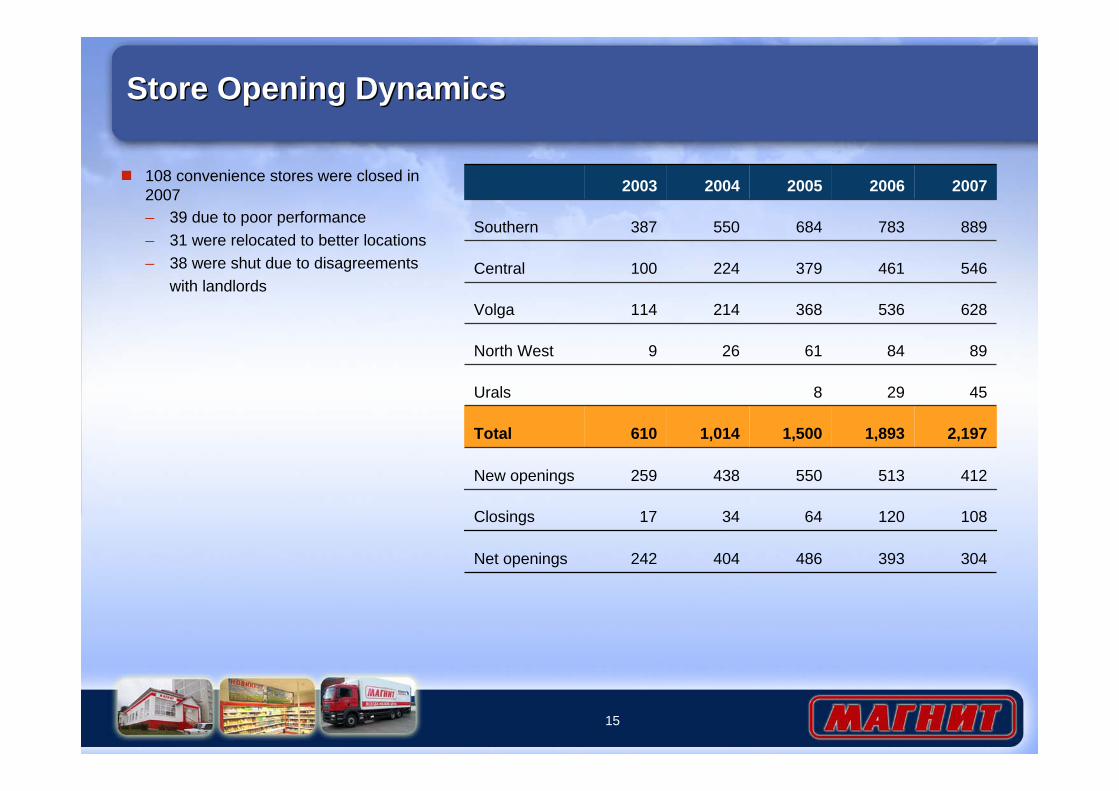
2004108 convenience stores were closed in 2007– 39 due to poor performance– 31 were relocated to better locations– 38 were shut due to disagreements
with landlords
16
Store Ownership StructureStore Ownership Structure
25.5%
74.5%
Owned Leased
Store Ownership StructureLease Maturity Profile
44%
27%
12%
17%
1 year 1-3 years3-5 years over 5 years
Source: Company Source: Company as of 15 March 2008
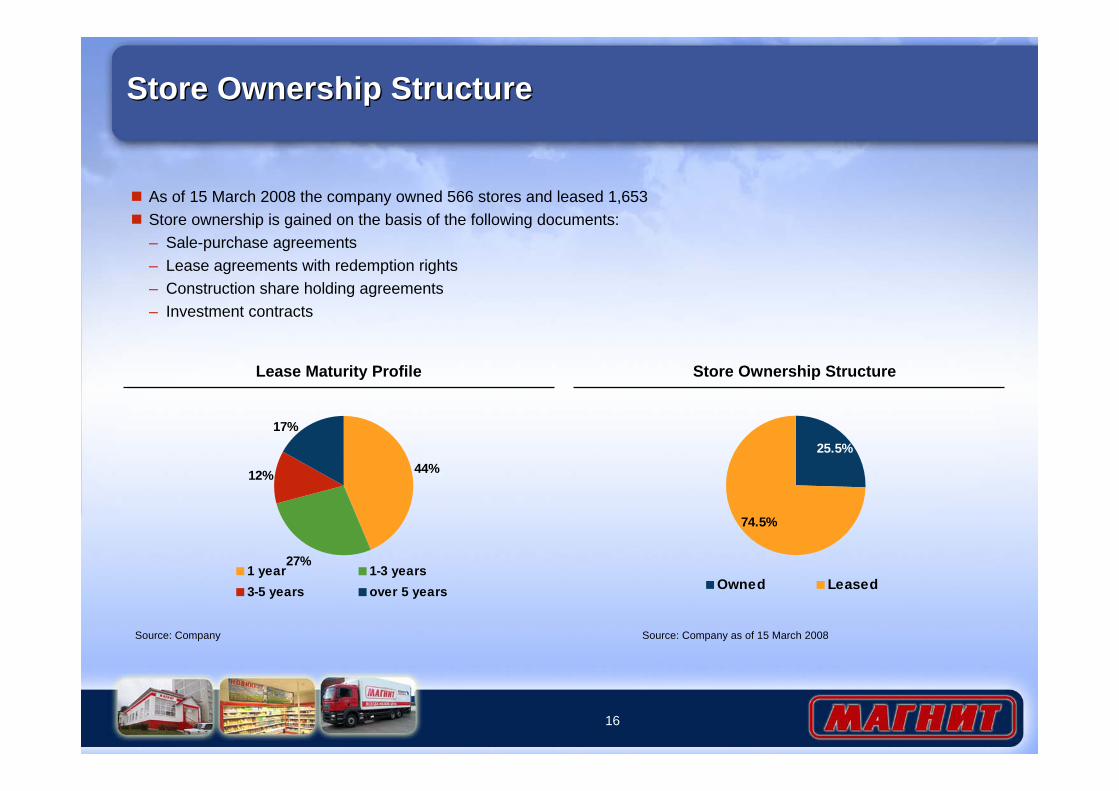
As of 15 March 2008 the company owned 566 stores and leased 1,653Store ownership is gained on the basis of the following documents:– Sale-purchase agreements– Lease agreements with redemption rights– Construction share holding agreements– Investment contracts
17
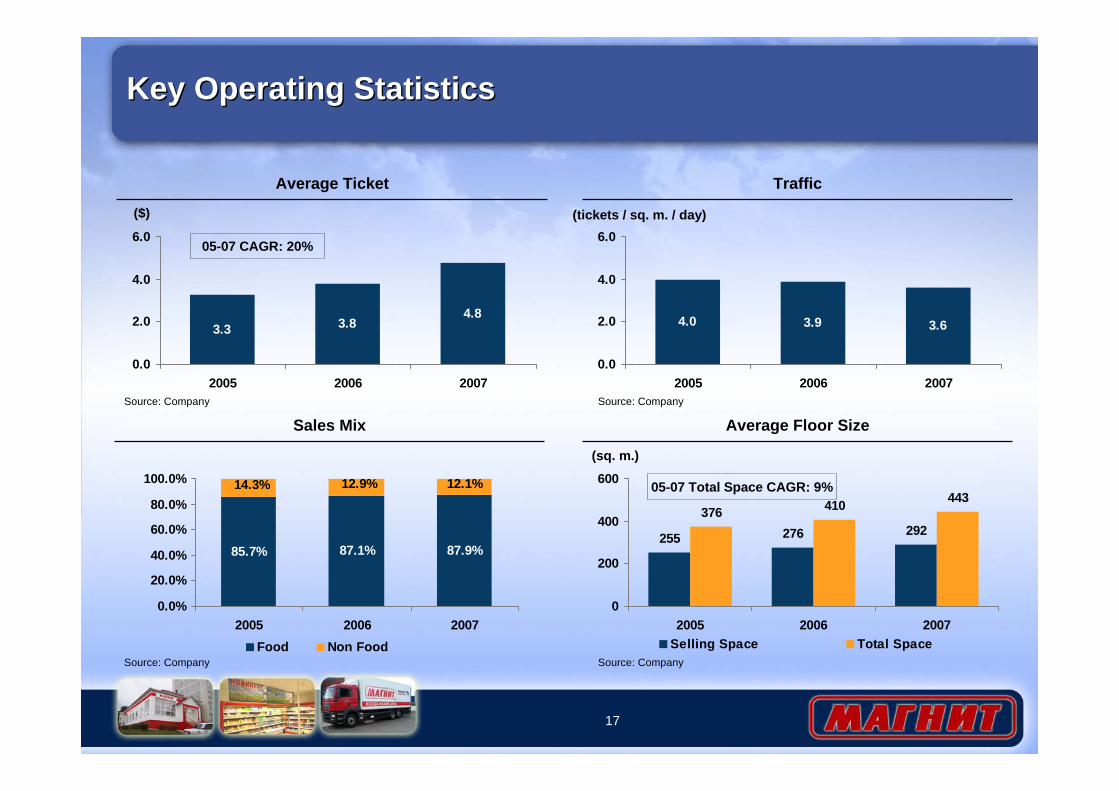
87.9%87.1%85.7%
12.9%14.3% 12.1%
0.0%
20.0%
40.0%
60.0%
80.0%
100.0%
2005 2006 2007Food Non Food
Key Operating StatisticsKey Operating Statistics
Sales Mix
Average Ticket
3.3 3.84.8
0.0
2.0
4.0
6.0
2005 2006 2007
($)
Traffic
4.0 3.9 3.6
0.0
2.0
4.0
6.0
2005 2006 2007
Average Floor Size
255 276 292376 410 443
0
200
400
600
2005 2006 2007Selling Space Total Space
Source: Company
Source: Company
Source: Company
Source: Company
(tickets / sq. m. / day)
(sq. m.)
05-07 CAGR: 20%
05-07 Total Space CAGR: 9%
18
Lfl Sales AnalysisLfl Sales Analysis
Average Ticket, Lfl
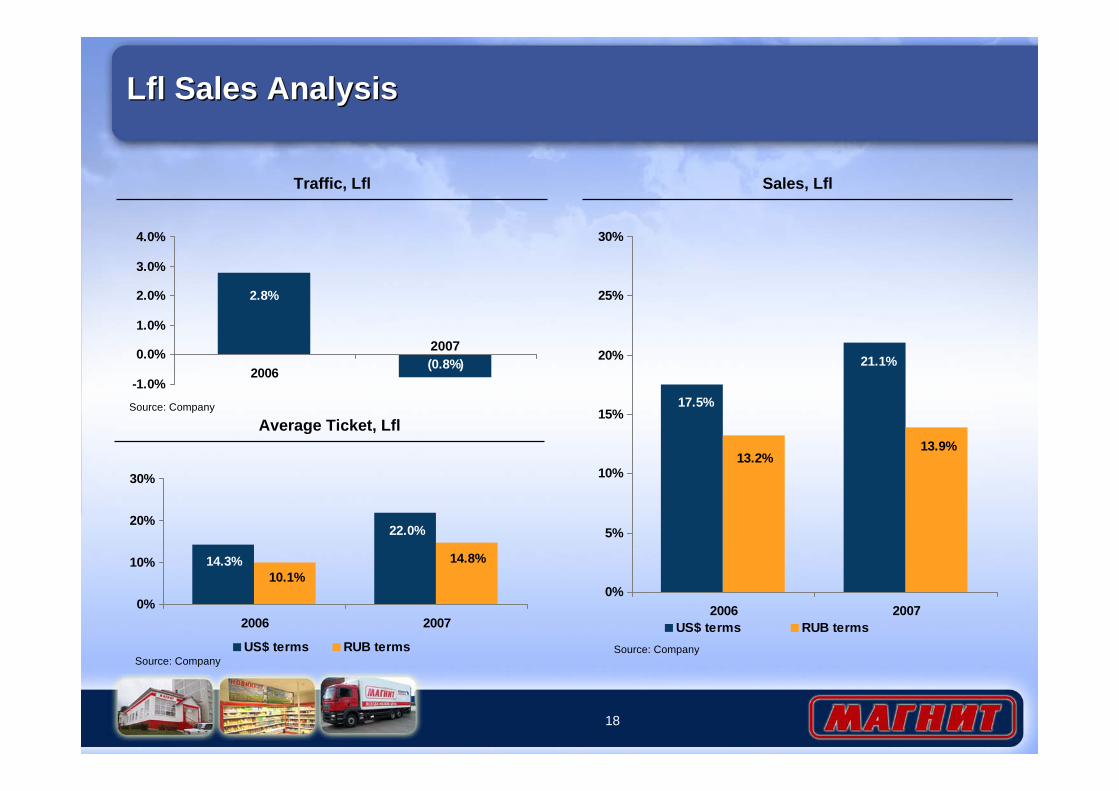
22.0%
14.3% 14.8%10.1%
0%
10%
20%
30%
2006 2007
US$ terms RUB terms
Traffic, Lfl
2.8%
(0.8%)-1.0%
0.0%
1.0%
2.0%
3.0%
4.0%
2006
Sales, Lfl
21.1%
17.5%
13.9%13.2%
0%
5%
10%
15%
20%
25%
30%
2006 2007US$ terms RUB terms
2007
Source: Company
Source: Company
Source: Company
Hypermarket FormatHypermarket Format
20
Format DescriptionFormat Description
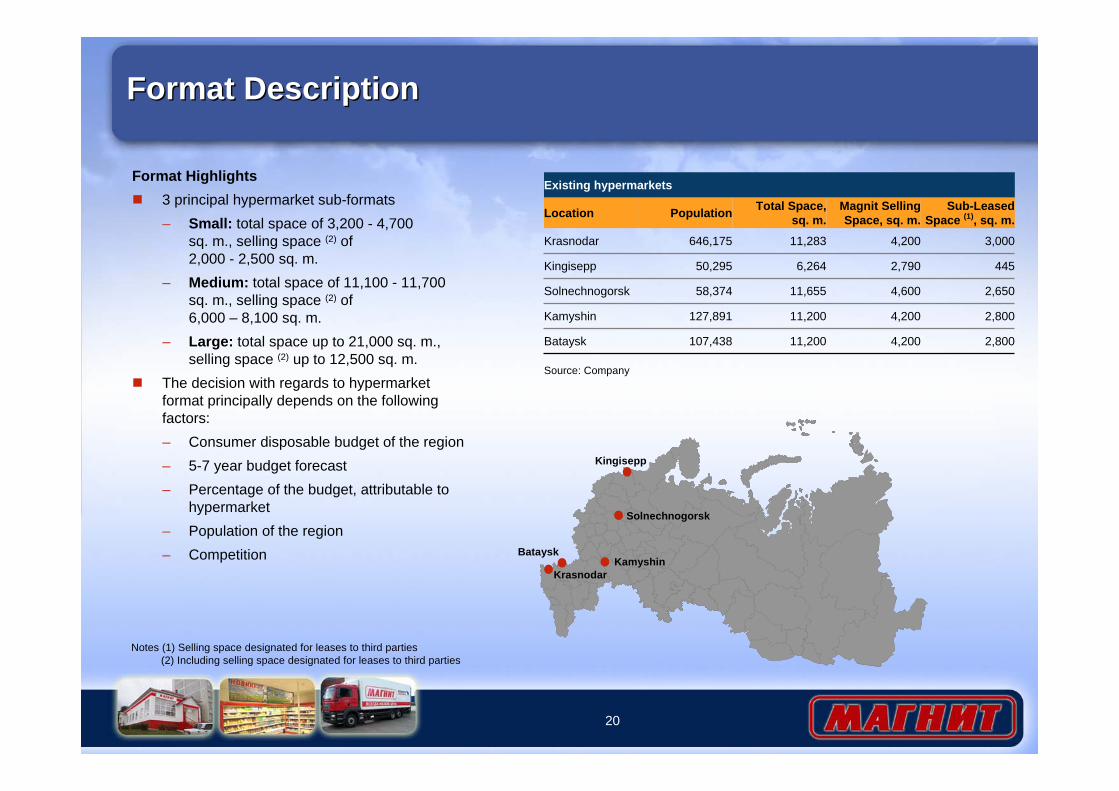
Format Highlights3 principal hypermarket sub-formats– Small: total space of 3,200 - 4,700
sq. m., selling space (2) of 2,000 - 2,500 sq. m.
– Medium: total space of 11,100 - 11,700 sq. m., selling space (2) of6,000 – 8,100 sq. m.
– Large: total space up to 21,000 sq. m., selling space (2) up to 12,500 sq. m.
The decision with regards to hypermarket format principally depends on the following factors:– Consumer disposable budget of the region– 5-7 year budget forecast– Percentage of the budget, attributable to
hypermarket– Population of the region– Competition
Krasnodar
Solnechnogorsk
Kingisepp
KamyshinBataysk
Source: Company
Notes (1) Selling space designated for leases to third parties(2) Including selling space designated for leases to third parties
2,8004,20011,200107,438Bataysk
2,8004,20011,200127,891Kamyshin
2,6504,60011,65558,374Solnechnogorsk
4452,7906,26450,295Kingisepp
3,0004,20011,283646,175Krasnodar
Sub-Leased Space (1), sq. m.
Magnit Selling Space, sq. m.
Total Space,sq. m.PopulationLocation
Existing hypermarkets
21
Typical Store Opening ProcessTypical Store Opening Process
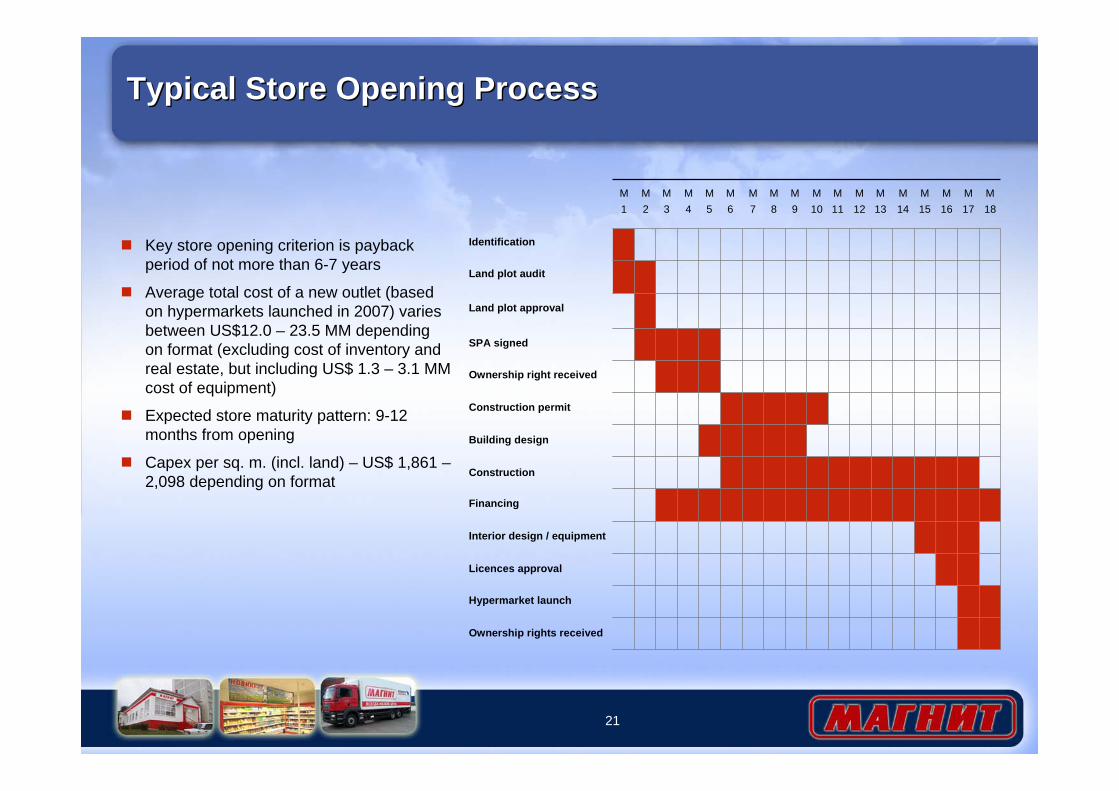
M1
M2
M3
M4
M5
M6
M7
M8
M9
M10
M11
M12
M13
M14
M15
M16
M17
M18
Identification
Land plot audit
Land plot approval
SPA signed
Ownership right received
Construction permit
Building design
Construction
Financing
Interior design / equipment
Licences approval
Hypermarket launch
Ownership rights received
Key store opening criterion is payback period of not more than 6-7 years
Average total cost of a new outlet (based on hypermarkets launched in 2007) varies between US$12.0 – 23.5 MM depending on format (excluding cost of inventory and real estate, but including US$ 1.3 – 3.1 MM cost of equipment)
Expected store maturity pattern: 9-12 months from opening
Capex per sq. m. (incl. land) – US$ 1,861 –2,098 depending on format
General OverviewGeneral Overview
23
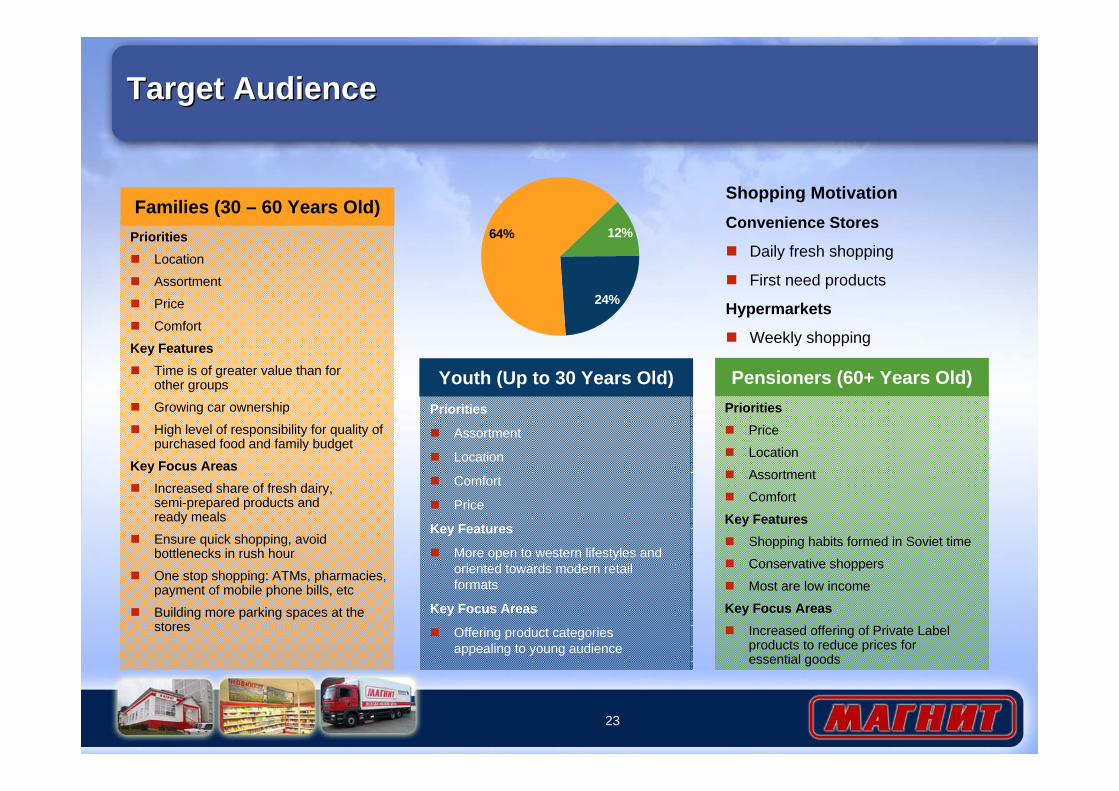
PrioritiesPrice
Location
Assortment
Comfort
Key FeaturesShopping habits formed in Soviet time
Conservative shoppers
Most are low income
Key Focus AreasIncreased offering of Private Label products to reduce prices foressential goods
Pensioners (60+ Years Old)Priorities
Assortment
Location
Comfort
Price
Key Features
More open to western lifestyles and oriented towards modern retail formats
Key Focus Areas
Offering product categories appealing to young audience
Youth (Up to 30 Years Old)
Target AudienceTarget Audience
PrioritiesLocation
Assortment
Price
Comfort
Key FeaturesTime is of greater value than forother groups
Growing car ownership
High level of responsibility for quality of purchased food and family budget
Key Focus AreasIncreased share of fresh dairy,semi-prepared products andready meals
Ensure quick shopping, avoid bottlenecks in rush hour
One stop shopping: ATMs, pharmacies, payment of mobile phone bills, etc
Building more parking spaces at the stores
Families (30 – 60 Years Old)64% 12%
24%
Shopping MotivationConvenience Stores
Daily fresh shopping
First need products
Hypermarkets
Weekly shopping
24
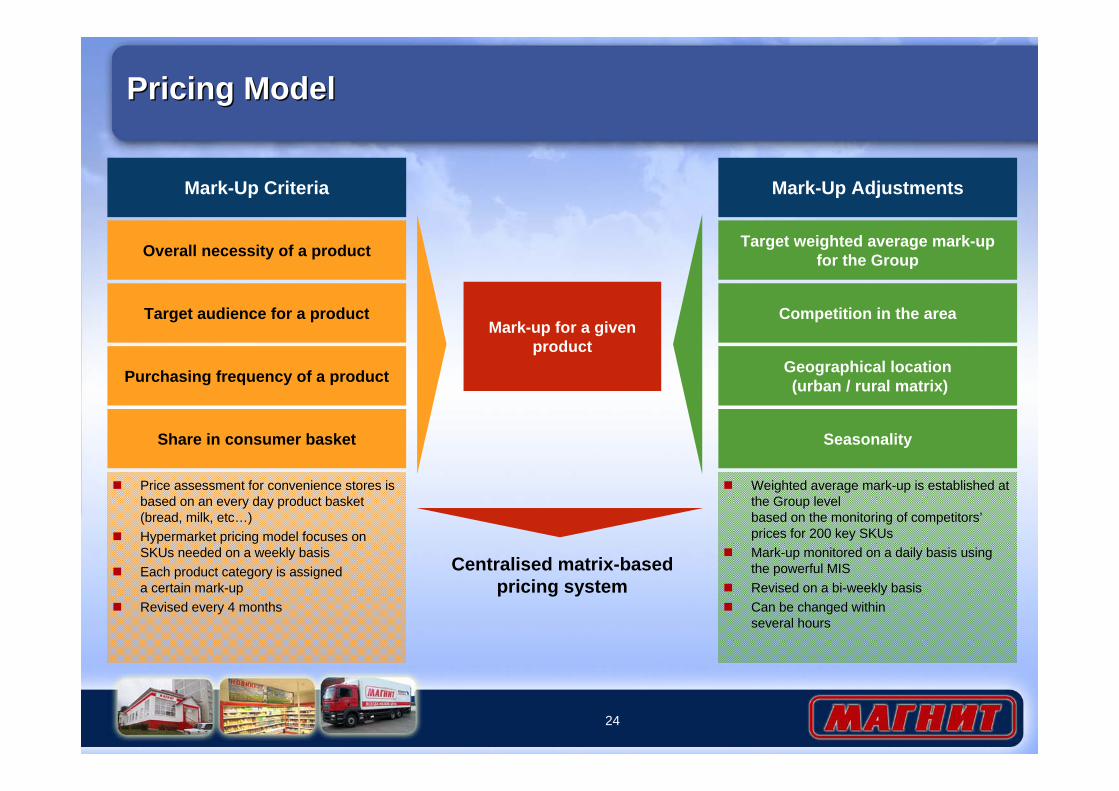
Mark-up for a given product
Overall necessity of a product
Target audience for a product
Purchasing frequency of a product
Share in consumer basket
Target weighted average mark-up for the Group
Competition in the area
Geographical location(urban / rural matrix)
Mark-Up Criteria
Price assessment for convenience stores is based on an every day product basket (bread, milk, etc…)Hypermarket pricing model focuses on SKUs needed on a weekly basis Each product category is assigneda certain mark-upRevised every 4 months
Weighted average mark-up is established at the Group levelbased on the monitoring of competitors’prices for 200 key SKUs Mark-up monitored on a daily basis using the powerful MISRevised on a bi-weekly basisCan be changed within several hours
Mark-Up Adjustments
Seasonality
Centralised matrix-basedpricing system
Pricing ModelPricing Model

25
Suppliers, Purchasing and Private LabelSuppliers, Purchasing and Private Label
Share of Private Label Products in Revenue(%)
162 265508 551
700
460
200
400
600
800
2002 2003 2004 2005 2006 20070
3
6
9
12
15
Number of Items Share in Retail Sales
Magnit is the largest buyer for many domestic and international FMCG producers
Weekly Assortment Committee approves the assortment and suppliersDirect purchasing and delivery contractsEconomies of scale and wide geographical presence enable low prices and favorable contract terms– Volume discounts– Compensation of external and internal logistics costs– Average credit term in 2007 was 45 days and could
be up to 60 days– Contract term is typically 1-year– Often can be unilaterally terminated by Magnit with
no penaltiesSupplier bonuses criteria is based on– Meeting sales targets– Store promotions– Loyalty
Private label products are designed to replace the cheapest SKUs to maximise returns on each metre of shelving space
700 private label SKUsPrivate label products accounted for 12% share of retail revenue in 2007 and 20% of total SKUsApproximately 85% of private label products are foodShare of non-food products in private label is expected to increase
Source: Company
26
2006-2007 IT Systems Update2006-2007 IT Systems Update
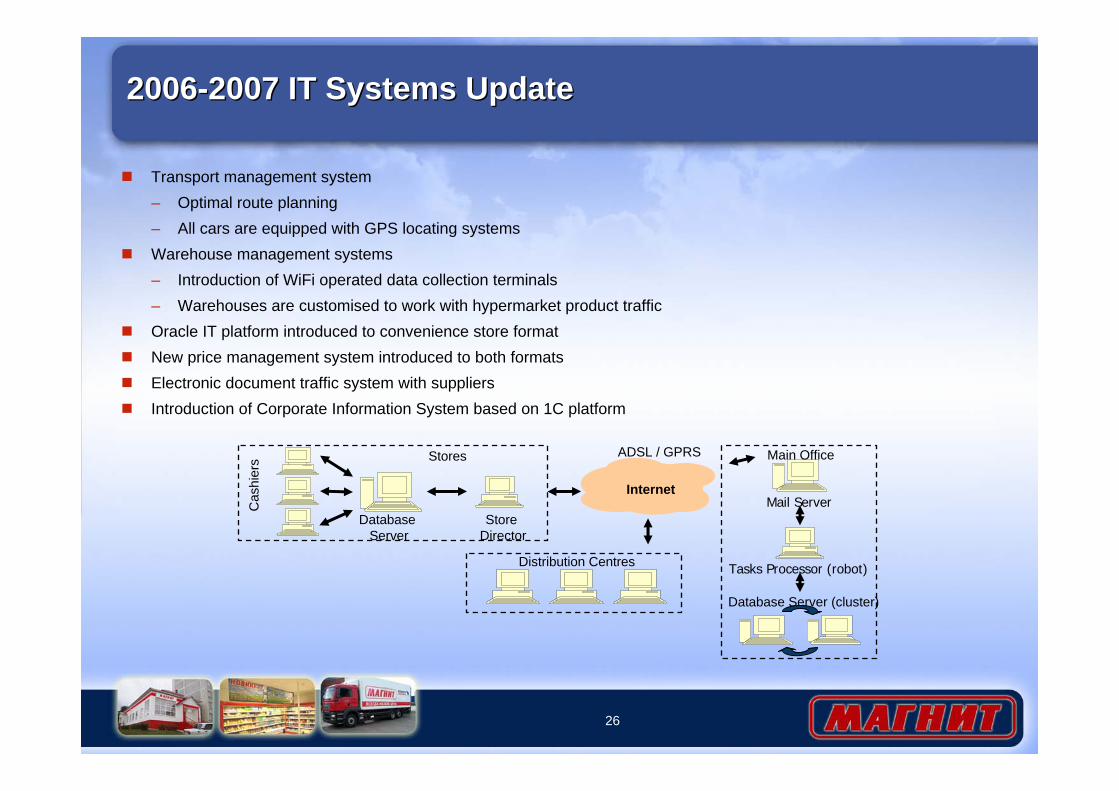
Transport management system– Optimal route planning– All cars are equipped with GPS locating systemsWarehouse management systems– Introduction of WiFi operated data collection terminals– Warehouses are customised to work with hypermarket product trafficOracle IT platform introduced to convenience store formatNew price management system introduced to both formatsElectronic document traffic system with suppliersIntroduction of Corporate Information System based on 1C platform
Cas
hier
s
Internet
Database Server
Store Director
Mail Server
ADSL / GPRS
Database Server (cluster)
Distribution Centres Tasks Processor (robot)
Main OfficeStores
27
Logistics SystemLogistics System
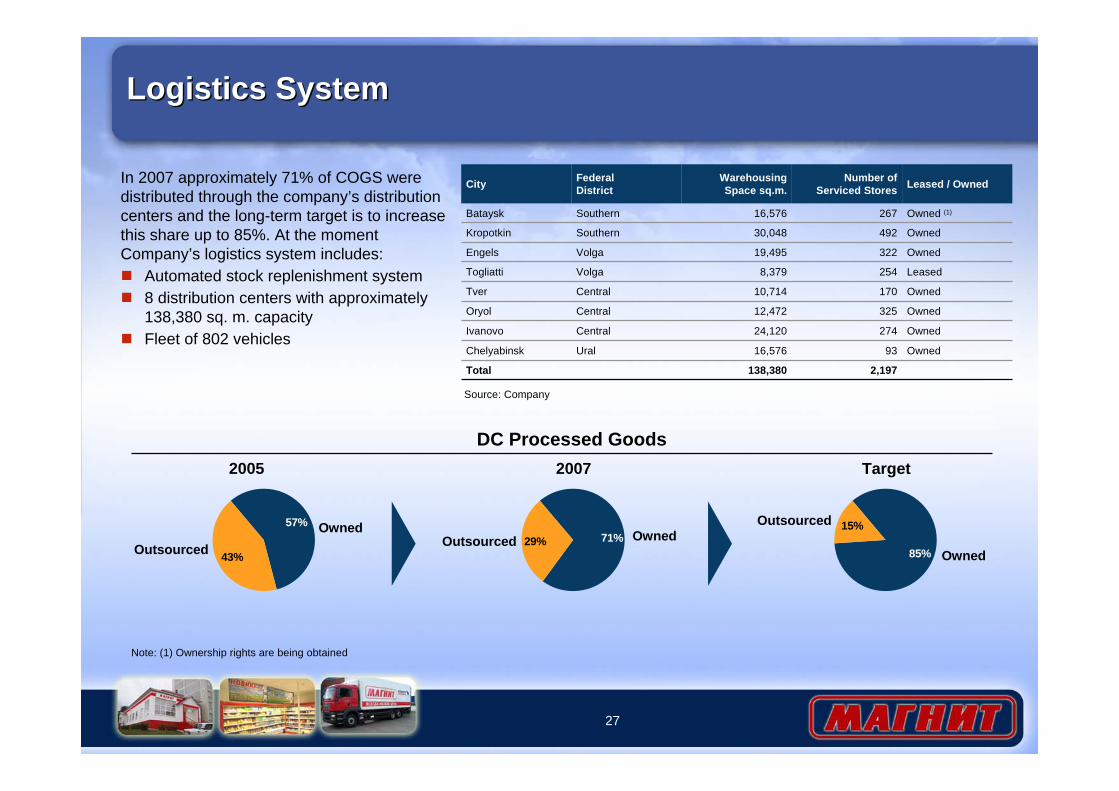
In 2007 approximately 71% of COGS were distributed through the company’s distribution centers and the long-term target is to increase this share up to 85%. At the moment Company’s logistics system includes:
Automated stock replenishment system8 distribution centers with approximately 138,380 sq. m. capacity Fleet of 802 vehicles
Owned32219,495VolgaEngels
Leased2548,379VolgaTogliatti
Owned17010,714CentralTver
Owned32512,472CentralOryol
Owned27424,120CentralIvanovo
Ural
Southern
Southern
FederalDistrict
138,380
16,576
30,048
16,576
Warehousing Space sq.m.
2,197
93
492
267
Number of Serviced Stores Leased / Owned
Owned
Owned
Owned (1)
Total
Chelyabinsk
Kropotkin
Bataysk
City
DC Processed GoodsTarget20072005
43%
57%
OutsourcedOwned
71%29%Outsourced Owned85%
15%Outsourced
Owned
Note: (1) Ownership rights are being obtained
Source: Company

Financial OverviewFinancial Overview

29
Summary P&LSummary P&L
68.02%
75.22%
84.50%
77.40%
54.46%
59.74%
43.87%
46.77%
2007 / 2006Y-o-Y Growth
54.52%
50.23%
92.43%
58.41%
77.07%
71.43%
56.21%
58.78%
2006 / 2005Y-o-Y Growth
2.65%
97.4
25.15%
(32.7)
130.1
(35.5)
165.6
(53.7)
5.96%
219.2
2.4
(513.2)
19.86%
730.0
(2,946.5)
3,676.6
2007
2.31%2.38%Net margin, %
58.0 37.5 Net income
28.85%25.02%Effective tax rate
(23.5)(12.5)Taxes
81.5 50.0 Profit before tax
(13.0)(12.9)Net finance costs
94.5 62.9 EBIT
(29.1)(15.1)Depreciation
4.93%4.95%EBITDA margin,%
123.6 78.0 EBITDA
(1.2)(1.0)Other income/(expense)
(332.2)(187.6)SG&A
18.24%16.90%Gross margin, %
457.0 266.6 Gross profit
(2,048.0)(1,311.1)Cost of sales
2,505.0 1,577.7 Net sales
20062005In US$ MM
Source: IFRS accounts
30
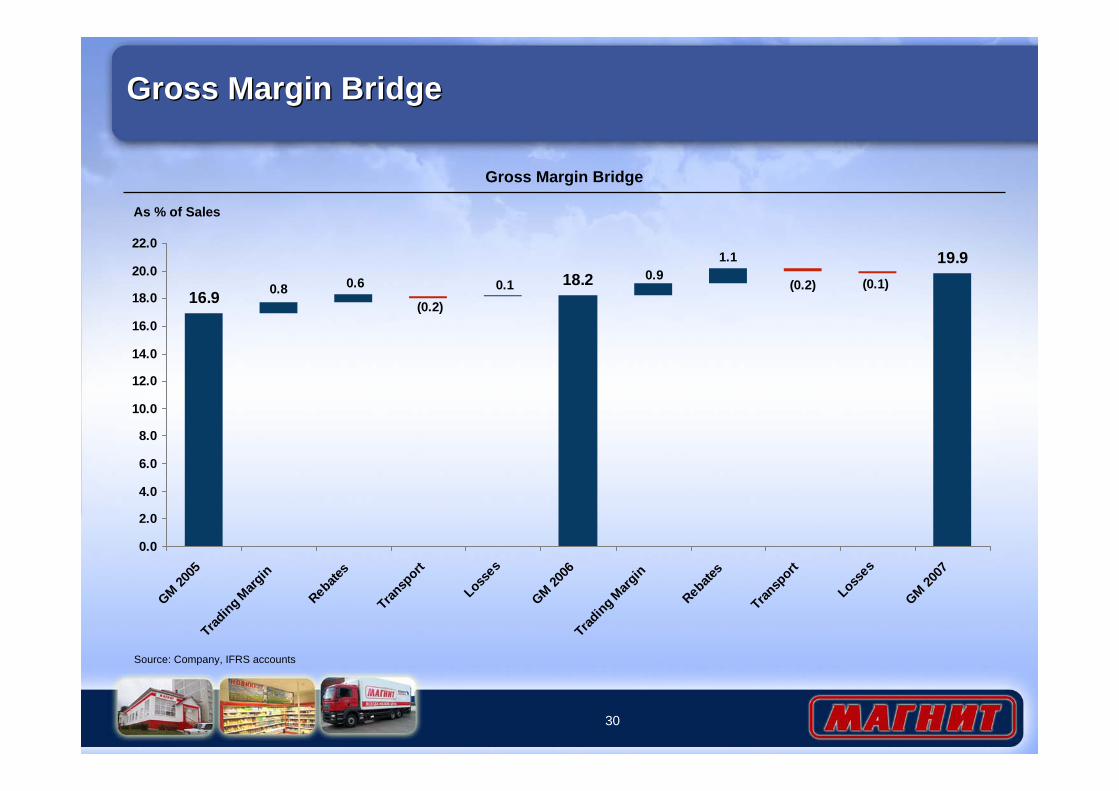
Gross Margin BridgeGross Margin Bridge
19.918.2
16.9(0.1)(0.2)
1.10.9
0.1(0.2)
0.60.8
0.0
2.0
4.0
6.0
8.0
10.0
12.0
14.0
16.0
18.0
20.0
22.0
GM 2005
Trading M
argin
Rebates
Transp
ort
Losses
GM 2006
Trading M
argin
Rebates
Transp
ort
Losses
GM 2007
Gross Margin Bridge
As % of Sales
Source: Company, IFRS accounts
31
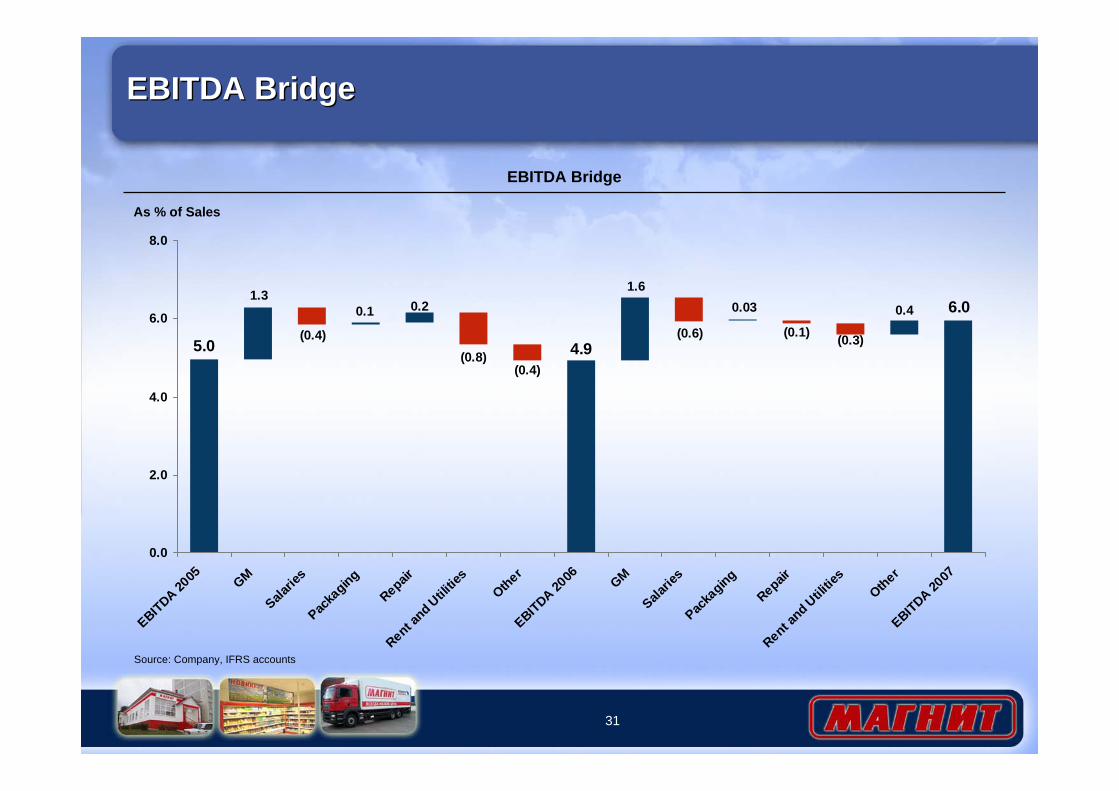
EBITDA BridgeEBITDA Bridge
4.9
6.0
5.0
0.4
(0.3)(0.1)
0.03
(0.6)
1.6
(0.4)(0.8)
0.20.1
(0.4)
1.3
0.0
2.0
4.0
6.0
8.0
EBITDA 2005 GM
Salarie
s
Packa
gingRepair
Rent and Utili
ties
Other
EBITDA 2006 GM
Salarie
s
Packa
gingRepair
Rent and Utili
ties
Other
EBITDA 2007
EBITDA Bridge
As % of Sales
Source: Company, IFRS accounts
32
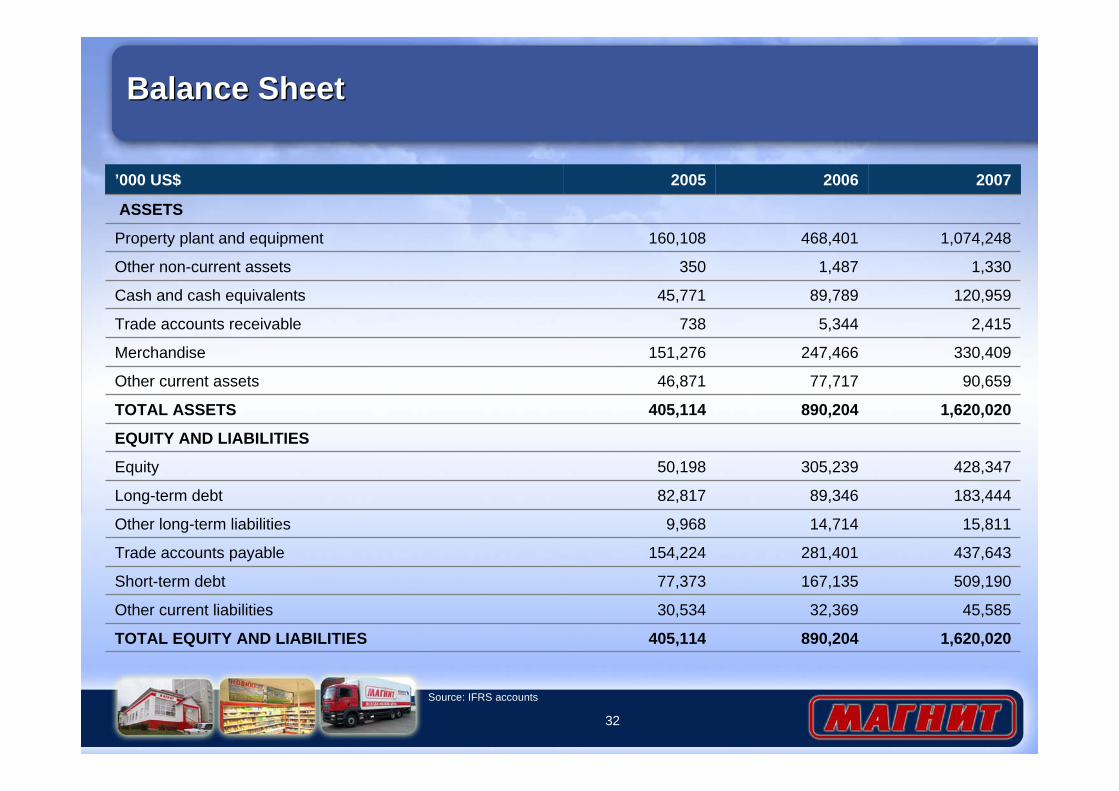
Balance SheetBalance Sheet
1,620,020 890,204 405,114 TOTAL EQUITY AND LIABILITIES
45,585 32,369 30,534 Other current liabilities
509,190 167,135 77,373 Short-term debt
437,643 281,401 154,224 Trade accounts payable
15,811 14,714 9,968 Other long-term liabilities
183,444 89,346 82,817 Long-term debt
428,347 305,239 50,198 Equity
EQUITY AND LIABILITIES
1,620,020 890,204 405,114 TOTAL ASSETS
90,659 77,717 46,871 Other current assets
330,409 247,466 151,276 Merchandise
2,415 5,344 738 Trade accounts receivable
120,959 89,789 45,771 Cash and cash equivalents
1,330 1,487 350 Other non-current assets
1,074,248 468,401 160,108 Property plant and equipment
ASSETS
200720062005’000 US$
Source: IFRS accounts
33
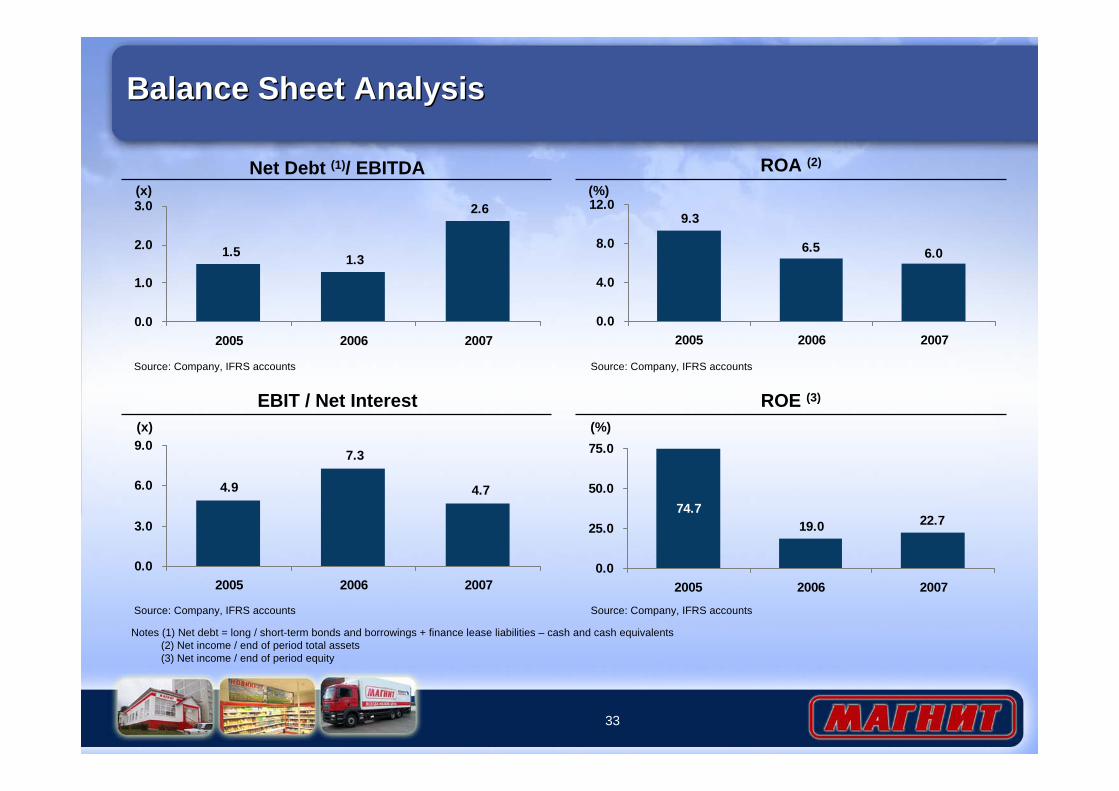
Balance Sheet AnalysisBalance Sheet Analysis
EBIT / Net Interest
ROA (2)
6.06.5
9.3
0.0
4.0
8.0
12.0
2005 2006 2007
ROE (3)
22.719.074.7
0.0
25.0
50.0
75.0
2005 2006 2007
4.7
7.3
4.9
0.0
3.0
6.0
9.0
2005 2006 2007
Net Debt (1)/ EBITDA
2.6
1.31.5
0.0
1.0
2.0
3.0
2005 2006 2007
(x) (%)
(x) (%)
Source: Company, IFRS accounts
Source: Company, IFRS accounts
Source: Company, IFRS accounts
Source: Company, IFRS accounts
Notes (1) Net debt = long / short-term bonds and borrowings + finance lease liabilities – cash and cash equivalents(2) Net income / end of period total assets(3) Net income / end of period equity
34
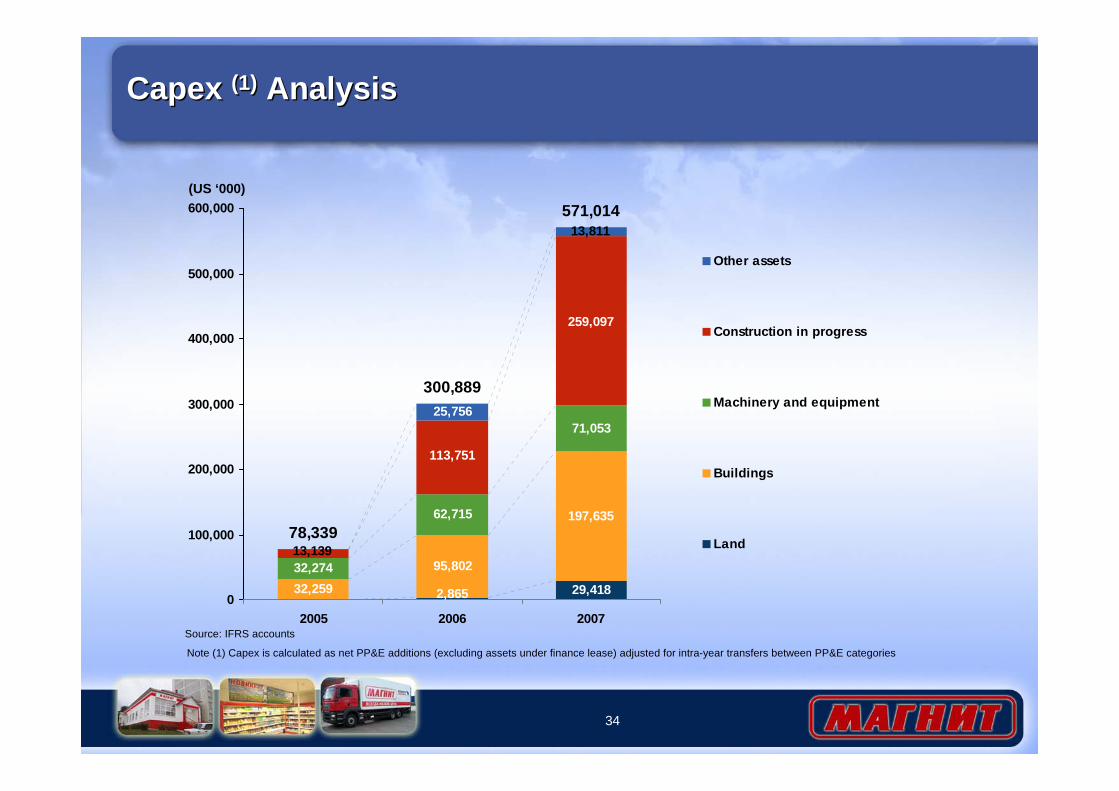
Capex (1) AnalysisCapex (1) Analysis
29,41832,259
95,802
197,635
32,274
62,715
71,05325,756
78,339
300,889
571,014
2,865
259,097
113,751
13,139
13,811
0
100,000
200,000
300,000
400,000
500,000
600,000
2005 2006 2007
Other assets
Construction in progress
Machinery and equipment
Buildings
Land
(US ‘000)
Note (1) Capex is calculated as net PP&E additions (excluding assets under finance lease) adjusted for intra-year transfers between PP&E categories
Source: IFRS accounts
35
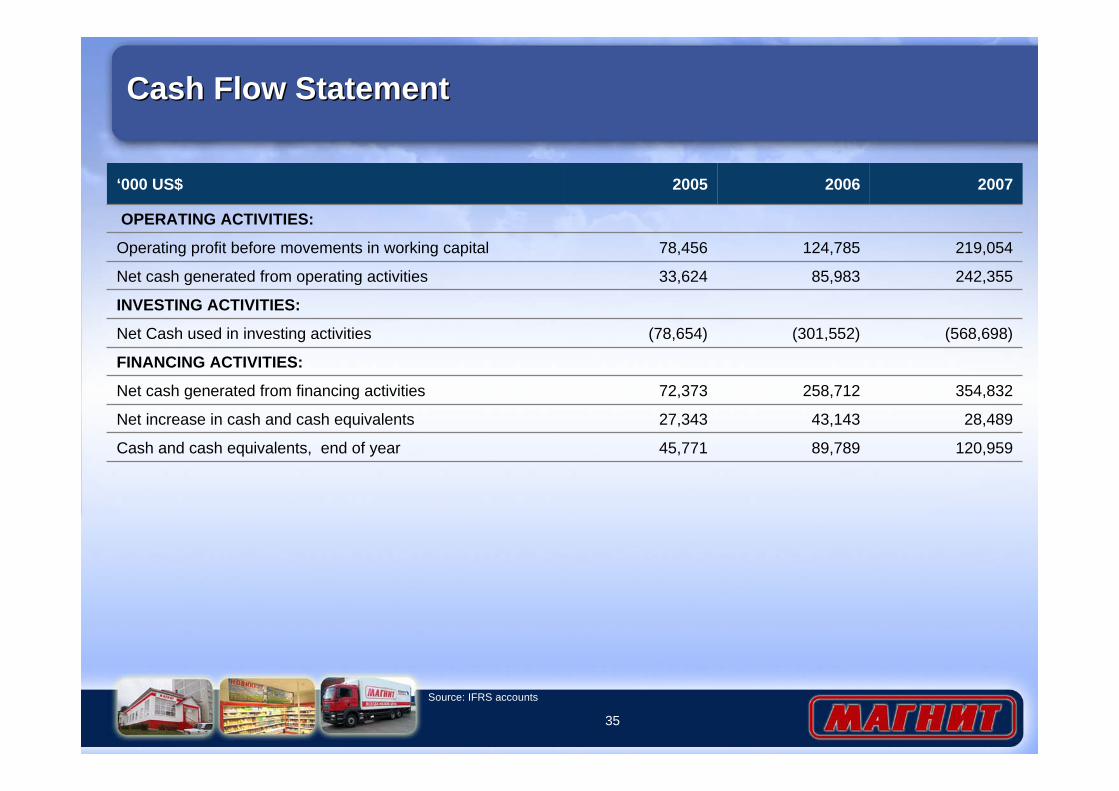
Cash Flow StatementCash Flow Statement
45,771
27,343
72,373
(78,654)
33,624
78,456
2005
120,959 89,789 Cash and cash equivalents, end of year
28,489 43,143 Net increase in cash and cash equivalents
354,832 258,712 Net cash generated from financing activities
FINANCING ACTIVITIES:
(568,698)(301,552)Net Cash used in investing activities
INVESTING ACTIVITIES:
242,355 85,983 Net cash generated from operating activities
219,054 124,785 Operating profit before movements in working capital
OPERATING ACTIVITIES:
20072006‘000 US$
Source: IFRS accounts
36
43.938.336.0
0
10
20
30
40
50
2005 2006 2007
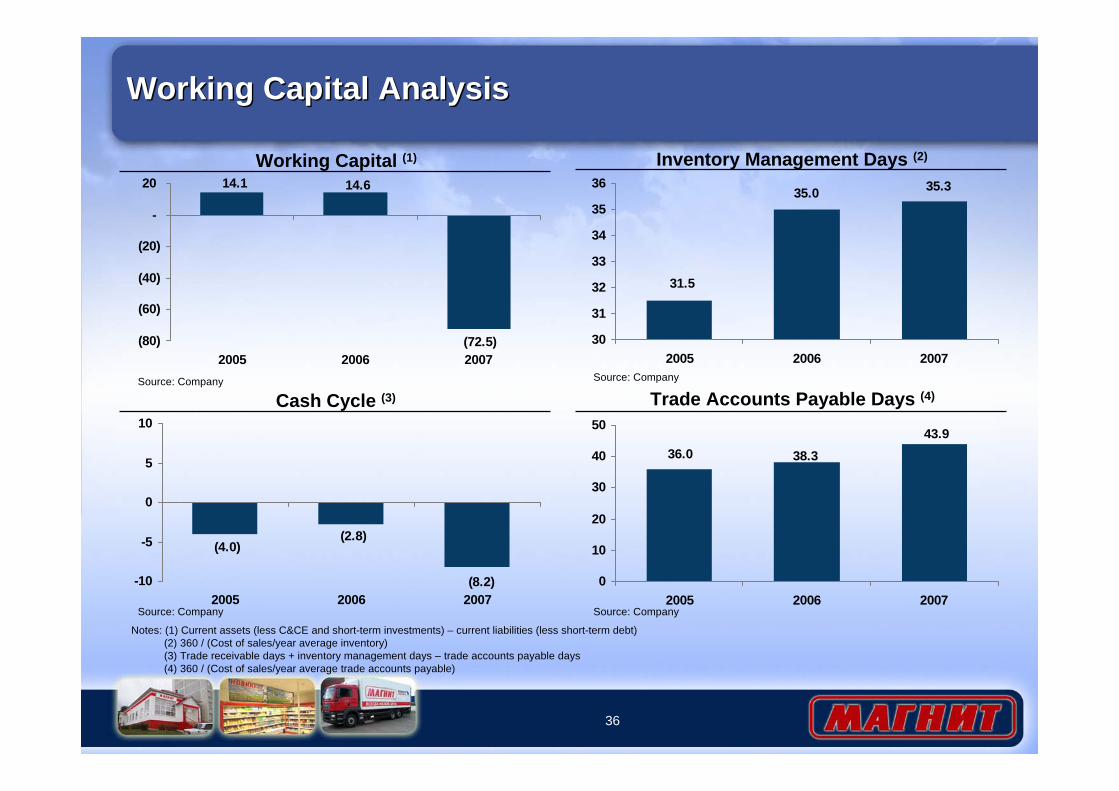
Working Capital AnalysisWorking Capital Analysis
Inventory Management Days (2)
35.335.0
31.5
30
31
32
33
34
35
36
2005 2006 2007
Trade Accounts Payable Days (4)Cash Cycle (3)
Source: Company
Source: Company
Source: Company
Working Capital (1)
14.1 14.6
(72.5)(80)
(60)
(40)
(20)
-
20
2005 2006 2007Source: Company
Notes: (1) Current assets (less C&CE and short-term investments) – current liabilities (less short-term debt)(2) 360 / (Cost of sales/year average inventory)(3) Trade receivable days + inventory management days – trade accounts payable days(4) 360 / (Cost of sales/year average trade accounts payable)
(4.0)(2.8)
(8.2)-10
-5
0
5
10
2005 2006 2007
Summary ConclusionsSummary Conclusions
38
Summary ConclusionsSummary Conclusions
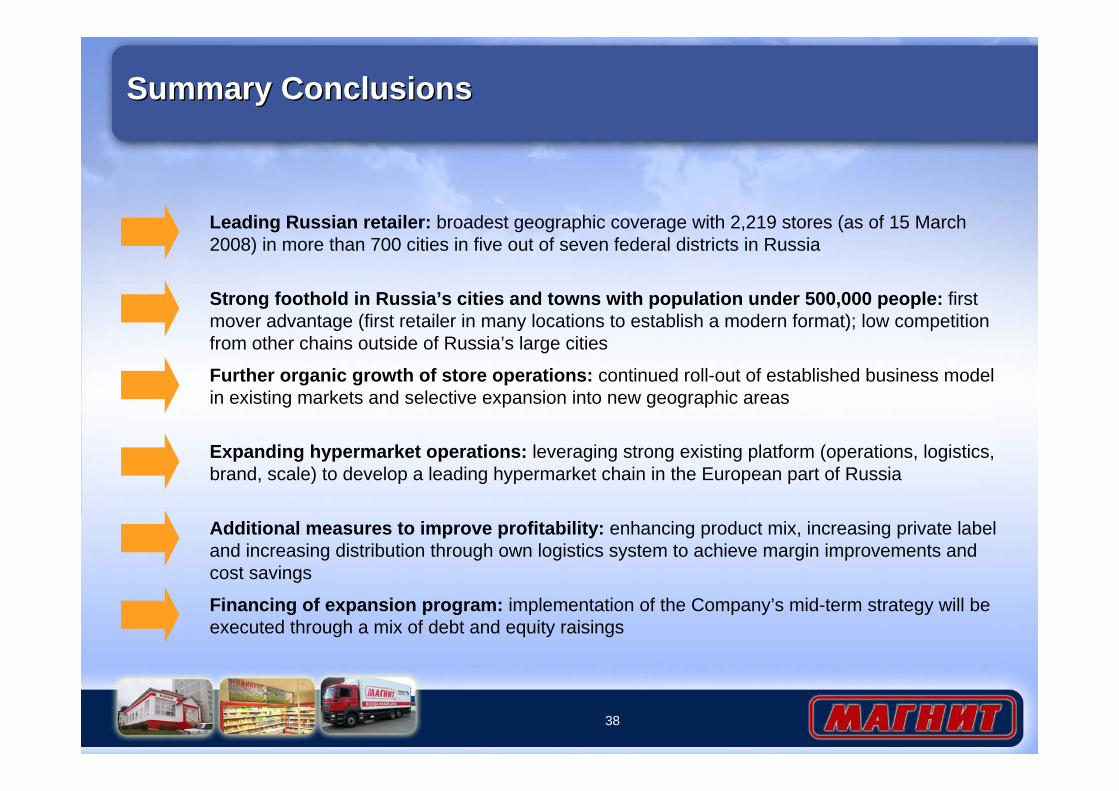
Leading Russian retailer: broadest geographic coverage with 2,219 stores (as of 15 March 2008) in more than 700 cities in five out of seven federal districts in Russia
Further organic growth of store operations: continued roll-out of established business model in existing markets and selective expansion into new geographic areas
Expanding hypermarket operations: leveraging strong existing platform (operations, logistics, brand, scale) to develop a leading hypermarket chain in the European part of Russia
Additional measures to improve profitability: enhancing product mix, increasing private label and increasing distribution through own logistics system to achieve margin improvements and cost savings
Strong foothold in Russia’s cities and towns with population under 500,000 people: first mover advantage (first retailer in many locations to establish a modern format); low competition from other chains outside of Russia’s large cities
Financing of expansion program: implementation of the Company’s mid-term strategy will be executed through a mix of debt and equity raisings


![FY Ended March 2015 Full Year Results Presentation · Net Sales [] →() →() →()](https://img.pdfslide.net/doc/110x75/5f118831d64fac5ddf14fef8/fy-ended-march-2015-full-year-results-presentation-net-sales-aii-aii.jpg)
