Embed Size (px)
Citation preview

October 14th, 2021FY 8/2021 Full Year Results

Business Highlights

3FY 8/2021 Highlights-All Key KPIs Achieved
KPI
KGI
160 162.7B YoY 158%
75 84 K
7.34 M
56 %36
YoY 256%
YoY 156%
GMV
Merchant
Active Users
Sharing Delivery Household Coverage
Target Actual
1. Gross merchandise value (“GMV”), which is the gross order value of the Company’s online food delivery business (such as the total price of the food) and any delivery fee. GMV prior to October 2020 excluded discounts on delivery fees2. Represents the number of users who placed order at least once within the last twelve months
1
2
JPY ✓
✓
✓
4
4Q'20 1Q'21 2Q'21 3Q'21 4Q'214Q'20 1Q'21 2Q'21 3Q'21 4Q'210
2
4
6
8
1 0
1 2
1 4
1 6
1 8
2 0
0
1 0, 00 0
2 0, 00 0
3 0, 00 0
4 0, 00 0
5 0, 00 0
6 0, 00 0
4Q'20 1Q'21 2Q'21 3Q'21 4Q'21
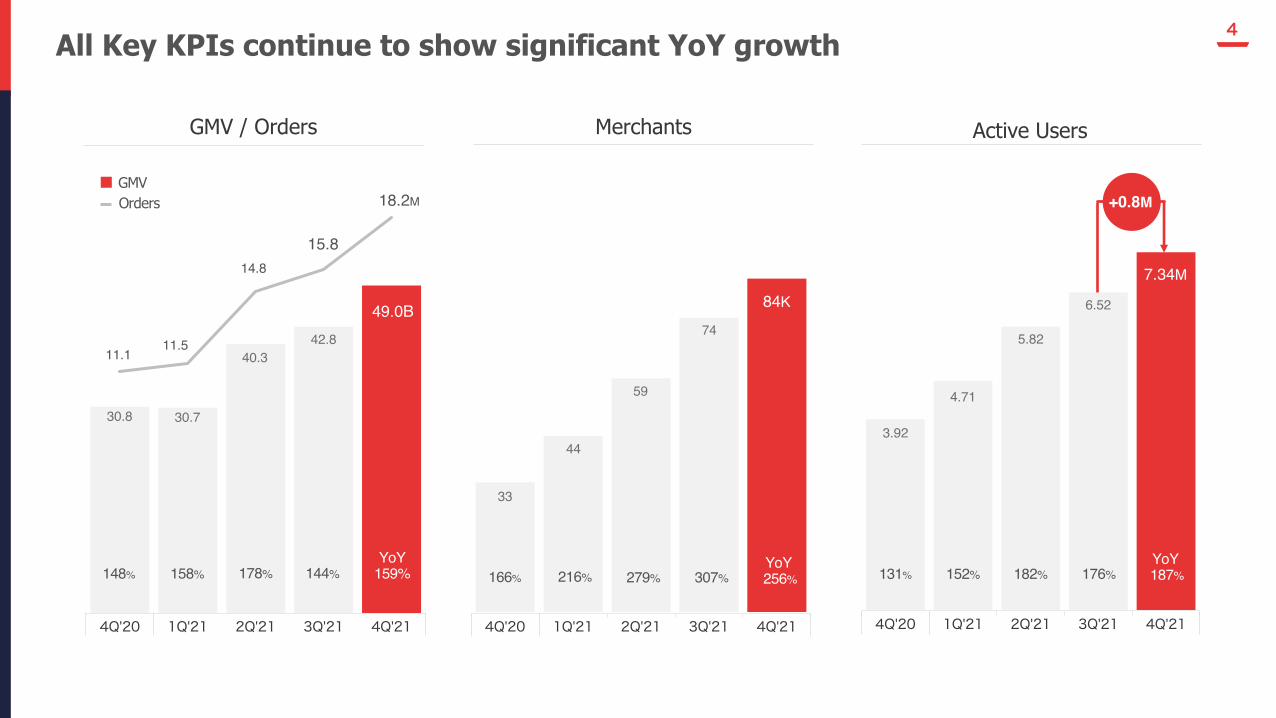
+0.8M
15.8
GMVOrders
42.8 74
YoY256%279%216%166%
YoY159%178%158%148%
YoY187%182%152%131%
40.3
30.730.8
59
44
33
14.8
11.511.1
4.71
3.92
7.34M
All Key KPIs continue to show significant YoY growth
GMV / Orders Merchants Active Users
49.0B
18.2M
144%
84K
307%
5.82
176%
6.52

5
4Q'20 1Q'21 2Q'21 3Q'21 4Q'21 4Q'20 1Q'21 2Q'21 3Q'21 4Q'214Q'20 1Q'21 2Q'21 3Q'21 4Q'21
Sharing Delivery GMV Sharing Delivery Merchants # of Delivery staff
Sharing Delivery Continue Expanding
1. The number of registered riders
4.2×approx.
4.1×approx.
6.8×approx.

6
TwitterFollowers 48K 310K +26.2K
LINE Official Account Friends
28.5M 38.7M +10.3M
Improved Brand Value and Awareness
Brand Recognition Uplift 2
57.2%
84.8%
FY 8/20 FY 8/21
2. Based on a smartphone survey targeted for 2,500 male/female between age of 15 to 69using ”LINE Research Platform” conducted periodically by Demae-can
3. The result of the survey conducted in July 20204. The result of the survey Conducted in March 2021
Ranked 3rd most favorite TV commercial1
Increasing recognition on Social Media
Aug. 2020 Aug. 2021
3
4
1. Source: CM Soken ConsultingAmong 2,661 TV ads aired on major TV network stations in Tokyo during the period of Dec.20,2020 to Jan.19, 2021. Survey based on 3,000 people living in Kanto region.
YoY

7
NPS(Customer loyalty index)
1. Based on a smartphone survey on LINE Research Platfom conducted by Monitas,Inc, a third-party research firm, from April 15 to 20, 2021. Received 2,000 answers from male/female aged between 15 to 69.
2. Referring to Fashion Ecommerce Industry average3. ”NPS Industry Ranking & Award,” NTTCom Online Marketing Solutions Corporation
(https://www.nttcoms.com/service/nps/report/)
1
−8.9
−30.9
Service A
−21.7
Industry Average
2
+22pt
Providing superior user experience compared to other platform
Improved Brand Value and Awareness
Mobile Service Provider -52.7pt
Fashion Ecommerce -21.7pt
Online Streaming Service -24.6pt
NPS Japan Industry Average3
NTT docomo -47.0pt
ZOZOTOWN -13.3pt
Netflix -4.4pt
NPS Japan Industry Leader3
(Fashion Ecommerce)
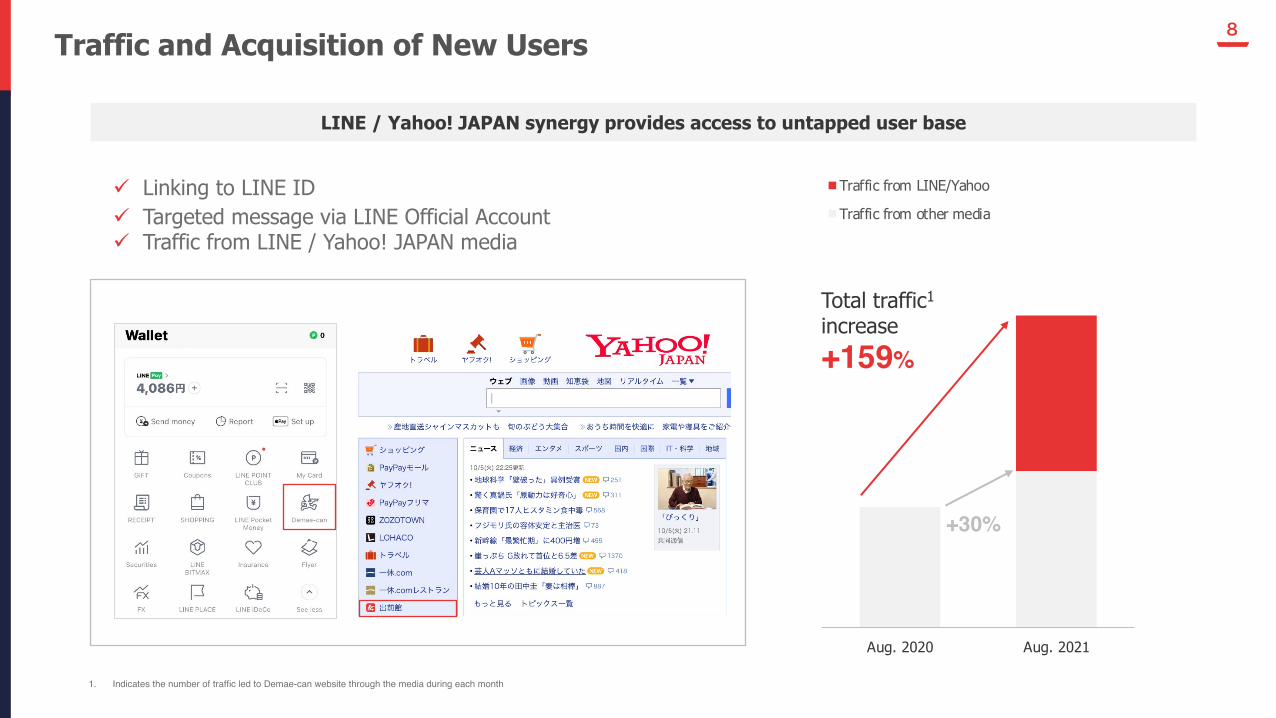
8Traffic and Acquisition of New Users
Aug. 2020 Aug. 2021
Traffic from LINE/Yahoo
Traffic from other media
Total traffic1
increase+159%
+30%
ü Linking to LINE ID ü Targeted message via LINE Official Accountü Traffic from LINE / Yahoo! JAPAN media
LINE / Yahoo! JAPAN synergy provides access to untapped user base
1. Indicates the number of traffic led to Demae-can website through the media during each month

9Robust Sharing Delivery Ecosystem
Popular local merchants
1. Average GMV per merchant of the 9,355 Sharing Delivery merchants that were open on Demae-can as of Aug. 2020
20年8月 21年8月
GMV per Sharing Delivery merchant Sharing Delivery available in all 47 prefectures1
2×approx.
Aug. 2020 Aug. 2021

10Product Revamp
加盟店
• Recommend module • Rider GPS tracker • Enriched review function
• Performance dashboard• Improved order
management app UI
• Dynamic area control • Improved driver app UI
User RiderMerchant
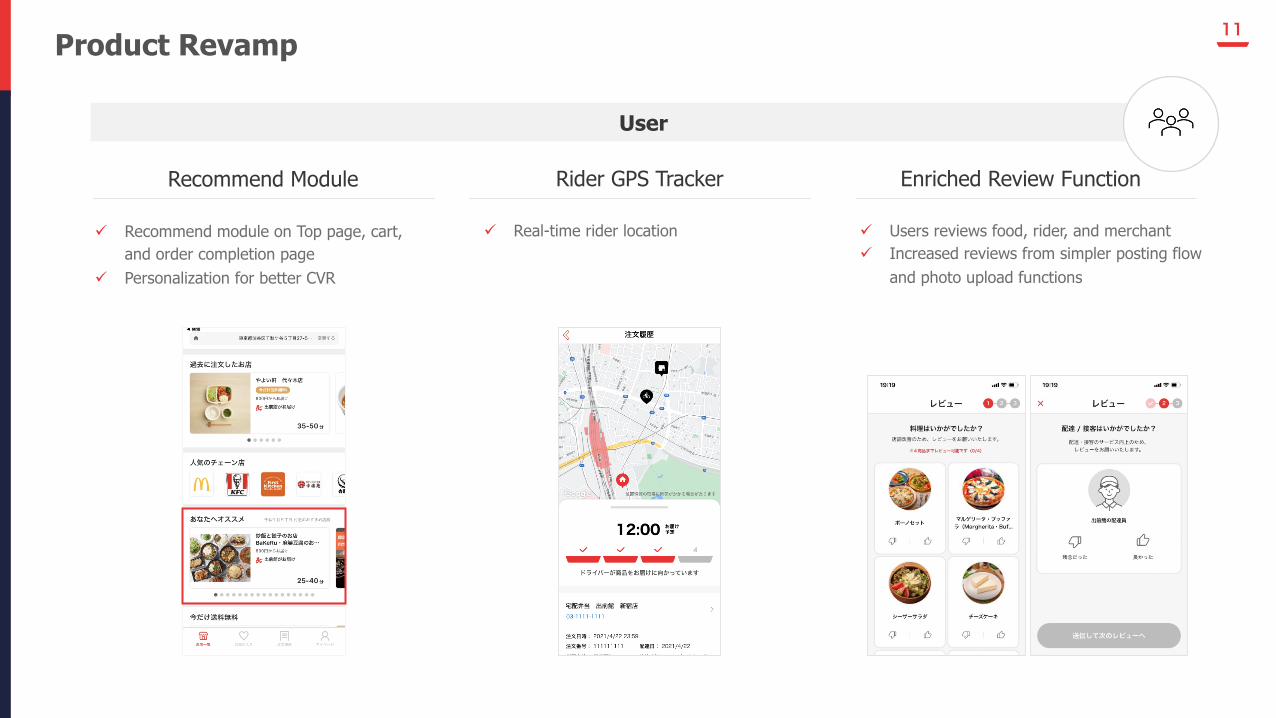
11Product Revamp
User
Recommend Module Rider GPS Tracker Enriched Review Function
ü Recommend module on Top page, cart, and order completion page
ü Personalization for better CVR
ü Real-time rider location ü Users reviews food, rider, and merchantü Increased reviews from simpler posting flow
and photo upload functions

12Product Revamp
Merchant
Performance dashboardü Access to actual results/data to analyze performance on Demae-can
Improved order management app UI
ü Better usability
Performance comparison to other merchants
1
Ranking among merchants in the same area
2
Display user data by segment (new / repeater)
3
Report user retention trends, order frequency, etc.
4
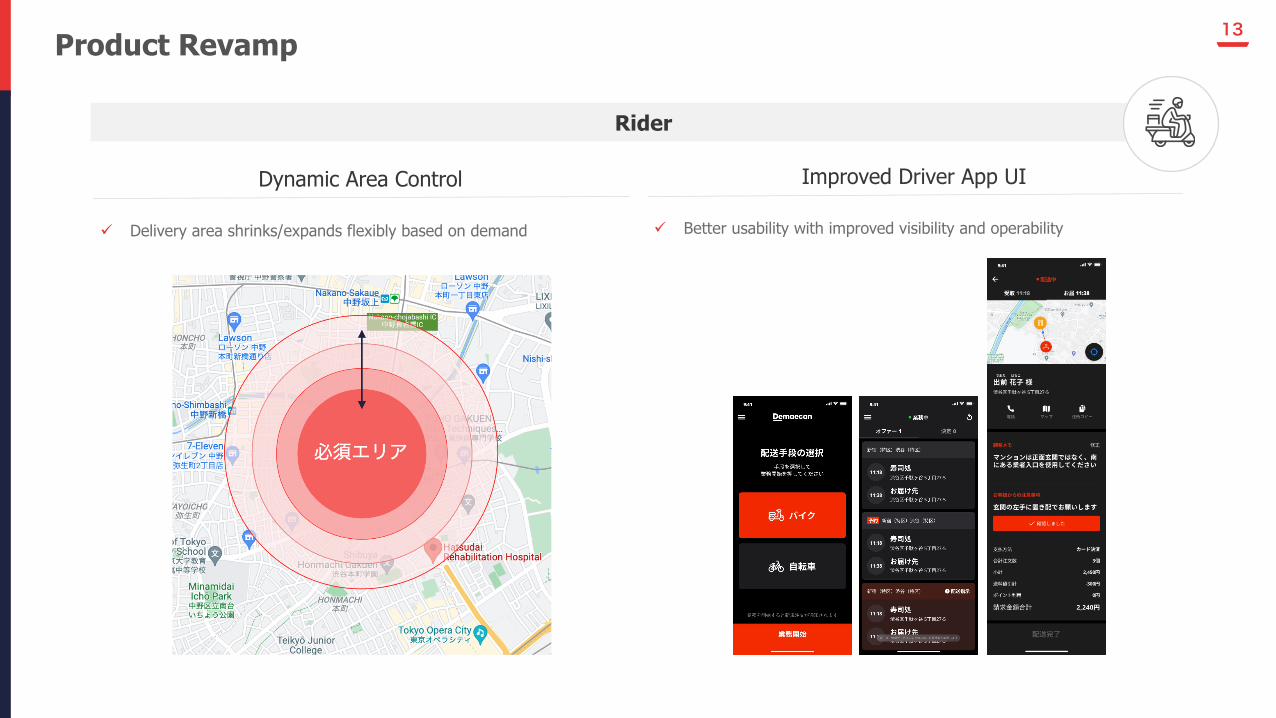
13
Rider
Product Revamp
Dynamic Area Control
ü Delivery area shrinks/expands flexibly based on demand
Improved Driver App UI
ü Better usability with improved visibility and operability

FY 8/2022 Outlook
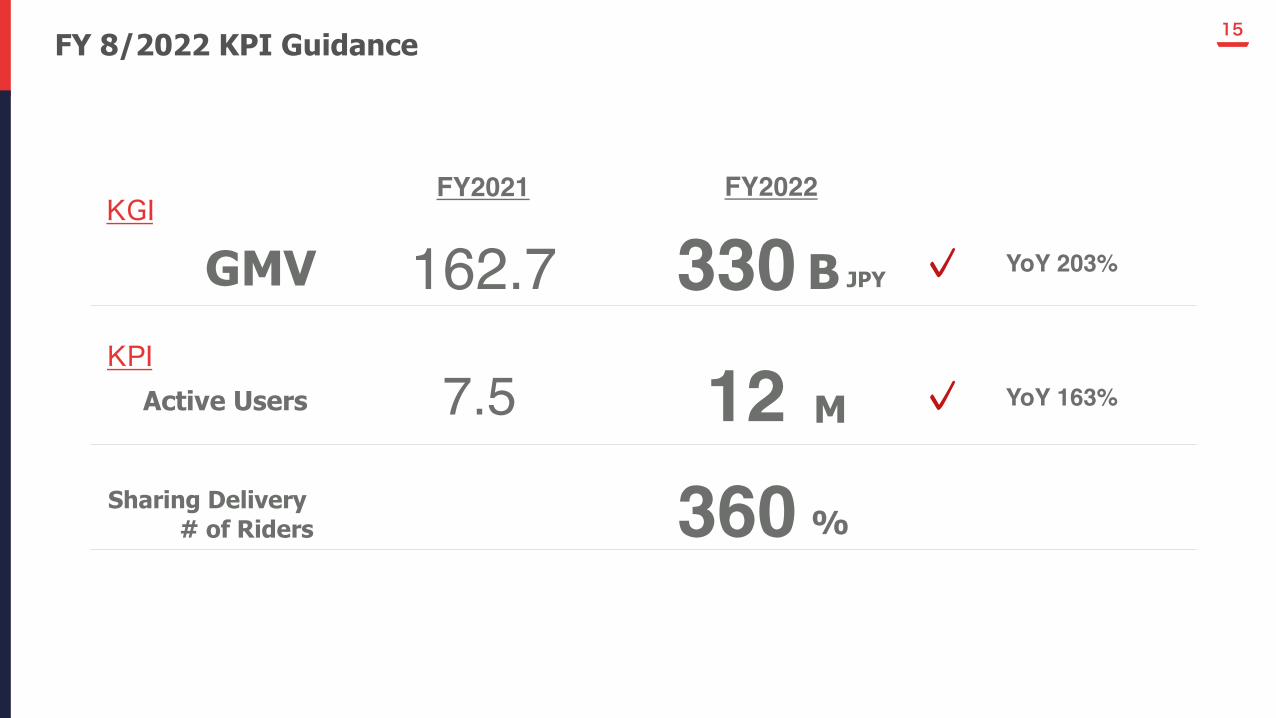
15FY 8/2022 KPI Guidance
360Sharing Delivery # of Riders
FY2021 FY2022KGI
162.7 330 YoY 203%GMVKPI
YoY 163%7.5Active Users 12
B
M
%
JPY ✓
✓
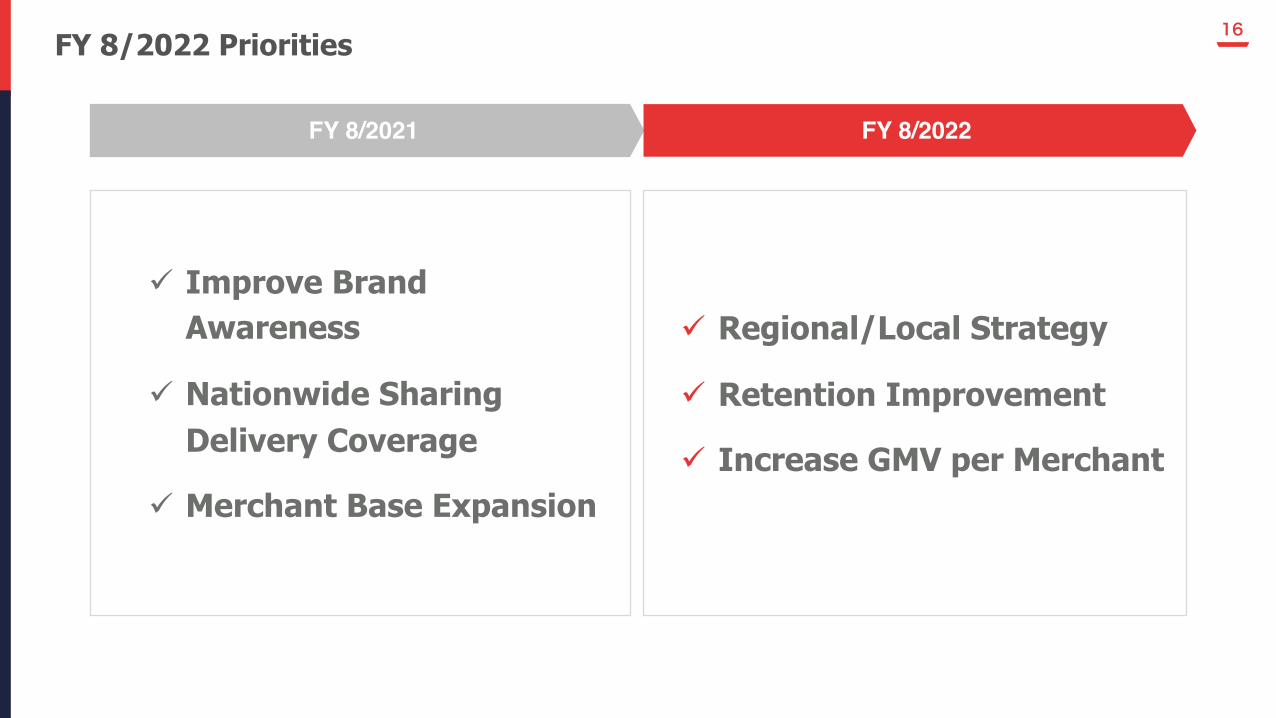
16FY 8/2022 Priorities
FY 8/2021 FY 8/2022
ü Improve BrandAwareness
ü Nationwide Sharing Delivery Coverage
ü Merchant Base Expansion
ü Regional/Local Strategy
ü Retention Improvement
ü Increase GMV per Merchant
17
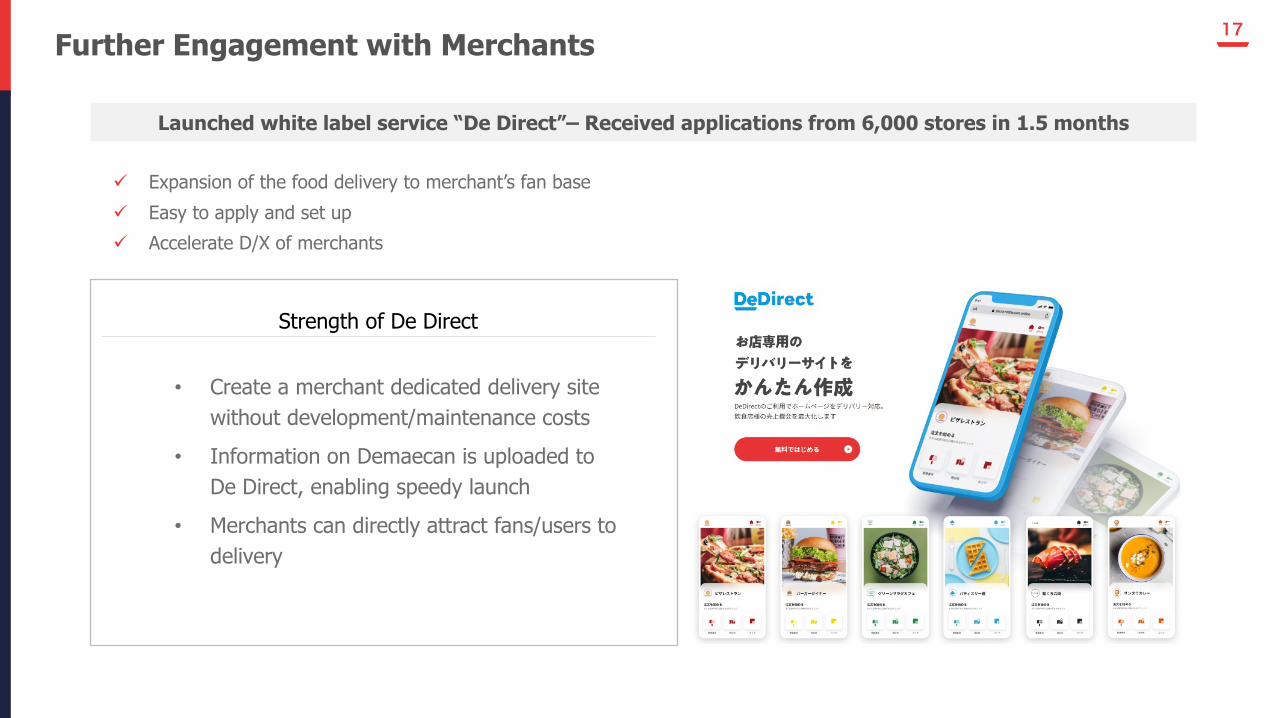
• Create a merchant dedicated delivery site without development/maintenance costs
• Information on Demaecan is uploaded toDe Direct, enabling speedy launch
• Merchants can directly attract fans/users to delivery
Further Engagement with Merchants
Launched white label service “De Direct”– Received applications from 6,000 stores in 1.5 months
ü Expansion of the food delivery to merchant’s fan baseü Easy to apply and set upü Accelerate D/X of merchants
Strength of De Direct
18
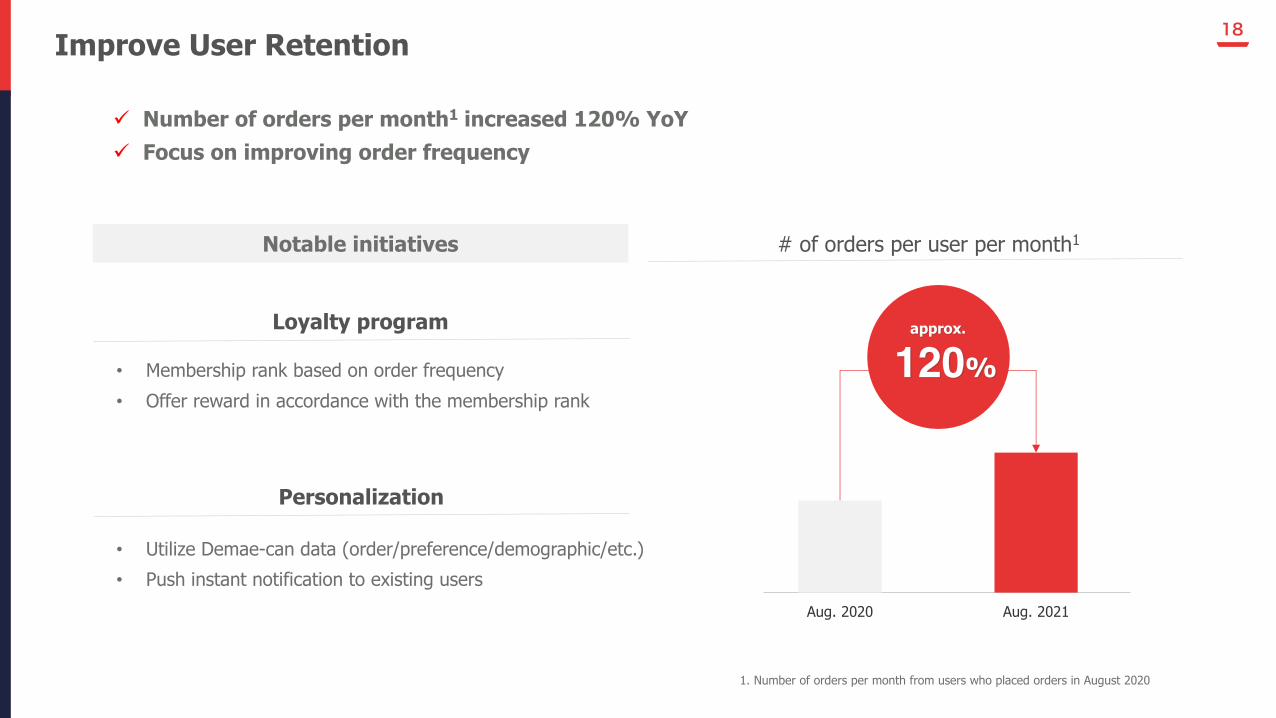
• Membership rank based on order frequency• Offer reward in accordance with the membership rank
• Utilize Demae-can data (order/preference/demographic/etc.)• Push instant notification to existing users
Aug. 2020 Aug. 2021
Improve User Retention
ü Number of orders per month1 increased 120% YoYü Focus on improving order frequency
# of orders per user per month1Notable initiatives
Loyalty program
Personalization
120%approx.
1. Number of orders per month from users who placed orders in August 2020
19
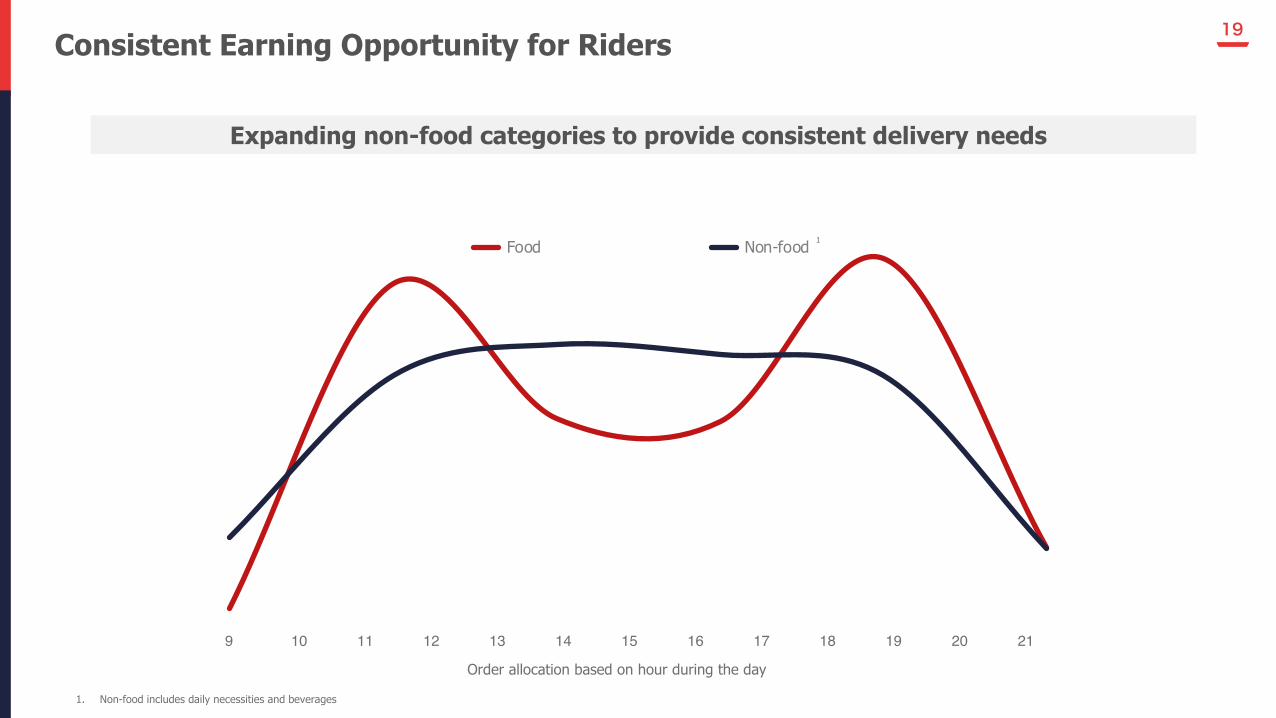
Food Non-food
9 10 11 12 13 14 15 16 17 18 19 20 21
Consistent Earning Opportunity for Riders
Expanding non-food categories to provide consistent delivery needs
1
1. Non-food includes daily necessities and beverages
Order allocation based on hour during the day
20
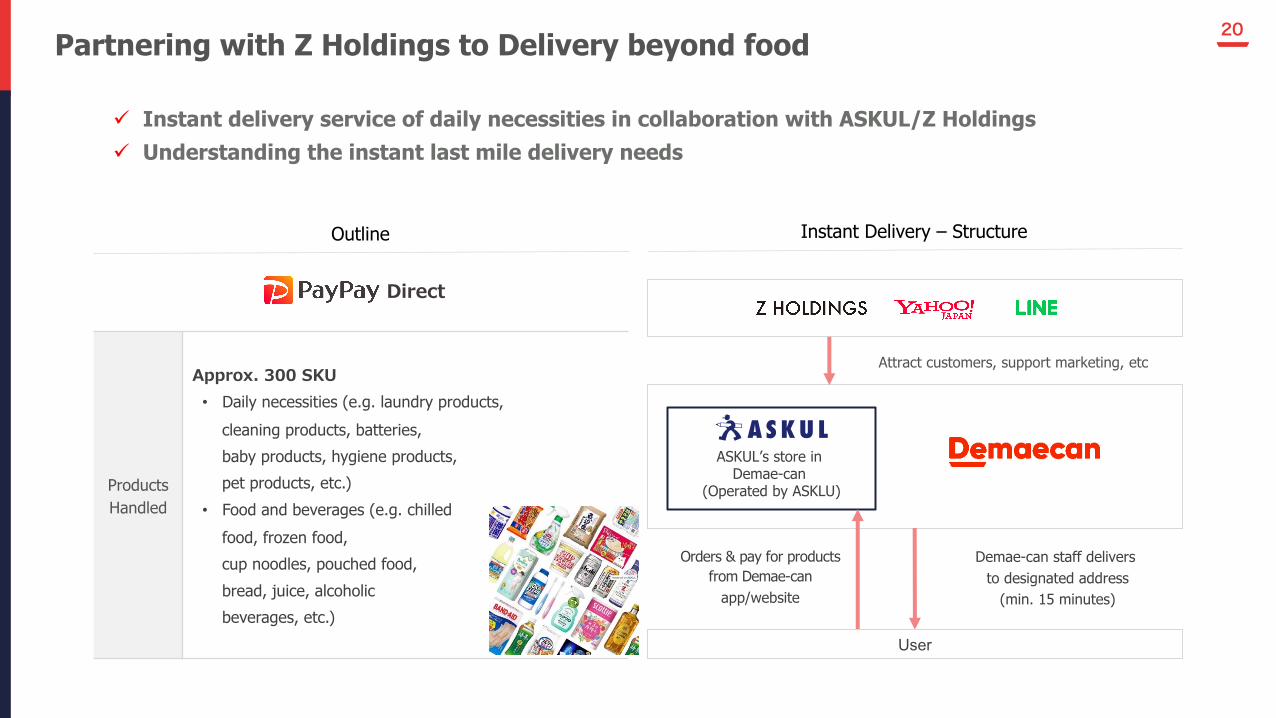
Products Handled
Approx. 300 SKU• Daily necessities (e.g. laundry products,
cleaning products, batteries,baby products, hygiene products,pet products, etc.)
• Food and beverages (e.g. chilled food, frozen food, cup noodles, pouched food, bread, juice, alcoholic beverages, etc.)
Attract customers, support marketing, etc
ASKUL’s store in Demae-can
(Operated by ASKLU)
User
Partnering with Z Holdings to Delivery beyond food
Outline Instant Delivery – Structure
Direct
Orders & pay for products from Demae-can
app/website
Demae-can staff delivers to designated address
(min. 15 minutes)
ü Instant delivery service of daily necessities in collaboration with ASKUL/Z Holdingsü Understanding the instant last mile delivery needs
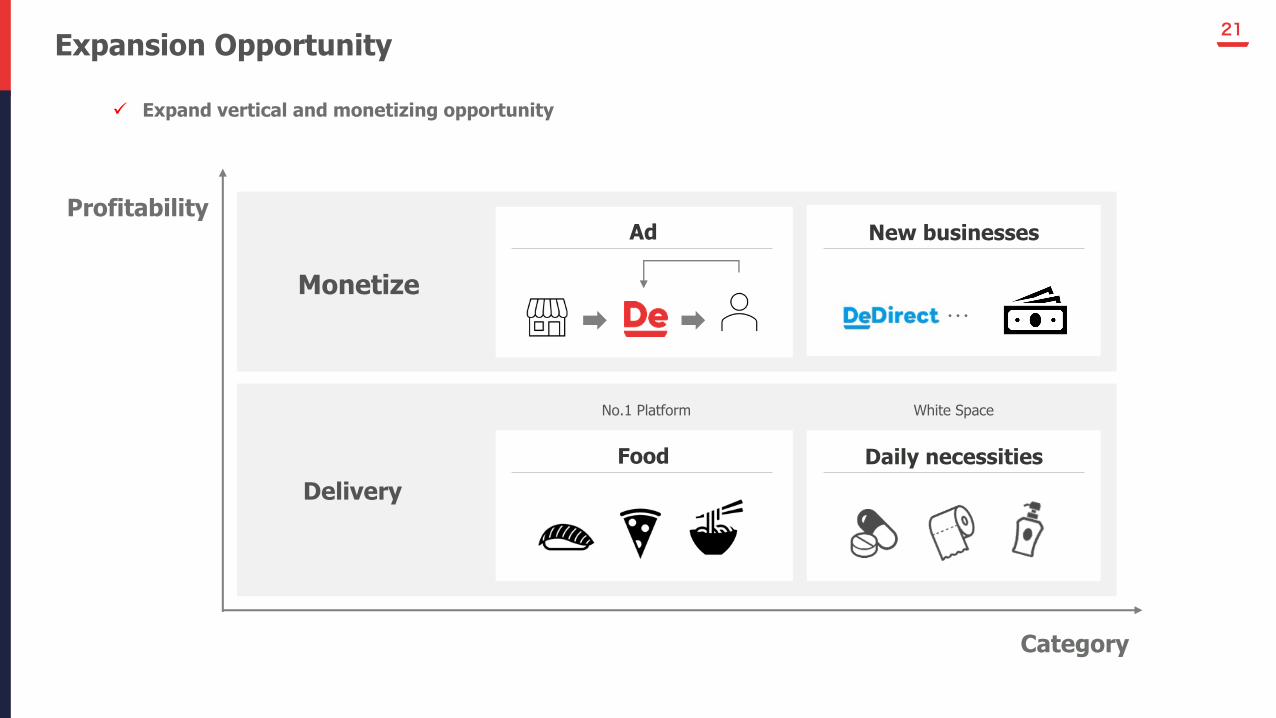
21Expansion Opportunity
ü Expand vertical and monetizing opportunity
Category
Profitability
White Space
Monetize
Delivery
No.1 Platform
…
Food Daily necessities
Ad New businesses

Financial Highlights

23Overview of FY 8/2021 Financial Results
(Billion JPY) Revised forecast announced at 3Q FY 8/2021 YoY
GMV 160.0 162.7 158%
Revenue 29.0 29.0 281%
Operating Profit (19.0) (17.9) -
Profit attributable to owners of parent (21.5) (20.6) -

24
1,022 1,670
3,066
4,613
Delivery
Commission
6,666
1,928
2,007
2,680
2,909
Demae-can Service
Fee3,368
532
550
489
506
Other480
3,483 4,228
6,235
8,029
10,514
4Q'20 1Q'21 2Q'21 3Q'21 4Q'21
万件
YoY (52M) JPY(YoY 90%)Decline of business revenue from subsidiary
Other
YoY +1,440M JPY (YoY 175%)Increase in orders dues to the expansion of merchants and users
YoY +5,644M JPY(YoY 652%)Increase in the number of sharing delivery orders
Demae-can Service Fee
Delivery Commission
YoY 302%
(Million JPY)
Revenue
25
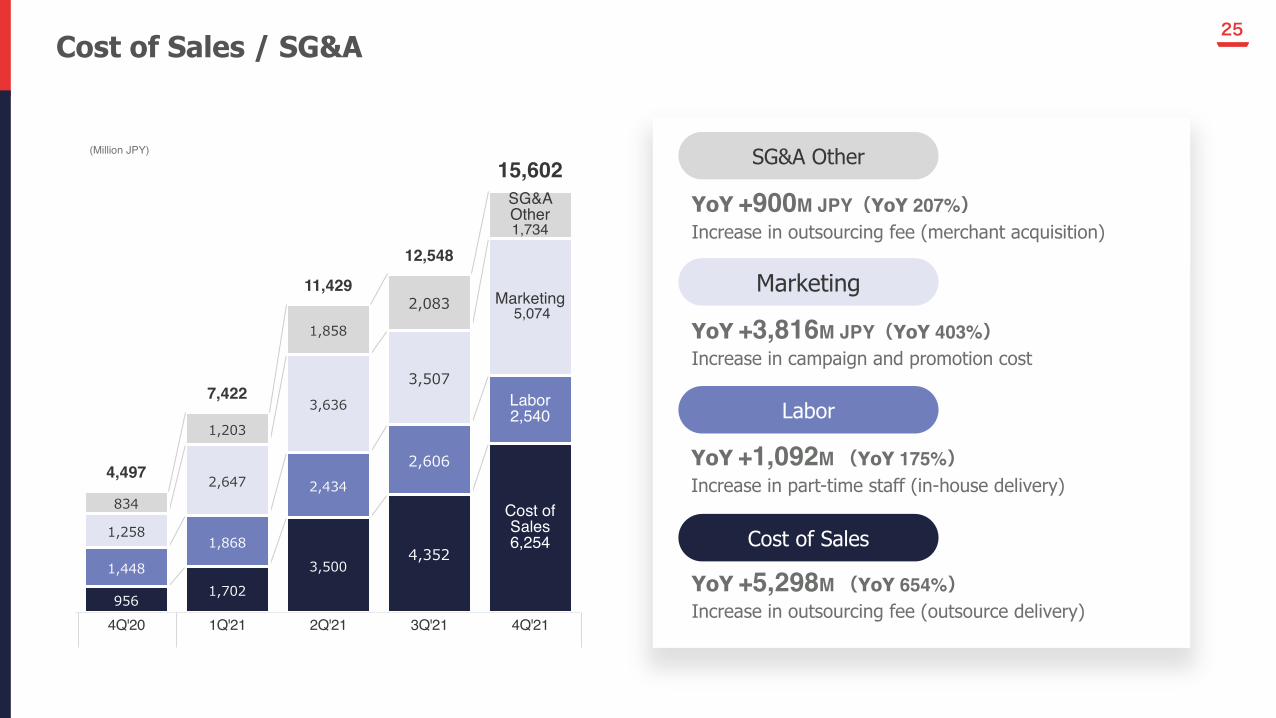
956 1,702
3,500 4,352
Cost of Sales6,254
1,448
1,868
2,434
2,606
Labor2,540
1,258
2,647
3,636
3,507
Marketing 5,074
834
1,203
1,858
2,083
SG&A Other1,734
4,497
7,422
11,429
12,548
15,602
4Q'20 1Q'21 2Q'21 3Q'21 4Q'21
万件
YoY +900M JPY(YoY 207%)Increase in outsourcing fee (merchant acquisition)
YoY +3,816M JPY(YoY 403%)Increase in campaign and promotion cost
YoY +1,092M(YoY 175%)Increase in part-time staff (in-house delivery)
SG&A Other
Marketing
Labor
YoY +5,298M(YoY 654%)Increase in outsourcing fee (outsource delivery)
Cost of Sales
(Million JPY)
Cost of Sales / SG&A

26Demae-can’s two business models (Ecommerce and Delivery)
1. Fee paid by merchant per order and advertising cost paid merchants2. Sharing delivery fee paid by merchants and delivery fee from users
Revenue
Cost
Scale Growth Engine
Platform Fee1
Marketing
Product Development / HQ / Others
Delivery Fee2
Delivery Cost
Delivery by
Sharing Delivery Merchant
Ecommerce model Delivery model
Leverage = Profit Unit Economics = Breakeven
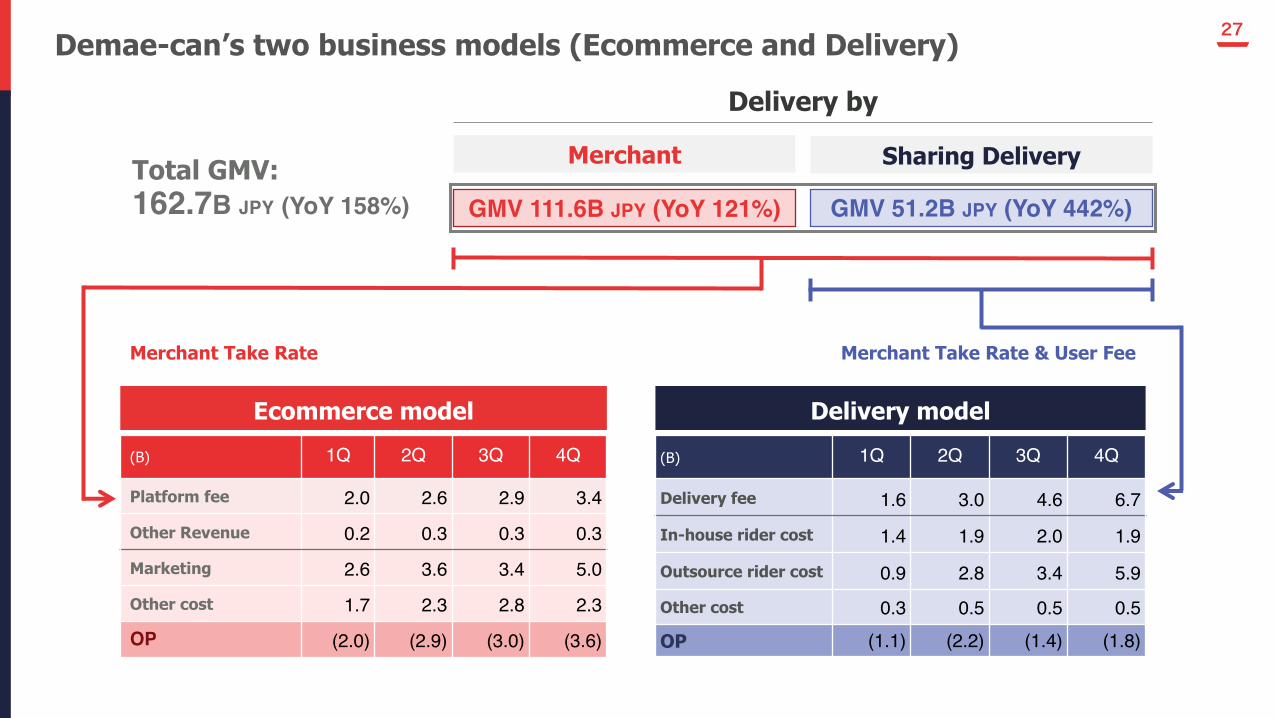
27Demae-can’s two business models (Ecommerce and Delivery)
GMV 111.6B JPY (YoY 121%)
Merchant Take Rate Merchant Take Rate & User Fee
GMV 51.2B JPY (YoY 442%)
(B) 1Q 2Q 3Q 4Q
Platform fee 2.0 2.6 2.9 3.4
Other Revenue 0.2 0.3 0.3 0.3
Marketing 2.6 3.6 3.4 5.0
Other cost 1.7 2.3 2.8 2.3
OP (2.0) (2.9) (3.0) (3.6)
(B) 1Q 2Q 3Q 4Q
Delivery fee 1.6 3.0 4.6 6.7
In-house rider cost 1.4 1.9 2.0 1.9
Outsource rider cost 0.9 2.8 3.4 5.9
Other cost 0.3 0.5 0.5 0.5
OP (1.1) (2.2) (1.4) (1.8)
Ecommerce model Delivery model
Total GMV:162.7B JPY (YoY 158%)
Delivery by
Sharing Delivery Merchant
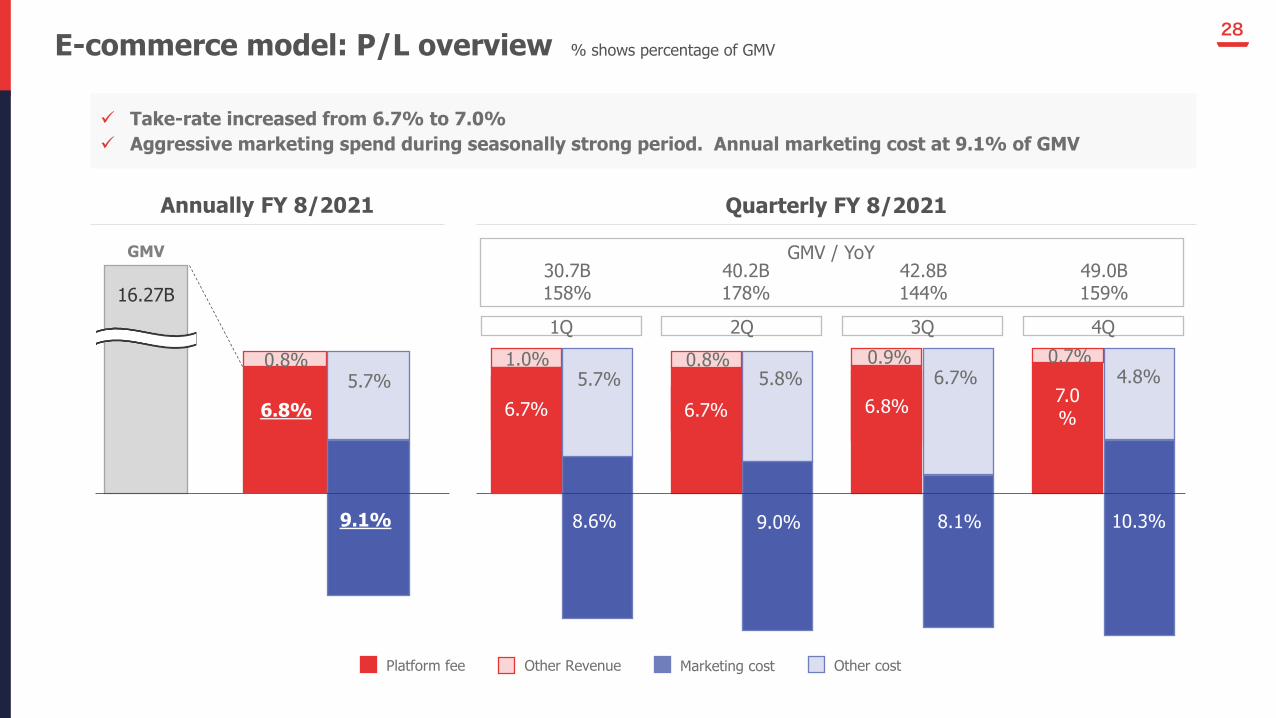
28E-commerce model: P/L overview
Annually FY 8/2021 Quarterly FY 8/2021
ü Take-rate increased from 6.7% to 7.0%ü Aggressive marketing spend during seasonally strong period. Annual marketing cost at 9.1% of GMV
% shows percentage of GMV
1Q 2Q 3Q 4Q
6.8%
16.27B
GMV
9.1%
0.8%5.7%
Platform fee Other Revenue Marketing cost Other cost
GMV / YoY30.7B158%
40.2B178%
42.8B144%
49.0B159%
5.8%
9.0%
6.7%6.7%
8.1%
6.8%4.8%
10.3%
7.0%
1.0%
6.7%
8.6%
5.7%0.8% 0.9% 0.7%
29
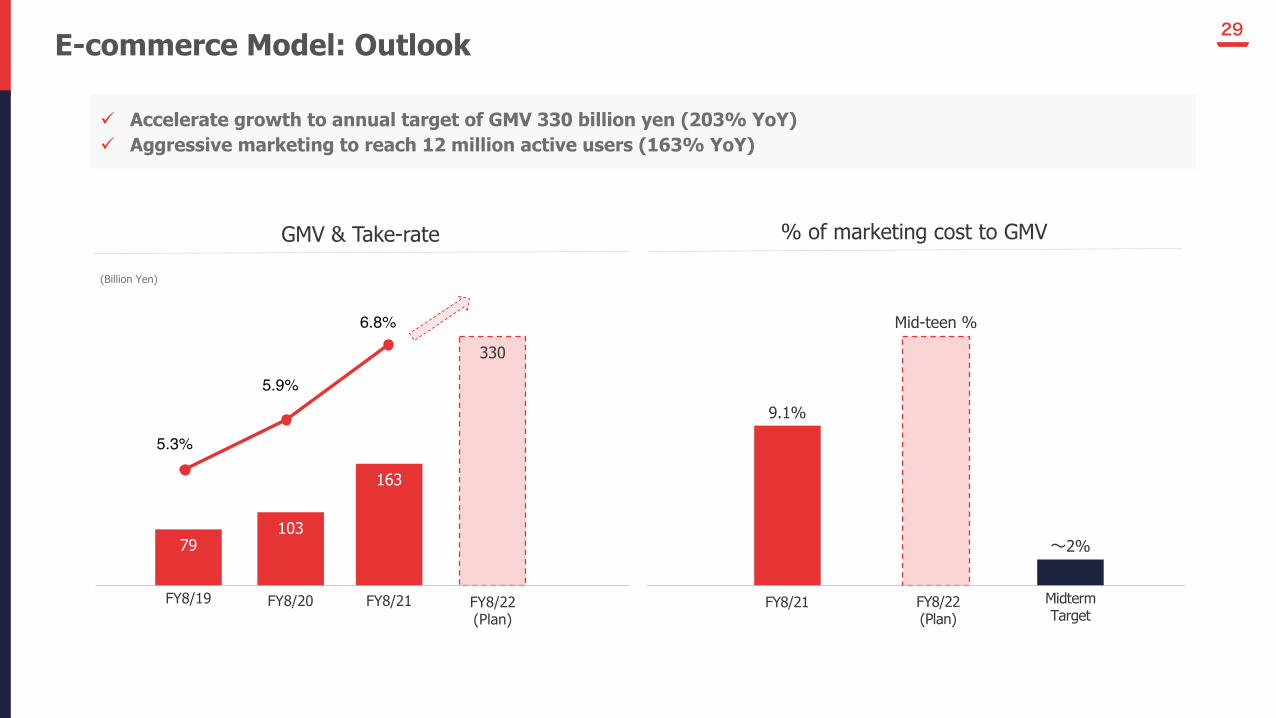
5.3%
5.9%
6.8%
E-commerce Model: Outlook
ü Accelerate growth to annual target of GMV 330 billion yen (203% YoY)ü Aggressive marketing to reach 12 million active users (163% YoY)
(Billion Yen)
1
79
FY8/19
103
163
330
9.1%
Mid-teen %
MidtermTarget
~2%
FY8/20 FY8/21 FY8/22(Plan)
FY8/21 FY8/22(Plan)
GMV & Take-rate % of marketing cost to GMV

30Delivery Unit Economics
Delivery Fee2
OutsourceRider Cost4
In-house Rider Cost3
Lease and other cost5
Delivery by Outsource RiderDelivery by In-house Rider
82%18% vs% of orders7
39%
85%
61%
15%
FY 8/20 FY 8/21
Delivery by in-house riderDelivery by Outsourced riderScale / Volume / Cost EffectiveQuality Control / Faster TTM / Branding
% of orders
Delivery Fee2
1. Illustrative model based on actual figures for June 20212. Commission from Merchants for Sharing Delivery service and Delivery fee from Users 3. Represents cost paid to In-house Riders, which refers to part-time staff hired by Demae-can, paid by hour4. Represents cost paid to individual or corporate Contract Riders who deliver on behalf of Demae-can, paid per delivery5. Includes lease of office and bike/motorcycle, and cost of utilities and consumables6. Includes recruiting cost, communication expenses, travel cost, transaction fee, and others7. Based on actual orders during June 2021
Contribution profit
Common Cost6
Common Cost6
Contribution Profit
Next page
Unit Economics1 (per delivery, June actual) Shifting Orders
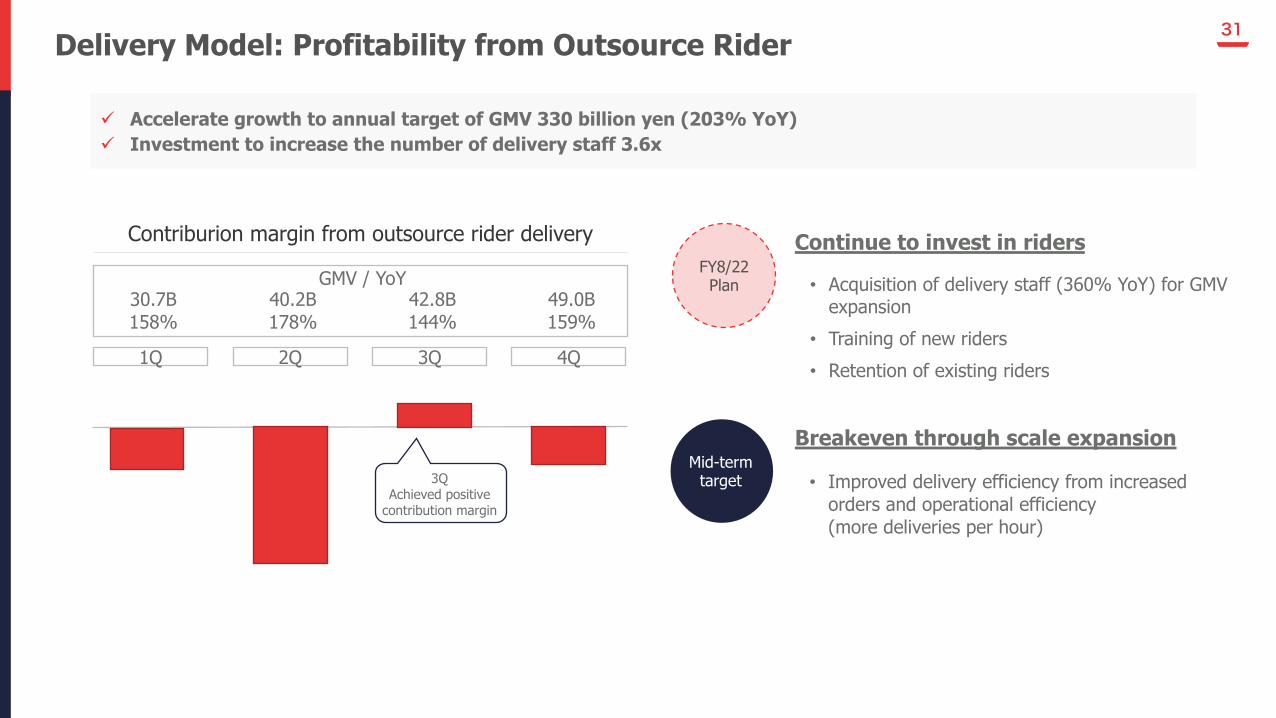
31Delivery Model: Profitability from Outsource Rider
ü Accelerate growth to annual target of GMV 330 billion yen (203% YoY)ü Investment to increase the number of delivery staff 3.6x
1Q 2Q 3Q 4Q
Contriburion margin from outsource rider delivery
GMV / YoY30.7B158%
40.2B178%
42.8B144%
49.0B159%
• Improved delivery efficiency from increased orders and operational efficiency(more deliveries per hour)
Breakeven through scale expansion
• Acquisition of delivery staff (360% YoY) for GMV expansion
• Training of new riders• Retention of existing riders
FY8/22Plan
Continue to invest in riders
3QAchieved positive
contribution margin
Mid-termtarget
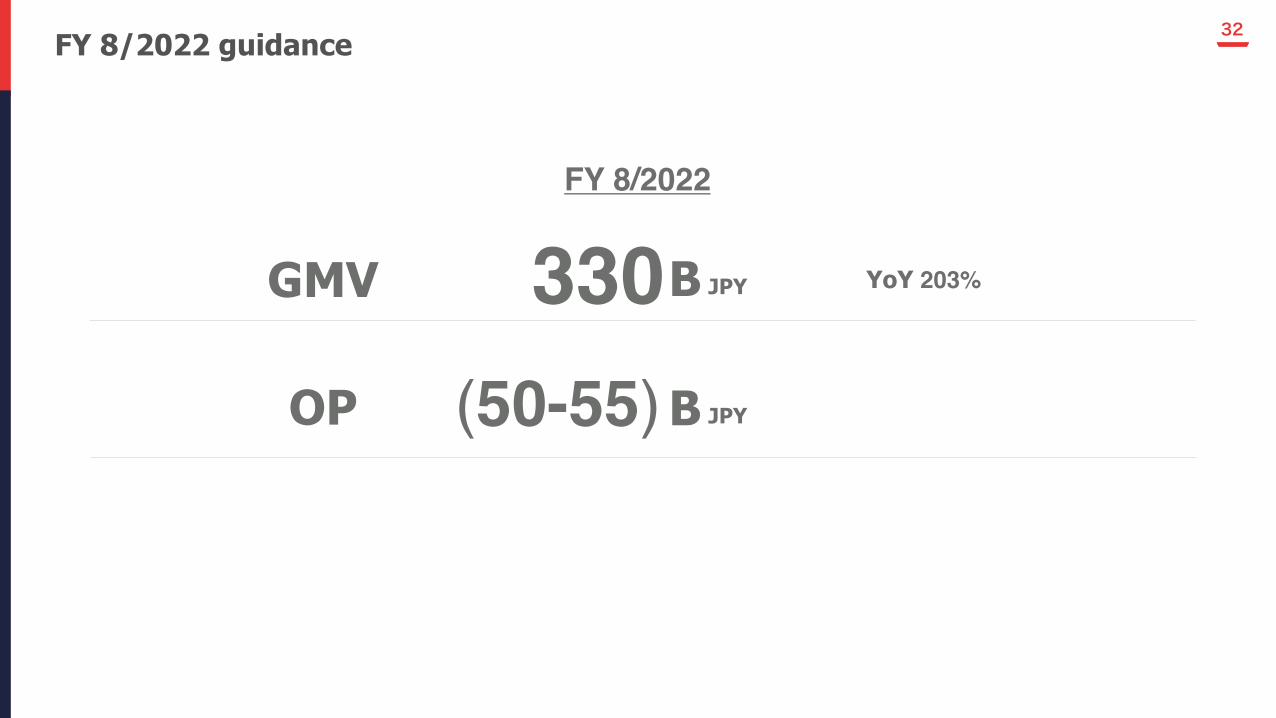
32FY 8/2022 guidance
GMV
OP
FY 8/2022
(50-55)
330 YoY 203%B JPY
B JPY
Appendix
34
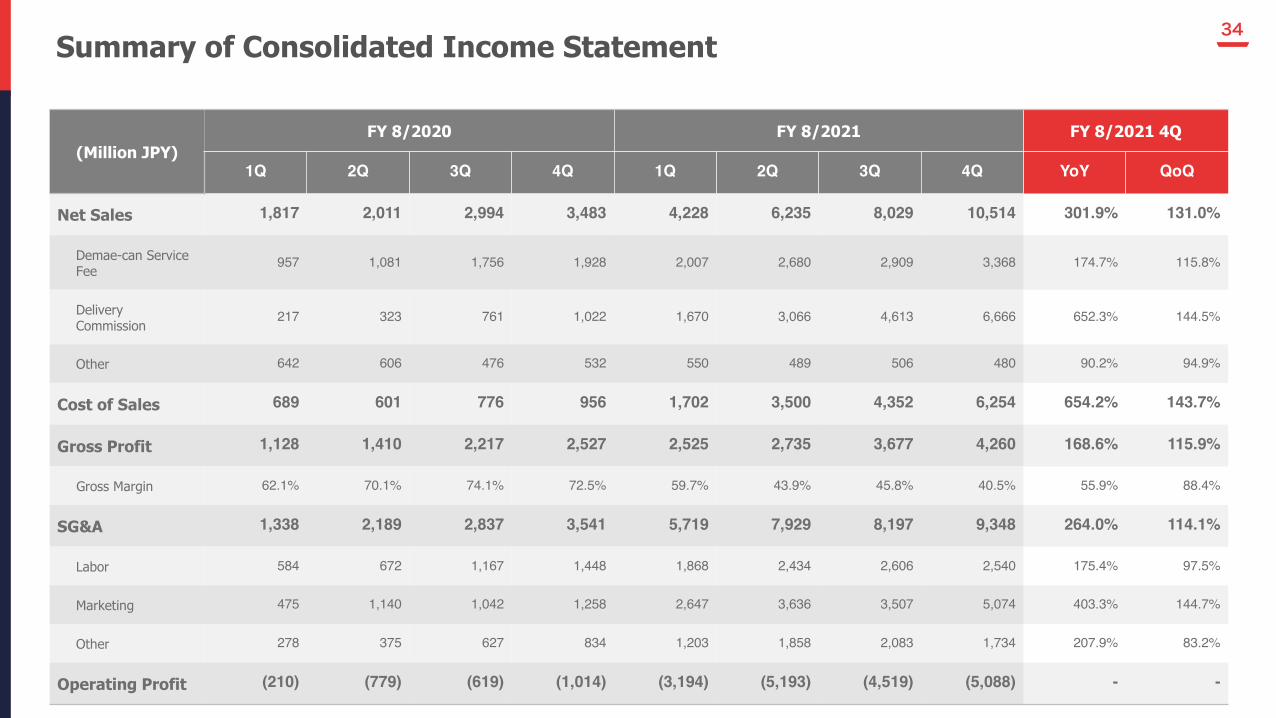
(Million JPY)FY 8/2020 FY 8/2021 FY 8/2021 4Q
1Q 2Q 3Q 4Q 1Q 2Q 3Q 4Q YoY QoQ
Net Sales 1,817 2,011 2,994 3,483 4,228 6,235 8,029 10,514 301.9% 131.0%
Demae-can Service Fee 957 1,081 1,756 1,928 2,007 2,680 2,909 3,368 174.7% 115.8%
Delivery Commission 217 323 761 1,022 1,670 3,066 4,613 6,666 652.3% 144.5%
Other 642 606 476 532 550 489 506 480 90.2% 94.9%
Cost of Sales 689 601 776 956 1,702 3,500 4,352 6,254 654.2% 143.7%
Gross Profit 1,128 1,410 2,217 2,527 2,525 2,735 3,677 4,260 168.6% 115.9%
Gross Margin 62.1% 70.1% 74.1% 72.5% 59.7% 43.9% 45.8% 40.5% 55.9% 88.4%
SG&A 1,338 2,189 2,837 3,541 5,719 7,929 8,197 9,348 264.0% 114.1%
Labor 584 672 1,167 1,448 1,868 2,434 2,606 2,540 175.4% 97.5%
Marketing 475 1,140 1,042 1,258 2,647 3,636 3,507 5,074 403.3% 144.7%
Other 278 375 627 834 1,203 1,858 2,083 1,734 207.9% 83.2%
Operating Profit (210) (779) (619) (1,014) (3,194) (5,193) (4,519) (5,088) - -
Summary of Consolidated Income Statement

35
Demae-can Service Fee • Demae-can platform fee
Delivery Commission • Sharing delivery fee• Delivery fee from user
Other• Payment service fee• Commerce business revenue from
subsidiary
Cost of Sales• Outsourcing fee (Outsource delivery)• System operating costs, etc.• Payment service fee
Labor • Part-time fee (In-house delivery)• Employee, stock option
Marketing • Advertisement cost• Promotion cost
SG&A
• Outsourcing fee (merchant acquisition)• Lease and supplies• Commissions• Rent and others
Cost of Sales/SG&ARevenue
Breakdown of each line item
36
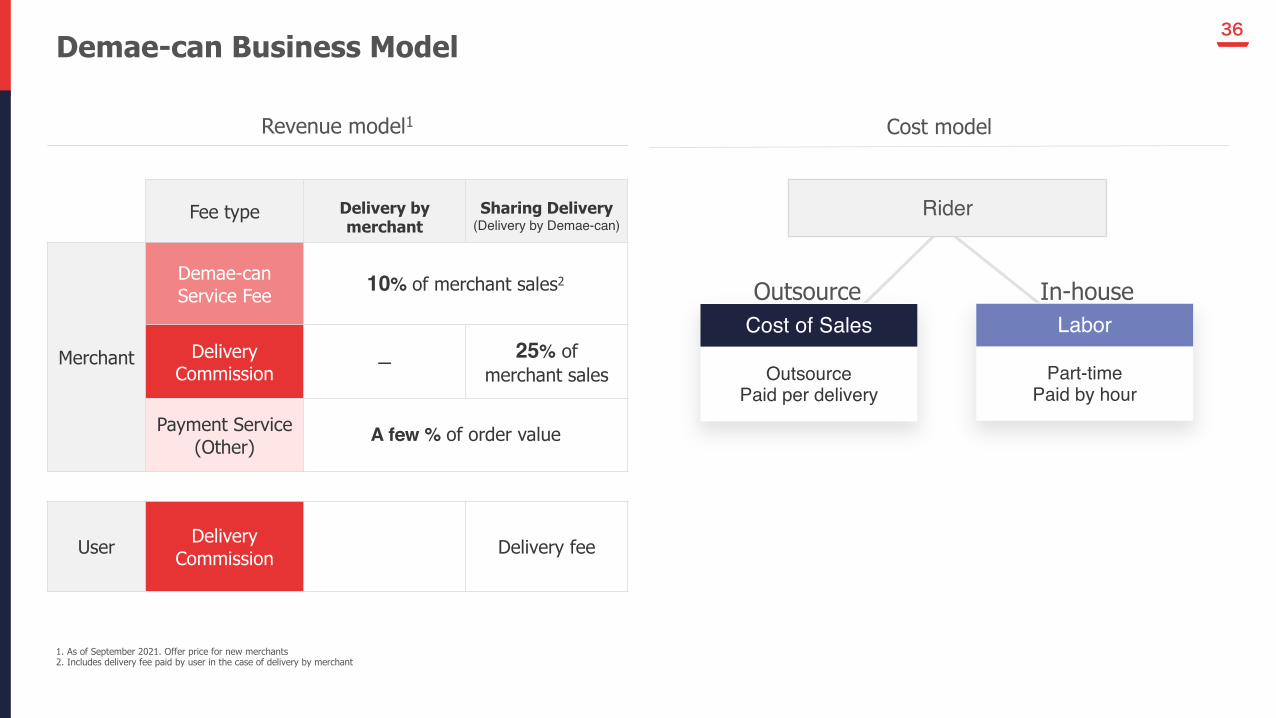
Revenue model1 Cost model
1. As of September 2021. Offer price for new merchants2. Includes delivery fee paid by user in the case of delivery by merchant
Part-timePaid by hour
Labor
Outsource Paid per delivery
Cost of Sales
RiderFee type Delivery by merchant
Sharing Delivery
Merchant
Demae-can Service Fee 10% of merchant sales2
Delivery Commission - 25% of
merchant sales
Payment Service (Other) A few % of order value
User Delivery Commission Delivery fee
(Delivery by Demae-can)
Demae-can Business Model
Outsource In-house

Thank you
Please note that the future forecasts contained in this presentation material are based on the information available as of the date hereof and actual business results may differ significantly due to various factors. Please refrain from using this presentation material or data without prior permission.
![FY Ended March 2014 Full Year Results Presentation · 2018-08-10 · FY Ended March 2014 Full Year Results Presentation May 12th, 2014 SEGA SAMMY HOLDINGS INC. [Disclaimer] The contents](https://img.pdfslide.net/doc/110x75/5f02c76e7e708231d405f7de/fy-ended-march-2014-full-year-results-presentation-2018-08-10-fy-ended-march-2014.jpg)


![Q4 and full year FY 2016 Earning Presentation [Company Update]](https://img.pdfslide.net/doc/110x75/577c7de81a28abe054a00e9b/q4-and-full-year-fy-2016-earning-presentation-company-update.jpg)