Embed Size (px)
Citation preview


UNITED STATESSECURITIES AND EXCHANGE COMMISSION
Washington, D.C. 20549
FORM 10-K(Mark One)È Annual Report pursuant to Section 13 or 15(d) of the Securities Exchange Act of 1934
For the fiscal year ended January 31, 2009
OR
‘ Transition report pursuant to Section 13 or 15(d) of the Securities Exchange Act of 1934Commission File Number: 001-32224
salesforce.com, inc.(Exact name of registrant as specified in its charter)
Delaware 94-3320693(State or other jurisdiction ofincorporation or organization)
(IRS EmployerIdentification No.)
The Landmark @ One Market, Suite 300San Francisco, California 94105(Address of principal executive offices)
Telephone Number (415) 901-7000(Registrant’s telephone number, including area code)
Securities registered pursuant to Section 12(b) of the Act:Title of each class Name of each exchange on which registered
Common Stock, par value $0.001 per share New York Stock Exchange, Inc.
Securities registered pursuant to section 12(g) of the Act:Not applicable
Indicate by check mark if the Registrant is a well-known seasoned issuer, as defined in Rule 405 of the SecuritiesAct. Yes È No ‘
Indicate by check mark if the Registrant is not required to file reports pursuant to Section 13 or Section 15(d) ofAct. Yes ‘ No È
Indicate by check mark whether the Registrant (1) has filed all reports required to be filed by Section 13 or 15(d) of the SecuritiesExchange Act of 1934 during the preceding 12 months (or for such shorter period that the registrant was required to file such reports), and(2) has been subject to such filing requirements for the past 90 days: Yes È No ‘
Indicate by check mark if disclosure of delinquent filers pursuant to Item 405 of Regulation S-K (Section 229.405 of this chapter) isnot contained herein, and will not be contained, to the best of Registrant’s knowledge, in definitive proxy or information statementsincorporated by reference in Part III of this Form 10-K or any amendment to this Form 10-K. ‘
Indicate by check mark whether the registrant is a large accelerated filer, an accelerated filer, a non-accelerated filer or a smallerreporting company. See the definitions of “large accelerated filer,” “accelerated filer” and “smaller reporting company” in Rule 12b-2 ofthe Exchange Act. (Check one):
Large accelerated filer È Accelerated filer ‘ Non-accelerated filer ‘ Smaller reporting company ‘Indicate by check mark whether the registrant is a shell company (as defined in Rule 12b-2 of the Act). Yes ‘ No ÈBased on the closing price of the Registrant’s common stock on the last business day of the Registrant’s most recently completed
second fiscal quarter, which was July 31, 2008, the aggregate market value of its shares (based on a closing price of $63.79 per share) heldby non-affiliates was approximately $6.0 billion. Shares of the Registrant’s common stock held by each executive officer and director andby each entity or person that owned 5 percent or more of the Registrant’s outstanding common stock were excluded in that such personsmay be deemed to be affiliates. This determination of affiliate status is not necessarily a conclusive determination for other purposes.
As of January 31, 2009, there were approximately 122.9 million shares of the Registrant’s Common Stock outstanding.
DOCUMENTS INCORPORATED BY REFERENCEPortions of the Registrant’s definitive proxy statement for its fiscal 2009 Annual Meeting of Stockholders (the “Proxy Statement”), to
be filed within 120 days of the Registrant’s fiscal year ended January 31, 2009, are incorporated by reference in Part III of this Report onForm 10-K. Except with respect to information specifically incorporated by reference in this Form 10-K, the Proxy Statement is notdeemed to be filed as part of this Form 10-K.

[THIS PAGE INTENTIONALLY LEFT BLANK]

salesforce.com, inc.
INDEX
Page No.
PART I
Item 1. Business . . . . . . . . . . . . . . . . . . . . . . . . . . . . . . . . . . . . . . . . . . . . . . . . . . . . . . . . . . . . . . . . . . 1
Item 1A. Risk Factors . . . . . . . . . . . . . . . . . . . . . . . . . . . . . . . . . . . . . . . . . . . . . . . . . . . . . . . . . . . . . . . 15
Item 1B. Unresolved Staff Comments . . . . . . . . . . . . . . . . . . . . . . . . . . . . . . . . . . . . . . . . . . . . . . . . . . . 29
Item 2. Properties . . . . . . . . . . . . . . . . . . . . . . . . . . . . . . . . . . . . . . . . . . . . . . . . . . . . . . . . . . . . . . . . . 30
Item 3. Legal Proceedings . . . . . . . . . . . . . . . . . . . . . . . . . . . . . . . . . . . . . . . . . . . . . . . . . . . . . . . . . . . 30
Item 4. Submission of Matters to a Vote of Security Holders . . . . . . . . . . . . . . . . . . . . . . . . . . . . . . . 30
Item 4A. Executive Officers of the Registrant . . . . . . . . . . . . . . . . . . . . . . . . . . . . . . . . . . . . . . . . . . . . . 30
PART II
Item 5. Market for Registrant’s Common Equity, Related Stockholder Matters and Issuer Purchasesof Equity Securities . . . . . . . . . . . . . . . . . . . . . . . . . . . . . . . . . . . . . . . . . . . . . . . . . . . . . . . . . . 32
Item 6. Selected Financial Data . . . . . . . . . . . . . . . . . . . . . . . . . . . . . . . . . . . . . . . . . . . . . . . . . . . . . . . 34
Item 7. Management’s Discussion and Analysis of Financial Condition and Results ofOperations . . . . . . . . . . . . . . . . . . . . . . . . . . . . . . . . . . . . . . . . . . . . . . . . . . . . . . . . . . . . . . . . . 36
Item 7A. Quantitative and Qualitative Disclosures About Market Risk . . . . . . . . . . . . . . . . . . . . . . . . . 53
Item 8. Consolidated Financial Statements and Supplementary Data . . . . . . . . . . . . . . . . . . . . . . . . . 55
Item 9. Changes in and Disagreements with Accountants on Accounting and FinancialDisclosure . . . . . . . . . . . . . . . . . . . . . . . . . . . . . . . . . . . . . . . . . . . . . . . . . . . . . . . . . . . . . . . . . 90
Item 9A. Controls and Procedures . . . . . . . . . . . . . . . . . . . . . . . . . . . . . . . . . . . . . . . . . . . . . . . . . . . . . . 90
Item 9B. Other Information . . . . . . . . . . . . . . . . . . . . . . . . . . . . . . . . . . . . . . . . . . . . . . . . . . . . . . . . . . . 91
PART III
Item 10. Directors, Executive Officers of the Registrant and Corporate Governance Matters . . . . . . . 92
Item 11. Executive Compensation . . . . . . . . . . . . . . . . . . . . . . . . . . . . . . . . . . . . . . . . . . . . . . . . . . . . . 92
Item 12. Security Ownership of Certain Beneficial Owners and Management and RelatedStockholder Matters . . . . . . . . . . . . . . . . . . . . . . . . . . . . . . . . . . . . . . . . . . . . . . . . . . . . . . . . . 92
Item 13. Certain Relationships and Related Transactions and Director Independence . . . . . . . . . . . . . 92
Item 14. Principal Accounting Fees and Services . . . . . . . . . . . . . . . . . . . . . . . . . . . . . . . . . . . . . . . . . . 92
PART IV
Item 15. Exhibits, Financial Statement Schedules . . . . . . . . . . . . . . . . . . . . . . . . . . . . . . . . . . . . . . . . . 93
Signatures . . . . . . . . . . . . . . . . . . . . . . . . . . . . . . . . . . . . . . . . . . . . . . . . . . . . . . . . . . . . . . . . . . . . . . . . . . 94
Index to Exhibits
i

[THIS PAGE INTENTIONALLY LEFT BLANK]

FORWARD-LOOKING INFORMATION
This Annual Report on Form 10-K, including the section titled “Management’s Discussion and Analysis ofFinancial Condition and Results of Operations” (“MD&A”) in Item 7, contains forward-looking statementswithin the meaning of Section 27A of the Securities Act of 1933 and Section 21E of the Securities Exchange Actof 1934. Forward-looking statements consist of, among other things, trend analyses, statements regarding futureevents, future financial performance, our business strategy and our plan to build our business, the expensesassociated with increasing our data center capacity, our anticipated growth, trends in our business, newapplication service features, our strategy of acquiring or making investments in complementary companies,services and technologies, the effect of general economic and market conditions, sudden declines in the fair valueof our investments in cash equivalents and marketable securities, the effect of foreign currency exchange rateand interest rate fluctuations on our financial results, the potential availability of additional tax assets in thefuture and related matters, the impact of expensing stock options, the sufficiency of our capital resources, andour strategy to be the leading provider of CRM application services and the leading platform on which customersand partners build Software-as-a-Service applications, all of which are based on current expectations, estimates,and forecasts, and the beliefs and assumptions of our management. Words such as “expects,” “anticipates,”“projects,” “intends,” “plans,” “believes,” “estimates,” variations of such words, and similar expressions arealso intended to identify such forward-looking statements. These forward-looking statements are subject to risks,uncertainties and assumptions that are difficult to predict. Therefore, actual results may differ materially andadversely from those expressed in any forward-looking statements. Readers are directed to risks anduncertainties identified below, under “Risk Factors” in Item 1A and elsewhere in this report, for factors that maycause actual results to be different than those expressed in these forward-looking statements. Except as requiredby law, we undertake no obligation to revise or update publicly any forward-looking statements for any reason.
PART I
ITEM 1. BUSINESS
Overview
We are the leading provider, based on revenues and market share, of software on demand, according to aJuly 2008 report by International Data Corporation, or IDC. We provide a comprehensive customer relationshipmanagement, or CRM, service to businesses of all sizes and industries worldwide and we provide a technologyplatform for customers and developers to build and run business applications. Approximately 55,400 customersworldwide use salesforce.com to manage their customer, sales and operational data.
We were incorporated in Delaware in February 1999, founded on the simple concept of delivering enterprisebusiness applications via the Internet, and we introduced our first service offering in February 2000. Since then,we have augmented our CRM service with new editions and enhanced features, introduced other enterprise cloudcomputing applications on our Force.com cloud computing platform that allows customers and developers tobuild applications that are complementary to or extend beyond CRM, and introduced our Force.comAppExchange directory, or AppExchange, of enterprise cloud computing applications that are integrated with ourCRM service and in many cases were developed on our platform by third parties.
Our principal executive offices are located in San Francisco, California and our principal website address iswww.salesforce.com. Our office address is The Landmark @ One Market, Suite 300, San Francisco, California94105.
We designed and developed our offering to be an easy-to-use and intuitive solution that can be deployedrapidly, can be customized easily and can be integrated with other software applications. We deliver our servicethrough a standard Web browser. Customers who use our enterprise cloud computing CRM service and platformare able to avoid many of the expenses and complexities of traditional enterprise software development andimplementations. As a result, our customers incur less risk and lower upfront costs and benefit from increasedproductivity.
1
We market our service to businesses on a subscription basis, primarily through our direct sales efforts andalso indirectly through partners. Our revenues have increased from $749 million in fiscal 2008 to $1,077 millionin fiscal 2009. As of January 31, 2009, our customer base had grown to approximately 55,400 worldwide fromapproximately 41,000 customers a year ago.
Through our Force.com cloud computing platform and developer tools and our AppExchange directory, wealso encourage third parties, including customers and independent software vendors, to develop additionalfunctionality and applications that run on our platform, but which are sold separately from or in conjunction withour CRM service.
Industry Background
The Enterprise Application Software Market
Over the last thirty-five years, there have been several shifts in the way vendors deliver enterprise softwareapplications. In the 1970s and 1980s, companies deployed application software through centralized mainframebased systems. In the 1990s, the mainframe model evolved to client/server computing, in which applicationswere run in a more distributed model. Historically, only large businesses could afford to make investments inenterprise resource planning, or ERP, and CRM applications, to gain an enterprise-wide view of all businessinformation and automate and improve basic processes. In addition, large businesses attempted to customize andconnect various incompatible packaged applications through time-consuming, extensive and costly integrationefforts. However, many large enterprises never realized the benefits of these applications for a variety of reasons,including the difficulty of deployment, low user adoption rates, lack of ubiquitous access, high total cost ofownership and a relatively low return on investment.
In an attempt to address these challenges, many enterprise software application vendors adapted their client/server products to be accessible over the Internet. However, because these hosted applications were not originallydesigned to be delivered over the Internet, they failed to provide the level of access and economies of scale of amulti-tenant solution, which allows all users and applications to share a single, common hardware infrastructureand software code base that is centrally maintained. As such, hosted client/server applications remain limited intheir ability to address the needs of large and small businesses.
Cloud Computing
Cloud computing refers to the use of Internet (“cloud”) based computing, storage and connectivitytechnology for a variety of different services. The pervasiveness of the Internet, along with the dramatic declinein the pricing of the technology components has enabled this new generation of computing, in which dynamicallyscalable and often virtual resources are provided as a service to both enterprises and consumers. Users need nothave knowledge of, expertise in, or control over the technology infrastructure “in the cloud” that supports them.
In the context of enterprise business applications, cloud computing fundamentally changes the way businessapplications are developed and deployed. Application developers no longer need to create and manage their owninfrastructure of servers, storage, network devices, operating system software and development tools in order tocreate a business application. Instead, the entire infrastructure is managed in the cloud, and developers simplyuse an Internet browser to access the development environment. Application users are able to gain access to avariety of business applications via an Internet browser or mobile device, and are able to take advantage of arobust, secure, scalable and highly available application at a relatively low cost, without the cost and complexityof managing the application.
Enterprise cloud computing, which refers to business applications that are developed using the cloud and atechnology platform that customers and developers use to build and run business applications, includes bothapplication Software-as-a-Service for users and Platform-as-a-Service for developers.
2

Software-as-a-Service (“SaaS”)
SaaS enables businesses to subscribe to a wide variety of application services that are developed specificallyfor, and delivered over, the Internet on an as-needed basis with little or no implementation services required andwithout the need to install and manage third-party software in-house.
SaaS contrasts with the traditional enterprise software model, which requires each customer to install,configure, manage and maintain the hardware, software and network services to implement a softwareapplication in-house. Moreover, traditional enterprise software vendors must maintain support for numerouslegacy versions of their software and compatibility with a wide array of hardware devices and operatingenvironments. As a result, they either have to dedicate fewer resources to innovation, or incur higher researchand development expenses as a percentage of revenue compared with on-demand application service providers.
We believe the market should not discriminate between small and large companies, and businesses of allsizes and across all industries should be able to use the same software based on a multi-tenant architecture. Thisarchitecture enables us to leverage a common infrastructure and software code base across all customers whobenefit from access to the most current release of the application, automated upgrades, more rapid innovation andthe economies of a shared infrastructure.
We believe the shift to SaaS applications provides significant benefits even beyond those associated withmulti-tenant infrastructure. Businesses are able to realize many of the benefits offered by traditional enterprisesoftware vendors, such as a comprehensive set of features and functionality and the ability to customize andintegrate with other applications, while at the same time reducing the risks and lowering the total costs of owningenterprise software. As a result, we believe the continued emergence of SaaS applications is bringing about afundamental transformation in the enterprise software industry as businesses will be able to replace theirpurchased software with subscriptions to a wide range of application services.
Platform-as-a-Service (“PaaS”)
We believe that SaaS applications and their related success in the market are the most widely understoodsegment of enterprise cloud computing. However, enterprise cloud computing also includes building SaaSapplications on an application development platform. This market is called Platform-as-a-Service.
Application developers use PaaS technology to build both custom applications for individual businesses orvertical industries and horizontal applications to address standard business processes that can be sold to a broadrange of potential customers. Application developers include corporate information technology (IT) departmentsthat typically develop applications for a company’s internal use and independent software vendors (ISVs) thatdevelop applications to sell to customers. Traditionally, these developers have needed to purchase, install, testand maintain complex software and hardware infrastructure to develop and deliver their applications. Thisrequirement resulted in more time and resources spent maintaining infrastructure and less time and resourcesbeing available to develop applications, with a resulting impact on innovation and productivity levels.
PaaS enables corporate IT developers and ISVs to leverage the benefits of a multi-tenant platform fordeveloping new applications. PaaS allows developers to build applications with a browser and an Internetconnection, just as SaaS allows users to use applications through a browser.
Our Solution
Our flagship Salesforce CRM applications, which were initially introduced in February 2000, helpcompanies better record, track, manage, analyze and share information regarding sales, customer service andsupport, and marketing operations. Our Force.com cloud computing platform, which was introduced in 2007,allows customers and partners to more extensively customize and integrate Salesforce CRM applications or buildentirely new SaaS applications beyond CRM without having to invest in new software, hardware and related
3

infrastructure. These newly developed applications, which are hosted and run on our infrastructure, can then beused for internal operations or sold to third parties. We also offer the AppExchange, an online directory for SaaSapplications, where customers can browse, test-drive and install applications from salesforce.com and ourpartners. Since we introduced the AppExchange directory in 2006, more than 800 applications developed mostlyby our partners have been posted to the directory.
Substantially all of our subscription and support revenue comes from subscriptions to our core CRMapplication services, all of which include the customization benefits of the Force.com platform. Customers canalso build their own application services on the Force.com platform, or install those built on Force.com bypartners from the AppExchange. In order for customers to install and run custom applications, whether built bythemselves or by our partners, they must be a subscriber to our service.
As of January 31, 2009, our customer base had grown to approximately 55,400 worldwide. We provide ourservice to organizations through our proprietary, scalable, and secure enterprise cloud computing, multi-tenantapplication architecture, which allows us to serve large numbers of customers cost-effectively.
By subscribing to our service, our customers do not have to make large and potentially risky upfrontinvestments in software, hardware, implementation services and IT staff as they would with traditional softwaresolutions. We believe that our service enables businesses to rapidly achieve the benefits of higher productivity,and lower their total cost of ownership for their business application.
Key advantages of our solution include:
• Secure, scalable and reliable delivery platform. The delivery platform for our service has beendesigned to provide our customers with high levels of reliability, performance, and security. We havebuilt, and continue to invest in, a comprehensive security infrastructure, including firewalls, intrusiondetection systems, and encryption for transmissions over the Internet, which we monitor and test on aregular basis. In addition, all of our customers’ data is replicated in near real-time to help protect thedata and ensure service continuity in the event of a major disaster. We built and maintain a multi-tenantapplication architecture that has been designed to enable our service to scale securely, reliably, andcost-effectively. Our multi-tenant application architecture maintains the integrity and separation ofcustomer data while still permitting all customers to use the same application functionalitysimultaneously. Our architecture also enables customers to segment access privileges across their userbase.
• Rapid deployment. Our service can be deployed rapidly since our customers do not have to spend timeprocuring, installing or maintaining the servers, storage, networking equipment, security products, orother infrastructure hardware and software necessary to ensure a scalable and reliable service. Webelieve the average time that a customer requires to deploy our service is significantly shorter thantypical, traditional enterprise software deployments. We also offer consulting, training services, andonline resources to assist customers in rapidly deploying and optimizing their use of our service.
• Ease of integration and development. Our platform is designed to enable IT professionals to integrateour service with existing applications quickly and seamlessly. Our Force.com platform provides a setof application programming interfaces, or APIs, that enable customers and independent developers toboth integrate our service with existing third-party, custom, and legacy applications and write their ownapplication services that integrate with our service. For example, many of our customers use theForce.com API to move customer-related data from custom-developed and legacy applications into ourservice on a periodic basis to provide greater visibility into their activities. Other customers andpartners have, for example, developed their own talent management solutions and procurementsolutions on the Force.com platform.
• Lower total cost of ownership. We enable customers to achieve significant upfront savings relative tothe traditional enterprise software model. Customers benefit from the predictability of their future costs
4

since they pay for the service on a per subscriber basis for the term of the subscription contract. Allupgrades are included in our service, so customers are not burdened or disrupted by the periodic needto perform system upgrades. Because we implement all upgrades on our servers, new features andfunctionality automatically become part of our service on the release date and therefore benefit all ofour customers immediately.
• Driving innovation. By providing infrastructure and development environments on demand, we providedevelopers the opportunity to create new and innovative applications without having to invest inhardware and distribution. A developer with an idea for a new application can log onto our platform,develop, host and support their system on Force.com and make the application accessible for a fee toour 55,400 customers.
• High levels of user adoption. We have designed our service to be easy to use and intuitive. Since ourservice contains many tools and features recognizable to users of popular websites such as those ofAmazon, eBay, and Google, it has a more familiar interface than typical enterprise CRM applications.As a result, our users do not require substantial training on how to use and benefit from our service. Weconduct extensive surveys of our users to gauge their experiences with our service so that we maydetermine potential areas of improvement. In addition, because of the nature of our service, we receiveconstant, automated feedback as to which features customers use or don’t use, allowing us to improveour service based on this information.
Our Strategy
Our objective is to be the leading provider of CRM application services. We also want to be the leadingplatform on which our customers and partners build SaaS applications. Key elements of our strategy include:
• Strengthening our existing CRM applications and extending into new functional areas within CRM.Wedesigned our service to easily accommodate new features and functions. We intend to continue to addCRM features and functionality to our core service that we will make available to customers at noadditional charge. We offer advanced modules for an additional subscription fee to customers thatrequire enhanced CRM capabilities. Our growing portfolio of applications includes: Salesforce CRMAutomation, Salesforce CRM Marketing Automation, Salesforce CRM Partner RelationshipManagement, Salesforce CRM Call Center Management, Salesforce CRM Content Management andSalesforce CRM Ideas. We also evaluate acquisition or investment opportunities in complementarycompanies, services and technologies in an effort to strengthen and extend our service CRM offerings.
• Pursuing new customers and new territories aggressively. We believe that our SaaS and PaaS offeringsprovide significant value for businesses of any size, from small businesses to the largest Fortune 500corporations. As a result, we will continue to aggressively target businesses of all sizes, primarilythrough our direct sales force. We have steadily increased and plan to continue to increase the numberof direct sales professionals we employ, and we intend to develop additional distribution channels forour service. We have created several editions of our service to address the distinct requirements ofbusinesses of different sizes. We also believe that there is a substantial market opportunity for ourservice outside of North America. We plan to continue to aggressively market to customers outside ofNorth America by recruiting local sales and support professionals, building partnerships that help usadd customers in these regions and by increasing the number of languages that our service supports.
• Deepening relationships with our existing customer base. We believe there is significant opportunity toleverage our relationships with existing customers. As the customer realizes the benefits of our service,we try to sell more subscriptions by targeting additional functional areas and business units within thecustomer organization and pursuing enterprise-wide deployments. We also want to provideprofessional service offerings that are complementary to our service and enable us to sell subscriptionsto larger customers who require assistance with complex integrations and customizations. In addition,by continuously enhancing the functionality of our service, we believe that customers will find more
5

uses for our service and therefore purchase additional subscriptions, continue to renew their existingsubscriptions, and upgrade to more fully-featured versions, such as our Unlimited Edition.
• Continuing to lead the industry transformation to cloud computing. We believe that the markettransformation to application and platform services is a growing trend in the information technologyindustry. We enable customers of all sizes to benefit from the capabilities of enterprise softwareapplications. We believe we have established a leadership position in this new enterprise cloudcomputing industry both as a successful vendor of SaaS CRM application services and also as anenabler for third parties to create their own SaaS applications through our platform. We seek to extendour leadership position in this industry by continuing to innovate and bringing new application andplatform services and value-added technologies to market, as well as by providing the tools needed bythird parties to develop their own SaaS applications on our platform.
• Encouraging the development of third-party applications on our Force.com cloud computing platform.Our Force.com cloud computing platform enables existing customers and third-party developers todevelop and deliver SaaS applications they have built in our multi-tenant environment. It is a platformon which applications can be created, tested, published, and run. In addition, these applications can belisted on the AppExchange, our online marketplace of SaaS applications. We believe the ecosystem ofSaaS developers will address the business requirements of both current and potential customers.
The Salesforce CRM Service
We provide a comprehensive array of SaaS CRM services, which enable customers and subscribers tosystematically record, store, analyze, share and act upon business data, and to help businesses manage customeraccounts, track sales leads, evaluate marketing campaigns, and provide post-sales service. We also enablecompanies to generate reports and summaries of this data and share them with authorized individuals acrossfunctional areas. Most of the features of our service can be accessed through a variety of devices, includinglaptop computers and mobile devices. For example, we offer a mobile version of our service that is accessed bythe leading wireless devices. Additionally, our service is highly configurable in a short amount of time, enablingour customers to tailor its appearance, policy settings, language, workflow, reports, and other characteristicswithout the use of significant IT resources or consultants. Our services mainly focus on the following functionalareas within CRM:
• Sales force automation, which is marketed under our brand Salesforce CRM SFA, enablessalespeople to be more productive by automating manual and repetitive tasks and by providing themwith better, more organized data about current and prospective customers. Salesforce CRM SFA helpscompanies establish a system and process for recording, tracking, and sharing information about salesopportunities, sales leads, sales forecasts, the sales process, and closed business, as well as managingsales territories. Salesforce CRM SFA also helps sales organizations manage unstructured informationsuch as sales collateral, presentations, price lists, and video assets.
• Partner relationship management, which is marketed under our brand Salesforce CRM PartnerNetworks, provides channel managers with complete visibility into their company’s entire salespipeline for direct and indirect channels. The Salesforce CRM Partner Networks solution includes acustomizable partner portal that makes it easy for our customers’ partners to access leads, register fordeals, collaborate on deals, and locate all the information they need in order to be successful. TheSalesforce CRM Partner Networks offering also enables our customers to instantly share information,such as leads and opportunities, with other Salesforce customers, directly from within their ownSalesforce environments.
• Customer service and support automation, which is marketed under our brand Salesforce CRMCustomer Service & Support allows companies to maintain better relationships with their existingcustomers and more efficiently address a variety of service and support needs, such as advice aboutproducts and services, requests for repairs, complaints about faulty goods, and the need for additional
6

goods and services. Using Salesforce CRM Customer Service & Support, customers can leverage ourcomplete cloud-computing platform to deliver a comprehensive solution for their customer serviceinteractions across every service channel: call centers with phone, email and chat, web portals for self-service and customer collaboration, and within social networks for community interactions.
• Marketing automation, which is marketed under our brand Salesforce CRMMarketing, enablescompanies to attract new customers and manage marketing campaigns from initiation through thedevelopment of leads that are passed to the sales team. Marketers are able to determine theeffectiveness of each campaign by quantifying the revenue generated as a result of specific marketingactivities. The application includes integration with Google Adwords, which enables marketers tomeasure the return on their Google Adwords spend by providing full visibility into which clicked adsresult in actual closed business. Salesforce CRM Marketing also provides content managementfunctionality to manage marketing and brand collateral. The technology includes ratings, comments,filters, and tagging, which help marketers ensure the best and most up-to-date materials are consistentlybeing used throughout their companies.
As of January 31, 2009, we offer five principal editions of our service for a fee: Group Edition, ProfessionalEdition, Enterprise Edition, Unlimited Edition, and Partner Edition. We derived over 90 percent of our revenuesfrom subscriptions to, and support for, our service in fiscal 2009.
• Group Edition. Group Edition, which is limited to five subscribers, is targeted primarily at smallbusinesses and workgroups that seek a basic sales force automation solution without the sophisticatedfeatures required by larger companies. Users can use Group Edition to share important customer dataand manage their customer relations—from the start of the sales cycle to closing the deal to providingbasic customer service. Group Edition primarily offers access to accounts, contacts, opportunities, andreports. It does not include the more advanced customer service and support or marketing automationfeatures such as: campaigns, forecasts, solutions, online case capture, self-service portal, notes andattachments, Offline Edition, and mass email capabilities. Using the Force.com platform, customerscan further extend and customize Group Edition by adding additional custom tabs and/or a customapplication.
• Professional Edition. Professional Edition is targeted primarily at medium-sized and large businessesthat need a robust and complete CRM solution but do not need some of the more advancedadministrative features and integration capabilities. Professional Edition offers companies acomprehensive CRM suite that business users can use to manage every aspect of the customerlifecycle. In addition to everything available in Group Edition, it provides users more advanced CRMfunctionality such as: forecasts, lead management, contract management, solutions, and online casecapture. Professional Edition also comes with standard, easy-to-use customization, security andsharing, integration, and administration tools to facilitate any small to mid-sized deployment. Using theForce.com platform, Professional Edition customers have more flexibility than Group Editioncustomers to further extend and customize their service by adding more custom applications, customtabs, and/or custom objects.
• Enterprise Edition. Enterprise Edition is designed to meet the complex business needs of largeorganizations with many divisions or departments. In addition to all of the functionality available inProfessional Edition, Enterprise Edition offers customers:
• Advanced CRM functionality, such as territory management that uses a rule-based territoryassignment engine to categorize accounts and users into territories, products, and schedules thattrack revenue and quantity by opportunities
• Multi-divisional sharing and permissions such as profile-based departmental security and sharing
• Workflow and business process control such as workflow automation tasks
7

• Enterprise customization and integration tools that can support large-scale deployments, suchas APIs for back-office integration that enable companies to readily integrate Salesforce CRMwith ERP applications and other data sources. With Enterprise Edition, customers also havegreater flexibility and control to fully extend and customize our service by adding more customapplications, custom tabs, and/or custom objects.
• Unlimited Edition. Unlimited Edition is our most fully featured edition, with exclusive featuresavailable only in Unlimited Edition and bundled add-on features included at a significant cost savingover the total price of the individual features. In addition to all of the functionality available inEnterprise Edition, Unlimited Edition includes unlimited installations from the AppExchange,increased customization and extension possibilities that customers can implement on their own,including Force.com Sandbox, which is described below, Salesforce CRM Mobile, Premier Supportwith Administration, and additional storage.
• Partner relationship management, which is described above and marketed under our brand SalesforceCRM Partner Networks, provides channel managers with complete visibility into their company’sentire sales pipeline for direct and indirect channels.
Each of the editions described above entitles customers to our standard customer support services, withphone support available 12 hours a day, five days a week. For advanced customers with more complex businessneeds, we provide additional levels of fee-based customer support.
In addition to the five paying editions, we continue to innovate and develop additional products and servicesas optional add-on subscriptions to better meet different customers’ needs. Examples include:
• Offline Edition and Mobile Edition allow customers to view and modify their CRM data, such asaccounts, contacts, opportunities, tasks, and events, while disconnected from the Internet. OfflineEdition is included in all Enterprise and Unlimited Edition service subscriptions. Customers ofProfessional Edition can choose to subscribe to either or both as an add-on service.
• Salesforce CRM Content enables customers to manage unstructured data within an enterprise byutilizing Web 2.0 technologies such as tagging, subscriptions and recommendations. By enabling usersto manage their documents and unstructured data directly in the Salesforce CRM application,Salesforce CRM Content increases the utility of the service to our customers.
• Force.com Sandbox enables customers to test new customizations or features before deploying them.Customers can use Force.com Sandbox to install, modify, and test applications downloaded from theAppExchange or to create a development environment for building and testing integrations andinternally built applications. Additionally, customers may use Force.com Sandbox as an exact replicaof their production Salesforce CRM systems for employee-training purposes. Customers ofProfessional Edition and Enterprise Edition can choose to subscribe to Sandbox as an add-on service.
• Salesforce CRM Ideas provides a forum for customers to collect ideas from their customers or otherson any topic, including products or services. Interested parties can then review and vote on these ideas,and management can post responses to the ideas.
As part of our marketing programs, we also offer a single user Personal Edition service that includes acontact management database and several other features that are useful to individual sales representatives andothers who need a centralized way to organize contact data and access that data over the Internet. We also offer aDeveloper Edition to developers and others interested in building applications on our Force.com platform. BothPersonal Edition and Developer Edition are currently available at no charge.
8

Force.com Cloud Computing Platform
The Force.com cloud computing platform enhances the attractiveness of our service, particularly toenterprise customers. The Force.com platform provides a feature set and technology environment for buildingbusiness applications, including data models and objects to manage data, a workflow engine for managingcollaboration of data between users, a user interface model to handle forms and other interactions, and a Webservices API for programmatic access and integration. The Force.com platform provides the tools andinfrastructure required to:
• Deploy our application service for CRM
• Customize and integrate existing enterprise software applications
• Create and deploy new business applications that are pre-integrated with our service and leverage thesame user interface or customize the user interface specific to customer requirements
• Sample and deploy applications built by third parties from the AppExchange
The AppExchange
We offer the AppExchange, an online directory that provides customers a way to browse, test-drive, share,and install applications developed on our Force.com platform. Partners and developers can offer theirapplications on the AppExchange directory. This directory gives our users a way to find and install applicationsto expand their use of the Force.com platform to areas that are complementary to or extend beyond CRM.
When installing an enterprise cloud computing application built by a third-party partner or developer,customers authorize the third-party provider access to their data. Because they are built, managed andprovisioned by third parties, we do not warrant the functionality, security and integrity of the data transmission orprocessing.
Professional Services
We offer consulting and implementation services and training that complement our enterprise cloudcomputing CRM application service.
Consulting and Implementation Services
We offer consulting and implementation services to our customers to facilitate the adoption of our enterprisecloud computing CRM application and platform services. Consulting services consist of services such asbusiness process mapping, project management services and guidance on best practices in using our service.Implementation services include systems integration, technical architecture and development, configuration anddata conversion as well as developing and delivering customized education programs for our customers. Most ofour consulting and implementation engagements are billed on a time and materials basis. For many of our smalland medium-sized business customers, we also offer for a fixed price certain implementation services that takeup to a week to complete.
As the reach of our enterprise cloud computing application services grows, partners will likely play a moreintegral part in also providing these consulting and implementation services to our customers.
Training & Certification
We offer a number of traditional classroom and online educational classes that address topics such asimplementing, using, administering and developing on our service. We also offer classes for our partners whoimplement our service on behalf of our customers.
We bill the traditional classroom and some of the on-line educational classes on a per person, per classbasis. There is a selection of on-line educational classes available at no charge to customers who subscribe to our
9

service. In 2008 we also introduced a certification program to provide accredited certifications for SalesforceCRM administrators, Force.com developers and consultants.
In order to expand our reach to the growing customer base, we have also established the AuthorizedTraining Center program that allows authorized third party training partners to deliver training curriculum.Additionally, as the population of administrators, developers, consultants and partners grows, a training andexam program has been established for Salesforce certification in specific areas of expertise.
Technology, Development and Operations
Technology and Development
We do not provide software that must be written to different hardware, operating system and databaseplatforms, or that depends upon a customer’s unique systems environment. Rather, we have optimized ourservice to run on a specific database and operating system using the tools and platforms best suited to serve ourcustomers. Performance, functional depth and the usability of our service drive our technology decisions andproduct direction.
We built our service as a highly scalable, multi-tenant application written in Java and Oracle PL/SQL. Weuse commercially available hardware and a combination of proprietary and commercially available software,including database software from Oracle Corporation, to provide our service. The application server is custom-built and runs on a lightweight Java Servlet and Java Server Pages engine. We have custom-built core servicessuch as database connection pooling and user session management tuned to our specific architecture andenvironment, allowing us to continue to scale our service. We have combined a stateless environment, in which auser is not bound to a single server but can be routed in the most optimal way to any number of servers, with anadvanced data caching layer. Our customers can access the service through any Web browser without installingany software or downloading Java applets or Microsoft ActiveX or .NET controls.
Our service treats all customers as logically separate tenants in central applications and databases. As aresult, we are able to spread the cost of delivering our service across our user base. In addition, because we donot have to manage thousands of distinct applications with their own business logic and database schemas, webelieve that we can scale our business faster than traditional software vendors. Moreover, we can focus ourresources on building new functionality to deliver to our customer base as a whole rather than on maintaining aninfrastructure to support each of their distinct applications.
Our research and development efforts are focused on improving and enhancing the features, functionalityand security of our existing service offerings as well as developing new proprietary services such as Force.com.In addition, from time to time we supplement our internal research and development activities with outsidedevelopment resources and acquired technology. Because of our common, multi-tenant application architecture,we are able to provide all of our customers with a service based on a single version of our application. We areable to upgrade all of our customers at the same time with each release. As a result, we do not have to maintainmultiple versions of our application.
Operations
As of January 31, 2009, we serve our customers and users from a single, third-party Web hosting facilitylocated on the west coast of the United States, leased from Equinix, Inc., except for features added throughacquisition which are temporarily served through alternate facilities. The Equinix facility is built to the samecritical systems building codes as hospitals and other vital infrastructure. The facility is secured byaround-the-clock guards, biometric access screening and escort-controlled access, and is supported by on-sitebackup generators in the event of a power failure. As part of our current disaster recovery arrangements, all ofour customers’ data is currently replicated in near real-time in a separate back-up facility located on the east
10
coast of the United States. This strategy is designed to both protect our customers’ data and ensure servicecontinuity in the event of a major disaster. Even with the disaster recovery arrangements, our service could beinterrupted.
Our agreement with Equinix provides for Equinix to supply space in its secure facilities on the west and eastcoasts as well as power. Bandwidth to the Internet is provided by multiple independent companies. Wecontinuously monitor the performance of our service. The monitoring features we have built or licensed includecentralized performance consoles, automated load distribution tools and various self-diagnostic tools andprograms.
In addition we have a data center in San Francisco, which is primarily for internal information technology,development and quality assurance infrastructure.
We are opening a data center in Singapore in fiscal 2010.
Customers
As of January 31, 2009, our customer base had grown to approximately 55,400, from 41,000 in the prioryear.
Our revenues are divided among small businesses (companies with fewer than 200 employees), medium-size businesses (200 or more employees and up to $1 billion in annual revenues), and large businesses (over $1billion in annual revenues). The number of paying subscriptions at each of our customers ranges from one to tensof thousands.
None of our customers accounted for more than 5 percent of our revenues in fiscal 2009, 2008, or 2007.
Sales, Marketing and Customer Support
We organize our sales and marketing programs by geographic regions, including North America, Europe,Japan, and the Asia Pacific region other than Japan.
Direct Sales
We sell subscriptions to our service primarily through our direct sales force comprised of inside sales, whichconsists of personnel that sell to customers primarily by phone, and field sales personnel, that are primarily basedin a region. Supporting telesales representatives are primarily responsible for qualifying and generating leads.Our small business, general business and enterprise account executives and account managers focus their effortson small, medium-size and large enterprises, respectively. Sales representatives in our small business group sellto smaller companies, primarily over the phone.
Referral and Indirect Sales
We have a network of partners who refer customer prospects to us and assist us in selling to these prospects.The network includes consulting firms, other technology vendors, systems integrators and partners in marketswhere we do not have a large direct sales presence. In return, we typically pay these partners a fee based on thefirst-year subscription revenue generated by the customers they refer. We expense these fees at the time thecustomer signs the subscription service contract.
We also continue to develop distribution channels for our subscription service.
11

Marketing
Our marketing strategy is to continually elevate our brand and generate significant demand for ourofferings. We use a variety of marketing programs to target our prospective and current customers, partners, anddevelopers.
Our primary marketing activities include:
• press and industry analyst relations to garner third-party validation and generate positive coverage forour company and product strategy
• user conferences and launch events, as well as participation in trade shows and industry events, tocreate awareness and excitement
• search engine marketing and online and print advertising to drive traffic to our Web properties
• Web site development to engage and educate prospects and generate interest throughproduct information and demonstrations, free trials, case studies, white papers, and marketing collateral
• email, direct mail, and phone campaigns to capture leads that can be funneled into our salesorganization
• use of customer testimonials
• sales tools and field marketing events to enable our sales organization to more effectively convertpipeline into completed transactions
Customer Service and Support
We believe that superior customer support is critical to retaining and expanding our customer base. Ourcustomer support groups respond to general customer inquiries, such as technical questions or questions relatingto how to use our service, and are available to customers by telephone or email or over the Web.
We have a comprehensive technical support program to assist our customers in the use of our service and toidentify, analyze and solve problems or issues with our service. The support program includes email support, anonline repository of helpful information about our service, shared best practices for implementation and use, andtelephone support. In addition, we have supplemented our own staff with other technical support specialists whowork for us on a contract basis. Basic customer support during business hours is available at no charge tocustomers that purchase any of our paying editions. Premier customer support, which includes additional servicessuch as an assigned support representative or team of support representatives, is available for a separate fee, or isincluded as part of Unlimited Edition. Additional support services include administrator support which aidscustomers in application configuration and optimization.
International Sales
We generate over 25 percent of our total revenues from customers in Europe and Asia Pacific, includingJapan. We expect international markets to provide increased opportunities for our applications and services in thefuture. Our current international efforts are focused on strengthening our direct sales and marketing presenceoutside of North America, and generating more revenues from these regions.
Seasonality
Our fourth quarter has historically been our strongest quarter for new business. For a more detaileddiscussion, see the “Seasonal Nature of Deferred Revenue and Accounts Receivable” discussion inManagement’s Discussion and Analysis.
12
Competition
The market for enterprise CRM business applications and development platforms is highly competitive,rapidly evolving and fragmented, and subject to changing technology, shifting customer needs and frequentintroductions of new products and services. Many prospective customers have invested substantial personnel andfinancial resources to implement and integrate traditional enterprise software into their businesses, and thereforemay be reluctant or unwilling to migrate to an enterprise cloud computing application service. Additionally, thirdparty developers may be reluctant to build application services on our platform since they have investedsignificantly in other competing technology products.
We compete primarily with vendors of packaged CRM software, whose software is installed by thecustomer directly, and companies offering on-demand CRM applications. We also compete with internallydeveloped applications and face, or expect to face, competition from enterprise software vendors and onlineservice providers who may develop toolsets and products that allow customers to build new applications that runon the customers’ current infrastructure or as hosted services. Our current principal competitors include:
• enterprise software application vendors including Microsoft Corporation, Oracle Corporation, and SAPAG;
• packaged CRM software vendors, some of which offer hosted services, such as CDC SoftwareCorporation, a subsidiary of chinadotcom corporation, Consona Corporation (formerly Made2ManageSystems Inc.), Pivotal Corporation, which is owned by Sage Group plc, and SugarCRM;
• on-demand CRM application service providers such as Microsoft Corporation, NetSuite, Inc., OracleCorporation, RightNow Technologies, Inc. and SAP AG.;
• enterprise application service providers including IBM Corporation and Oracle Corporation;
• traditional platform development environment companies, including established vendors, such as IBMCorporation, Microsoft Corporation, and Oracle Corporation and an array of emerging vendors thathave gained traction with the press and analyst communities; and
• cloud computing development platform companies, including some with whom we are partners, otherssuch as Microsoft Corporation, which has initiated plans to enter this market, and a variety of smallerstart up companies that have invested in cloud computing technology.
We believe that as enterprise software application and platform vendors shift more of their focus to cloudcomputing, they will be a greater competitive threat.
We believe the principal competitive factors in our market include the following:
• speed and ease of implementation;
• product functionality;
• financial stability and viability of the vendor;
• product adoption;
• ease of use and rates of user adoption;
• low total cost of ownership and demonstrable cost-effective benefits for customers;
• performance, security, scalability, flexibility and reliability of the service;
• ease of integration with existing applications;
• quality of customer support;
• availability and quality of implementation, consulting and training services; and
• vendor reputation and brand awareness.
13

Many of our competitors and potential competitors have greater name recognition, longer operatinghistories, larger marketing budgets and significantly greater resources. They may be able to devote greaterresources to the development, promotion and sale of their products than we can to ours, which could allow themto respond more quickly than we can to new technologies and changes in customer needs. Additionally, ourcompetitors may offer or develop products or services that are superior to ours or that achieve greater marketacceptance.
Our professional services organization may compete with some systems integrators, including AccentureLtd., Deloitte Consulting and IBM Corporation; it may also compete with some ISV service providers that haveservice practices. We have close relationships with many of these consulting companies and frequently workcooperatively on projects with them.
Intellectual Property
We rely on a combination of trademark, copyright, trade secret and patent laws in the United States andother jurisdictions as well as confidentiality procedures and contractual provisions to protect our proprietarytechnology and our brand. We also enter into confidentiality and proprietary rights agreements with ouremployees, consultants and other third parties and control access to software, documentation and otherproprietary information.
As of January 31, 2009, we have four issued U.S. patents and 117 pending U.S. patent applications. Themajority of our patent applications concern database, application platform and application exchange infrastructures.
The following are some of our registered trademarks in the U.S. and elsewhere:
salesforcesalesforce.com“No Software” logoThe End of SoftwareSuccess. Not SoftwareSuccess. On Demand“Block S” logosforceAppExchange
Unregistered trademarks we use include:
CRMSuccessThe Business Web
We have received in the past, and may receive in the future, communications from third parties claiming thatwe have infringed on the intellectual property rights of others. The cost to defend or settle these claims can besignificant in any single quarter. Any intellectual property claims, regardless of merit, may also require us to seeklicenses to that technology. In addition, we license third-party technologies that are incorporated into some elementsof our services. Licenses from third-party technologies may not continue to be available to us at a reasonable cost oron reasonable commercial terms, or at all. Additionally, the steps we have taken to protect our intellectual propertyrights may not be adequate. Third parties may infringe or misappropriate our proprietary rights. Competitors mayalso independently develop technologies that are substantially equivalent or superior to the technologies we employin our services. If we fail to protect our proprietary rights adequately, our competitors could offer similar services,potentially significantly harming our competitive position and decreasing our revenues.
14

Employees
As of January 31, 2009, we had 3,566 employees.
We believe our future success and growth will depend on our ability to attract, motivate and retain qualifiedemployees in all areas of our business. None of our employees is represented by a labor union. We consider ourrelationship with our employees to be good. However, we face competition for qualified employees, and weexpect to face continuing challenges in recruiting and retention.
Available Information
You can obtain copies of our Form 10-K, Quarterly Reports on Form 10-Q, Current Reports on Form 8-K,and other filings with the SEC, and all amendments to these filings, free of charge from our Web site athttp://www.salesforce.com/company/investor/sec-filings/ as soon as reasonably practicable following our filing ofany of these reports with the SEC. You can also obtain copies free of charge by contacting our Investor Relationsdepartment at our office address listed above.
ITEM 1A. RISK FACTORS
The risks and uncertainties described below are not the only ones facing us. Other events that we do notcurrently anticipate or that we currently deem immaterial also may affect our results of operations and financialcondition.
Risks Related to Our Business and Industry
Defects or disruptions in our service could diminish demand for our service and subject us to substantialliability.
Because our service is complex and we have incorporated a variety of new computer hardware and software,both developed in-house and acquired from third party vendors, our service may have errors or defects that usersidentify after they begin using it that could result in unanticipated downtime for our subscribers and harm ourreputation and our business. Internet-based services frequently contain undetected errors when first introduced orwhen new versions or enhancements are released. We have from time to time found defects in our service andnew errors in our existing service may be detected in the future. In addition, our customers may use our service inunanticipated ways that may cause a disruption in service for other customers attempting to access their data.Since our customers use our service for important aspects of their business, any errors, defects, disruptions inservice or other performance problems with our service could hurt our reputation and may damage ourcustomers’ businesses. If that occurs, customers could elect not to renew, or delay or withhold payment to us, wecould lose future sales or customers may make warranty claims against us, which could result in an increase inour provision for doubtful accounts, an increase in collection cycles for accounts receivable or the expense andrisk of litigation.
Interruptions or delays in service from our third-party data center hosting facilities could impair thedelivery of our service and harm our business.
We currently serve our customers from a third-party data center hosting facility located on the west coast ofthe United States and we plan to begin to serve some customers from a third-party data center hosting facilitylocated on the east coast of the United States. Additionally, we plan to begin serving customers from a new datacenter hosting facility we will be opening in Singapore in fiscal 2010. Any damage to, or failure of, our systemsgenerally could result in interruptions in our service. As we continue to add capacity in our existing and futuredata centers, we may move or transfer data. Despite precautions taken during this process, any unsuccessful datatransfers may impair the delivery of our service. Further, any damage to, or failure of, our systems generallycould result in interruptions in our service. Interruptions in our service may reduce our revenue, cause us to issue
15
credits or pay penalties, cause customers to terminate their subscriptions and adversely affect our renewal ratesand our ability to attract new customers. Our business will also be harmed if our customers and potentialcustomers believe our service is unreliable.
As part of our current disaster recovery arrangements, our production environment and all of our customers’data is currently replicated in near real-time in a separate standby facility located on the east coast. Featuresadded through acquisition are temporarily served through alternate facilities. We do not control the operation ofany of these facilities, and they are vulnerable to damage or interruption from earthquakes, floods, fires, powerloss, telecommunications failures and similar events. They may also be subject to break-ins, sabotage, intentionalacts of vandalism and similar misconduct. Despite precautions taken at these facilities, the occurrence of anatural disaster or an act of terrorism, a decision to close the facilities without adequate notice or otherunanticipated problems at these facilities could result in lengthy interruptions in our service. Even with thedisaster recovery arrangements, our service could be interrupted.
If our security measures are breached and unauthorized access is obtained to a customer’s data or ourdata, our service may be perceived as not being secure, customers may curtail or stop using our service and wemay incur significant legal and financial exposure and liabilities.
Our service involves the storage and transmission of customers’ proprietary information, and securitybreaches could expose us to a risk of loss of this information, litigation and possible liability. If our securitymeasures are breached as a result of third-party action, employee error, malfeasance or otherwise, during transferof data to additional data centers or at any time, and, as a result, someone obtains unauthorized access to our dataor our customers’ data, our reputation could be damaged, our business may suffer and we could incur significantliability. Additionally, third parties may attempt to fraudulently induce employees or customers into disclosingsensitive information such as user names, passwords or other information in order to gain access to our data orour customers’ data, which could result in significant legal and financial exposure and a loss of confidence in thesecurity of our service that would harm our future business prospects. Because the techniques used to obtainunauthorized access, or to sabotage systems, change frequently and generally are not recognized until launchedagainst a target, we may be unable to anticipate these techniques or to implement adequate preventativemeasures. If an actual or perceived breach of our security occurs, the market perception of the effectiveness ofour security measures could be harmed and we could lose sales and customers. In addition, our customers mayauthorize third party technology providers, whose applications are available through our AppExchange directory,to access their customer data. Because we do not control the transmissions between our customers and third-partyAppExchange technology providers, or the processing of such data by third-party AppExchange technologyproviders, we cannot ensure the complete integrity or security of such transmissions or processing.
Weakening global economic conditions may adversely affect our industry, business and results ofoperations.
Our overall performance depends in part on worldwide economic conditions. The United States and otherkey international economies are currently undergoing a period of severe recession, characterized by fallingdemand for a variety of goods and services, restricted credit, going concern threats to financial institutions andmajor multi-national companies, poor liquidity, declining asset values, reduced corporate profitability, extremevolatility in credit, equity and foreign exchange markets and increased bankruptcies. These conditions couldadversely affect our customers’ ability or willingness to purchase our enterprise cloud computing applicationservice, delay prospective customers’ purchasing decisions, reduce the value or duration of their subscriptioncontracts, or affect renewal rates, all of which could adversely affect our operating results. Companies that havecompeting products may reduce prices for competing products or services which could also reduce our averageselling prices and harm our operating results.
16

Because we recognize revenue from subscriptions for our service over the term of the subscription,downturns or upturns in sales may not be immediately reflected in our operating results.
We generally recognize revenue from customers ratably over the terms of their subscription agreements,which are typically 12 to 24 months, although terms can range from one to 60 months. As a result, most of therevenue we report in each quarter is derived from the recognition of deferred revenue relating to subscriptionagreements entered into during previous quarters. Consequently, a decline in new or renewed subscriptions inany one quarter will not necessarily be fully reflected in the deferred revenue balance on our consolidatedbalance sheet and the revenue in that quarter but will negatively affect our revenue in future quarters. In addition,we may be unable to adjust our cost structure to reflect the changes in revenues. Accordingly, the effect ofsignificant downturns in sales and market acceptance of our service, and potential changes in our rate of renewalsmay not be fully reflected in our results of operations until future periods. Our subscription model also makes itdifficult for us to rapidly increase our revenue through additional sales in any period, as revenue from newcustomers must be recognized over the applicable subscription term.
If we experience significant fluctuations in our rate of anticipated growth and fail to balance ourexpenses with our revenue forecasts, our results could be harmed and our stock price may decline withoutadvance notice.
Due to our evolving business model, the unpredictability of new markets that we enter and deterioratinggeneral economic and financial market conditions, we may not be able to accurately forecast our rate of growth.We plan our expense levels and investment on estimates of future revenue and future anticipated rate of growth.We may not be able to adjust our spending quickly enough if the rate of new or renewed subscriptions falls shortof our expectations.
As a result, we expect that our revenues, operating results and cash flows may fluctuate significantly on aquarterly basis. Our recent revenue growth rates may not be sustainable and may decline in the future. Webelieve that period-to-period comparisons of our revenues, operating results and cash flows may not bemeaningful and should not be relied upon as an indication of future performance.
We cannot accurately predict customer subscription renewal rates and the impact these renewal rates willhave on our future revenue or operating results.
Our customers have no obligation to renew their subscriptions for our service after the expiration of theirinitial subscription period, which is typically 12 to 24 months, and in fact, some customers have elected not torenew. In addition, our customers may renew for fewer subscriptions or renew for shorter contract lengths. Wecannot accurately predict customer renewal rates, particularly for our enterprise customers who purchase a largenumber of subscriptions under multi-year contracts. Our customers’ renewal rates may decline or fluctuate as aresult of a number of factors, including their dissatisfaction with our service, their ability to continue theiroperations and spending levels and deteriorating general economic and financial market conditions. If ourcustomers do not renew their subscriptions for our service or reduce the number of paying subscriptions at thetime of renewal, our revenue will decline and our business will suffer.
Our future success also depends in part on our ability to sell additional features and services, moresubscriptions or enhanced editions of our service to our current customers. This may require increasinglysophisticated and costly sales efforts that are targeted at senior management. If these efforts are not successful,our business may suffer.
Our quarterly results can fluctuate and if we fail to meet the expectations of analysts or investors, ourstock price and the value of your investment could decline substantially.
Our quarterly operating results are likely to fluctuate, and if we fail to meet or exceed the expectations ofsecurities analysts or investors, the trading price of our common stock could decline. Moreover, our stock price
17

may be based on expectations of our future performance that may be unrealistic or that may not be met. Some ofthe important factors that could cause our revenues, operating results and cash flows to fluctuate from quarter toquarter include:
• our ability to retain and increase sales to existing customers, attract new customers and satisfy ourcustomers’ requirements;
• the renewal rates for our service;
• the amount and timing of operating costs and capital expenditures related to the operations andexpansion of our business;
• changes in our pricing policies whether initiated by us or as a result of intense competition;
• the cost, timing and management effort for the introduction of new features to our service;
• the rate of expansion and productivity of our sales force;
• the length of the sales cycle for our service;
• new product and service introductions by our competitors;
• our success in selling our service to large enterprises;
• variations in the revenue mix of editions of our service;
• technical difficulties or interruptions in our service;
• expenses related to increasing our data center capacity and expanding our data centers domestically andinternationally;
• changes in foreign currency exchange rates (as an example, recently the value of the Euro and BritishPound have decreased against the U.S. dollar by approximately 13 percent and 28 percent, respectivelyfrom a year ago, and as such, our revenue results outside the Americas in fiscal 2009 have beennegatively impacted);
• changes in interest rates, which would impact our return on our investments in cash and marketablesecurities (as an example, the yield on the 2 year U.S. treasury bill has declined approximately 120basis points from a year ago to 1.005 percent);
• conditions, particularly sudden changes, in the financial markets have and may continue to impact thevalue of and access to our investment portfolio;
• changes in the effective tax rates;
• general economic conditions could adversely affect either our customers’ ability or willingness topurchase our application service or delay the customers’ purchasing decision or affect renewal rates, allof which could adversely affect our operating results;
• the seasonal nature of our invoicing, timing of additional investments in our enterprise cloudcomputing application service and in our consulting service;
• regulatory compliance costs;
• the timing of customer payments and payment defaults by customers;
• costs associated with acquisitions of companies and technologies, such as our August 2008 acquisitionof InStranet, Inc.;
• extraordinary expenses such as litigation or other dispute-related settlement payments;
• the impact of new accounting pronouncements; and
• the timing of stock awards to employees and the related adverse financial statement impact of having toexpense those stock awards ratably over their 4 year vesting schedules.
18

Many of these factors are not within our control, and the occurrence of one or more of them might cause ouroperating results to vary widely. As such, we believe that quarter-to-quarter comparisons of our revenues, operatingresults and cash flows may not be meaningful and should not be relied upon as an indication of future performance.
We rely on third-party computer hardware and software that may be difficult to replace or which couldcause errors or failures of our service.
We rely on computer hardware purchased or leased and software licensed from third parties in order to offerour service, including database software from Oracle Corporation. This hardware and software may not continueto be available at reasonable prices or on commercially reasonable terms, or at all. Any loss of the right to useany of this hardware or software could significantly increase our expenses and otherwise result in delays in theprovisioning of our service until equivalent technology is either developed by us, or, if available, is identified,obtained and integrated, which could harm our business. Any errors or defects in third-party hardware orsoftware could result in errors or a failure of our service which could harm our business.
Efforts we are making to expand our service beyond the CRM market may not succeed and may reduceour revenue growth rate and cause us to incur additional liabilities.
In fiscal 2006 we introduced the AppExchange directory, an on-line marketplace for enterprise cloudcomputing applications that run on our Force.com cloud computing platform. The market for third-partyon-demand applications and our platform is new and unproven, and it is uncertain whether the initiative will everresult in significant revenue for us. Among other things, the success of the AppExchange will depend to asubstantial extent on the willingness of third-party technology providers to write enterprise cloud computingapplications that run on our platform and the willingness of enterprises, large and small, to purchase and deploythese applications. If third-party technology providers or enterprises do not perceive the benefits of our on-lineapplication marketplace, then the market for this initiative may not develop at all, or it may develop more slowlythan we expect, either of which would affect our ability to grow our revenue. Given this new and unprovenmarket, we have limited insight into trends that may develop and affect this initiative. In addition, our customersmay not authorize such third-party technology providers to access their customer data. If our customers doauthorize such access, we do not warrant the functionality, security and integrity of the data transmission orprocessing. Further, despite contract provisions designed to protect us, customers may look to us to support andwarrant the third-party applications, which may expose us to potential claims, liabilities and obligations forapplications we did not develop or sell. Moreover, the AppExchange directory, and other efforts to expand ourservice beyond the CRM market, may divert management resources from existing operations and require us tocommit significant financial resources to an unproven business, which may harm our business.
The market for our technology delivery model and enterprise cloud computing application services isimmature and volatile, and if it develops more slowly than we expect, our business could be harmed.
The market for enterprise cloud computing application services is not as mature as the market for packagedenterprise software, and it is uncertain whether these services will achieve and sustain high levels of demand andmarket acceptance. Our success will depend to a substantial extent on the willingness of enterprises, large andsmall, to increase their use of enterprise cloud computing application services in general, and for CRM inparticular. Many enterprises have invested substantial personnel and financial resources to integrate traditionalenterprise software into their businesses, and therefore may be reluctant or unwilling to migrate to an enterprisecloud computing application service. Furthermore, some enterprises may be reluctant or unwilling to useenterprise cloud computing application services because they have concerns regarding the risks associated withsecurity capabilities, among other things, of the technology delivery model associated with these services. Ifenterprises do not perceive the benefits of enterprise cloud computing application services, then the market forthese services may not develop at all, or it may develop more slowly than we expect, either of which wouldsignificantly adversely affect our operating results. In addition, we may make errors in predicting and reacting torelevant business trends, which could harm our business. Our success also depends on the willingness of third-
19

party developers to build applications that are complementary to our service. Without the development of theseapplications, both current and potential customers may not find our service sufficiently attractive.
The market in which we participate is intensely competitive, and if we do not compete effectively, ouroperating results could be harmed.
The market for CRM, enterprise business applications, and development platforms is highly competitive,rapidly evolving and fragmented, and subject to changing technology, shifting customer needs and frequentintroductions of new products and services. Many prospective customers have invested substantial personnel andfinancial resources to implement and integrate traditional enterprise software into their businesses, and thereforemay be reluctant or unwilling to migrate to an enterprise cloud computing application service. Additionally, thirdparty developers may be reluctant to build application services on our platform since they have investedsignificantly in other competing technology products.
We compete primarily with vendors of packaged CRM software, whose software is installed by thecustomer directly, and companies offering on-demand CRM applications. We also compete with internallydeveloped applications and face, or expect to face, competition from enterprise software vendors and onlineservice providers who may develop toolsets and products that allow customers to build new applications that runon the customers’ current infrastructure or as hosted services. Our current principal competitors include:
• enterprise software application vendors including Microsoft Corporation, Oracle Corporation, and SAPAG;
• packaged CRM software vendors, some of which offer hosted services, such as CDC SoftwareCorporation, a subsidiary of chinadotcom corporation, Consona Corporation (formerly Made2ManageSystems Inc.), Pivotal Corporation, which is owned by Sage Group plc, and SugarCRM;
• on-demand CRM application service providers such as Microsoft Corporation, NetSuite, Inc., OracleCorporation, RightNow Technologies, Inc., and SAP AG;
• enterprise application service providers including IBM Corporation and Oracle Corporation;
• traditional platform and development environment companies, including established vendors, such asIBM Corporation, Microsoft Corporation, and Oracle Corporation; and an array of emerging vendorsthat have gained traction with the press and analyst communities; and
• cloud computing development platform companies, including some with whom we are partners, otherssuch as Microsoft Corporation, which has initiated plans to enter this market, and a variety of smallerstart up companies that have invested in cloud computing technology.
In addition, we face competition from businesses that develop their own CRM applications internally, aswell as from enterprise software vendors and online service providers who may develop and/or bundle CRMproducts with their products in the future. For small business customers, we also face competition fromcompanies whose offering is based on Microsoft Outlook and Excel for limited contact managementfunctionality. We also face competition from some of our larger and more established competitors whohistorically have been packaged CRM software vendors, but who also have directly competitive on-demandCRM application services offerings.
Our professional services organization may compete with some systems integrators, including AccentureLtd., Deloitte Consulting and IBM Corporation; it may also compete with some ISV service providers that haveservice practices. We have close relationships with many of these consulting companies and frequently workcooperatively on projects with them.
Many of our competitors and potential competitors enjoy substantial competitive advantages, such as greatername recognition, longer operating histories and larger marketing budgets, as well as substantially greater
20

financial, technical and other resources. In addition, many of our competitors have established marketingrelationships and access to larger customer bases, and have major distribution agreements with consultants,system integrators and resellers.
As a result, our competitors may be able to respond more quickly and effectively than we can to new orchanging opportunities, technologies, standards or customer requirements. Furthermore, because of theseadvantages, even if our service is more effective than the products that our competitors offer, potential customersmight accept competitive products and services in lieu of purchasing our service. For all of these reasons, wemay not be able to compete successfully against our current and future competitors.
If our enterprise cloud computing application service is not widely accepted in markets where we havefew customers, our future growth will be limited.
We derive substantially all of our revenue from subscriptions to our enterprise cloud computing applicationservice, and we expect this will continue for the foreseeable future. As a result, widespread acceptance of ourservice by companies located outside the United States or in industries where we currently have few customers iscritical to our future growth. Factors that may affect market acceptance of our service include:
• reluctance by enterprises to migrate to an enterprise cloud computing application service;
• a limited number of service offerings and risks associated with developing new service offerings;
• the price and performance of our service;
• the level of customization we can offer;
• the location of our data centers;
• the availability, performance and price of competing products and services;
• reluctance by enterprises to trust third parties to store and manage their internal data; and
• adverse publicity about us, our service or the viability, reliability or security of enterprise cloudcomputing application services generally from third party reviews, industry analyst reports and ourcompetitors.
Many of these factors are beyond our control. The inability of our enterprise cloud computing applicationservice to achieve widespread market acceptance as described above would harm our business.
Our past and anticipated future growth could strain our personnel resources and infrastructure, and ifwe are unable to implement appropriate controls and procedures to manage our growth, we may not be able tosuccessfully implement our business plan.
We have experienced and may continue to experience a period of increasing headcount and growth in ouroperations to support a growing customer base, which has placed, and will continue to place, to the extent that weare able to sustain such growth, a significant strain on our management, administrative, operational and financialinfrastructure. We anticipate that additional investments in our infrastructure will be required to address increasesin our customer base, further development of our service, as well as our expansion into new geographic areas.
Our success will depend in part upon the ability of our senior management to manage this growtheffectively. To do so, we must continue to hire, train and manage new employees as needed. If our new hiresperform poorly, or if we are unsuccessful in hiring, training, managing and integrating these new employees, or ifwe are not successful in retaining our existing employees, our business may be harmed. To manage the expecteddomestic and international growth of our operations and personnel, we will need to continue to improve ouroperational, financial and management controls and our reporting systems and procedures. The additional
21

headcount and capital investments we are making will increase our cost base, which will make it more difficultfor us to offset any future revenue shortfalls by reducing expenses in the short term. If we fail to successfullymanage our growth, we will be unable to execute our business plan.
As more of our sales efforts are targeted at larger enterprise customers, our sales cycle may become moretime-consuming and expensive, we may encounter pricing pressure and implementation challenges, and wemay have to delay revenue recognition for some complex transactions, all of which could harm our businessand operating results.
As we target more of our sales efforts at larger enterprise customers, we will face greater costs, longer salescycles and less predictability in completing some of our sales. In this market segment, the customer’s decision touse our service may be an enterprise-wide decision and, if so, these types of sales would require us to providegreater levels of education regarding the use and benefits of our service, as well as education regarding privacyand data protection laws and regulations to prospective customers with international operations. In addition,larger customers may demand more customization, integration services and features. As a result of these factors,these sales opportunities may require us to devote greater sales support and professional services resources toindividual customers, driving up costs and time required to complete sales and diverting sales and professionalservices resources to a smaller number of larger transactions, while potentially requiring us to delay revenuerecognition on some of these transactions until the technical or implementation requirements have been met.
Periodic restructurings of our sales organization can be disruptive and may negatively impact ourrevenues.
We periodically restructure or make other adjustments to our sales organization in response to marketopportunities, competitive threats, management changes, product introductions or enhancements, salesperformance, increases in sales headcount, cost levels, and other internal and external considerations. In the past,these restructurings sometimes resulted in a temporary lack of focus and reduced productivity; these effects couldrecur in connection with any future sales restructurings we might undertake and our rate of revenue growth couldbe negatively affected.
If we are not able to develop enhancements and new features to our existing service or acceptable newservices that keep pace with technological developments, our business will be harmed.
If we are unable to develop enhancements to and new features for our existing service or acceptable newservices that keep pace with rapid technological developments, our business will be harmed. The success ofenhancements, new features and services depends on several factors, including the timely completion,introduction and market acceptance of the feature or edition. Failure in this regard may significantly impair ourrevenue growth. In addition, because our service is designed to operate on a variety of network hardware andsoftware platforms using a standard browser, we will need to continuously modify and enhance our service tokeep pace with changes in Internet-related hardware, software, communication, browser and databasetechnologies. We may not be successful in either developing these modifications and enhancements or in timelybringing them to market. Furthermore, uncertainties about the timing and nature of new network platforms ortechnologies, or modifications to existing platforms or technologies, could increase our research anddevelopment expenses. Any failure of our service to operate effectively with future network platforms andtechnologies could reduce the demand for our service, result in customer dissatisfaction and harm our business.
Any failure to protect our intellectual property rights could impair our ability to protect our proprietarytechnology and our brand.
If we fail to protect our intellectual property rights adequately, our competitors might gain access to ourtechnology, and our business might be harmed. In addition, defending our intellectual property rights might entailsignificant expense. Any of our trademarks or other intellectual property rights may be challenged by others or
22

invalidated through administrative process or litigation. While we have a few U.S. patents and many other U.S.patent applications pending, we may be unable to obtain patent protection for the technology covered in our patentapplications. In addition, our existing patents and any patents issued in the future may not provide us withcompetitive advantages, or may be successfully challenged by third parties. Furthermore, legal standards relating tothe validity, enforceability and scope of protection of intellectual property rights are uncertain. Effective patent,trademark, copyright and trade secret protection may not be available to us in every country in which our service isavailable. The laws of some foreign countries may not be as protective of intellectual property rights as those in theU.S., and mechanisms for enforcement of intellectual property rights may be inadequate. Accordingly, despite ourefforts, we may be unable to prevent third parties from infringing upon or misappropriating our intellectualproperty.
We might be required to spend significant resources to monitor and protect our intellectual property rights.We may initiate claims or litigation against third parties for infringement of our proprietary rights or to establishthe validity of our proprietary rights. Any litigation, whether or not it is resolved in our favor, could result insignificant expense to us and divert the efforts of our technical and management personnel.
We have been and may in the future be sued by third parties for alleged infringement of their proprietaryrights.
The software and Internet industries are characterized by the existence of a large number of patents,trademarks and copyrights and by frequent litigation based on allegations of infringement or other violations ofintellectual property rights. We have received in the past, and may receive in the future, communications fromthird parties claiming that we have infringed on the intellectual property rights of others. In addition, we havebeen, and may in the future be, sued by third parties for alleged infringement of their proprietary rights. Ourtechnologies may not be able to withstand any third-party claims or rights against their use. Any intellectualproperty claims, with or without merit, could be time-consuming and expensive to resolve, could divertmanagement attention from executing our business plan and could require us to pay monetary damages or enterinto royalty or licensing agreements. In addition, many of our subscription agreements require us to indemnifyour customers for third-party intellectual property infringement claims, which would increase the cost to us of anadverse ruling on such a claim. An adverse determination could also prevent us from offering our service toothers.
If we fail to develop our brands cost-effectively, our business may suffer.
We believe that developing and maintaining awareness of the salesforce.com brand and our other brands ina cost-effective manner is critical to achieving widespread acceptance of our existing and future services and isan important element in attracting new customers. Furthermore, we believe that the importance of brandrecognition will increase as competition in our market develops. Successful promotion of our brands will dependlargely on the effectiveness of our marketing efforts and on our ability to provide reliable secure and usefulservices at competitive prices. In the past, our efforts to build our brands have involved significant expense.Brand promotion activities may not yield increased revenue, and even if they do, any increased revenue may notoffset the expenses we incurred in building our brands. If we fail to successfully promote and maintain ourbrands, or incur substantial expenses in an unsuccessful attempt to promote and maintain our brands, we may failto attract enough new customers or retain our existing customers to the extent necessary to realize a sufficientreturn on our brand-building efforts, and our business could suffer.
Failure to adequately expand our direct sales force and develop and expand our indirect sales channelwill impede our growth.
We continue to be substantially dependent on our direct sales force to obtain new customers, particularlylarge enterprise customers, and to manage our customer base. We believe that there is significant competition fordirect sales personnel with the advanced sales skills and technical knowledge we need. Our ability to achieve
23

significant growth in revenue in the future will depend, in large part, on our success in recruiting, training andretaining sufficient numbers of direct sales personnel. New hires require significant training and may, in somecases, take more than a year before they achieve full productivity. Our recent hires and planned hires may notbecome as productive as we would like, and we may be unable to hire sufficient numbers of qualified individualsin the future in the markets where we do business. If we are unable to hire and develop sufficient numbers ofproductive direct sales personnel, sales of our service will suffer and our growth will be impeded. In addition, weplan to develop and expand our indirect sales channel by engaging third-party resellers. Because of our enterprisecloud computing service model, the structuring of such relationships is complex and requires the investment ofsignificant business, financial and other resources. If we are unable to structure successful third-party channelrelationships that enable us to enter markets we otherwise would have greater difficulty entering, our growth willbe inhibited.
Our business could be adversely affected if our customers are not satisfied with implementation andcustomization services provided by us or our partners.
Our business depends on our ability to satisfy our customers, both with respect to our CRM service andplatform and the professional services that customize our CRM service and platform to meet our customers’business needs. Professional services may be performed by our own staff, or by a third party or a combination ofthe two. Our strategy is to work with third parties to increase the breadth of capability and depth of capacity fordelivery of these services to our customers. If a customer is not satisfied with the quality of work performed byus or a third party or with the type of services or solutions delivered, then we could incur additional costs toaddress the situation, the profitability of that work might be impaired, and the customer’s dissatisfaction with ourservices could damage our ability to obtain additional work from that customer. In addition, negative publicityrelated to our customer relationships, regardless of its accuracy, may further damage our business by affectingour ability to compete for new business with current and prospective customers.
Sales to customers outside the United States expose us to risks inherent in international sales.
Because we sell our service throughout the world, we are subject to risks and challenges that we wouldotherwise not face if we conducted our business only in the United States. For example, sales in Europe and AsiaPacific together represent over 25 percent of our total revenues, and we intend to continue to expand ourinternational sales efforts. The risks and challenges associated with sales to customers outside the United Statesinclude:
• localization of our service, including translation into foreign languages and associated expenses;
• laws and business practices favoring local competitors;
• compliance with multiple, conflicting and changing governmental laws and regulations, includingemployment, tax, privacy and data protection laws and regulations;
• regional data privacy laws that apply to the transmission of our customers’ data across internationalborders;
• foreign currency fluctuations;
• different pricing environments;
• difficulties in staffing and managing foreign operations;
• different or lesser protection of our intellectual property;
• longer accounts receivable payment cycles and other collection difficulties;
• regional economic conditions, including the affect of general economic and financial market conditionsin the markets in which we operate outside the United States; and
• regional political conditions.
24

Any of these factors could negatively impact our business and results of operations.
Additionally, some of our international subscription fees are currently paid in local currency. As a result,fluctuations in the value of the U.S. dollar and foreign currencies may make our service more expensive forinternational customers, which could harm our business.
Evolving regulation of the Internet may affect us adversely.
As Internet commerce continues to evolve, increasing regulation by federal, state or foreign agenciesbecomes more likely. For example, we believe increased regulation is likely in the area of data privacy, and lawsand regulations applying to the solicitation, collection, processing or use of personal or consumer informationcould affect our customers’ ability to use and share data, potentially reducing demand for CRM solutions andrestricting our ability to store, process and share data with our customers. In addition, taxation of servicesprovided over the Internet or other charges imposed by government agencies or by private organizations foraccessing the Internet may also be imposed. Any regulation imposing greater fees for Internet use or restrictinginformation exchange over the Internet could result in a decline in the use of the Internet and the viability ofInternet-based services, which could harm our business.
Privacy concerns and laws or other domestic or foreign regulations may reduce the effectiveness of oursolution and adversely affect our business.
Our customers can use our service to store contact and other personal or identifying information regardingtheir customers and contacts. Federal, state and foreign government bodies and agencies, however, have adoptedor are considering adopting laws and regulations regarding the collection, use and disclosure of personalinformation obtained from consumers and individuals. The costs of compliance with, and other burdens imposedby, such laws and regulations that are applicable to the businesses of our customers may limit the use andadoption of our service and reduce overall demand for it. Furthermore, privacy concerns may cause ourcustomers’ customers to resist providing the personal data necessary to allow our customers to use our serviceeffectively. Even the perception of privacy concerns, whether or not valid, may inhibit market adoption of ourservice in certain industries.
For example, in the United States regulations such as the Gramm-Leach-Bliley Act, which protects andrestricts the use of consumer credit and financial information, and the Health Insurance Portability andAccountability Act of 1996, which regulates the use and disclosure of personal health information, imposesignificant requirements and obligations on businesses that may affect the use and adoption of our service.
The European Union has also adopted a data privacy directive that requires member states to imposerestrictions on the collection and use of personal data that, in some respects, are far more stringent, and imposemore significant burdens on subject businesses, than current privacy standards in the United States. All of thesedomestic and international legislative and regulatory initiatives may adversely affect our customers’ ability tocollect and/or use demographic and personal information from their customers, which could reduce demand forour service. Many if not most other jurisdictions, including Asia countries, have similar stringent privacy lawsand regulations.
In addition to government activity, privacy advocacy groups and the technology and other industries areconsidering various new, additional or different self-regulatory standards that may place additional burdens onus. If the gathering of personal information were to be curtailed in this manner, CRM solutions would be lesseffective, which may reduce demand for our service and harm our business.
25

We are dependent on our management team and development and operations personnel, and the loss ofone or more key employees or groups could harm our business and prevent us from implementing ourbusiness plan in a timely manner.
Our success depends substantially upon the continued services of our executive officers and other keymembers of management, particularly our Chief Executive Officer. From time to time, there may be changes inour executive management team resulting from the hiring or departure of executives. Such changes in ourexecutive management team may be disruptive to our business.
We are also substantially dependent on the continued service of our existing development and operationspersonnel because of the complexity of our service and technologies.
We do not have employment agreements with any of our executive officers, key management, developmentor operations personnel and, therefore, they could terminate their employment with us at any time. We do notmaintain key person life insurance policies on any of our employees. The loss of one or more of our keyemployees or groups could seriously harm our business.
Because competition for our target employees is intense, we may not be able to attract and retain thehighly skilled employees we need to support our planned growth.
To continue to execute on our business plan, we must attract and retain highly qualified personnel.Competition for these personnel is intense, especially for engineers with high levels of experience in designingand developing software and Internet-related services and senior sales executives. We may not be successful inattracting and retaining qualified personnel. We have from time to time in the past experienced, and we expect tocontinue to experience in the future, difficulty in hiring and retaining highly skilled employees with appropriatequalifications. Many of the companies with which we compete for experienced personnel have greater resourcesthan we have. In addition, job candidates and existing employees often consider the value of the stock awardsthey are to receive in connection with their employment. Volatility in the price of our stock and the cost toexpense stock options may discourage us from granting the size or type of stock awards that job candidatesrequire to join or stay with our company. If we fail to attract new personnel or fail to retain and motivate ourcurrent personnel, our business and future growth prospects could be severely harmed.
As we acquire companies or technologies in the future, they could prove difficult to integrate, disrupt ourbusiness, dilute stockholder value and adversely affect our operating results and the value of our commonstock.
As part of our business strategy, we may acquire, enter into joint ventures with or make investments incomplementary companies, services and technologies in the future. In August 2008, we acquired InStranet, Inc.Acquisitions and investments involve numerous risks, including:
• the potential failure to achieve the expected benefits of the combination or acquisition;
• difficulties in and the cost of integrating operations, technologies, services and personnel;
• diversion of financial and managerial resources from existing operations;
• risk of entering new markets in which we have little or no experience;
• potential write-offs of acquired assets or investments;
• potential loss of key employees;
• inability to generate sufficient revenue to offset acquisition or investment costs;
• the inability to maintain relationships with customers and partners of the acquired business;
• the difficulty of incorporating acquired technology and rights into our products and services and ofmaintaining quality standards consistent with our brand;
26

• potential unknown liabilities associated with the acquired businesses;
• unanticipated expenses related to acquired technology and its integration into existing technology;
• negative impact to our results of operations because of the depreciation and amortization of amountsrelated to acquired intangible assets, fixed assets and deferred compensation, and the loss of acquireddeferred revenue;
• delays in customer purchases due to uncertainty;
• the need to implement controls, procedures and policies appropriate for a public company at companiesthat prior to the acquisition lacked such controls, procedures and policies; and
• challenges caused by distance, language and cultural differences.
In addition, if we finance acquisitions by issuing convertible debt or equity securities, our existingstockholders may be diluted which could affect the market price of our stock. Further, if we fail to properlyevaluate and execute acquisitions or investments, our business and prospects may be seriously harmed and thevalue of our common stock may decline.
Our business is subject to changing regulations regarding corporate governance and public disclosurethat have increased both our costs and the risk of non-compliance.
We are subject to rules and regulations by various governing bodies, including, for example, the Securitiesand Exchange Commission, which are charged with the protection of investors and the oversight of companieswhose securities are publicly traded. Our efforts to comply with new and changing regulations have resulted inand are likely to continue to result in, increased general and administrative expenses and a diversion ofmanagement time and attention from revenue-generating activities to compliance activities.
We are required to comply on an on-going basis with the Sarbanes-Oxley Act, or SOX, requirementsinvolving the assessment of our internal controls over financial reporting. Our efforts to comply with the SOXrequirements have required, and will continue to require the commitment of significant financial and personnelresources.
Moreover, because these laws, regulations and standards are subject to varying interpretations, theirapplication in practice may evolve over time as new guidance becomes available. This evolution may result incontinuing uncertainty regarding compliance matters and additional costs necessitated by ongoing revisions toour disclosure and governance practices. If we fail to address and comply with these regulations and anysubsequent changes, our business may be harmed.
Unanticipated changes in our effective tax rate could adversely affect our future results.
We are subject to income taxes in the United States and various foreign jurisdictions, and our domestic andinternational tax liabilities are subject to the allocation of expenses in differing jurisdictions.
Our effective tax rate has fluctuated over the past fiscal year. The tax rate is affected by changes in the mixof earnings and losses in countries with differing statutory tax rates, certain non-deductible expenses arising fromstock option compensation and the valuation of deferred tax assets and liabilities. Increases in our effective taxrate could materially affect our net results.
Natural disasters and other events beyond our control could materially adversely affect us.
Natural disasters or other catastrophic events may cause damage or disruption to our operations,international commerce and the global economy, and thus could have a strong negative effect on us. Our businessoperations are subject to interruption by natural disasters, fire, power shortages, and other events beyond our
27

control. Although we maintain crisis management and disaster response plans, such events could make it difficultor impossible for us to deliver our services to our customers, and could decrease demand for our services. Themajority of our research and development activities, corporate headquarters, information technology systems,and other critical business operations, are located near major seismic faults in the San Francisco Bay Area.Because we do not carry earthquake insurance for direct quake-related losses, and significant recovery time couldbe required to resume operations, our financial condition and operating results could be materially adverselyaffected in the event of a major earthquake or catastrophic event.
Risks Related to Ownership of Our Common Stock
The trading price of our common stock is likely to be volatile and could subject us to litigation.
The trading prices of the securities of technology companies have been highly volatile. Accordingly, thetrading price of our common stock has been and is likely to continue to be subject to wide fluctuations. Forexample, during the year ended January 31, 2009, the trading price of our common stock has ranged from aclosing price of $21.96 to $74.43 per share. Factors affecting the trading price of our common stock include:
• variations in our operating results, earnings per share, cash flows from operating activities, deferredrevenue, and other financial metrics and non-financial metrics, and how those results compare toanalyst expectations;
• forward looking guidance to industry and financial analysts related to future revenue and earnings pershare;
• the net increases in the number of customers and paying subscriptions, either independently or ascompared with published expectations of industry, financial or other analysts that cover our company;
• changes in the estimates of our operating results or changes in recommendations by securities analyststhat elect to follow our common stock;
• announcements of technological innovations, new services or service enhancements, strategic alliancesor significant agreements by us or by our competitors;
• announcements by us or by our competitors of mergers or other strategic acquisitions, or rumors ofsuch transactions involving us or our competitors;
• announcements of customer additions and customer cancellations or delays in customer purchases;
• recruitment or departure of key personnel;
• disruptions in our service due to computer hardware, software or network problems;
• the economy as a whole, market conditions in our industry, and the industries of our customers; and
• trading activity by a limited number of stockholders who together beneficially own a majority of ouroutstanding common stock.
In addition, if the market for technology stocks or the stock market in general experiences uneven investorconfidence, the trading price of our common stock could decline for reasons unrelated to our business, operatingresults or financial condition. The trading price of our common stock might also decline in reaction to events thataffect other companies within, or outside, our industry even if these events do not directly affect us.
If securities analysts stop publishing research or reports about us or our business or if they downgradeour stock, the price of our stock could decline.
The trading market for our common stock relies in part on the research and reports that industry or financialanalysts publish about us or our business. We do not control these analysts. If one or more of the analysts who docover us downgrade our stock or lower their future stock price targets or estimates of our operating results, our
28

stock price could decline rapidly. Furthermore, if one or more of these analysts cease coverage of our company,we could lose visibility in the market, which in turn could cause our stock price to decline.
The concentration of our capital stock ownership with insiders will likely limit your ability to influencecorporate matters.
Our executive officers, directors, and several stockholders and their affiliated entities together beneficiallyown a majority of our outstanding common stock.
As a result, these stockholders, if they act together or in a block, could have significant influence over mostmatters that require approval by our stockholders, including the election of directors and approval of significantcorporate transactions, even if other stockholders oppose them. This concentration of ownership might also havethe effect of delaying or preventing a change of control of our company that other stockholders may view asbeneficial.
Provisions in our amended and restated certificate of incorporation and bylaws and Delaware law mightdiscourage, delay or prevent a change of control of our company or changes in our management and,therefore, depress the trading price of our common stock.
Our amended and restated certificate of incorporation and bylaws contain provisions that could depress thetrading price of our common stock by acting to discourage, delay or prevent a change in control of our companyor changes in our management that the stockholders of our company may deem advantageous. These provisionsamong other things:
• establish a classified board of directors so that not all members of our board are elected at one time;
• permit the board of directors to establish the number of directors;
• provide that directors may only be removed “for cause” and only with the approval of 662⁄22 3⁄⁄ percent ofour stockholders;
• require super-majority voting to amend some provisions in our amended and restated certificate ofincorporation and bylaws;
• authorize the issuance of “blank check” preferred stock that our board could use to implementstockholder rights (also known as a “poison pill”);
• eliminate the ability of our stockholders to call special meetings of stockholders;
• prohibit stockholder action by written consent, which requires all stockholder actions to be taken at ameeting of our stockholders;
• provide that the board of directors is expressly authorized to make, alter or repeal our bylaws; and
• establish advance notice requirements for nominations for election to our board or for proposingmatters that can be acted upon by stockholders at annual stockholder meetings.
In addition, Section 203 of the Delaware General Corporation Law may discourage, delay or prevent achange in control of our company. Section 203 imposes certain restrictions on merger, business combinationsand other transactions between us and holders of 15 percent or more of our common stock.
ITEM 1B. UNRESOLVED STAFF COMMENTS
None.
29
ITEM 2. PROPERTIES
Our executive offices and principal office for domestic marketing, sales, professional services anddevelopment occupy approximately 408,000 square feet in San Francisco, California under leases that expire atvarious times through November 2017. We also lease space in various locations throughout the United States forlocal sales and professional services personnel. Our foreign subsidiaries lease office space for their operationsincluding local sales and professional services personnel.
We believe that our existing facilities and offices are adequate to meet our requirements for the foreseeablefuture. See Note 8, “Commitments and Contingencies,” in the Notes to the Consolidated Financial Statements formore information about our lease commitments. If we require additional space, we believe that we will be able toobtain such space on acceptable, commercially reasonable terms.
ITEM 3. LEGAL PROCEEDINGS
We are involved in various legal proceedings arising from the normal course of business activities. In ouropinion, resolution of these matters is not expected to have a material adverse impact on our consolidated resultsof operations, cash flows or our financial position. However, depending on the nature and timing of any suchdispute, an unfavorable resolution of a matter could materially affect our future results of operations, cash flowsor financial position in a particular period.
ITEM 4. SUBMISSION OF MATTERS TO A VOTE OF SECURITY HOLDERS
No matters were submitted to a vote of security holders during the fourth quarter of fiscal 2009.
ITEM 4A. EXECUTIVE OFFICERS OF THE REGISTRANT
The following sets forth certain information regarding our current executive officers (in alphabetical order):
Name Age Position
Marc Benioff . . . . . . . . . . . . . . . 44 Chairman of the Board of Directors and Chief Executive OfficerParker Harris . . . . . . . . . . . . . . . 42 Executive Vice President, TechnologyGeorge Hu . . . . . . . . . . . . . . . . . 34 Executive Vice President, MarketingKenneth Juster . . . . . . . . . . . . . . 54 Executive Vice President, Law, Policy and Corporate StrategyDavid Schellhase . . . . . . . . . . . . 45 Senior Vice President and General CounselGraham Smith . . . . . . . . . . . . . . 49 Executive Vice President and Chief Financial OfficerJim Steele . . . . . . . . . . . . . . . . . 53 Chief Customer Officer and President, Worldwide SalesPolly Sumner . . . . . . . . . . . . . . . 54 President, Alliances and ServicesFrank van Veenendaal . . . . . . . 49 Chief Sales Officer and President, Worldwide Sales
Marc Benioff co-founded salesforce.com in February 1999 and has served as Chairman of the Board ofDirectors since inception. He has served as Chief Executive Officer since November 2001. From 1986 to 1999,Mr. Benioff was employed at Oracle Corporation where he held a number of positions in sales, marketing andproduct development, lastly as a Senior Vice President. Mr. Benioff also serves as Chairman of the Board ofDirectors of the salesforce.com/foundation. Mr. Benioff received a Bachelor of Science in BusinessAdministration (B.S.B.A.) from the University of Southern California.
Parker Harris co-founded salesforce.com in February 1999 and served in senior technical positions sinceinception. Since December 2004, Mr. Harris has served as our Executive Vice President, Technology. FromOctober 1996 to February 1999, Mr. Harris was a Vice President at Left Coast Software, a Java consulting firmhe co-founded. Mr. Harris received a B.A. from Middlebury College.
30
George Hu has served as our Executive Vice President, Marketing, since February 2009. Previously, Mr. Huserved as our Executive Vice President, Marketing, Applications and Education from December 2007 toFebruary 2009, our Chief Marketing Officer from October 2006 through December 2007, our Senior VicePresident and General Manager, Applications from January to October 2006 and our Vice President, ProductMarketing from October 2004 to January 2006. Mr. Hu has also served in various management positions inmarketing since joining salesforce.com in March 2002. Mr. Hu received an A.B. from Harvard College and anM.B.A. from Stanford University.
Kenneth Juster has served as our Executive Vice President of Law, Policy and Corporate Strategy sinceJanuary 2005. From May 2001 to January 2005, Mr. Juster served as Under Secretary of the U.S. Department ofCommerce. From May 1993 to March 2001, Mr. Juster was a partner at the law firm of Arnold & Porter LLP.Mr. Juster received A.B., M.P.P. and J.D. degrees from Harvard University.
David Schellhase has served as our Vice President and General Counsel since July 2002. He was promotedto Senior Vice President and General Counsel in December 2004. From December 2000 to June 2002,Mr. Schellhase was an independent legal consultant and authored a treatise entitled Corporate Law DepartmentHandbook. Previously, he served as General Counsel at Linuxcare, Inc., The Vantive Corporation and PremenosTechnology Corp. Mr. Schellhase received a B.A. from Columbia University and a J.D. from Cornell University.
Graham Smith has served as our Executive Vice President and Chief Financial Officer since March2008. Prior to that, Mr. Smith served as our Executive Vice President and Chief Financial Officer Designate fromDecember 2007 to March 2008. Prior to salesforce.com, Mr. Smith was at Advent Software Inc. and served as itsChief Financial Officer from January 2003 to December 2007. In addition to Advent Software, he served asChief Financial Officer of Vitria Technology and Nuance Communications, and also served at OracleCorporation in various senior finance roles, lastly as Vice President of Finance for worldwide operations.Mr. Smith holds a B.Sc. from Bristol University in England and qualified as a member of the Institute ofchartered accountants in England and Wales.
Jim Steele has served as our Chief Customer Officer and President, Worldwide Sales since September 2008.Prior to this position, Mr. Steele was our Chief Customer Officer and President of International Operations fromDecember 2007 to September 2008, and our President, Worldwide Sales and Distribution from December 2004to December 2007. Prior to that he was our President of Worldwide Operations since joining salesforce.com inOctober 2002. From February 2001 to September 2002, Mr. Steele served as Executive Vice President,Worldwide Sales and Operations for Ariba, Inc., a software company. From February 1978 to January 2001,Mr. Steele served in a variety of globally focused executive roles at IBM Corporation. Mr. Steele received a B.S.from Bucknell University.
Polly Sumner has served as our President, Alliances and Services since February 2009. Prior to this position,she served as our President, Platform, Alliances and Services from January 2008 to February 2009. Prior tojoining salesforce.com, Ms. Sumner was President, Global Services, for Telcordia’s Consulting and IndustryInformation Services from January 2006 to April 2007. Before joining Telcordia, Ms. Sumner was anindependent consultant working with Warburg Pincus as an advisor on new and existing investments, boardrelations, and management team development from July 2003 to January 2006. Ms. Sumner also served aspresident of Alphablox Corporation, an analytics software company, from 2002 to 2003. She holds a B.A. fromNorthern Arizona University and an M.S. from American Graduate School of International Management.
Frank van Veenendaal has served as our Chief Sales Officer and President, Worldwide Sales sinceSeptember 2008. Prior to this position, he was our President, Global Corporate Sales and North AmericanOperations from December 2007 to September 2008 and our President, Worldwide Corporate Sales and Servicesfrom February 2007 to December 2007. Since joining us in 2001, Mr. van Veenendaal has also served in varioussales management positions, including Senior Vice President, North America Sales. From 1995 to 2001, Mr. vanVeenendaal was Senior Vice President of Sales of Actuate Corporation, a software company. Mr. vanVeenendaal received a B.S. from Rensselaer Polytechnic Institute.
31
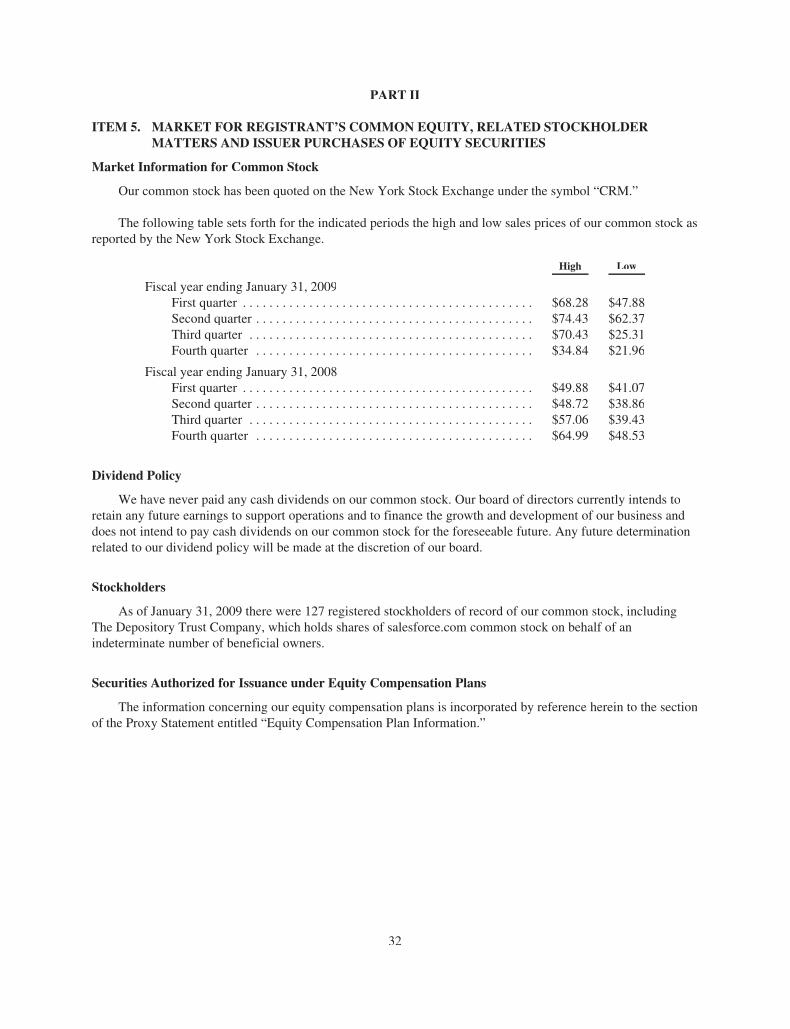
PART II
ITEM 5. MARKET FOR REGISTRANT’S COMMON EQUITY, RELATED STOCKHOLDERMATTERS AND ISSUER PURCHASES OF EQUITY SECURITIES
Market Information for Common Stock
Our common stock has been quoted on the New York Stock Exchange under the symbol “CRM.”
The following table sets forth for the indicated periods the high and low sales prices of our common stock asreported by the New York Stock Exchange.
High Low
Fiscal year ending January 31, 2009First quarter . . . . . . . . . . . . . . . . . . . . . . . . . . . . . . . . . . . . . . . . . . . . $68.28 $47.88Second quarter . . . . . . . . . . . . . . . . . . . . . . . . . . . . . . . . . . . . . . . . . . $74.43 $62.37Third quarter . . . . . . . . . . . . . . . . . . . . . . . . . . . . . . . . . . . . . . . . . . . $70.43 $25.31Fourth quarter . . . . . . . . . . . . . . . . . . . . . . . . . . . . . . . . . . . . . . . . . . $34.84 $21.96
Fiscal year ending January 31, 2008First quarter . . . . . . . . . . . . . . . . . . . . . . . . . . . . . . . . . . . . . . . . . . . . $49.88 $41.07Second quarter . . . . . . . . . . . . . . . . . . . . . . . . . . . . . . . . . . . . . . . . . . $48.72 $38.86Third quarter . . . . . . . . . . . . . . . . . . . . . . . . . . . . . . . . . . . . . . . . . . . $57.06 $39.43Fourth quarter . . . . . . . . . . . . . . . . . . . . . . . . . . . . . . . . . . . . . . . . . . $64.99 $48.53
Dividend Policy
We have never paid any cash dividends on our common stock. Our board of directors currently intends toretain any future earnings to support operations and to finance the growth and development of our business anddoes not intend to pay cash dividends on our common stock for the foreseeable future. Any future determinationrelated to our dividend policy will be made at the discretion of our board.
Stockholders
As of January 31, 2009 there were 127 registered stockholders of record of our common stock, includingThe Depository Trust Company, which holds shares of salesforce.com common stock on behalf of anindeterminate number of beneficial owners.
Securities Authorized for Issuance under Equity Compensation Plans
The information concerning our equity compensation plans is incorporated by reference herein to the sectionof the Proxy Statement entitled “Equity Compensation Plan Information.”
32

Stock Performance Graph
The following shall not be deemed incorporated by reference into any of our other filings under the SecuritiesExchange Act of 1934, as amended, or the Securities Act of 1933, as amended, except to the extent we specificallyincorporate it by reference into such filing.
The graph below compares the cumulative total stockholder return on our common stock with the cumulative totalreturn on the Standard & Poor’s 500 Index and the Nasdaq Computer & Data Processing Index for the periodbeginning on June 23, 2004 (the date our common stock commenced trading on the New York Stock Exchange)through January 31, 2009, assuming an initial investment of $100. Data for the Standard & Poor’s 500 Index and theNasdaq Computer & Data Processing Index assume reinvestment of dividends.
The comparisons in the graph below are based upon historical data and are not indicative of, nor intended toforecast, future performance of our common stock.
Comparison of Cumulative Total Return of salesforce.com, inc.
50
1/31/2005 1/31/2006 1/31/2007 1/31/2008 1/30/2009
250
200
150
100
300
350
450
500
400
DO
LL
AR
S
salesforce.com, inc. S&P 500 Index Nasdaq Computer
F
FF
F
F
B B B B
BH H H H
H
1/31/2005 1/31/2006 1/31/2007 1/31/2008 1/30/2009
salesforce.com . . . . . . . . . . . . . . . . . . . . . . . . . . . . . . . . . . . . . . . . . 124.55 373.18 398.45 471.91 241.91S&P 500 Index . . . . . . . . . . . . . . . . . . . . . . . . . . . . . . . . . . . . . . . . . 103.25 111.89 125.71 120.50 72.19Nasdaq
Computer & Data Processing Index . . . . . . . . . . . . . . . . . . . . . 100.45 111.93 116.62 117.84 71.02
Recent Sales of Unregistered Securities
None
33

ITEM 6. SELECTED FINANCIAL DATA
The following selected consolidated financial data should be read in conjunction with our auditedconsolidated financial statements and related notes thereto and with Management’s Discussion and Analysis ofFinancial Condition and Results of Operations, which are included elsewhere in this Form 10-K. Theconsolidated statement of operations data for fiscal 2009, 2008 and 2007, and the selected consolidated balancesheet data as of January 31, 2009 and 2008 are derived from, and are qualified by reference to, the auditedconsolidated financial statements and are included in this Form 10-K. The consolidated statement of operationsdata for fiscal 2006 and 2005 and the consolidated balance sheet data as of January 31, 2007, 2006 and 2005 arederived from audited consolidated financial statements which are not included in this Form 10-K.
Fiscal Year Ended January 31,
(in thousands, except per share data) 2009 2008 2007 2006 2005
Consolidated Statement of Operations:Revenues:
Subscription and support . . . . . . . . . . . . . . . . . . $ 984,574 $680,581 $451,660 $280,639 $157,977Professional services and other . . . . . . . . . . . . . 92,195 68,119 45,438 29,218 18,398
Total revenues . . . . . . . . . . . . . . . . . . . . . . 1,076,769 748,700 497,098 309,857 176,375Cost of revenues (1):
Subscription and support . . . . . . . . . . . . . . . . . . 127,082 91,268 61,457 34,457 12,727Professional services and other . . . . . . . . . . . . . 93,389 80,323 57,433 34,669 20,727
Total cost of revenues . . . . . . . . . . . . . . . . 220,471 171,591 118,890 69,126 33,454Gross profit . . . . . . . . . . . . . . . . . . . . . . . . . . . . . . . . 856,298 577,109 378,208 240,731 142,921Operating expenses (1):
Research and development . . . . . . . . . . . . . . . . 99,530 63,812 44,614 23,330 9,822Marketing and sales . . . . . . . . . . . . . . . . . . . . . . 534,413 376,480 252,935 149,598 96,311General and administrative . . . . . . . . . . . . . . . . 158,613 116,508 84,257 47,986 30,268Lease recovery . . . . . . . . . . . . . . . . . . . . . . . . . . — — — (285) —
Total operating expenses . . . . . . . . . . . . . . 792,556 556,800 381,806 220,629 136,401Income (loss) from operations . . . . . . . . . . . . . . . . . 63,742 20,309 (3,598) 20,102 6,520Interest, net . . . . . . . . . . . . . . . . . . . . . . . . . . . . . . . . 22,667 24,493 14,784 7,657 2,621Gain on sale of investment . . . . . . . . . . . . . . . . . . . . — 1,272 — — —Other income (expense) . . . . . . . . . . . . . . . . . . . . . . (817) 139 1,310 439 12
Income before (provision) benefit for income taxesand minority interest . . . . . . . . . . . . . . . . . . . . . . . 85,592 46,213 12,496 28,198 9,153
(Provision) benefit for income taxes . . . . . . . . . . . . . (37,557) (23,385) (9,795) 1,310 (1,217)
Income before minority interest . . . . . . . . . . . . . . . . 48,035 22,828 2,701 29,508 7,936Minority interest in consolidated joint venture . . . . . (4,607) (4,472) (2,220) (1,034) (590)
Net income (2) . . . . . . . . . . . . . . . . . . . . . . . . . . . . . . $ 43,428 $ 18,356 $ 481 $ 28,474 $ 7,346
Net income per share:Basic . . . . . . . . . . . . . . . . . . . . . . . . . . . . . . . . . $ 0.36 $ 0.16 $ 0.00 $ 0.27 $ 0.10Diluted . . . . . . . . . . . . . . . . . . . . . . . . . . . . . . . . 0.35 0.15 0.00 0.24 0.07
Weighted-average shares used in computing pershare amounts:Basic . . . . . . . . . . . . . . . . . . . . . . . . . . . . . . . . . 121,183 116,840 112,386 107,274 75,503Diluted . . . . . . . . . . . . . . . . . . . . . . . . . . . . . . . . 125,228 122,422 120,154 118,737 110,874
34
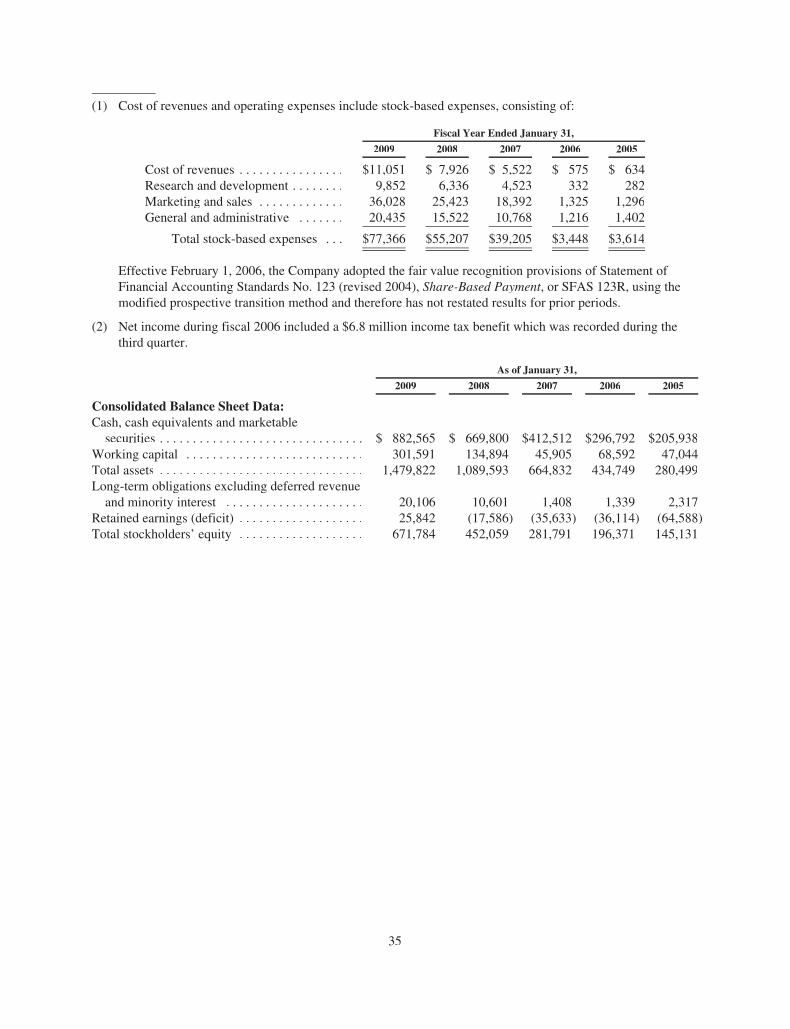
(1) Cost of revenues and operating expenses include stock-based expenses, consisting of:
Fiscal Year Ended January 31,
2009 2008 2007 2006 2005
Cost of revenues . . . . . . . . . . . . . . . . $11,051 $ 7,926 $ 5,522 $ 575 $ 634Research and development . . . . . . . . 9,852 6,336 4,523 332 282Marketing and sales . . . . . . . . . . . . . 36,028 25,423 18,392 1,325 1,296General and administrative . . . . . . . 20,435 15,522 10,768 1,216 1,402
Total stock-based expenses . . . $77,366 $55,207 $39,205 $3,448 $3,614
Effective February 1, 2006, the Company adopted the fair value recognition provisions of Statement ofFinancial Accounting Standards No. 123 (revised 2004), Share-Based Payment, or SFAS 123R, using themodified prospective transition method and therefore has not restated results for prior periods.
(2) Net income during fiscal 2006 included a $6.8 million income tax benefit which was recorded during thethird quarter.
As of January 31,
2009 2008 2007 2006 2005
Consolidated Balance Sheet Data:Cash, cash equivalents and marketablesecurities . . . . . . . . . . . . . . . . . . . . . . . . . . . . . . . $ 882,565 $ 669,800 $412,512 $296,792 $205,938
Working capital . . . . . . . . . . . . . . . . . . . . . . . . . . . 301,591 134,894 45,905 68,592 47,044Total assets . . . . . . . . . . . . . . . . . . . . . . . . . . . . . . . 1,479,822 1,089,593 664,832 434,749 280,499Long-term obligations excluding deferred revenueand minority interest . . . . . . . . . . . . . . . . . . . . . 20,106 10,601 1,408 1,339 2,317
Retained earnings (deficit) . . . . . . . . . . . . . . . . . . . 25,842 (17,586) (35,633) (36,114) (64,588)Total stockholders’ equity . . . . . . . . . . . . . . . . . . . 671,784 452,059 281,791 196,371 145,131
35
ITEM 7. MANAGEMENT’S DISCUSSION AND ANALYSIS OF FINANCIAL CONDITION ANDRESULTS OF OPERATIONS
The following discussion contains forward-looking statements, including, without limitation, ourexpectations regarding our outlook and future revenues, expenses, results of operations and liquidity. Our actualresults may differ significantly from those projected in the forward-looking statements. Factors that might causefuture actual results to differ materially from our recent results or those projected in the forward-lookingstatements include, but are not limited to, those discussed in the section titled “Risk Factors.” Except as requiredby law, we assume no obligation to update the forward-looking statements or our risk factors for any reason.
Overview
We are the leading provider, based on revenues and market share, of software on demand, according to aJuly 2008 report by IDC. We provide a comprehensive Customer Relationship Management, or CRM, service tobusinesses of all sizes and industries worldwide and we provide a technology platform for customers anddevelopers to build and run business applications. Approximately 55,400 customers worldwide usesalesforce.com to manage their customer, sales and operational data.
We were founded in February 1999 and began offering our enterprise CRM application service in February2000.
Our objective is to be the leading provider of CRM application services and to be the leading platform onwhich our customers and partners build Software-as-a-Service applications. Key elements of our strategyinclude:
• Strengthening our existing CRM applications and extending into new functional areas within CRM ;
• Pursuing new customers and new territories aggressively;
• Deepening relationships with our existing customer base;
• Continuing to lead the industry transformation to cloud computing; and
• Encouraging the development of third-party applications on our Force.com platform.
We believe the factors that will influence our ability to achieve our objectives include our prospectivecustomers’ willingness to migrate to an enterprise cloud computing application service; the performance andsecurity of our service; our ability to continue to release, and gain customer acceptance of new and improvedfeatures; successful customer adoption and utilization of our service; acceptance of our service in markets where wehave few customers; the emergence of additional competitors in our market and improved product offerings byexisting and new competitors; the location of new data centers; third-party developers’ willingness to developapplications on our platform; and general economic conditions which could affect our customers’ ability andwillingness to purchase our application service or delay the customers’ purchasing decision or affect renewal rates.
To address these factors, we will need to, among other things, continue to add substantial numbers of payingsubscriptions, upgrade our customers to fully featured versions such as our Unlimited Edition, provide highquality technical support to our customers and encourage the development of third-party applications on ourForce.com platform. We also plan to invest for future growth by expanding our data center capacity bothdomestically and internationally and, towards this end, we are opening a new data center in Singapore in fiscal2010. We also plan to hire additional personnel, particularly in direct sales, other customer-related areas andresearch and development. During the year ended January 31, 2009, we added 960 employees and our headcountas of January 31, 2009 was 3,566. We also plan to: expand our domestic and international selling and marketingactivities; add additional distribution channels; increase our research and development activities to upgrade andextend our service offerings and to develop new services and technologies; expand the number of locationsaround the world where we conduct business; add to our infrastructure to support our growth. Additionally, in
36

our effort to further strengthen and extend our service offering, we may acquire or make investments incomplementary companies, services and technologies.
In August 2008, we acquired InStranet, Inc. which offers a knowledge management application for businessto consumer call centers. We acquired InStranet, Inc. for its developed technology in order to expand our CRMcustomer service and support offerings in the customer service and support market. Additionally during the thirdquarter of fiscal 2009, we increased our ownership in our Japanese joint venture from 65 percent to 72 percent.
We expect marketing and sales costs, which were 50 percent of our total revenues for fiscal 2009 and thesame for the period a year ago, to continue to represent a substantial portion of total revenues in the future as weseek to add and manage more paying subscribers, and build brand awareness.
Fiscal Year
Our fiscal year ends on January 31. References to fiscal 2009, for example, refer to the fiscal year endedJanuary 31, 2009.
Sources of Revenues
We derive our revenues from two sources: (1) subscription revenues, which are comprised of subscriptionfees from customers accessing our enterprise cloud computing application service, and from customerspurchasing additional support beyond the standard support that is included in the basic subscription fee; and(2) related professional services and other revenues consisting primarily of training fees. Subscription andsupport revenues accounted for approximately 91 percent of our total revenues during fiscal 2009. Subscriptionrevenues are driven primarily by the number of paying subscribers of our service and the subscription price ofour service. None of our customers accounted for more than 5 percent of our revenues during fiscal 2009, 2008and 2007.
Subscription and support revenues are recognized ratably over the contract terms beginning on thecommencement dates of each contract. The typical subscription and support term is 12 to 24 months, althoughterms range from one to 60 months. Our subscription and support contracts are noncancelable, though customerstypically have the right to terminate their contracts for cause if we materially fail to perform. We generallyinvoice our customers in advance, in annual or quarterly installments, and typical payment terms provide that ourcustomers pay us within 30 days of invoice. Amounts that have been invoiced are recorded in accountsreceivable and in deferred revenue, or in revenue depending on whether the revenue recognition criteria havebeen met. In general, we collect our billings in advance of the subscription service period.
Professional services and other revenues consist of fees associated with consulting and implementationservices and training. Our consulting and implementation engagements are typically billed on a time andmaterials basis. We also offer a number of classes on implementing, using and administering our service that arebilled on a per person, per class basis. Our typical payment terms provide that our customers pay us within30 days of invoice.
We recognize revenue in accordance with the provisions of SEC Staff Accounting Bulletin No. 104, “RevenueRecognition,” or SAB 104, and Emerging Issues Task Force, or EITF, Issue No. 00-21, “Revenue Arrangementswith Multiple Deliverables,” or EITF 00-21. In determining whether professional services can be accounted forseparately from subscription and support revenues, we consider a number of factors, which are described in“Critical Accounting Policies and Estimates—Revenue Recognition” below. As we introduce new service offerings,we may not be able to establish objective and reliable evidence of fair value for these elements of our salesarrangements. As a result, when the professional services are sold together with subscription services that do nothave objective and reliable evidence of fair value, the professional services fees cannot be accounted for separately,and the entire arrangement is accounted for as a single unit of accounting. In such situations, we recognize the entire
37

arrangement fee ratably over the term of the subscription contract. Approximately 7 percent and 8 percent of ourtotal deferred revenue as of January 31, 2009 and 2008 respectively, related to deferred professional servicesrevenue.
Seasonal Nature of Deferred Revenue and Accounts Receivable
Deferred revenue primarily consists of billings to customers for our subscription service. Over 90 percent ofthe value of our billings to customers is for our subscription and support service. We generally invoice ourcustomers in either quarterly or annual cycles, with a disproportionate weighting towards annual billings in thefourth quarter, primarily as a result of large enterprise account buying patterns. Additionally, our fourth quarterhas historically been our strongest quarter for new business. The year on year compounding effect of thisseasonality in both billing patterns and overall new business is causing the value of invoices that we generate inthe fourth quarter for both new and existing customers to increase as a proportion of our total annual billings.
Accordingly, the sequential quarterly changes in accounts receivable and the related deferred revenue duringthe first three quarters of our fiscal year are not necessarily indicative of the billing activity that occurs in thefourth quarter.
The following table sets forth our accounts receivable and deferred revenue balances as of the end of eachfiscal quarter:
(in thousands)April 30,2008
July 31,2008
October 31,2008
January 31,2009
Fiscal 2009Accounts receivable, net . . . . . . . . . . . . . . . . . . . . . . . . . . . . . . . . $143,909 $146,982 $157,680 $266,555Deferred revenue, current and noncurrent . . . . . . . . . . . . . . . . . . 470,297 479,546 469,534 594,026
April 30,2007
July 31,2007
October 31,2007
January 31,2008
Fiscal 2008Accounts receivable, net . . . . . . . . . . . . . . . . . . . . . . . . . . . . . . . . $105,013 $114,046 $121,961 $220,061Deferred revenue, current and noncurrent . . . . . . . . . . . . . . . . . . 295,672 321,852 340,808 480,894
April 30,2006
July 31,2006
October 31,2006
January 31,2007
Fiscal 2007Accounts receivable, net . . . . . . . . . . . . . . . . . . . . . . . . . . . . . . . . $ 72,337 $ 75,704 $ 82,808 $128,693Deferred revenue, current and noncurrent . . . . . . . . . . . . . . . . . . 182,036 202,836 219,431 284,063
Cost of Revenues and Operating Expenses
Cost of Revenues. Cost of subscription and support revenues primarily consists of expenses related tohosting our service and providing support, the costs of data center capacity, depreciation or operating leaseexpense associated with computer equipment, costs associated with website development activities, allocatedoverhead and amortization expense associated with capitalized software related to our application service andacquired technology. We allocate overhead such as rent and occupancy charges based on headcount. Employeebenefit costs and taxes are allocated based upon a percentage of total compensation expense. As such, generaloverhead expenses are reflected in each cost of revenue and operating expense category. Cost of professionalservices and other revenues consists primarily of employee-related costs associated with these services, includingstock-based expenses, the cost of subcontractors and allocated overhead. The cost of providing professionalservices is significantly higher as a percentage of revenue than for our enterprise cloud computing subscriptionservice due to the direct labor costs.
38

We intend to continue to invest additional resources in our enterprise cloud computing application service.The timing of these additional expenses will affect our cost of revenues, both in terms of absolute dollars and as apercentage of revenues, in a particular quarterly period. For example, we intend to open a data center inSingapore in fiscal 2010. We expect the annual cost to be significant.
Research and Development. Research and development expenses consist primarily of salaries and relatedexpenses, including stock-based expenses, the costs of our development and test data center and allocatedoverhead. We continue to focus our research and development efforts on increasing the functionality andenhancing the ease of use of our enterprise cloud computing application service. Our proprietary, scalable andsecure multi-tenant architecture enables us to provide all of our customers with a service based on a singleversion of our application. As a result, we do not have to maintain multiple versions, which enables us to haverelatively lower research and development expenses as compared to traditional enterprise software companies.We expect that in the future, research and development expenses will increase in absolute dollars as we upgradeand extend our service offerings and develop new technologies.
Marketing and Sales. Marketing and sales expenses are our largest cost and consist primarily of salaries andrelated expenses, including stock-based expenses, for our sales and marketing staff, including commissions,payments to partners, marketing programs and allocated overhead. Marketing programs consist of advertising,events, corporate communications and brand building and product marketing activities.
We plan to continue to invest heavily in marketing and sales by increasing the number of direct salespersonnel in order to add new customers and increase penetration within our existing customer base, expandingour domestic and international selling and marketing activities, building brand awareness and sponsoringadditional marketing events. We expect that in the future, marketing and sales expenses will increase in absolutedollars and continue to be our largest cost.
General and Administrative. General and administrative expenses consist of salaries and related expenses,including stock-based expenses, for finance and accounting, human resources and management informationsystems personnel, legal costs, professional fees, other corporate expenses and allocated overhead. We expectthat in the future, general and administrative expenses will increase in absolute dollars as we add personnel andincur additional professional fees and insurance costs related to the growth of our business and internationalexpansion.
Stock-Based Expenses. Our cost of revenues and operating expenses include stock-based expenses related tooption and stock awards to employees and non-employee directors. We account for stock-based expensespursuant to the provisions of Statement of Financial Accounting Standards No. 123 (revised 2004), Share-BasedPayment, or SFAS 123R which we adopted on February 1, 2006. SFAS 123R requires that share-basedpayments, including grants of employee stock options be recognized as an expense in the statement of operationsbased on their fair values and vesting periods. These charges are significant and we expect them to increase inabsolute dollars in the future.
Joint Venture
In December 2000, we established a Japanese joint venture, Kabushiki Kaisha salesforce.com, withSunBridge, Inc., a Japanese corporation, to assist us with our sales efforts in Japan. During the third quarter offiscal 2009, we increased our ownership interest in the joint venture from 65 percent to 72 percent. Because ofthis majority interest, we consolidate the venture’s financial results, which are reflected in each revenue, cost ofrevenues and expense category in our consolidated statement of operations. We then record minority interest,which reflects the minority investors’ interest in the venture’s results. Through January 31, 2009, the operatingperformance and liquidity requirements of the Japanese joint venture have not been significant. While we plan toexpand our selling and marketing activities in Japan in order to add new customers, we believe the futureoperating performance and liquidity requirements of the Japanese joint venture will not be significant.
39

Critical Accounting Policies and Estimates
Our consolidated financial statements are prepared in accordance with accounting principles generallyaccepted in the United States. The preparation of these consolidated financial statements requires us to makeestimates and assumptions that affect the reported amounts of assets, liabilities, revenues, costs and expenses,and related disclosures. On an ongoing basis, we evaluate our estimates and assumptions. Our actual results maydiffer from these estimates under different assumptions or conditions.
We believe that of our significant accounting policies, which are described in note 1 to our consolidatedfinancial statements, the following accounting policies involve a greater degree of judgment and complexity.Accordingly, these are the policies we believe are the most critical to aid in fully understanding and evaluatingour consolidated financial condition and results of operations.
Revenue Recognition. We recognize revenue in accordance with the provisions of SAB 104 and EITF 00-21.
We recognize revenue when all of the following conditions are satisfied: (1) there is persuasive evidence ofan arrangement; (2) the service has been provided to the customer; (3) the collection of our fees is reasonablyassured; and (4) the amount of fees to be paid by the customer is fixed or determinable. Our arrangements do notcontain general rights of return.
We recognize subscription revenues ratably over the contract terms beginning on the commencement datesof each contract. Support revenues from customers who purchase our premium support offerings are recognizedsimilarly over the term of the support contract. As part of their subscription agreements, customers generallybenefit from new features and functionality with each release at no additional cost. In situations where we havecontractually committed to an individual customer specific technology, we defer all of the revenue for thatcustomer until the technology is delivered and accepted. Once delivery occurs, we then recognize the revenueover the remaining contract term.
Consulting services and training revenues are accounted for separately from subscription and supportrevenues when these services have value to the customer on a standalone basis and there is objective and reliableevidence of fair value of each deliverable. When accounted for separately, revenues are recognized as theservices are rendered for time and material contracts, and when the milestones are achieved and accepted by thecustomer for fixed price contracts. The majority of our consulting service contracts are on a time and materialbasis. Training revenues are recognized after the services are performed. For revenue arrangements with multipledeliverables, such as an arrangement that includes subscription, premium support, consulting or training services,we allocate the total amount the customer will pay to the separate units of accounting based on their relative fairvalues, as determined by the price of the undelivered items when sold separately.
In determining whether the consulting services can be accounted for separately from subscription andsupport revenues, we consider the following factors for each consulting agreement: availability of the consultingservices from other vendors, whether objective and reliable evidence for fair value exists for the undeliveredelements, the nature of the consulting services, the timing of when the consulting contract was signed incomparison to the subscription service start date, and the contractual dependence of the subscription service onthe customer’s satisfaction with the consulting work. If a consulting arrangement does not qualify for separateaccounting, we recognize the consulting revenue ratably over the remaining term of the subscription contract.Additionally, in these situations we defer the direct costs of the consulting arrangement and amortize those costsover the same time period as the consulting revenue is recognized. The deferred cost on our consolidated balancesheet totaled $17.3 million at January 31, 2009 and $13.9 million at January 31, 2008. Such amounts are includedin prepaid expenses and other current assets and other assets.
Accounting for Deferred Commissions. We defer commission payments to our direct sales force. Thecommissions are deferred and amortized to sales expense over the non-cancelable terms of the related
40

subscription contracts with our customers, which are typically 12 to 24 months. The commission payments,which are paid in full the month after the customer’s service commences, are a direct and incremental cost of therevenue arrangements. The deferred commission amounts are recoverable through the future revenue streamsunder the non-cancelable customer contracts. We believe this is the preferable method of accounting as thecommission charges are so closely related to the revenue from the non-cancelable customer contracts that theyshould be recorded as an asset and charged to expense over the same period that the subscription revenue isrecognized.
During fiscal 2009, we deferred $63.7 million of commission expenditures and we amortized $58.7 millionto sales expense. During the same period a year ago, we deferred $62.7 million of commission expenditures andwe amortized $42.2 million to sales expense. Deferred commissions on our consolidated balance sheet totaled$57.1 million at January 31, 2009 and $52.1 million at January 31, 2008.
Accounting for Stock-Based Awards.We account for share-based compensation under SFAS 123R. Werecognize the fair value of our stock awards on a straight-line basis over the requisite service period of the award,which is the vesting term of four years.
We recognized stock-based expense of $77.4 million, or 7 percent of revenue, during fiscal 2009. Therequirement to expense stock-based awards will continue to materially reduce our reported results of operations.As of January 31, 2009, we had an aggregate of $261.3 million of stock compensation remaining to be amortizedto expense over the remaining requisite service period of the underlying awards. We currently expect this stockcompensation balance to be amortized as follows: $105.1 million during fiscal 2010; $83.0 million during fiscal2011; $55.0 million during fiscal 2012; and $18.2 million during fiscal 2013. These amounts reflect onlyoutstanding stock awards as of January 31, 2009 and assume no forfeiture activity. We expect to continue toissue share-based awards to our employees in future periods.
We grant stock options and restricted stock units to employees throughout the world. In certain foreignjurisdictions, we are obligated for the payroll or social tax costs when employees exercise their vested awards.Pursuant to SFAS 123R, we recognize as an operating expense the payroll and social tax costs at the time of theexercise. The impact of SFAS 123R in the future is dependent upon, among other things, the timing of when wehire additional employees, the effect of long-term incentive strategies involving stock awards in order to continueto attract and retain employees, the total number of stock awards granted, the fair value of the stock awards at thetime of grant, changes in estimated forfeiture assumption rates and the tax benefit that we may or may not receivefrom stock-based expenses. Additionally, the application of SFAS 123R requires the use of an option-pricingmodel to determine the fair value of stock option awards. This determination of fair value is affected by our stockprice as well as assumptions regarding a number of highly complex and subjective variables. These variablesinclude, but are not limited to, our expected stock price volatility over the term of the awards.
As of January 31, 2009, there were 2.5 million restricted stock units outstanding. We plan to continueawarding restricted stock units to our employees in the future. The restricted stock units, which upon vestingentitles the holder to one share of common stock for each restricted stock unit, have an exercise price of $0.001per share, which is equal to the par value of our common stock, and vest over 4 years. The fair value of therestricted stock units is based on our closing stock price on the date of grant, and compensation expense, net ofestimated forfeitures, is recognized on a straight-line basis over the vesting period.
Accounting for Income Taxes. We account for income taxes using the liability method, which requires therecognition of deferred tax assets or liabilities for the tax-effected temporary differences between the financialreporting and tax bases of our assets and liabilities and for net operating loss and tax credit carryforwards. Thetax expense or benefit for unusual items, or certain adjustments to the valuation allowance are treated as discreteitems in the interim period in which the events occur.
41

Our effective tax rate could be adversely affected by changes in the mix of earnings and losses in countrieswith differing statutory tax rates, certain non-deductible expenses arising from SFAS 123R and the valuation ofdeferred tax assets and liabilities.
Results of Operations
The following tables set forth selected data for each of the periods indicated (in thousands).
Fiscal Year Ended January 31,
2009 2008 2007
Revenues:Subscription and support . . . . . . . . . . . . . . . . . . . . . . . . . . $ 984,574 $680,581 $451,660Professional services and other . . . . . . . . . . . . . . . . . . . . . 92,195 68,119 45,438
Total revenues . . . . . . . . . . . . . . . . . . . . . . . . . . . . . . . . . . . . . . 1,076,769 748,700 497,098
Cost of revenues:Subscription and support . . . . . . . . . . . . . . . . . . . . . . . . . . 127,082 91,268 61,457Professional services and other . . . . . . . . . . . . . . . . . . . . . 93,389 80,323 57,433
Total cost of revenues . . . . . . . . . . . . . . . . . . . . . . . . . . . . . . . . 220,471 171,591 118,890
Gross profit . . . . . . . . . . . . . . . . . . . . . . . . . . . . . . . . . . . . . . . . 856,298 577,109 378,208Operating expenses:
Research and development . . . . . . . . . . . . . . . . . . . . . . . . 99,530 63,812 44,614Marketing and sales . . . . . . . . . . . . . . . . . . . . . . . . . . . . . . 534,413 376,480 252,935General and administrative . . . . . . . . . . . . . . . . . . . . . . . . 158,613 116,508 84,257
Total operating expenses . . . . . . . . . . . . . . . . . . . . . . . . . . . . . . 792,556 556,800 381,806Income (loss) from operations . . . . . . . . . . . . . . . . . . . . . . . . . 63,742 20,309 (3,598)Interest, net . . . . . . . . . . . . . . . . . . . . . . . . . . . . . . . . . . . . . . . . 22,667 24,493 14,784Gain on sale of investment . . . . . . . . . . . . . . . . . . . . . . . . . . . . — 1,272 —Other income (expense) . . . . . . . . . . . . . . . . . . . . . . . . . . . . . . (817) 139 1,310
Income before provision for income taxes and minorityinterest . . . . . . . . . . . . . . . . . . . . . . . . . . . . . . . . . . . . . . . . . . 85,592 46,213 12,496
Provision for income taxes . . . . . . . . . . . . . . . . . . . . . . . . . . . . (37,557) (23,385) (9,795)
Income before minority interest . . . . . . . . . . . . . . . . . . . . . . . . 48,035 22,828 2,701Minority interest in consolidated joint venture . . . . . . . . . . . . . (4,607) (4,472) (2,220)
Net income . . . . . . . . . . . . . . . . . . . . . . . . . . . . . . . . . . . . . . . . $ 43,428 $ 18,356 $ 481
As of January 31,
2009 2008
Balance sheet data:Cash, cash equivalents and marketable securities . . . . . . . . . . . . . . . . . . . . . . . $882,565 $669,800Deferred revenue, current and noncurrent . . . . . . . . . . . . . . . . . . . . . . . . . . . . 594,026 480,894
Fiscal Year Ended January 31,
2009 2008 2007
Revenues by geography:Americas . . . . . . . . . . . . . . . . . . . . . . . . . . . . . . . . . . . . . . . . . . $ 776,495 $557,976 $387,570Europe . . . . . . . . . . . . . . . . . . . . . . . . . . . . . . . . . . . . . . . . . . . . 190,685 127,010 75,026Asia Pacific . . . . . . . . . . . . . . . . . . . . . . . . . . . . . . . . . . . . . . . . 109,589 63,714 34,502
$1,076,769 $748,700 $497,098
42

Cost of revenues and operating expenses include the following amounts related to stock-based awards.
Fiscal Year Ended January 31,
2009 2008 2007
Stock-based expenses:Cost of revenues . . . . . . . . . . . . . . . . . . . . . . . . . . . . . . . . . . . . . . . . . $11,051 $ 7,926 $ 5,522Research and development . . . . . . . . . . . . . . . . . . . . . . . . . . . . . . . . . 9,852 6,336 4,523Marketing and sales . . . . . . . . . . . . . . . . . . . . . . . . . . . . . . . . . . . . . . 36,028 25,423 18,392General and administrative . . . . . . . . . . . . . . . . . . . . . . . . . . . . . . . . 20,435 15,522 10,768
Total stock-based expenses . . . . . . . . . . . . . . . . . . . . . . . . . . . . $77,366 $55,207 $39,205
The following tables set forth selected consolidated statements of operations data for each of the periodsindicated as a percentage of total revenues.
Fiscal Year Ended January 31,
2009 2008 2007
Revenues:Subscription and support . . . . . . . . . . . . . . . . . . . . . . . . . . . . . . . . . . 91% 91% 91%Professional services and other . . . . . . . . . . . . . . . . . . . . . . . . . . . . . 9 9 9
Total revenues . . . . . . . . . . . . . . . . . . . . . . . . . . . . . . . . . . . . . . 100 100 100
Cost of revenues:Subscription and support . . . . . . . . . . . . . . . . . . . . . . . . . . . . . . . . . . 12 12 12Professional services and other . . . . . . . . . . . . . . . . . . . . . . . . . . . . . 8 11 12
Total cost of revenues . . . . . . . . . . . . . . . . . . . . . . . . . . . . . . . . . . . . . . . . 20 23 24
Gross profit . . . . . . . . . . . . . . . . . . . . . . . . . . . . . . . . . . . . . . . . . . . . . . . . 80 77 76Operating expenses:
Research and development . . . . . . . . . . . . . . . . . . . . . . . . . . . . . . . . . 9 8 9Marketing and sales . . . . . . . . . . . . . . . . . . . . . . . . . . . . . . . . . . . . . . 50 50 51General and administrative . . . . . . . . . . . . . . . . . . . . . . . . . . . . . . . . 15 16 17
Total operating expenses . . . . . . . . . . . . . . . . . . . . . . . . . . . . . . . . . . . . . . 74 74 77
Income (loss) from operations . . . . . . . . . . . . . . . . . . . . . . . . . . . . . . . . . . 6 3 (1)Interest, net . . . . . . . . . . . . . . . . . . . . . . . . . . . . . . . . . . . . . . . . . . . . . . . . . 2 3 4Gain on sale of investment . . . . . . . . . . . . . . . . . . . . . . . . . . . . . . . . . . . . . — — —Other income (expense) . . . . . . . . . . . . . . . . . . . . . . . . . . . . . . . . . . . . . . . — — —
Income before provision for income taxes and minority interest . . . . . . . 8 6 3Provision for income taxes . . . . . . . . . . . . . . . . . . . . . . . . . . . . . . . . . . . . . (4) (3) (2)
Income before minority interest . . . . . . . . . . . . . . . . . . . . . . . . . . . . . . . . . 4 3 1Minority interest in consolidated joint venture . . . . . . . . . . . . . . . . . . . . . — (1) (1)
Net income . . . . . . . . . . . . . . . . . . . . . . . . . . . . . . . . . . . . . . . . . . . . . . . . . 4% 2% — %
Fiscal Year Ended January 31,
2009 2008 2007
Revenues by geography:Americas . . . . . . . . . . . . . . . . . . . . . . . . . . . . . . . . . . . . . . . . . . . . . . . . . . 72% 75% 78%Europe . . . . . . . . . . . . . . . . . . . . . . . . . . . . . . . . . . . . . . . . . . . . . . . . . . . . 18 17 15Asia Pacific . . . . . . . . . . . . . . . . . . . . . . . . . . . . . . . . . . . . . . . . . . . . . . . . 10 8 7
100% 100% 100%
43

Fiscal Year Ended January 31,
2009 2008 2007
Stock-based expenses:Cost of revenues . . . . . . . . . . . . . . . . . . . . . . . . . . . . . . . . . . . . . . . . . . . . . 1% 1% 1%Research and development . . . . . . . . . . . . . . . . . . . . . . . . . . . . . . . . . . . . . 1 1 1Marketing and sales . . . . . . . . . . . . . . . . . . . . . . . . . . . . . . . . . . . . . . . . . . 3 3 4General and administrative . . . . . . . . . . . . . . . . . . . . . . . . . . . . . . . . . . . . 2 2 2
7% 7% 8%
Overview of Fiscal Year Ended January 31, 2009
During fiscal 2009, our net income was $43.4 million, which included $77.4 million of stock-basedexpenses, or 7 percent of total revenue. Net income during the same period a year ago was $18.4 million, whichincluded $55.2 million of stock-based expenses, or 7 percent of total revenue.
Revenues during fiscal 2009 were $1,076.8 million, an increase of 44 percent over the same period a yearago. Our gross profit during fiscal 2009 was $856.3 million, or 80 percent of revenues, and included stock-basedexpenses of $11.1 million. Our operating income was $63.7 million and included stock-based expenses of $77.4million. During the same period a year ago, we generated a gross profit of $577.1 million, or 77 percent ofrevenues, and had operating income of $20.3 million. Operating income for fiscal 2008 included $55.2 million ofstock-based expenses.
During fiscal 2009, we added sales personnel to focus on adding new customers and increasing the sale ofsubscriptions to existing customers, developers to broaden and enhance our enterprise cloud computing serviceand we invested in our infrastructure to meet the demands of an expanding business.
During fiscal 2009, we generated $229.6 million of cash from operating activities, as compared to $204.3million during the same period a year ago. At January 31, 2009, we had cash, cash equivalents and marketablesecurities of $882.6 million, as compared to $669.8 million at January 31, 2008, accounts receivable of $266.6million at January 31, 2009, as compared to $220.1 million at January 31, 2008, and deferred revenue, currentand noncurrent of $594.0 million at January 31, 2009, as compared to $480.9 million at January 31, 2008.
Fiscal Years Ended January 31, 2009 and 2008
Revenues.
Fiscal Year Ended January 31, Variance
(In thousands) 2009 2008 Dollars Percent
Subscription and support . . . . . . . . . . . . . . . . . . . $ 984,574 $680,581 $303,993 45%Professional services and other . . . . . . . . . . . . . . 92,195 68,119 24,076 35%
Total revenues . . . . . . . . . . . . . . . . . . . . . . . . . . . $1,076,769 $748,700 $328,069 44%
Total revenues were $1,076.8 million for fiscal 2009, compared to $748.7 million during the same period ayear ago, an increase of $328.1 million, or 44 percent. Subscription and support revenues were $984.6 million, or91 percent of total revenues, for fiscal 2009, compared to $680.6 million, or 91 percent of total revenues, duringthe same period a year ago. The increase in subscription and support revenues was due primarily to an increasednumber of new customers, additional paying subscriptions from existing customers, and customers who haveupgraded. Professional services and other revenues were $92.2 million, or 9 percent of total revenues, for fiscal2009, compared to $68.1 million, or 9 percent of total revenues, for the same period a year ago. The increase inprofessional services and other revenues was due primarily to the higher demand for services from an increasednumber of paying subscriptions and customers.
44
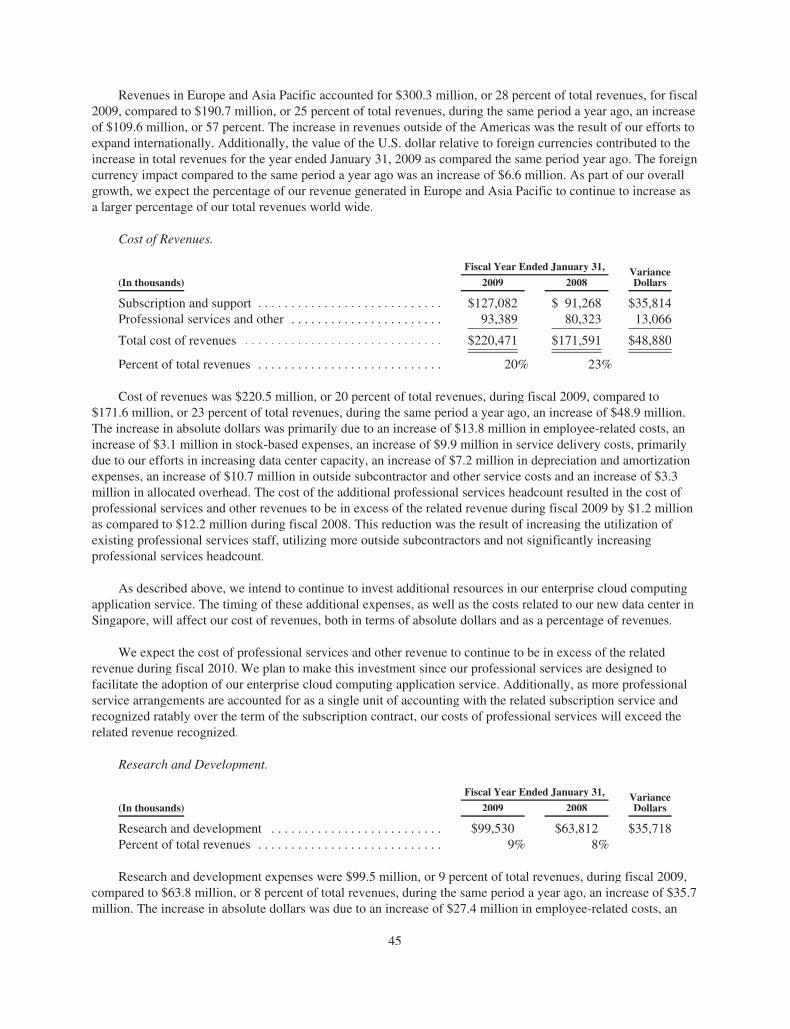
Revenues in Europe and Asia Pacific accounted for $300.3 million, or 28 percent of total revenues, for fiscal2009, compared to $190.7 million, or 25 percent of total revenues, during the same period a year ago, an increaseof $109.6 million, or 57 percent. The increase in revenues outside of the Americas was the result of our efforts toexpand internationally. Additionally, the value of the U.S. dollar relative to foreign currencies contributed to theincrease in total revenues for the year ended January 31, 2009 as compared the same period year ago. The foreigncurrency impact compared to the same period a year ago was an increase of $6.6 million. As part of our overallgrowth, we expect the percentage of our revenue generated in Europe and Asia Pacific to continue to increase asa larger percentage of our total revenues world wide.
Cost of Revenues.
Fiscal Year Ended January 31, VarianceDollars(In thousands) 2009 2008
Subscription and support . . . . . . . . . . . . . . . . . . . . . . . . . . . . $127,082 $ 91,268 $35,814Professional services and other . . . . . . . . . . . . . . . . . . . . . . . 93,389 80,323 13,066
Total cost of revenues . . . . . . . . . . . . . . . . . . . . . . . . . . . . . . $220,471 $171,591 $48,880
Percent of total revenues . . . . . . . . . . . . . . . . . . . . . . . . . . . . 20% 23%
Cost of revenues was $220.5 million, or 20 percent of total revenues, during fiscal 2009, compared to$171.6 million, or 23 percent of total revenues, during the same period a year ago, an increase of $48.9 million.The increase in absolute dollars was primarily due to an increase of $13.8 million in employee-related costs, anincrease of $3.1 million in stock-based expenses, an increase of $9.9 million in service delivery costs, primarilydue to our efforts in increasing data center capacity, an increase of $7.2 million in depreciation and amortizationexpenses, an increase of $10.7 million in outside subcontractor and other service costs and an increase of $3.3million in allocated overhead. The cost of the additional professional services headcount resulted in the cost ofprofessional services and other revenues to be in excess of the related revenue during fiscal 2009 by $1.2 millionas compared to $12.2 million during fiscal 2008. This reduction was the result of increasing the utilization ofexisting professional services staff, utilizing more outside subcontractors and not significantly increasingprofessional services headcount.
As described above, we intend to continue to invest additional resources in our enterprise cloud computingapplication service. The timing of these additional expenses, as well as the costs related to our new data center inSingapore, will affect our cost of revenues, both in terms of absolute dollars and as a percentage of revenues.
We expect the cost of professional services and other revenue to continue to be in excess of the relatedrevenue during fiscal 2010. We plan to make this investment since our professional services are designed tofacilitate the adoption of our enterprise cloud computing application service. Additionally, as more professionalservice arrangements are accounted for as a single unit of accounting with the related subscription service andrecognized ratably over the term of the subscription contract, our costs of professional services will exceed therelated revenue recognized.
Research and Development.
Fiscal Year Ended January 31, VarianceDollars(In thousands) 2009 2008
Research and development . . . . . . . . . . . . . . . . . . . . . . . . . . $99,530 $63,812 $35,718Percent of total revenues . . . . . . . . . . . . . . . . . . . . . . . . . . . . 9% 8%
Research and development expenses were $99.5 million, or 9 percent of total revenues, during fiscal 2009,compared to $63.8 million, or 8 percent of total revenues, during the same period a year ago, an increase of $35.7million. The increase in absolute dollars was due to an increase of $27.4 million in employee-related costs, an
45

increase of $3.5 million in stock-based expenses, and an increase in allocated overhead. We increased ourresearch and development headcount by 61 percent since January 31, 2008 in order to upgrade and extend ourservice offerings and develop new technologies.
Marketing and Sales.
Fiscal Year Ended January 31, VarianceDollars(In thousands) 2009 2008
Marketing and sales . . . . . . . . . . . . . . . . . . . . . . . . . . . . . . . $534,413 $376,480 $157,933Percent of total revenues . . . . . . . . . . . . . . . . . . . . . . . . . . . 50% 50%
Marketing and sales expenses were $534.4 million, or 50 percent of total revenues, during fiscal 2009,compared to $376.5 million, or 50 percent of total revenues, during the same period a year ago, an increase of$157.9 million. The increase in absolute dollars was primarily due to increases of $94.1 million in employee-related costs, $10.6 million in stock-based expenses, $28.9 million in advertising costs and marketing and eventcosts, $1.6 million in partner referral fees, $1.4 million of amortized purchased intangibles and $20.3 million inallocated overhead. Our marketing and sales headcount increased by 40 percent since January 31, 2008 as wehired additional sales personnel to focus on adding new customers and increasing penetration within our existingcustomer base.
General and Administrative.
Fiscal Year Ended January 31, VarianceDollars(In thousands) 2009 2008
General and administrative . . . . . . . . . . . . . . . . . . . . . . . . . . $158,613 $116,508 $42,105Percent of total revenues . . . . . . . . . . . . . . . . . . . . . . . . . . . . 15% 16%
General and administrative expenses were $158.6 million, or 15 percent of total revenues, during fiscal 2009,compared to $116.5 million, or 16 percent of total revenues, during the same period a year ago, an increase of $42.1million. The increase was primarily due to increases in employee-related costs, stock-based expenses, infrastructure-related costs, and professional and outside service costs. Our general and administrative headcount increased by 30percent since January 31, 2008 as we added personnel to support our growth.
Operating Income.
Fiscal Year Ended January 31, VarianceDollars(In thousands) 2009 2008
Operating income . . . . . . . . . . . . . . . . . . . . . . . . . . . . . . . . . . $63,742 $20,309 $43,433Percent of total revenues . . . . . . . . . . . . . . . . . . . . . . . . . . . . 6% 3%
Operating income during fiscal 2009 was $63.7 million and included $77.4 million of stock-based expensesrelated to SFAS 123R. During the same period a year ago, operating income was $20.3 million and included$55.2 million of stock-based expenses.
Interest, net.
Fiscal Year Ended January 31, VarianceDollars(In thousands) 2009 2008
Interest, net . . . . . . . . . . . . . . . . . . . . . . . . . . . . . . . . . . . . . . . $22,667 $24,493 $(1,826)Percent of total revenues . . . . . . . . . . . . . . . . . . . . . . . . . . . . 2% 3%
46

Interest, net consists of investment income on cash and marketable securities balances. Interest, net was$22.7 million during fiscal 2009 and was $24.5 million during the same period a year ago. The decrease wasprimarily due to a $1.8 million loss for our investment in marketable securities as discussed under “Liquidity andCapital Resources.” Due to the current decline in market interest rates since last year and our focus on capitalpreservation, investment income declined when compared to the same periods in the previous year.
Gain on Sale of Investment.
Gain on sale of investment of $1.3 million for fiscal 2008 consists of the gain we recorded when we sold ourshares in a privately held professional service corporation.
Other income (expense).
(In thousands) Fiscal Year Ended January 31, VarianceDollars2009 2008
Other income (expense) . . . . . . . . . . . . . . . . . . . . . . . . . . . . . $(817) $139 $(956)
Other income (expense) primarily consists of foreign currency translation adjustments. Other income(expense) decreased due to realized and unrealized gains on foreign currency translations for the year endedJanuary 31, 2009 when compared to the same period a year ago.
Provision for Income Taxes.
Fiscal Year Ended January 31, VarianceDollars(In thousands) 2009 2008
Provision for income taxes . . . . . . . . . . . . . . . . . . . . . . . . . . $(37,557) $(23,385) $(14,172)Effective tax rate . . . . . . . . . . . . . . . . . . . . . . . . . . . . . . . . . . 44% 51%
The fiscal 2009 provision as a percentage of income before provision for income taxes and minority interestwas significantly lower than for the same period a year ago primarily due to a reduced proportion of foreignlosses for which no tax benefit can be realized and increased tax credits. The total income tax benefit recognizedin the accompanying consolidated statement of operations related to SFAS 123R was $26.3 million for thecurrent fiscal year. See Note 7 “Income Taxes” to the Notes to the Consolidated Financial Statements for ourreconciliation of income taxes at the statutory federal rate to the provision for income taxes.
Fiscal Years Ended January 31, 2008 and 2007
Revenues.
Fiscal Year Ended January 31, Variance
(In thousands) 2008 2007 Dollars Percent
Subscription and support . . . . . . . . . . . . . . . . . . . $680,581 $451,660 $228,921 51%Professional services and other . . . . . . . . . . . . . . 68,119 45,438 22,681 50%
Total revenues . . . . . . . . . . . . . . . . . . . . . . . . . . . $748,700 $497,098 $251,602 51%
Total revenues were $748.7 million for fiscal 2008, compared to $497.1 million during fiscal 2007, anincrease of $251.6 million, or 51 percent. Subscription and support revenues were $680.6 million, or 91 percentof total revenues, for fiscal 2008, compared to $451.7 million, or 91 percent of total revenues, during fiscal 2007.The increase in subscription and support revenues was due primarily to an increased number of new customers,additional paying subscriptions from existing customers, and customers who have upgraded. Professional
47

services and other revenues were $68.1 million, or 9 percent of total revenues, for fiscal 2008, compared to $45.4million, or 9 percent of total revenues, for fiscal 2007. The increase in professional services and other revenueswas due primarily to the higher demand for services from an increased number of paying subscriptions andcustomers.
Revenues in Europe and Asia Pacific accounted for $190.7 million, or 25 percent of total revenues, for fiscal2008, compared to $109.5 million, or 22 percent of total revenues, during fiscal 2007, an increase of $81.2million, or 74 percent. The increase in revenues outside of the Americas was the result of our efforts to expandinternationally.
Cost of Revenues.
Fiscal Year Ended January 31, VarianceDollars(In thousands) 2008 2007
Subscription and support . . . . . . . . . . . . . . . . . . . . . . . . . . . . $ 91,268 $ 61,457 $29,811Professional services and other . . . . . . . . . . . . . . . . . . . . . . . 80,323 57,433 22,890
Total cost of revenues . . . . . . . . . . . . . . . . . . . . . . . . . . . . . . $171,591 $118,890 $52,701
Percent of total revenues . . . . . . . . . . . . . . . . . . . . . . . . . . . . 23% 24%
Cost of revenues was $171.6 million, or 23 percent of total revenues, during fiscal 2008, compared to$118.9 million, or 24 percent of total revenues, during fiscal 2007, an increase of $52.7 million. The increase inabsolute dollars was primarily due to an increase of $16.6 million in employee-related costs, an increase of $2.4million in stock-based expenses, an increase of $14.0 million in service delivery costs, primarily due to ourefforts in increasing data center capacity, an increase of $4.3 million in depreciation and amortization expenses,an increase of $10.2 million in outside subcontractor and other service costs and an increase of $4.7 million inallocated overhead. The cost of the additional professional services headcount resulted in the cost of professionalservices and other revenues to be in excess of the related revenue during fiscal 2008 by $12.2 million. Weincreased the professional services headcount in order to meet the current and anticipated demand for ourconsulting and training services as our subscriber base has expanded to include more large businesses and as wehave expanded internationally.
Research and Development.
Fiscal Year Ended January 31, VarianceDollars(In thousands) 2008 2007
Research and development . . . . . . . . . . . . . . . . . . . . . . . . . . $63,812 $44,614 $19,198Percent of total revenues . . . . . . . . . . . . . . . . . . . . . . . . . . . . 8% 9%
Research and development expenses were $63.8 million, or 8 percent of total revenues, during fiscal 2008,compared to $44.6 million, or 9 percent of total revenues, during fiscal 2007, an increase of $19.2 million. Theincrease in absolute dollars was due to an increase of $15.0 million in employee-related costs, an increase of $1.8million in stock-based expenses, and an increase of $2.4 million in allocated overhead. We increased ourresearch and development headcount by 32 percent between January 31, 2007 and January 31, 2008 in order toupgrade and extend our service offerings and develop new technologies.
Marketing and Sales.
Fiscal Year Ended January 31, VarianceDollars(In thousands) 2008 2007
Marketing and sales . . . . . . . . . . . . . . . . . . . . . . . . . . . . . . . $376,480 $252,935 $123,545Percent of total revenues . . . . . . . . . . . . . . . . . . . . . . . . . . . 50% 51%
48

Marketing and sales expenses were $376.5 million, or 50 percent of total revenues, during fiscal 2008,compared to $252.9 million, or 51 percent of total revenues, during fiscal 2007, an increase of $123.6 million.The increase in absolute dollars was primarily due to increases of $85.9 million in employee-related costs, $7.0million in stock-based expenses, $10.8 million in advertising costs, $2.2 million in marketing and event costs,$1.7 million in partner referral fees and $13.9 million in allocated overhead. Our marketing and sales headcountincreased by 27 percent between January 31, 2007 and January 31, 2008 as we hired additional sales personnel tofocus on adding new customers and increasing penetration within our existing customer base.
General and Administrative.
Fiscal Year Ended January 31, VarianceDollars(In thousands) 2008 2007
General and administrative . . . . . . . . . . . . . . . . . . . . . . . . . . $116,508 $84,257 $32,251Percent of total revenues . . . . . . . . . . . . . . . . . . . . . . . . . . . . 16% 17%
General and administrative expenses were $116.5 million, or 16 percent of total revenues, during fiscal2008, compared to $84.3 million, or 17 percent of total revenues, during fiscal 2007, an increase of $32.2 million.The increase was primarily due to increases in employee-related costs, stock-based expenses, infrastructure-related costs, professional and outside service costs and a legal settlement. Our general and administrativeheadcount increased by 33 percent between January 31, 2007 and January 31, 2008 as we added personnel tosupport our growth.
Operating Income (Loss).
Fiscal Year Ended January 31, VarianceDollars(In thousands) 2008 2007
Operating income (loss) . . . . . . . . . . . . . . . . . . . . . . . . . . . . . $20,309 $(3,598) $23,907Percent of total revenues . . . . . . . . . . . . . . . . . . . . . . . . . . . . 3% (1)%
Operating income during fiscal 2008 was $20.3 million and included $55.2 million of stock-based expensesrelated to SFAS 123R. During fiscal 2007, operating loss was $3.6 million and included $39.2 million of stock-based expenses.
Interest, net.
Fiscal Year Ended January 31, VarianceDollars(In thousands) 2008 2007
Interest, net . . . . . . . . . . . . . . . . . . . . . . . . . . . . . . . . . . . . . . . $24,493 $14,784 $9,709Percent of total revenues . . . . . . . . . . . . . . . . . . . . . . . . . . . . 3% 4%
Interest, net consists of investment income on cash and marketable securities balances. Interest, net was$24.5 million during fiscal 2008 and was $14.8 million during fiscal 2007. The increase was primarily due toincreased marketable securities balances resulting from the cash generated by operating activities and theproceeds from stock option exercises.
Other income.
Fiscal Year Ended January 31, VarianceDollars(In thousands) 2008 2007
Other income . . . . . . . . . . . . . . . . . . . . . . . . . . . . . . . . . . . . . $139 $1,310 $(1,171)
49

Other income primarily consists of foreign currency translation adjustments. Other income decreased due torealized and unrealized gains and losses on foreign currency translations for fiscal 2008 compared to fiscal 2007.
Provision for Income Taxes.
Fiscal Year Ended January 31, VarianceDollars(In thousands) 2008 2007
Provision for income taxes . . . . . . . . . . . . . . . . . . . . . . . . . . $(23,385) $(9,795) $(13,590)Effective tax rate . . . . . . . . . . . . . . . . . . . . . . . . . . . . . . . . . . 51% 78%
We recorded a provision for income taxes of $23.4 million during fiscal 2008, compared to a provision forincome taxes of $9.8 million during fiscal 2007.
Our effective tax rate decreased to 51 percent for fiscal 2008 compared to 78 percent for fiscal 2007.
The fiscal 2008 provision as a percentage of income before provision for income taxes and minority interestwas significantly lower than for fiscal 2007 primarily due to a reduced proportion of foreign losses for which notax benefit could be realized. The total income tax benefit recognized in the accompanying consolidatedstatement of operations related to SFAS 123R was $18.5 million for fiscal 2008. See Note 7 “Income Taxes” tothe Notes to the Consolidated Financial Statements for our reconciliation of income taxes at the statutory federalrate to the provision for income taxes.
Liquidity and Capital Resources
At January 31, 2009, our principal sources of liquidity were cash, cash equivalents and marketable securitiestotaling $882.6 million, and accounts receivable of $266.6 million.
Net cash provided by operating activities was $229.6 million during fiscal 2009 and $204.3 million duringthe same period a year ago. The improvement in cash flow was due primarily to the growth in our customer baseand the associated increase in billings and collections. Cash provided by operating activities has historically beenaffected by: the amount of net income; sales of subscriptions, support and professional services; changes inworking capital accounts, particularly increases and seasonality in accounts receivable and deferred revenue asdescribed above; the timing of commission and bonus payments; collections from large enterprise customers;add-backs of non-cash expense items such as depreciation and amortization; and, the expense associated withstock-based awards.
Net cash used in investing activities was $121.0 million during fiscal 2009 and $102.7 million during thesame period a year ago. The net cash used in investing activities during fiscal 2009 primarily related to theacquisition of InStranet, Inc, and the purchase of shares of Salesforce Japan from the minority shareholders. Inaddition, our investing activities included the investment of operating cash balances and capital expenditures inleasehold improvements, and the purchase of software licenses, computer equipment and furniture and fixtures aswe have expanded our infrastructure, number of offices around the world and work force. We expanded one ofour existing software license agreements to provide additional capacity in our business operations at a cost of$8.0 million. The Company during the year invested approximately $2.0 million in system integrators andsoftware-as-a-service ISVs.
Net cash provided by financing activities was $96.9 million during fiscal 2009 and $92.7 million during thesame period a year ago. Net cash provided by financing activities during fiscal 2009 substantially consisted of$43.3 million of proceeds from the exercise of employee stock options and $54.6 million of excess tax benefitsfrom employee stock plans.
50

Our cash, cash equivalents and marketable securities are comprised of corporate notes and obligations, U.S.agency obligations, time deposits, money market mutual funds, asset-backed securities and an investment in TheReserve Primary Fund (“The Reserve Fund”), a money market mutual fund that suspended redemptions and is inthe process of being liquidated.
As of January 31, 2009 our investment portfolio included $19.5 million invested in The Reserve Fund withan estimated fair value of $18.3 million. During the year ended January 31, 2009 we recorded a $1.2 million lossrelated to this decline in fair value that is considered other-than-temporary. While we believe we have the rightsto the recovery of the entire $19.5 million investment, we cannot predict the ultimate amount that we willreceive. Therefore, we have recorded the aforementioned other-than-temporary loss. Subsequent to January 31,2009 we received an additional $6.1 million redemption from The Reserve Fund.
As of January 31, 2009, we have a total of $8.3 million in letters of credit outstanding in favor of ourlandlords for office space in San Francisco, California, New York City, Singapore, Sweden and Switzerland. Todate, no amounts have been drawn against the letters of credit, which renew annually and mature at various datesthrough December 2016.
We do not have any special purpose entities, and other than operating leases for office space and computerequipment, we do not engage in off-balance sheet financing arrangements. Additionally, we currently do nothave a bank line of credit.
Our principal commitments consist of obligations under leases for office space and co-location facilities fordata center capacity and the development and test data center, and computer equipment and furniture andfixtures. At January 31, 2009, the future non-cancelable minimum payments under these commitments were asfollows:
Payments Due by Period
Contractual Obligations TotalLess than1 Year
1-3Years
3-5Years
More than5 Years
(in thousands)
Capital lease obligations . . . . . . . . . . . . . . $ 6,444 $ 2,394 $ 4,050 $ — $ —Operating lease obligations:
Facilities space . . . . . . . . . . . . . . . . . 257,245 49,502 81,204 67,025 59,514Computer equipment and furnitureand fixtures . . . . . . . . . . . . . . . . . . 55,391 31,001 24,390 — —
Contractual commitments . . . . . . . . . . . . . $ 1,526 1,234 292 — —
Our lease agreements provide us with the option to renew. Our future operating lease obligations wouldchange if we exercised these options and if we entered into additional operating lease agreements as we expandour operations.
Purchase orders are not included in the table above. Our purchase orders represent authorizations topurchase rather than binding agreements. The contractual commitment amounts in the table above are associatedwith agreements that are enforceable and legally binding and that specify all significant terms, including: fixed orminimum services to be used; fixed, minimum or variable price provisions; and the approximate timing of thetransaction. Obligations under contracts that we can cancel without a significant penalty are not included in thetable above.
We adopted Financial Interpretation No. 48, Accounting for Uncertainty in Income Taxes, (“FIN 48”) onFebruary 1, 2007. We are unable to make a reasonably reliable estimate of the timing of payments in individualyears beyond 12 months due to uncertainties in the timing of tax audit outcomes. As a result, this amount is notincluded in the table above. For further information, see Note 7 to the notes to consolidated financial statements.
51

We believe our existing cash, cash equivalents and short-term marketable securities and cash provided byoperating activities will be sufficient to meet our working capital and capital expenditure needs over the next12 months.
During fiscal 2010, we may enter into arrangements to acquire or invest in other businesses, services ortechnologies. While we believe we have sufficient financial resources, we may be required to seek additionalequity or debt financing. Additional funds may not be available on terms favorable to us or at all.
Recent Accounting Pronouncements
In April 2008, the Financial Accounting Standards Board (FASB) issued FSP No. 142-3, “Determination ofthe Useful Life of Intangible Assets” (FSP No. 142-3) that amends the factors considered in developing renewalor extension assumptions used to determine the useful life of a recognized intangible asset under SFAS No. 142.FSP No. 142-3 requires a consistent approach between the useful life of a recognized intangible asset underSFAS No. 142 and the period of expected cash flows used to measure the fair value of an asset under SFASNo. 141(R). The FSP also requires enhanced disclosures when an intangible asset’s expected future cash flowsare affected by an entity’s intent and/or ability to renew or extend the arrangement. FSP No. 142-3 is effectivefor financial statements issued for fiscal years beginning after December 15, 2008 and is applied prospectively.We do not expect the adoption of FSP No. 142-3 to have a material impact on our consolidated results ofoperations or financial condition.
In March 2008, the FASB issued SFAS No. 161, “Disclosures about Derivative Instruments and HedgingActivities—an amendment of FASB Statement No. 133” (SFAS 161). The standard requires additionalquantitative disclosures (provided in tabular form) and qualitative disclosures for derivative instruments. Therequired disclosures include how derivative instruments and related hedged items affect an entity’s financialposition, financial performance, and cash flows; the relative volume of derivative activity; the objectives andstrategies for using derivative instruments; the accounting treatment for those derivative instruments formallydesignated as the hedging instrument in a hedge relationship; and the existence and nature of credit-risk-relatedcontingent features for derivatives. SFAS 161 does not change the accounting treatment for derivativeinstruments. SFAS 161 is effective beginning in the first quarter of fiscal 2010.
In February 2008, the FASB issued FASB Staff Position 157-1, “Application of FASB Statement No. 157 to“FASB Statement No. 13 and Other Accounting Pronouncements That Address Fair Value Measurements forPurposes of Lease Classification or Measurement under Statement 13” (FSP 157-1) and FSP 157-2, “EffectiveDate of FASB Statement No. 157” (FSP 157-2). FSP 157-1 amends SFAS No. 157 to remove certain leasing77transactions from its scope, and was effective upon initial adoption of SFAS No. 157. FSP 157-2 delays theeffective date of SFAS 157 for all non-financial assets and non-financial liabilities, except for items that arerecognized or disclosed at fair value in the financial statements on a recurring basis (at least annually), until thebeginning of the first quarter of fiscal 2010. The adoption of SFAS 157 is not expected to have a significantimpact on our consolidated financial statements when it is applied to non-financial assets and non-financialliabilities that are not measured at fair value on a recurring basis.
In December 2007, the FASB issued SFAS No. 141 (revised 2007), “Business Combinations”(SFAS 141(R)). Under SFAS 141(R), an entity is required to recognize the assets acquired, liabilities assumed,contractual contingencies, and contingent consideration at their fair value on the acquisition date. It furtherrequires that acquisition-related costs be recognized separately from the acquisition and expensed as incurred;that restructuring costs generally be expensed in periods subsequent to the acquisition date; and that changes inaccounting for deferred tax asset valuation allowances and acquired income tax uncertainties after themeasurement period be recognized as a component of provision for taxes. In addition, acquired in-processresearch and development is capitalized as an intangible asset and amortized over its estimated useful life.SFAS 141(R) is effective on a prospective basis for all business combinations for which the acquisition date is onor after the beginning of February 1, 2009, The adoption of SFAS 141(R) is not expected to have a significantimpact on our consolidated financial statements.
52

In December 2007, the FASB issued Statement No. 160, “Non-controlling Interests in ConsolidatedFinancial Statements, an amendment of ARB No. 51” or SFAS 160. The standard changes the accounting fornon-controlling (minority) interests in consolidated financial statements including the requirements to classifynon-controlling interests as a component of consolidated stockholders’ equity, and the elimination of “minorityinterest” accounting in results of operations with earnings attributable to non-controlling interests reported as partof consolidated earnings. Additionally, SFAS 160 revises the accounting for both increases and decreases in aparent’s controlling ownership interest. Should we increase our ownership interest in Salesforce Japan, the costwould be recorded as a reduction of our stockholders’ equity as opposed to accounting for the purchase as a stepacquisition which requires an allocation of the purchase price. SFAS 160 is effective for fiscal years beginningafter December 15, 2008. We believe that the adoption of SFAS 160 will not have a material impact on ourresults of operations and consolidated balance sheet.
ITEM 7A. QUANTITATIVE AND QUALITATIVE DISCLOSURES ABOUTMARKET RISK
Foreign currency exchange risk
Our results of operations and cash flows are subject to fluctuations due to changes in foreign currencyexchange rates, particularly changes in the Euro, British Pound Sterling, Canadian dollar, Japanese Yen andAustralian dollar. We seek to minimize the impact of certain foreign currency fluctuations by hedging certainbalance sheet exposures with foreign currency forward contracts. Any gain or loss from settling these contracts isoffset by the loss or gain derived from the underlying balance sheet exposures. The hedging contracts by policyhave maturities of less than three months. Additionally, by policy, we do not enter into any hedging contracts fortrading or speculative purposes.
Prior to October 31, 2008, our practice was to settle foreign currency contracts prior to each quarter endbecause the maturities of the foreign currency contracts were less than 3 months. We have continued our practiceof entering into foreign currency contracts with maturities less than 3 months. As of January 31, 2009 thecontracts that were not settled are recorded at fair value on the consolidated balance sheet.
Interest rate sensitivity
We had cash, cash equivalents and marketable securities totaling $882.6 million at January 31, 2009. Theseamounts were invested primarily in money market funds and instruments, corporate notes and bonds, governmentsecurities and other debt securities with credit ratings of at least single A or better. The cash, cash equivalentsand short-term marketable securities are held for working capital purposes. Our investments are made for capitalpreservation purposes. We do not enter into investments for trading or speculative purposes.
We account for our investment instruments in accordance with SFAS No. 115, Accounting for Investmentsin Debt and Equity Securities. All of our cash and cash equivalents and marketable securities are treated as“available for sale” under SFAS No. 115. Our marketable securities include corporate notes and obligations, U.S.treasuries, U.S. agency obligations, time deposits, asset-backed securities and money market mutual funds.
Our cash equivalents and our portfolio of marketable securities are subject to market risk due to changes ininterest rates. Fixed rate interest securities may have their market value adversely impacted due to a rise ininterest rates, while floating rate securities may produce less income than expected if interest rates fall. Due inpart to these factors, our future investment income may fall short of expectation due to changes in interest ratesor we may suffer losses in principal if we are forced to sell securities that decline in the market value due tochanges in interest rates. However because we classify our debt securities as “available for sale,” no gains orlosses are recognized due to changes in interest rates unless such securities are sold prior to maturity or declinesin fair value are determined to be other-than-temporary. Our fixed-income portfolio is subject to interest rate risk.An immediate increase or decrease in interest rates of 100-basis points at January 31, 2009 could result in a$2.3 million market value reduction or increase of the same amount. This estimate is based on a sensitivity model
53

that measures market value changes when changes in interest rates occur. Fluctuations in the value of ourinvestment securities caused by a change in interest rates (gains or losses on the carrying value) are recorded inother comprehensive income, and are realized only if we sell the underlying securities.
As previously discussed in “Management’s Discussion and Analysis of Financial Condition and Results ofOperations—Liquidity and Capital Resources,” we have an investment in The Reserve Fund, a money marketmutual fund. While we believe we have the rights to the recovery of our entire investment, we cannot predict theultimate amount that we will receive.
At January 31, 2008, we had cash, cash equivalents and marketable securities totaling $669.8 million. Thefixed-income portfolio was also subject to interest rate risk. Changes in interest rates of 100-basis points wouldhave resulted in market value changes of $3.2 million.
54

ITEM 8. CONSOLIDATED FINANCIAL STATEMENTS AND SUPPLEMENTARY DATA
INDEX TO CONSOLIDATED FINANCIAL STATEMENTS
The following financial statements are filed as part of this Report:
Page No.
Reports of Independent Registered Public Accounting Firm . . . . . . . . . . . . . . . . . . . . . . . . . . . . . . . . . . . 56
Consolidated Balance Sheets as of January 31, 2009 and 2008 . . . . . . . . . . . . . . . . . . . . . . . . . . . . . . . . . 58
Consolidated Statements of Operations for each of the three years in the period ended January 31,2009 . . . . . . . . . . . . . . . . . . . . . . . . . . . . . . . . . . . . . . . . . . . . . . . . . . . . . . . . . . . . . . . . . . . . . . . . . . . . . 59
Consolidated Statements of Stockholders’ Equity for each of the three years in the period endedJanuary 31, 2009 . . . . . . . . . . . . . . . . . . . . . . . . . . . . . . . . . . . . . . . . . . . . . . . . . . . . . . . . . . . . . . . . . . . 60
Consolidated Statements of Cash Flows for each of the three years in the period ended January 31,2009 . . . . . . . . . . . . . . . . . . . . . . . . . . . . . . . . . . . . . . . . . . . . . . . . . . . . . . . . . . . . . . . . . . . . . . . . . . . . . 61
Notes to Consolidated Financial Statements . . . . . . . . . . . . . . . . . . . . . . . . . . . . . . . . . . . . . . . . . . . . . . . . 62
55
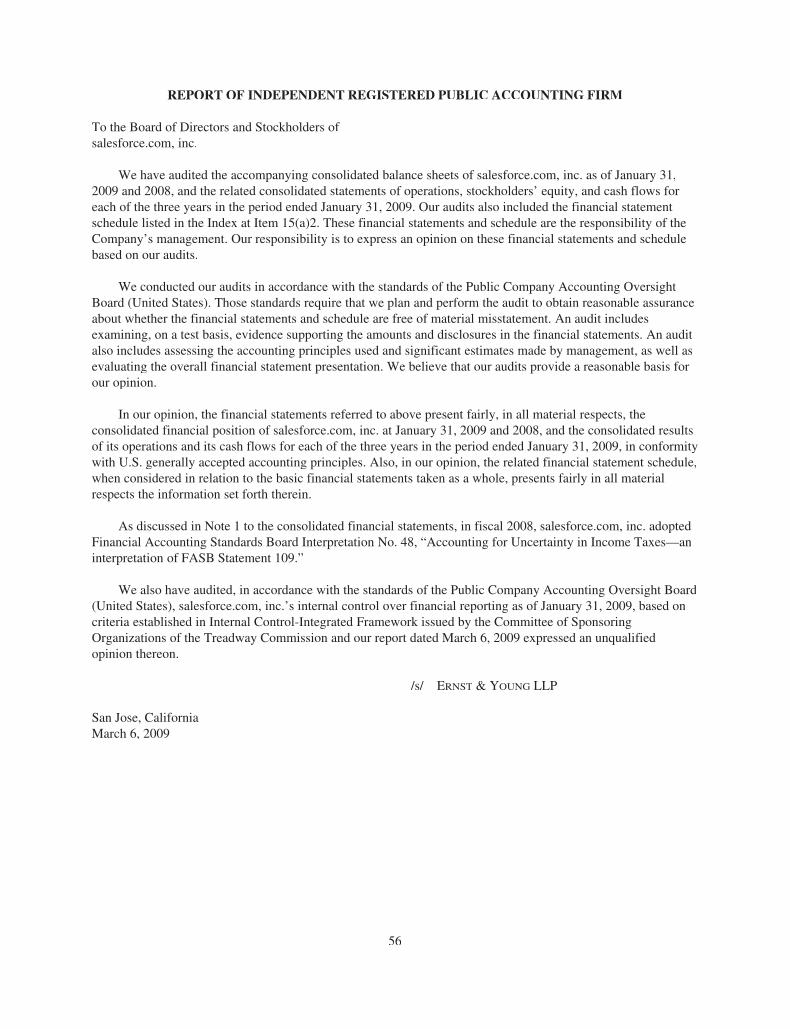
REPORT OF INDEPENDENT REGISTERED PUBLIC ACCOUNTING FIRM
To the Board of Directors and Stockholders ofsalesforce.com, inc.
We have audited the accompanying consolidated balance sheets of salesforce.com, inc. as of January 31,2009 and 2008, and the related consolidated statements of operations, stockholders’ equity, and cash flows foreach of the three years in the period ended January 31, 2009. Our audits also included the financial statementschedule listed in the Index at Item 15(a)2. These financial statements and schedule are the responsibility of theCompany’s management. Our responsibility is to express an opinion on these financial statements and schedulebased on our audits.
We conducted our audits in accordance with the standards of the Public Company Accounting OversightBoard (United States). Those standards require that we plan and perform the audit to obtain reasonable assuranceabout whether the financial statements and schedule are free of material misstatement. An audit includesexamining, on a test basis, evidence supporting the amounts and disclosures in the financial statements. An auditalso includes assessing the accounting principles used and significant estimates made by management, as well asevaluating the overall financial statement presentation. We believe that our audits provide a reasonable basis forour opinion.
In our opinion, the financial statements referred to above present fairly, in all material respects, theconsolidated financial position of salesforce.com, inc. at January 31, 2009 and 2008, and the consolidated resultsof its operations and its cash flows for each of the three years in the period ended January 31, 2009, in conformitywith U.S. generally accepted accounting principles. Also, in our opinion, the related financial statement schedule,when considered in relation to the basic financial statements taken as a whole, presents fairly in all materialrespects the information set forth therein.
As discussed in Note 1 to the consolidated financial statements, in fiscal 2008, salesforce.com, inc. adoptedFinancial Accounting Standards Board Interpretation No. 48, “Accounting for Uncertainty in Income Taxes—aninterpretation of FASB Statement 109.”
We also have audited, in accordance with the standards of the Public Company Accounting Oversight Board(United States), salesforce.com, inc.’s internal control over financial reporting as of January 31, 2009, based oncriteria established in Internal Control-Integrated Framework issued by the Committee of SponsoringOrganizations of the Treadway Commission and our report dated March 6, 2009 expressed an unqualifiedopinion thereon.
/s/ ERNST & YOUNG LLP
San Jose, CaliforniaMarch 6, 2009
56

REPORT OF INDEPENDENT REGISTERED PUBLIC ACCOUNTING FIRM
To the Board of Directors and Stockholders ofsalesforce.com, inc.
We have audited salesforce.com, inc.’s internal control over financial reporting as of January 31, 2009,based on criteria established in Internal Control—Integrated Framework issued by the Committee of SponsoringOrganizations of the Treadway Commission (the COSO criteria). Salesforce.com inc.’s management isresponsible for maintaining effective internal control over financial reporting, and for its assessment of theeffectiveness of internal control over financial reporting included in the accompanying Management’s Report onInternal Control over Financial Reporting. Our responsibility is to express an opinion on the Company’s internalcontrol over financial reporting based on our audit.
We conducted our audit in accordance with the standards of the Public Company Accounting OversightBoard (United States). Those standards require that we plan and perform the audit to obtain reasonable assuranceabout whether effective internal control over financial reporting was maintained in all material respects. Ouraudit included obtaining an understanding of internal control over financial reporting, assessing the risk that amaterial weakness exists, testing and evaluating the design and operating effectiveness of internal control basedon the assessed risk, and performing such other procedures as we considered necessary in the circumstances. Webelieve that our audit provides a reasonable basis for our opinion.
A company’s internal control over financial reporting is a process designed to provide reasonable assuranceregarding the reliability of financial reporting and the preparation of financial statements for external purposes inaccordance with generally accepted accounting principles. A company’s internal control over financial reportingincludes those policies and procedures that (1) pertain to the maintenance of records that, in reasonable detail,accurately and fairly reflect the transactions and dispositions of the assets of the company; (2) provide reasonableassurance that transactions are recorded as necessary to permit preparation of financial statements in accordancewith generally accepted accounting principles, and that receipts and expenditures of the Company are being madeonly in accordance with authorizations of management and directors of the company; and (3) provide reasonableassurance regarding prevention or timely detection of unauthorized acquisition, use, or disposition of thecompany’s assets that could have a material effect on the financial statements.
Because of its inherent limitations, internal control over financial reporting may not prevent or detectmisstatements. Also, projections of any evaluation of effectiveness to future periods are subject to the risk thatcontrols may become inadequate because of changes in conditions, or that the degree of compliance with thepolicies or procedures may deteriorate.
In our opinion, salesforce.com, inc. maintained, in all material respects, effective internal control overfinancial reporting as of January 31, 2009 based on the COSO criteria.
We also have audited, in accordance with the standards of the Public Company Accounting Oversight Board(United States), the consolidated balance sheets of salesforce.com, inc. as of January 31, 2009 and 2008, and therelated consolidated statements of operations, stockholders’ equity, and cash flows for each of the three years inthe period ended January 31, 2009 and our report dated March 6, 2009 expressed an unqualified opinion thereon.
/s/ ERNST & YOUNG LLP
San Jose, CaliforniaMarch 6, 2009
57

salesforce.com, inc.
Consolidated Balance Sheets(in thousands, except share and per share data)
January 31,2009
January 31,2008
AssetsCurrent assets:
Cash and cash equivalents . . . . . . . . . . . . . . . . . . . . . . . . . . . . . . . . . . . . . . . . . . . . $ 483,834 $ 279,095Short-term marketable securities . . . . . . . . . . . . . . . . . . . . . . . . . . . . . . . . . . . . . . . 213,769 171,748Accounts receivable, net of allowance for doubtful accounts of $1,527 and $906at January 31, 2009 and 2008, respectively . . . . . . . . . . . . . . . . . . . . . . . . . . . . 266,555 220,061
Deferred commissions . . . . . . . . . . . . . . . . . . . . . . . . . . . . . . . . . . . . . . . . . . . . . . . 39,384 35,679Deferred income taxes . . . . . . . . . . . . . . . . . . . . . . . . . . . . . . . . . . . . . . . . . . . . . . . 31,900 7,173Prepaid expenses and other current assets . . . . . . . . . . . . . . . . . . . . . . . . . . . . . . . 33,115 27,055
Total current assets . . . . . . . . . . . . . . . . . . . . . . . . . . . . . . . . . . . . . . . . . . . . . . . . . . . . . 1,068,557 740,811Marketable securities, noncurrent . . . . . . . . . . . . . . . . . . . . . . . . . . . . . . . . . . . . . . . . . . 184,962 218,957Fixed assets, net . . . . . . . . . . . . . . . . . . . . . . . . . . . . . . . . . . . . . . . . . . . . . . . . . . . . . . . . 77,027 41,380Deferred commissions, noncurrent . . . . . . . . . . . . . . . . . . . . . . . . . . . . . . . . . . . . . . . . . 17,699 16,435Deferred income taxes, noncurrent . . . . . . . . . . . . . . . . . . . . . . . . . . . . . . . . . . . . . . . . . 26,589 26,512Capitalized software, net . . . . . . . . . . . . . . . . . . . . . . . . . . . . . . . . . . . . . . . . . . . . . . . . . 29,989 23,061Goodwill . . . . . . . . . . . . . . . . . . . . . . . . . . . . . . . . . . . . . . . . . . . . . . . . . . . . . . . . . . . . . 44,872 8,556Other assets, net . . . . . . . . . . . . . . . . . . . . . . . . . . . . . . . . . . . . . . . . . . . . . . . . . . . . . . . . 30,127 13,881
Total assets . . . . . . . . . . . . . . . . . . . . . . . . . . . . . . . . . . . . . . . . . . . . . . . . . . . . . . . . . . . $1,479,822 $1,089,593
Liabilities and stockholders’ equityCurrent liabilities:
Accounts payable . . . . . . . . . . . . . . . . . . . . . . . . . . . . . . . . . . . . . . . . . . . . . . . . . . $ 16,379 $ 7,478Accrued expenses and other current liabilities . . . . . . . . . . . . . . . . . . . . . . . . . . . . 163,205 125,996Income taxes payable . . . . . . . . . . . . . . . . . . . . . . . . . . . . . . . . . . . . . . . . . . . . . . . 3,619 3,622Deferred revenue . . . . . . . . . . . . . . . . . . . . . . . . . . . . . . . . . . . . . . . . . . . . . . . . . . . 583,763 468,821
Total current liabilities . . . . . . . . . . . . . . . . . . . . . . . . . . . . . . . . . . . . . . . . . . . . . . . . . . 766,966 605,917Income taxes payable, noncurrent . . . . . . . . . . . . . . . . . . . . . . . . . . . . . . . . . . . . . . . . . . 12,490 8,465Long-term lease liabilities and other . . . . . . . . . . . . . . . . . . . . . . . . . . . . . . . . . . . . . . . . 7,616 2,136Deferred revenue, noncurrent . . . . . . . . . . . . . . . . . . . . . . . . . . . . . . . . . . . . . . . . . . . . . 10,263 12,073Minority interest . . . . . . . . . . . . . . . . . . . . . . . . . . . . . . . . . . . . . . . . . . . . . . . . . . . . . . . 10,703 8,943
Total liabilities . . . . . . . . . . . . . . . . . . . . . . . . . . . . . . . . . . . . . . . . . . . . . . . . . . . . . . . . 808,038 637,534Commitments and contingencies (Note 8)Stockholders’ equity:
Preferred stock, $0.001 par value; 5,000,000 shares authorized and noneoutstanding at January 31, 2009 and 2008 . . . . . . . . . . . . . . . . . . . . . . . . . . . . . — —
Common stock, $0.001 par value; 400,000,000 shares authorized, 122,850,062and 119,305,013 issued and outstanding at January 31, 2009 and 2008,respectively . . . . . . . . . . . . . . . . . . . . . . . . . . . . . . . . . . . . . . . . . . . . . . . . . . . . . 123 119
Additional paid-in capital . . . . . . . . . . . . . . . . . . . . . . . . . . . . . . . . . . . . . . . . . . . . 648,724 471,802Accumulated other comprehensive loss . . . . . . . . . . . . . . . . . . . . . . . . . . . . . . . . . (2,905) (2,276)Retained earnings (deficit) . . . . . . . . . . . . . . . . . . . . . . . . . . . . . . . . . . . . . . . . . . . 25,842 (17,586)
Total stockholders’ equity . . . . . . . . . . . . . . . . . . . . . . . . . . . . . . . . . . . . . . . . . . . . . . . . 671,784 452,059
Total liabilities and stockholders’ equity . . . . . . . . . . . . . . . . . . . . . . . . . . . . . . . . . . . . $1,479,822 $1,089,593
See accompanying Notes to Consolidated Financial Statements.
58
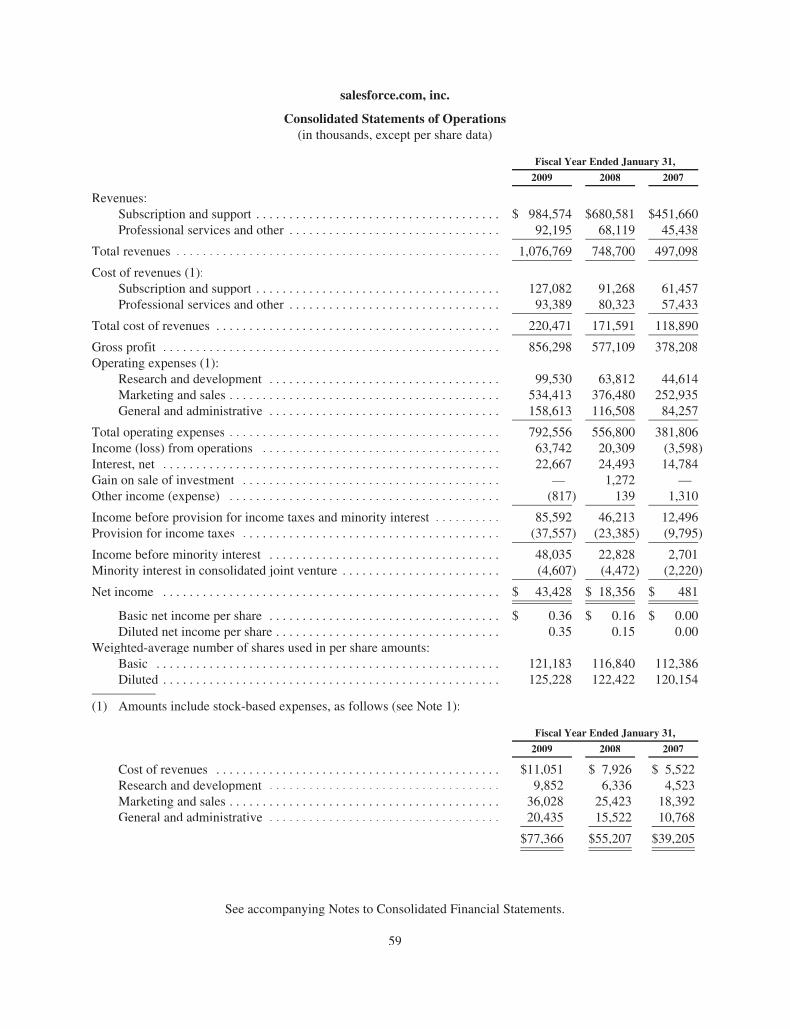
salesforce.com, inc.
Consolidated Statements of Operations(in thousands, except per share data)
Fiscal Year Ended January 31,
2009 2008 2007
Revenues:Subscription and support . . . . . . . . . . . . . . . . . . . . . . . . . . . . . . . . . . . . . $ 984,574 $680,581 $451,660Professional services and other . . . . . . . . . . . . . . . . . . . . . . . . . . . . . . . . 92,195 68,119 45,438
Total revenues . . . . . . . . . . . . . . . . . . . . . . . . . . . . . . . . . . . . . . . . . . . . . . . . . 1,076,769 748,700 497,098
Cost of revenues (1):Subscription and support . . . . . . . . . . . . . . . . . . . . . . . . . . . . . . . . . . . . . 127,082 91,268 61,457Professional services and other . . . . . . . . . . . . . . . . . . . . . . . . . . . . . . . . 93,389 80,323 57,433
Total cost of revenues . . . . . . . . . . . . . . . . . . . . . . . . . . . . . . . . . . . . . . . . . . . 220,471 171,591 118,890
Gross profit . . . . . . . . . . . . . . . . . . . . . . . . . . . . . . . . . . . . . . . . . . . . . . . . . . . 856,298 577,109 378,208Operating expenses (1):
Research and development . . . . . . . . . . . . . . . . . . . . . . . . . . . . . . . . . . . 99,530 63,812 44,614Marketing and sales . . . . . . . . . . . . . . . . . . . . . . . . . . . . . . . . . . . . . . . . . 534,413 376,480 252,935General and administrative . . . . . . . . . . . . . . . . . . . . . . . . . . . . . . . . . . . 158,613 116,508 84,257
Total operating expenses . . . . . . . . . . . . . . . . . . . . . . . . . . . . . . . . . . . . . . . . . 792,556 556,800 381,806Income (loss) from operations . . . . . . . . . . . . . . . . . . . . . . . . . . . . . . . . . . . . 63,742 20,309 (3,598)Interest, net . . . . . . . . . . . . . . . . . . . . . . . . . . . . . . . . . . . . . . . . . . . . . . . . . . . 22,667 24,493 14,784Gain on sale of investment . . . . . . . . . . . . . . . . . . . . . . . . . . . . . . . . . . . . . . . — 1,272 —Other income (expense) . . . . . . . . . . . . . . . . . . . . . . . . . . . . . . . . . . . . . . . . . (817) 139 1,310
Income before provision for income taxes and minority interest . . . . . . . . . . 85,592 46,213 12,496Provision for income taxes . . . . . . . . . . . . . . . . . . . . . . . . . . . . . . . . . . . . . . . (37,557) (23,385) (9,795)
Income before minority interest . . . . . . . . . . . . . . . . . . . . . . . . . . . . . . . . . . . 48,035 22,828 2,701Minority interest in consolidated joint venture . . . . . . . . . . . . . . . . . . . . . . . . (4,607) (4,472) (2,220)
Net income . . . . . . . . . . . . . . . . . . . . . . . . . . . . . . . . . . . . . . . . . . . . . . . . . . . $ 43,428 $ 18,356 $ 481
Basic net income per share . . . . . . . . . . . . . . . . . . . . . . . . . . . . . . . . . . . $ 0.36 $ 0.16 $ 0.00Diluted net income per share . . . . . . . . . . . . . . . . . . . . . . . . . . . . . . . . . . 0.35 0.15 0.00
Weighted-average number of shares used in per share amounts:Basic . . . . . . . . . . . . . . . . . . . . . . . . . . . . . . . . . . . . . . . . . . . . . . . . . . . . 121,183 116,840 112,386Diluted . . . . . . . . . . . . . . . . . . . . . . . . . . . . . . . . . . . . . . . . . . . . . . . . . . . 125,228 122,422 120,154
(1) Amounts include stock-based expenses, as follows (see Note 1):
Fiscal Year Ended January 31,
2009 2008 2007
Cost of revenues . . . . . . . . . . . . . . . . . . . . . . . . . . . . . . . . . . . . . . . . . . . $11,051 $ 7,926 $ 5,522Research and development . . . . . . . . . . . . . . . . . . . . . . . . . . . . . . . . . . . 9,852 6,336 4,523Marketing and sales . . . . . . . . . . . . . . . . . . . . . . . . . . . . . . . . . . . . . . . . . 36,028 25,423 18,392General and administrative . . . . . . . . . . . . . . . . . . . . . . . . . . . . . . . . . . . 20,435 15,522 10,768
$77,366 $55,207 $39,205
See accompanying Notes to Consolidated Financial Statements.
59

salesforce.com
,inc.
Con
solid
ated
Statem
entsof
Stockh
olders’Equ
ity
(inthousands,except
sharedata)
Com
mon
Stock
Add
itiona
lPaid-in
Cap
ital
Deferred
Stock-Based
Com
pensation
Accum
ulated
Other
Com
prehensive
Loss
Retained
Earning
s(D
eficit)
Total
Stockh
olders’
Equ
ity
Shares
Amou
nt
BalancesatJanuary31,2006
..................
.........................
110,513,576
$111
$237,010
$(2,531)
$(2,105)
$(36,114)
$196,371
Reclassificationof
deferred
compensationresulting
from
theadoptio
nof
SFAS12
3R............................
.........................
——
(2,531)
2,531
——
—Exerciseof
stockoptio
ns,w
arrantsandstockgrantsto
boardmem
bersforboard
services
........................................................
4,032,132
429,691
——
—29,695
Tax
benefitsfrom
employee
stockplans.................................
——
16,480
——
—16,480
Stock-basedexpenses
...............................................
——
38,858
——
—38,858
Repurchaseof
unvested
shares
........................................
(8,148)
—(12)
——
—(12)
Com
ponentsof
comprehensive
income,neto
ftax:
Foreigncurrency
translationadjustment...............................
——
——
(842)
—(842)
Unrealized
gain
onmarketablesecuritiesandcash
equivalents.............
——
——
760
—760
Netincome
.....................................................
——
——
—481
481
Totalcomprehensive
income,year
endedJanuary31,2007....................
——
——
——
399
BalancesatJanuary31,2007
..................
.........................
114,537,560
$115
$319,496
$—
$(2,187)
$(35,633)
$281,791
Exerciseof
stockoptio
ns,w
arrantsandstockgrantsto
boardmem
bersforboard
services
................................
........................
4,533,418
463,192
——
—63,196
Vestedrestricted
stockunits
convertedto
shares
..........................
234,035
——
——
——
Tax
benefitsfrom
employee
stockplans........
.........................
——
34,847
——
—34,847
Stock-basedexpenses
...............................................
——
54,267
——
—54
,267
Com
ponentsof
comprehensive
income,neto
ftax:
Foreigncurrency
translationadjustmentand
other.......................
——
——
(2,753)
—(2,753)
Unrealized
gain
onmarketablesecuritiesandcash
equivalents.............
——
——
2,664
—2,664
Netincome
.....................................................
——
——
—18,356
18,356
Totalcomprehensive
income,year
endedJanuary31,2008....................
——
——
——
18,267
Adjustm
enttoretained
earnings
upon
adoptio
nof
FIN48
...................
(309)
(309)
BalancesatJanuary31,200
8..................
.........................
119,305,013
$119
$471,802
$—
$(2,276)
$(17,586)
$452,059
Exerciseof
stockoptio
nsandstockgrantsto
boardmem
bersforboard
services
................................
........................
3,009,276
445,903
——
—45,907
Vestedrestricted
stockunits
convertedto
shares
..........................
535,773
——
——
——
Tax
benefitsfrom
employee
stockplans........
.........................
——
55,421
——
—55,421
Stock-basedexpenses
...............................................
——
75,598
——
—75,598
Com
ponentsof
comprehensive
income,neto
ftax:
Forei gncurrency
translationadjustmentand
other.......................
——
——
260
—260
Unrealized
loss
onmarketablesecuritiesandcash
equivalents
.............
——
——
(889)
—(889)
Netincome
.....................................................
——
——
—43,428
43,428
Totalcomprehensive
income,year
endedJanuary31,2009....................
——
——
——
42,799
BalancesatJanuary31,2009
..................
.........................
122,850,062
$123
$648,724
$—
$(2,905)
$25,842
$671,784
SeeaccompanyingNotes
toConsolid
ated
FinancialS
tatements.
60
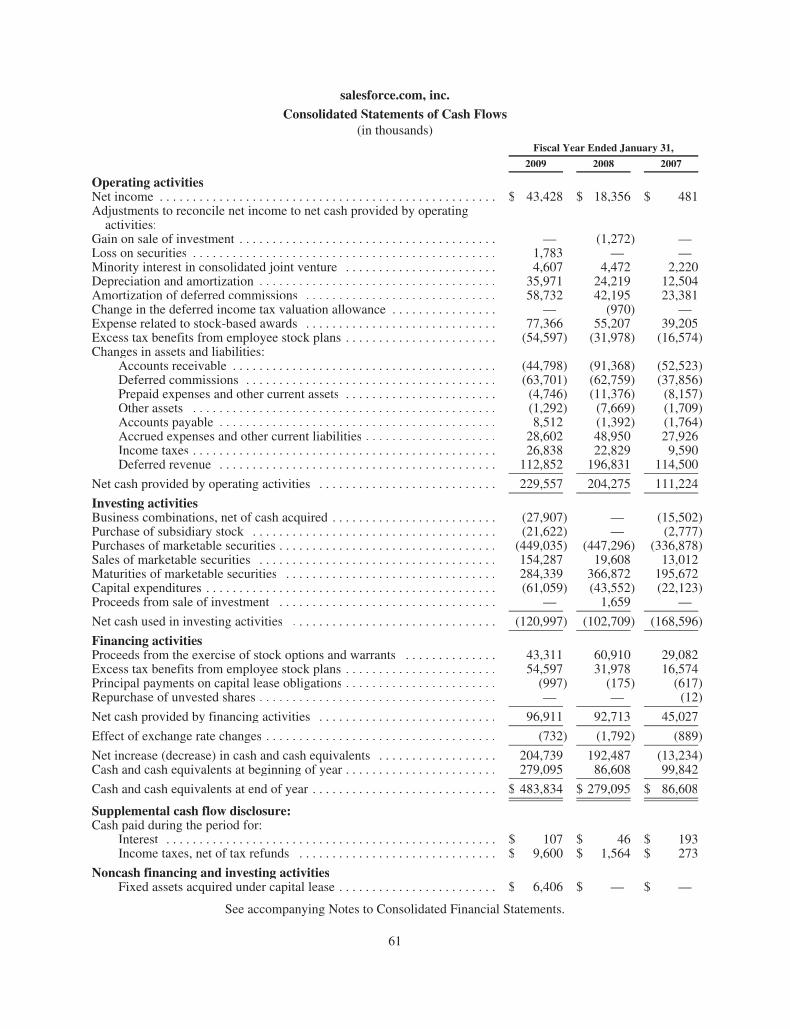
salesforce.com, inc.Consolidated Statements of Cash Flows
(in thousands)Fiscal Year Ended January 31,
2009 2008 2007
Operating activitiesNet income . . . . . . . . . . . . . . . . . . . . . . . . . . . . . . . . . . . . . . . . . . . . . . . . . . . $ 43,428 $ 18,356 $ 481Adjustments to reconcile net income to net cash provided by operatingactivities:
Gain on sale of investment . . . . . . . . . . . . . . . . . . . . . . . . . . . . . . . . . . . . . . . — (1,272) —Loss on securities . . . . . . . . . . . . . . . . . . . . . . . . . . . . . . . . . . . . . . . . . . . . . . 1,783 — —Minority interest in consolidated joint venture . . . . . . . . . . . . . . . . . . . . . . . 4,607 4,472 2,220Depreciation and amortization . . . . . . . . . . . . . . . . . . . . . . . . . . . . . . . . . . . . 35,971 24,219 12,504Amortization of deferred commissions . . . . . . . . . . . . . . . . . . . . . . . . . . . . . 58,732 42,195 23,381Change in the deferred income tax valuation allowance . . . . . . . . . . . . . . . . — (970) —Expense related to stock-based awards . . . . . . . . . . . . . . . . . . . . . . . . . . . . . 77,366 55,207 39,205Excess tax benefits from employee stock plans . . . . . . . . . . . . . . . . . . . . . . . (54,597) (31,978) (16,574)Changes in assets and liabilities:
Accounts receivable . . . . . . . . . . . . . . . . . . . . . . . . . . . . . . . . . . . . . . . . (44,798) (91,368) (52,523)Deferred commissions . . . . . . . . . . . . . . . . . . . . . . . . . . . . . . . . . . . . . . (63,701) (62,759) (37,856)Prepaid expenses and other current assets . . . . . . . . . . . . . . . . . . . . . . . (4,746) (11,376) (8,157)Other assets . . . . . . . . . . . . . . . . . . . . . . . . . . . . . . . . . . . . . . . . . . . . . . (1,292) (7,669) (1,709)Accounts payable . . . . . . . . . . . . . . . . . . . . . . . . . . . . . . . . . . . . . . . . . . 8,512 (1,392) (1,764)Accrued expenses and other current liabilities . . . . . . . . . . . . . . . . . . . . 28,602 48,950 27,926Income taxes . . . . . . . . . . . . . . . . . . . . . . . . . . . . . . . . . . . . . . . . . . . . . . 26,838 22,829 9,590Deferred revenue . . . . . . . . . . . . . . . . . . . . . . . . . . . . . . . . . . . . . . . . . . 112,852 196,831 114,500
Net cash provided by operating activities . . . . . . . . . . . . . . . . . . . . . . . . . . . 229,557 204,275 111,224
Investing activitiesBusiness combinations, net of cash acquired . . . . . . . . . . . . . . . . . . . . . . . . . (27,907) — (15,502)Purchase of subsidiary stock . . . . . . . . . . . . . . . . . . . . . . . . . . . . . . . . . . . . . (21,622) — (2,777)Purchases of marketable securities . . . . . . . . . . . . . . . . . . . . . . . . . . . . . . . . . (449,035) (447,296) (336,878)Sales of marketable securities . . . . . . . . . . . . . . . . . . . . . . . . . . . . . . . . . . . . 154,287 19,608 13,012Maturities of marketable securities . . . . . . . . . . . . . . . . . . . . . . . . . . . . . . . . 284,339 366,872 195,672Capital expenditures . . . . . . . . . . . . . . . . . . . . . . . . . . . . . . . . . . . . . . . . . . . . (61,059) (43,552) (22,123)Proceeds from sale of investment . . . . . . . . . . . . . . . . . . . . . . . . . . . . . . . . . — 1,659 —
Net cash used in investing activities . . . . . . . . . . . . . . . . . . . . . . . . . . . . . . . (120,997) (102,709) (168,596)
Financing activitiesProceeds from the exercise of stock options and warrants . . . . . . . . . . . . . . 43,311 60,910 29,082Excess tax benefits from employee stock plans . . . . . . . . . . . . . . . . . . . . . . . 54,597 31,978 16,574Principal payments on capital lease obligations . . . . . . . . . . . . . . . . . . . . . . . (997) (175) (617)Repurchase of unvested shares . . . . . . . . . . . . . . . . . . . . . . . . . . . . . . . . . . . . — — (12)
Net cash provided by financing activities . . . . . . . . . . . . . . . . . . . . . . . . . . . 96,911 92,713 45,027
Effect of exchange rate changes . . . . . . . . . . . . . . . . . . . . . . . . . . . . . . . . . . . (732) (1,792) (889)
Net increase (decrease) in cash and cash equivalents . . . . . . . . . . . . . . . . . . 204,739 192,487 (13,234)Cash and cash equivalents at beginning of year . . . . . . . . . . . . . . . . . . . . . . . 279,095 86,608 99,842
Cash and cash equivalents at end of year . . . . . . . . . . . . . . . . . . . . . . . . . . . . $ 483,834 $ 279,095 $ 86,608
Supplemental cash flow disclosure:Cash paid during the period for:
Interest . . . . . . . . . . . . . . . . . . . . . . . . . . . . . . . . . . . . . . . . . . . . . . . . . . $ 107 $ 46 $ 193Income taxes, net of tax refunds . . . . . . . . . . . . . . . . . . . . . . . . . . . . . . $ 9,600 $ 1,564 $ 273
Noncash financing and investing activitiesFixed assets acquired under capital lease . . . . . . . . . . . . . . . . . . . . . . . . $ 6,406 $ — $ —
See accompanying Notes to Consolidated Financial Statements.
61

salesforce.com, inc.
Notes to Consolidated Financial Statements
1. Summary of Business and Significant Accounting Policies
Description of Business
Salesforce.com, inc. (the “Company”) is the leading provider, based on revenue and market share, ofsoftware on demand, according to a July 2008 report by International Data Corporation. The Company provides acomprehensive customer relationship management (“CRM”) service to businesses of all sizes and industriesworldwide and provides a technology platform for customers and developers to build and run applications. TheCompany offers its services on a subscription basis.
Fiscal Year
The Company’s fiscal year ends on January 31. References to fiscal 2009, for example, refer to the fiscalyear ending January 31, 2009.
Use of Estimates
The preparation of financial statements in conformity with U.S. GAAP requires management to makeestimates and assumptions in the Company’s consolidated financial statements and notes thereto.
Significant estimates and assumptions made by management include the determination of the provision forincome taxes, whether an other-than-temporary decline has occurred in the fair value of certain investments inmarketable securities, the fair value of stock awards issued and the allocation of the purchase price paid foracquisitions. Actual results could differ from those estimates.
Principles of Consolidation
The consolidated financial statements include the accounts of the Company and its wholly ownedsubsidiaries. All significant intercompany balances and transactions have been eliminated in consolidation.Additionally, the Company holds a majority interest in Kabushiki Kaisha salesforce.com (“Salesforce Japan”), aJapanese joint venture. As of January 31, 2009, the Company owned a 72 percent interest in the joint venture.Given the Company’s majority ownership interest in the joint venture, the accounts of the joint venture have beenconsolidated with the accounts of the Company, and a minority interest has been recorded for the minorityinvestors’ interests in the net assets and operations of the joint venture to the extent of the minority investors’individual investments.
Segments
The Company operates in one segment.
Foreign Currency Translation
The functional currency of the Company’s major foreign subsidiaries is generally the local currency. Forexample, the functional currency for the Company’s subsidiaries in Europe is the Euro. Adjustments resultingfrom translating foreign functional currency financial statements into U.S. dollars are recorded as part of aseparate component of stockholders’ equity. Foreign currency transaction gains and losses are included in netincome for the period. All assets and liabilities denominated in a foreign currency are translated into U.S. dollarsat the exchange rate on the balance sheet date. Revenues and expenses are translated at the average exchange rateduring the period. Equity transactions are translated using historical exchange rates.
62

salesforce.com, inc.
Notes to Consolidated Financial Statements—(Continued)
Concentrations of Credit Risk and Significant Customers
The Company’s financial instruments that are exposed to concentrations of credit risk consist primarily ofcash and cash equivalents, marketable securities and trade accounts receivable. Although the Company depositsits cash with multiple financial institutions, its deposits, at times, may exceed federally insured limits. Collateralis not required for accounts receivable. The Company maintains an allowance for doubtful accounts receivablebalances. The allowance is based upon historical loss patterns, the number of days that billings are past due andan evaluation of the potential risk of loss associated with delinquent accounts.
No customer accounted for more than 5 percent of accounts receivable at January 31, 2009 and 2008. Nosingle customer accounted for 5 percent or more of total revenue during fiscal 2009, 2008 and 2007.
As of January 31, 2009 and 2008, assets located outside the Americas were 14 percent of total assets.Revenues by geographical region are as follows (in thousands):
Fiscal Year Ended January 31,
2009 2008 2007
Revenues by geography:Americas . . . . . . . . . . . . . . . . . . . . . . . . . . . . . . . . . . . . . . . . . . $ 776,495 $557,976 $387,570Europe . . . . . . . . . . . . . . . . . . . . . . . . . . . . . . . . . . . . . . . . . . . . 190,685 127,010 75,026Asia Pacific . . . . . . . . . . . . . . . . . . . . . . . . . . . . . . . . . . . . . . . . 109,589 63,714 34,502
$1,076,769 $748,700 $497,098
Cash and Cash Equivalents
The Company considers all highly liquid investments purchased with an original maturity of three monthsor less to be cash equivalents. Cash and cash equivalents are at fair value.
Marketable Securities
Management determines the appropriate classification of investments in marketable securities at the time ofpurchase in accordance with Statement of Financial Accounting Standards No. 115, Accounting for CertainInvestments in Debt and Equity Securities, and reevaluates such determination at each balance sheet date. Exceptfor the money market mutual fund described below, securities are classified as available for sale and are carriedat fair value, with the unrealized gains and losses, net of tax, reported as a separate component of stockholders’equity. Fair value is determined based on quoted market rates when observable or utilizing data points that areobservable such as quoted prices, interest rates and yield curves. Declines in fair value judged to be other-than-temporary on securities available for sale are included as a component of interest, net. The cost of securities soldis based on the specific-identification method. Interest on securities classified as available for sale is alsoincluded as a component of interest, net. In order to determine whether a decline in value is other-than-temporary, we evaluate, among other factors: the duration and extent to which the fair value has been less thanthe carrying value, our financial condition and business outlook, including key operational and cash flow metrics,current market conditions and our intent and ability to retain the investment for a period of time sufficient toallow for any anticipated recovery in fair market value.
Fair Value of Financial Instruments
Effective February 1, 2008, the Company implemented Statement of Financial Accounting StandardsNo. 157, Fair Value Measurement, or SFAS 157, for its financial assets and liabilities that are re-measured and
63

salesforce.com, inc.
Notes to Consolidated Financial Statements—(Continued)
reported at fair value at each reporting period, and non-financial assets and liabilities that are re-measured andreported at fair value at least annually. In accordance with the provisions of FASB Staff Position No. 157-2,Effective Date of FASB Statement No. 157, the Company has elected to defer implementation of SFAS 157 as itrelates to its non-financial assets and non-financial liabilities until February 1, 2009. The Company is evaluatingthe impact, if any, this standard will have. In October 2008, the FASB issued FSB SFAS 157-3, Determining theFair Value of a Financial Asset when the Market for that Asset is Not Active (“FSB 157-3”), to clarify how anentity would determine fair value in an inactive market. The Company implemented FSB 157-3 in October 2008.
In accordance with SFAS 157, the Company measures its cash equivalents, marketable securities andforeign currency derivative contracts at fair value. A majority of the Company’s cash equivalents and itsmarketable securities are classified within Level 1 or Level 2, which are described below. This is because theCompany’s cash equivalents and marketable securities are valued using quoted market prices or alternativepricing sources and models utilizing market observable inputs.
A portion of the Company’s money market mutual funds are classified within Level 3, described below,because they are invested in The Reserve Primary Fund (“The Reserve Fund”). At January 31, 2009 theCompany’s investment portfolio included $19.5 million invested in The Reserve Fund with an estimated fairvalue of $18.3 million. During the year ended January 31, 2009, the Company recorded a $1.2 million lossrelated to this decline in fair value that is considered other-than-temporary. This loss is included in interest, neton the consolidated statements of operations. Therefore, the Company has recorded the aforementioned other-than-temporary loss. Additionally, the Company reclassified its investment from cash and cash equivalents tomarketable securities on the Company’s consolidated balance sheet as of January 31, 2009. Subsequent toJanuary 31, 2009 the Company recovered $6.1 million of its investment as a result of a partial redemption fromThe Reserve Fund.
On February 26, 2009, The Reserve Fund announced its decision to initially set aside $3.5 billion in aspecial reserve under the plan of liquidation, to cover potential liabilities for damages and associated expensesrelated to lawsuits and regulatory actions against the fund. The special reserve may be increased or decreased asfurther information becomes available. As a result, pursuant to the liquidation plan, interim distributions willcontinue to be made up to 91.72 percent, unless The Reserve Fund determines a need to increase the specialreserve. Amounts in the special reserve will be distributed to shareholders once claims, if any are successful, andthe related expenses have been paid or set aside for payment. The determination of the total redemption to theCompany is subject to the distribution available to all investors of the fund. While the Company believes it hasthe right to recovery of its entire remaining investment, the Company cannot predict the ultimate amount theCompany will receive.
The Company’s foreign currency derivative contracts are classified within Level 2 as the valuation inputsare based on quoted prices and market observable data of similar instruments in inactive markets.
SFAS 157 establishes a three-tier value hierarchy, which prioritizes the inputs used in the valuationmethodologies in measuring fair value:
Level 1. Observable inputs that reflect quoted prices (unadjusted) for identical assets orliabilities in active markets.
Level 2. Include other inputs that are directly or indirectly observable in the marketplace.
Level 3. Unobservable inputs which are supported by little or no market activity.
The Company conducted its fair value assessment of The Reserve Fund using Level 3 inputs. Managementhas reviewed the Reserve’s underlying securities portfolio which is substantially comprised of discount notes,
64

salesforce.com, inc.
Notes to Consolidated Financial Statements—(Continued)
certificates of deposit and commercial paper issued by highly-rated institutions. Management also evaluated the fairvalue of its ownership in The Reserve Fund, considering risk of extended timing and other factors. The assumptionof timing for the actual repayment of the Company’s ownership from The Reserve Fund is inherently subjective andinvolves significant management judgment. For the Company’s investments in privately-held companiesmanagement evaluated financial results, earnings trends, and subsequent financing of these companies, as well asgeneral market conditions to determine fair value. As a result, the Company classified its ownership in The ReserveFund and investments in privately-held companies within Level 3 of the fair value hierarchy.
The following table presents information about the Company’s assets that are measured at fair value on arecurring basis as of January 31, 2009 and indicates the fair value hierarchy of the valuation (in thousands):
Description
Quoted Prices inActive Markets
for Identical Assets(Level 1)
Significant OtherObservable
Inputs(Level 2)
SignificantUnobservable
Inputs(Level 3)
Balances as ofJanuary 31, 2009
Cash equivalents (1):Time deposits . . . . . . . . . . . . . . . . . . . . . $ 402 $ — $ — $ 402Money market mutual funds . . . . . . . . . . 279,246 — — 279,246Corporate notes and obligations . . . . . . . — 7,990 — 7,990U.S. agency obligations . . . . . . . . . . . . . — 87,852 — 87,852
Marketable securities:Corporate notes and obligations . . . . . . . — 215,140 — 215,140U.S. agency obligations . . . . . . . . . . . . . — 165,297 — 165,297Money market mutual fund . . . . . . . . . . . — — 18,294 18,294
Foreign currency derivative contracts (2) . . . . — 1,054 — 1,054Investments in privately-heldcompanies (3) . . . . . . . . . . . . . . . . . . . . . . . — — 2,400 2,400
Total Assets . . . . . . . . . . . . . . . . . . . . . . . . . . . $279,648 $477,333 $20,694 $777,675
LiabilitiesForeign currency derivative contracts (4) . . . . $ — $ 2,058 $ — $ 2,058
Total Liabilities . . . . . . . . . . . . . . . . . . . . . . . . $ — $ 2,058 $ — $ 2,058
(1) Included in “cash and cash equivalents” in the accompanying Consolidated Balance Sheet as of January 31,2009, in addition to $108,344 of cash.
(2) Included in “prepaid expenses and other current assets” in the accompanying Consolidated Balance Sheet asof January 31, 2009.
(3) Included in “other assets, net” in the accompanying Consolidated Balance Sheet as of January 31, 2009.(4) Included in “accrued expenses and other current liabilities” in the accompanying Consolidated Balance
Sheet as of January 31, 2009.
The following table presents the Company’s assets measured at fair value using significant unobservableinputs (Level 3) at January 31, 2009. These assets consist of the Company’s investment in The Reserve Fund andInvestments in privately-held companies (in thousands):
Balance at February 1, 2008 . . . . . . . . . . . . . . . . . . . . . . . . . . . . . . . . . . . . . . . . . . $ 500Transfers to Level 3 . . . . . . . . . . . . . . . . . . . . . . . . . . . . . . . . . . . . . . . . . . . . . . . . 47,026Realized loss included in Interest, net . . . . . . . . . . . . . . . . . . . . . . . . . . . . . . . . . . (1,204)Redemptions . . . . . . . . . . . . . . . . . . . . . . . . . . . . . . . . . . . . . . . . . . . . . . . . . . . . . . (25,628)
Balance at January 31, 2009 . . . . . . . . . . . . . . . . . . . . . . . . . . . . . . . . . . . . . . . . . . $ 20,694
65

salesforce.com, inc.
Notes to Consolidated Financial Statements—(Continued)
Derivative Financial Instruments
The Company has operated a hedging program for the past three years to manage its short-term exposure tofluctuations in foreign currency exchange rates, which exist as part of ongoing business operations. TheCompany enters into foreign currency contracts with financial institutions to reduce the risk that its cash flowsand earnings will be adversely affected by foreign currency exchange rate fluctuations. The Company usesforward contracts to hedge a majority of transaction exposures denominated in Euros, Swiss francs, Australiandollars, Singapore dollars, Japanese yen and British pounds. The Company’s program is not designated fortrading or speculative purposes. Prior to October 31, 2008 it had been the Company’s practice to settle foreigncurrency contracts prior to each quarter end because the maturities of the foreign currency contracts were lessthan 3 months. The Company continues its practice of entering into foreign currency contracts with maturitiesless than three months. As of January 31, 2009 the contracts that were not settled are recorded at fair value on theconsolidated balance sheet.
The Company’s foreign currency forward contracts, which are not designated as hedging instruments underFASB Statement No. 133, Accounting for Derivative Instruments and Hedging Activities, or SFAS 133, are usedto reduce the exchange rate risk associated primarily with intercompany receivables and payables. Forwardcontracts are marked-to-market at the end of each reporting period with gains and losses recognized as otherincome (expense) to offset the gains or losses resulting from the settlement of the underlying foreign currencydenominated receivables and payables. While the contract or notional amount is often used to express the volumeof foreign exchange contracts, the amounts potentially subject to credit risk are generally limited to the amounts,if any, by which the counterparties’ obligations under the agreements exceed the obligations of the Company tothe counterparties.
Details on outstanding forward contracts related primarily to intercompany receivables and payables arepresented below (in thousands):
January 31,2009
January 31,2008
Notional amount of foreign currency forward contracts . . . . . . . . . . . . . . . . $158,704 $—Fair value of foreign currency forward contracts . . . . . . . . . . . . . . . . . . . . . . (1,004) —
Interest, net
The components of Interest, net are presented below (in thousands):
Fiscal Year Ended January 31,
(in thousands) 2009 2008 2007
Interest income . . . . . . . . . . . . . . . . . . . . . . . . . . . . . . . . . . . . . . . . . . $24,188 $24,666 $14,779Realized gains . . . . . . . . . . . . . . . . . . . . . . . . . . . . . . . . . . . . . . . . . . 1,048 — 5Realized losses . . . . . . . . . . . . . . . . . . . . . . . . . . . . . . . . . . . . . . . . . . (2,569) (173) —
Total interest, net . . . . . . . . . . . . . . . . . . . . . . . . . . . . . . . . . . . . . . . . $22,667 $24,493 $14,784
Fixed Assets
Fixed assets are stated at cost. Depreciation is calculated on a straight-line basis over the estimated usefullives of those assets as follows:
Computers, equipment, and software . . . . . . 3 to 5 yearsFurniture and fixtures . . . . . . . . . . . . . . . . . . 5 to 7 yearsLeasehold improvements . . . . . . . . . . . . . . . Shorter of the estimated useful life or the lease term
66

salesforce.com, inc.
Notes to Consolidated Financial Statements—(Continued)
When assets are retired, the cost and accumulated depreciation and amortization are removed from theirrespective accounts and any loss on such retirement is reflected in operating expenses. When assets are otherwisedisposed of, the cost and related accumulated depreciation and amortization are removed from their respectiveaccounts and any gain or loss on such sale or disposal is reflected in other income.
Impairment of Long-Lived Assets
The Company evaluates the recoverability of its long-lived assets in accordance with SFAS No. 144,Accounting for the Impairment or Disposal of Long-Lived Assets (“SFAS 144”). Long-lived assets are reviewedfor possible impairment whenever events or circumstances indicate that the carrying amount of such assets maynot be recoverable. If such review indicates that the carrying amount of long-lived assets is not recoverable, thecarrying amount of such assets is reduced to fair value.
In addition to the recoverability assessment, the Company routinely reviews the remaining estimated lives ofits long-lived assets. Any reduction in the useful life assumption will result in increased depreciation andamortization expense in the period when such determinations are made, as well as in subsequent periods. There wasno impairment of long-lived assets during fiscal 2009 and 2008. The Company evaluates the recoverability of thegoodwill in accordance with SFAS No. 142, Goodwill and Other Intangible Assets (“SFAS 142”). The Companytests the balance for impairment annually in the fourth quarter or more often if and when circumstances indicate thatgoodwill may not be recoverable. There was no impairment of goodwill during fiscal 2009 and 2008.
Capitalized Software Costs
For website development costs and the development costs related to the Company’s enterprise cloudcomputing application service, the Company follows the guidance of Emerging Issues Task Force (“EITF”) IssueNo. 00-2, Accounting for Web Site Development Costs (“EITF 00-2”), and EITF Issue No. 00-3, Application ofAICPA Statement of Position 97-2 to Arrangements That Include the Right to Use Software Stored on AnotherEntity’s Hardware (“EITF 00-3”). EITF 00-2 sets forth the accounting for website development costs based onthe website development activity. EITF 00-3 sets forth the accounting for software in a hosting arrangement. Assuch, the Company follows the guidance set forth in Statement of Position 98-1, Accounting for the Cost ofComputer Software Developed or Obtained for Internal Use (“SOP 98-1”), in accounting for the development ofits application service. Additionally, the Company follows the guidance in SOP 98-1 for costs incurred forcomputer software developed or obtained for internal use. SOP 98-1 requires companies to capitalize qualifyingcomputer software costs, which are incurred during the application development stage. Costs related topreliminary project activities and post-implementation activities are expensed as incurred.
The Company capitalized $10.2 million, $11.1 million and $4.8 million of costs during fiscal 2009, 2008and 2007, respectively. Amortization expense totaled $6.6 million, $2.7 million, and $0.8 million during fiscal2009, 2008 and 2007, respectively. These capitalized costs are amortized on a straight line basis over theexpected useful life of the software, which is three years.
Comprehensive Income and Accumulated Other Comprehensive Loss
Comprehensive income consists of net income and other comprehensive income, which includes certainchanges in equity that is excluded from net income. Specifically, cumulative foreign currency translation andunrealized gains and losses on marketable securities and cash equivalents, net of taxes of $0.6 million in fiscal2009 and $1.3 million in fiscal 2008, are included in accumulated other comprehensive loss. Comprehensiveincome has been reflected in stockholders’ equity.
67

salesforce.com, inc.
Notes to Consolidated Financial Statements—(Continued)
The components of accumulated other comprehensive loss were as follows (in thousands):
As of January 31,
2009 2008
Foreign currency translation and other adjustments . . . . . . . . . . . . . . . . . . . . . . . . $(3,957) $(4,217)Net unrealized gain on marketable securities and cash equivalents . . . . . . . . . . . . 1,052 1,941
$(2,905) $(2,276)
Net Income Per Share
Basic net income per share is computed by dividing net income by the weighted-average number ofcommon shares outstanding for the fiscal period. Diluted net income per share is computed giving effect to allpotential dilutive common stock, including options and restricted stock units. The dilutive effect of outstandingawards is reflected in diluted earnings per share by application of the treasury stock method.
A reconciliation of the denominator used in the calculation of basic and diluted net income per share is asfollows (in thousands):
Fiscal Year Ended January 31,
2009 2008 2007
Numerator:Net income . . . . . . . . . . . . . . . . . . . . . . . . . . . . . . . . . . . . . . . . . . $ 43,428 $ 18,356 $ 481Denominator:Weighted-average shares outstanding for basic earnings pershare, net of weighted-average shares of common stocksubject to repurchase . . . . . . . . . . . . . . . . . . . . . . . . . . . . . . . . 121,183 116,840 112,386
Effect of dilutive securities:Employee stock awards and warrants . . . . . . . . . . . . . . . . . 4,045 5,582 7,768
Adjusted weighted-average shares outstanding and assumedconversions for diluted earnings per share . . . . . . . . . . . . . . . . 125,228 122,422 120,154
Outstanding unvested common stock purchased by employees is subject to repurchase by the Company andtherefore is not included in the calculation of the weighted-average shares outstanding for basic earnings pershare.
The following were excluded from the computation of diluted shares outstanding as they would have had ananti-dilutive impact (in thousands). The dilutive securities are excluded when, for example, their exercise pricesare greater than the average fair values of the Company’s common stock.
Fiscal Year Ended January 31,
2009 2008 2007
Stock awards . . . . . . . . . . . . . . . . . . . . . . . . . . . . . . . . . . . . . . . . . . . . 3,797 3,175 4,019
Income Taxes
The Company uses the liability method of accounting for income taxes. Under this method, deferred taxassets and liabilities are determined based on temporary differences between the financial statement and tax basis
68

salesforce.com, inc.
Notes to Consolidated Financial Statements—(Continued)
of assets and liabilities and net operating loss and credit carryforwards using enacted tax rates in effect for theyear in which the differences are expected to reverse. The effect on deferred tax assets and liabilities of a changein tax rates is recognized in income in the period that includes the enactment date. Valuation allowances areestablished when necessary to reduce deferred tax assets to the amounts more likely than not expected to berealized.
The total income tax benefit recognized in the accompanying consolidated statements of operations relatedto SFAS 123R was $26.3 million, $18.5 million, and $12.4 million for fiscal 2009, 2008, and 2007 respectively.
The Company adopted the provisions of Financial Accounting Standards Board Interpretation No. 48,Accounting for Uncertainty in Income Taxes, or Interpretation 48, on February 1, 2007. This interpretationutilizes a two-step approach to establish a threshold for the financial statement recognition and measurement ofincome tax positions upon ultimate settlement with taxing authorities. It provides guidance on subsequentrecognition, derecognition and the accounting for interest and penalties associated with uncertain tax positions. Italso addresses the presentation and classification of recorded amounts in the financial statements and disclosurerequirements.
The Company recognizes interest accrued and penalties related to unrecognized tax benefits in its taxprovision. As of January 31, 2009, the Company accrued no penalties and an immaterial amount of interest inincome tax expense.
Revenue Recognition
The Company derives its revenues from two sources: (1) subscription revenues, which are comprised ofsubscription fees from customers accessing its enterprise cloud computing application service, and fromcustomers purchasing additional support beyond the standard support that is included in the basic subscriptionfee; and (2) related professional services and other revenue. Other revenues consist primarily of training fees.Because the Company provides its application as a service, the Company follows the provisions of the Securitiesand Exchange Commission’s, or SEC, Staff Accounting Bulletin No. 104, Revenue Recognition and EmergingIssues Task Force Issue No. 00-21, Revenue Arrangements with Multiple Deliverables. The Company recognizesrevenue when all of the following conditions are met:
• There is persuasive evidence of an arrangement;
• The service has been provided to the customer;
• The collection of the fees is reasonably assured; and
• The amount of fees to be paid by the customer is fixed or determinable.
The Company’s arrangements do not contain general rights of return.
Subscription and support revenues are recognized ratably over the contract terms beginning on thecommencement date of each contract. Amounts that have been invoiced are recorded in accounts receivable andin deferred revenue or revenue, depending on whether the revenue recognition criteria have been met.
Professional services and other revenues, when sold with subscription and support offerings, are accountedfor separately when these services have value to the customer on a standalone basis and there is objective andreliable evidence of fair value of each deliverable. When accounted for separately, revenues are recognized as theservices are rendered for time and material contracts, and when the milestones are achieved and accepted by the
69
salesforce.com, inc.
Notes to Consolidated Financial Statements—(Continued)
customer for fixed price contracts. The majority of the Company’s consulting contracts are on a time andmaterials basis. Training revenues are recognized after the services are performed. For revenue arrangementswith multiple deliverables, such as an arrangement that includes subscription, premium support, consulting ortraining services, the Company allocates the total amount the customer will pay to the separate units ofaccounting based on their relative fair values, as determined by the price of the undelivered items when soldseparately.
In determining whether the consulting services can be accounted for separately from subscription andsupport revenues, the Company considers the following factors for each consulting agreement: availability of theconsulting services from other vendors, whether objective and reliable evidence for fair value exists for theundelivered elements, the nature of the consulting services, the timing of when the consulting contract wassigned in comparison to the subscription service start date, and the contractual dependence of the subscriptionservice on the customer’s satisfaction with the consulting work. If a consulting arrangement does not qualify forseparate accounting, the Company recognizes the consulting revenue ratably over the remaining term of thesubscription contract. Additionally, in these situations, the Company defers only the direct costs of the consultingarrangement and amortizes those costs over the same time period as the consulting revenue is recognized. As ofJanuary 31, 2009 and January 31, 2008, the deferred cost on the accompanying consolidated balance sheet totaled$17.3 million and $13.9 million, respectively. These deferred costs are included in prepaid expenses and othercurrent assets and other assets.
Deferred Revenue
Deferred revenue primarily consists of billings or payments received in advance of revenue recognitionfrom the Company’s subscription service described above and is recognized as the revenue recognition criteriaare met. The Company generally invoices its customers in annual or quarterly installments. Accordingly, thedeferred revenue balance does not represent the total contract value of annual or multi-year, non-cancelablesubscription agreements. Deferred revenue also includes certain deferred professional services fees which arerecognized as revenue ratably over the subscription contract term. The Company defers the professional servicefees in situations where the professional services and subscription contracts are accounted for as a single unit ofaccounting. Deferred revenue that will be recognized during the succeeding 12-month period is recorded ascurrent deferred revenue and the remaining portion is recorded as noncurrent. Approximately 7 percent and8 percent of total deferred revenue as of January 31, 2009 and January 31, 2008, respectively, related to deferredprofessional services revenue.
Deferred Commissions
Deferred commissions are the incremental costs that are directly associated with non-cancelablesubscription contracts with customers and consist of sales commissions paid to the Company’s direct sales force.The commissions are deferred and amortized over the non-cancelable terms of the related customer contracts,which are typically 12 to 24 months. The commission payments are paid in full the month after the customer’sservice commences. The deferred commission amounts are recoverable through the future revenue streams underthe non-cancelable customer contracts. The Company believes this is the preferable method of accounting as thecommission charges are so closely related to the revenue from the non-cancelable customer contracts that theyshould be recorded as an asset and charged to expense over the same period that the subscription revenue isrecognized. Amortization of deferred commissions is included in marketing and sales expense in theaccompanying consolidated statements of operations.
70

salesforce.com, inc.
Notes to Consolidated Financial Statements—(Continued)
Accounting for Stock-Based Compensation
The Company accounts for its employee stock-based compensation pursuant to Statement of FinancialAccounting Standards 123R, Share-Based Payment (“SFAS 123R”). The Company recognizes share-basedexpenses on a straight-line over the requisite service period of the awards, which is the vesting term of fouryears. Stock-based expenses pursuant to SFAS 123R are recognized net of forfeiture activity.
The fair value of each option grant was estimated on the date of grant using the Black-Scholes optionpricing model with the following assumptions and fair value per share:
Fiscal Year Ended January 31,
2009 2008 2007
Volatility . . . . . . . . . . . . . . . . . . . . . . . . . . . . . . . . . . . . . . . . 47 - 60% 46 - 47% 46 - 50%Weighted-average estimated life . . . . . . . . . . . . . . . . . . . . . . 4 years 4 years 4 yearsWeighted-average risk-free interest rate . . . . . . . . . . . . . . . . 1.47 - 3.08% 3.32 - 4.55% 4.42 - 5.03%Dividend yield . . . . . . . . . . . . . . . . . . . . . . . . . . . . . . . . . . . . — — —Weighted-average fair value per share of grants . . . . . . . . . . $15.39 $20.49 $14.92
The expected life of options was based on the simplified calculation of expected life, described in the SEC’sStaff Accounting Bulletins 107 and 110. Accordingly, the weighted-average estimated life assumption of 4 yearswas based on the average of the vesting term and the 5 year contractual lives of options awarded. The weighted-average risk free interest rate is based on the rate for a 4 year U.S. government security at the time of the optiongrant.
The Company estimated its future stock price volatility considering both its observed option-impliedvolatilities and its historical volatility calculations. Management believes this is the best estimate of the expectedvolatility over the 4 year weighted-average expected life of its option grants.
During fiscal 2009 and 2008, the Company capitalized $1.9 million and $2.1 million, respectively, of stock-based expenses related to capitalized internal-use software development and deferred professional services costs.
During fiscal 2009, the Company recognized stock-based expense of $77.4 million. As of January 31, 2009,the aggregate stock compensation remaining to be amortized to costs and expenses was $261.3 million. TheCompany expects this stock compensation balance to be amortized as follows: $105.1 million during fiscal 2010;$83.0 million during fiscal 2011; $55.0 million during fiscal 2012; and $18.2 million during fiscal 2013. Theexpected amortization reflects only outstanding stock awards as of January 31, 2009 and assumes no forfeitureactivity. The Company expects to continue to issue share-based awards to its employees in future periods.
Warranties and Indemnification
The Company’s enterprise cloud computing application service is typically warranted to perform in amanner consistent with general industry standards that are reasonably applicable and materially in accordancewith the Company’s online help documentation under normal use and circumstances.
The Company’s arrangements generally include certain provisions for indemnifying customers againstliabilities if its products or services infringe a third-party’s intellectual property rights. To date, the Company hasnot incurred any material costs as a result of such indemnifications and has not accrued any liabilities related tosuch obligations in the accompanying consolidated financial statements.
71

salesforce.com, inc.
Notes to Consolidated Financial Statements—(Continued)
The Company has entered into service level agreements with a small number of its customers warrantingcertain levels of uptime reliability and performance and permitting those customers to receive credits orterminate their agreements in the event that the Company fails to meet those levels. As of January 31, 2009 andJanuary 31, 2008, the reserve balance was approximately $0.4 million.
The Company has also agreed to indemnify its directors and executive officers for costs associated with anyfees, expenses, judgments, fines and settlement amounts incurred by any of these persons in any action orproceeding to which any of those persons is, or is threatened to be, made a party by reason of the person’s serviceas a director or officer, including any action by the Company, arising out of that person’s services as theCompany’s director or officer or that person’s services provided to any other company or enterprise at theCompany’s request. The Company maintains director and officer insurance coverage that would generally enablethe Company to recover a portion of any future amounts paid.
Advertising Expenses
Advertising is expensed as incurred. Advertising expense was $43.7 million, $25.6 million and $14.7million for fiscal 2009, 2008 and 2007, respectively.
Recent Accounting Pronouncement
In April 2008, the Financial Accounting Standards Board (FASB) issued FSP No. 142-3, “Determination of theUseful Life of Intangible Assets” (FSP No. 142-3) that amends the factors considered in developing renewal orextension assumptions used to determine the useful life of a recognized intangible asset under SFAS No. 142. FSPNo. 142-3 requires a consistent approach between the useful life of a recognized intangible asset under SFASNo. 142 and the period of expected cash flows used to measure the fair value of an asset under SFAS No. 141(R).The FSP also requires enhanced disclosures when an intangible asset’s expected future cash flows are affected by anentity’s intent and/or ability to renew or extend the arrangement. FSP No. 142-3 is effective for financial statementsissued for fiscal years beginning after December 15, 2008 and is applied prospectively. The Company does notexpect the adoption of FSP No.142-3 to have a material impact on its consolidated results of operations or financialcondition.
In March 2008, the FASB issued SFAS No. 161, “Disclosures about Derivative Instruments and HedgingActivities—an amendment of FASB Statement No. 133” (SFAS 161). The standard requires additionalquantitative disclosures (provided in tabular form) and qualitative disclosures for derivative instruments. Therequired disclosures include how derivative instruments and related hedged items affect an entity’s financialposition, financial performance, and cash flows; the relative volume of derivative activity; the objectives andstrategies for using derivative instruments; the accounting treatment for those derivative instruments formallydesignated as the hedging instrument in a hedge relationship; and the existence and nature of credit-risk-relatedcontingent features for derivatives. SFAS 161 does not change the accounting treatment for derivativeinstruments. SFAS 161 is effective beginning in the first quarter of fiscal 2010.
In February 2008, FASB issued FASB Staff Position 157-1, “Application of FASB Statement No. 157 to FASB“Statement No. 13 and Other Accounting Pronouncements That Address Fair Value Measurements for Purposes ofLease Classification or Measurement under Statement 13” (FSP 157-1) and FSP 157-2, “Effective Date of FASBStatement No. 157” (FSP 157-2). FSP 157-1 amends SFAS No. 157 to remove certain leasing transactions from its77scope, and was effective upon initial adoption of SFAS No. 157. FSP 157-2 delays the effective date of SFAS 157for all non-financial assets and non-financial liabilities, except for items that are recognized or disclosed at fairvalue in the financial statements on a recurring basis (at least annually), until the beginning of the first quarter offiscal 2010. The adoption of SFAS 157 is not expected to have a significant impact on the Company’s consolidated
72

salesforce.com, inc.
Notes to Consolidated Financial Statements—(Continued)
financial statements when it is applied to non-financial assets and non-financial liabilities that are not measured atfair value on a recurring basis.
In December 2007, the FASB issued SFAS No. 141 (revised 2007), “Business Combinations” (SFAS141(R)). Under SFAS 141(R), an entity is required to recognize the assets acquired, liabilities assumed,contractual contingencies, and contingent consideration at their fair value on the acquisition date. It furtherrequires that acquisition-related costs be recognized separately from the acquisition and expensed as incurred;that restructuring costs generally be expensed in periods subsequent to the acquisition date; and that changes inaccounting for deferred tax asset valuation allowances and acquired income tax uncertainties after themeasurement period be recognized as a component of provision for taxes. In addition, acquired in-processresearch and development is capitalized as an intangible asset and amortized over its estimated useful life. SFAS141(R) is effective on a prospective basis for all business combinations for which the acquisition date is on orafter the beginning of February 1, 2009, The adoption of SFAS 141(R) is not expected to have a significantimpact on the Company’s consolidated financial statements.
In December 2007, the FASB issued Statement No. 160, Non-controlling Interests in ConsolidatedFinancial Statements, an amendment of ARB No. 51 or SFAS 160. The standard changes the accounting fornon-controlling (minority) interests in consolidated financial statements including the requirements to classifynon-controlling interests as a component of consolidated stockholders’ equity, and the elimination of “minorityinterest” accounting in results of operations with earnings attributable to non-controlling interests reported as partof consolidated earnings. Additionally, SFAS 160 revises the accounting for both increases and decreases in aparent’s controlling ownership interest. Should the Company increase its ownership interest in Salesforce Japan,the cost would be recorded as a reduction of the Company’s stockholders’ equity as opposed to accounting forthe purchase as a step acquisition which requires an allocation of the purchase price. SFAS 160 is effective forfiscal years beginning after December 15, 2008. The Company does not believe that the adoption of SFAS 160will have a material impact on the Company’s results of operations and consolidated balance sheet.
2. Balance Sheet Accounts
Marketable Securities
At January 31, 2009, marketable securities consisted of the following (in thousands):
AmortizedCost
UnrealizedGains
UnrealizedLosses Fair Value
Corporate notes and obligations . . . . . . . . . . . . . . . $215,297 $1,173 $(1,330) $215,140Money market mutual fund (see Note 1) . . . . . . . . . 18,294 — — 18,294U.S. agency obligations . . . . . . . . . . . . . . . . . . . . . . 163,584 1,721 (8) 165,297
$397,175 $2,894 $(1,338) $398,731
73
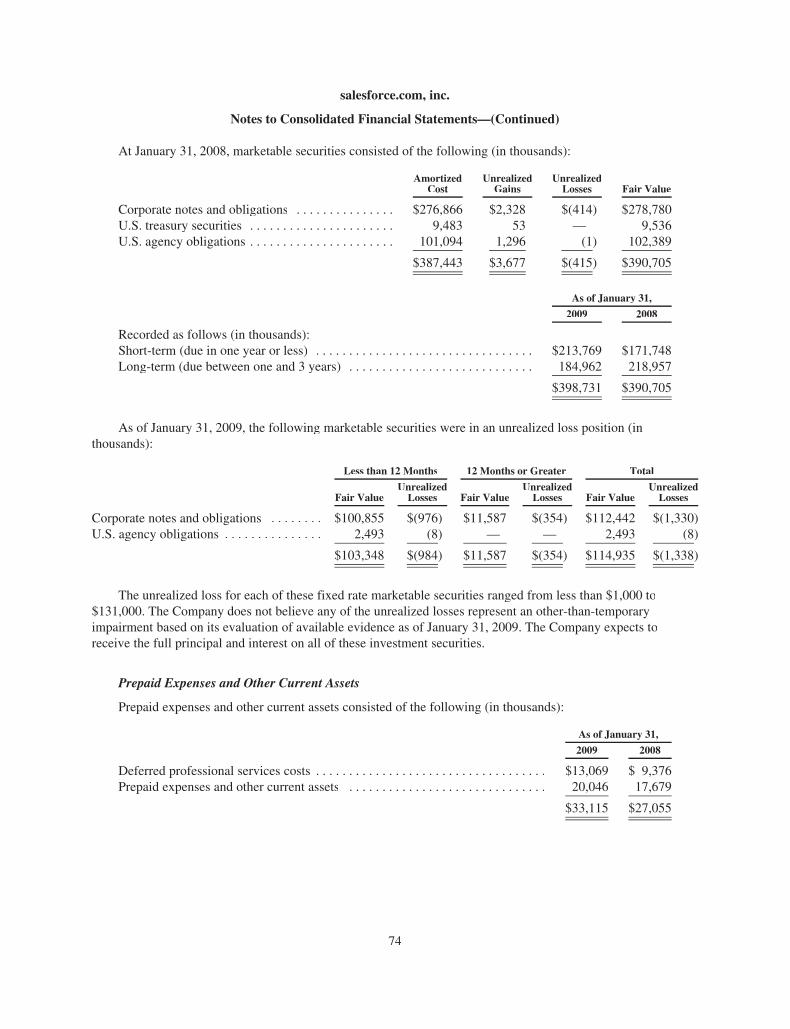
salesforce.com, inc.
Notes to Consolidated Financial Statements—(Continued)
At January 31, 2008, marketable securities consisted of the following (in thousands):
AmortizedCost
UnrealizedGains
UnrealizedLosses Fair Value
Corporate notes and obligations . . . . . . . . . . . . . . . $276,866 $2,328 $(414) $278,780U.S. treasury securities . . . . . . . . . . . . . . . . . . . . . . 9,483 53 — 9,536U.S. agency obligations . . . . . . . . . . . . . . . . . . . . . . 101,094 1,296 (1) 102,389
$387,443 $3,677 $(415) $390,705
As of January 31,
2009 2008
Recorded as follows (in thousands):Short-term (due in one year or less) . . . . . . . . . . . . . . . . . . . . . . . . . . . . . . . . . $213,769 $171,748Long-term (due between one and 3 years) . . . . . . . . . . . . . . . . . . . . . . . . . . . . 184,962 218,957
$398,731 $390,705
As of January 31, 2009, the following marketable securities were in an unrealized loss position (inthousands):
Less than 12 Months 12 Months or Greater Total
Fair ValueUnrealizedLosses Fair Value
UnrealizedLosses Fair Value
UnrealizedLosses
Corporate notes and obligations . . . . . . . . $100,855 $(976) $11,587 $(354) $112,442 $(1,330)U.S. agency obligations . . . . . . . . . . . . . . . 2,493 (8) — — 2,493 (8)
$103,348 $(984) $11,587 $(354) $114,935 $(1,338)
The unrealized loss for each of these fixed rate marketable securities ranged from less than $1,000 to$131,000. The Company does not believe any of the unrealized losses represent an other-than-temporaryimpairment based on its evaluation of available evidence as of January 31, 2009. The Company expects toreceive the full principal and interest on all of these investment securities.
Prepaid Expenses and Other Current Assets
Prepaid expenses and other current assets consisted of the following (in thousands):
As of January 31,
2009 2008
Deferred professional services costs . . . . . . . . . . . . . . . . . . . . . . . . . . . . . . . . . . . $13,069 $ 9,376Prepaid expenses and other current assets . . . . . . . . . . . . . . . . . . . . . . . . . . . . . . 20,046 17,679
$33,115 $27,055
74
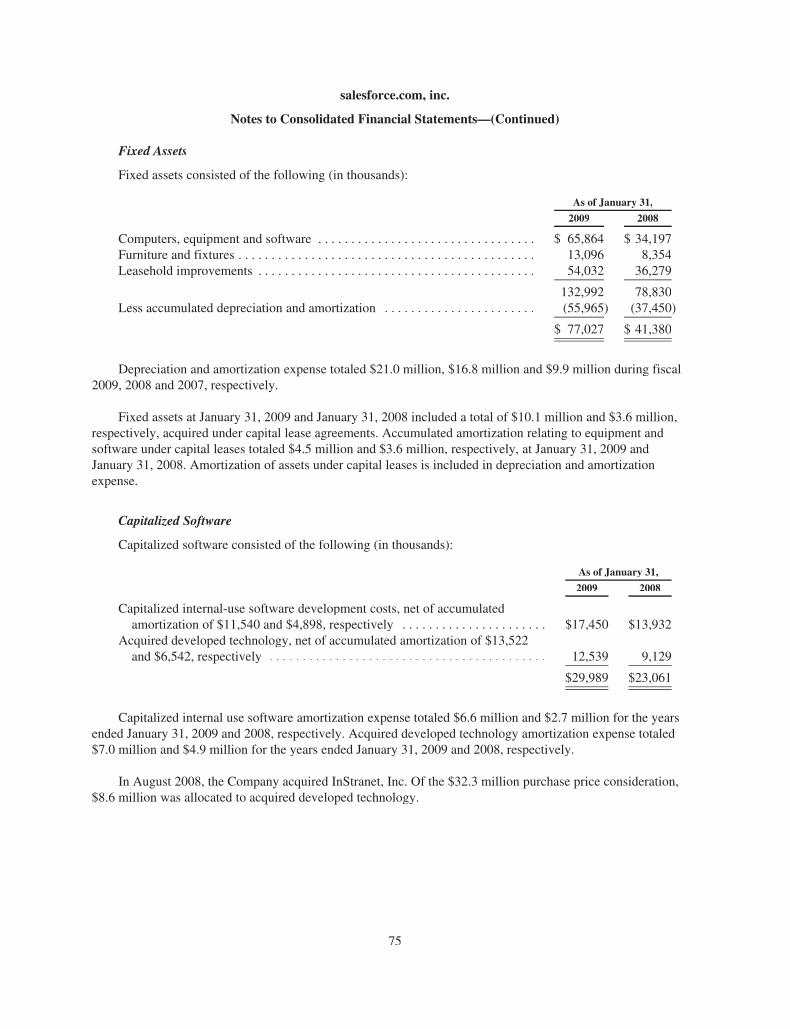
salesforce.com, inc.
Notes to Consolidated Financial Statements—(Continued)
Fixed Assets
Fixed assets consisted of the following (in thousands):
As of January 31,
2009 2008
Computers, equipment and software . . . . . . . . . . . . . . . . . . . . . . . . . . . . . . . . . $ 65,864 $ 34,197Furniture and fixtures . . . . . . . . . . . . . . . . . . . . . . . . . . . . . . . . . . . . . . . . . . . . . 13,096 8,354Leasehold improvements . . . . . . . . . . . . . . . . . . . . . . . . . . . . . . . . . . . . . . . . . . 54,032 36,279
132,992 78,830Less accumulated depreciation and amortization . . . . . . . . . . . . . . . . . . . . . . . (55,965) (37,450)
$ 77,027 $ 41,380
Depreciation and amortization expense totaled $21.0 million, $16.8 million and $9.9 million during fiscal2009, 2008 and 2007, respectively.
Fixed assets at January 31, 2009 and January 31, 2008 included a total of $10.1 million and $3.6 million,respectively, acquired under capital lease agreements. Accumulated amortization relating to equipment andsoftware under capital leases totaled $4.5 million and $3.6 million, respectively, at January 31, 2009 andJanuary 31, 2008. Amortization of assets under capital leases is included in depreciation and amortizationexpense.
Capitalized Software
Capitalized software consisted of the following (in thousands):
As of January 31,
2009 2008
Capitalized internal-use software development costs, net of accumulatedamortization of $11,540 and $4,898, respectively . . . . . . . . . . . . . . . . . . . . . . $17,450 $13,932
Acquired developed technology, net of accumulated amortization of $13,522and $6,542, respectively . . . . . . . . . . . . . . . . . . . . . . . . . . . . . . . . . . . . . . . . . . 12,539 9,129
$29,989 $23,061
Capitalized internal use software amortization expense totaled $6.6 million and $2.7 million for the yearsended January 31, 2009 and 2008, respectively. Acquired developed technology amortization expense totaled$7.0 million and $4.9 million for the years ended January 31, 2009 and 2008, respectively.
In August 2008, the Company acquired InStranet, Inc. Of the $32.3 million purchase price consideration,$8.6 million was allocated to acquired developed technology.
75

salesforce.com, inc.
Notes to Consolidated Financial Statements—(Continued)
Other Assets
Other assets consisted of the following (in thousands):
As of January 31,
2009 2008
Deferred professional services costs, noncurrent portion . . . . . . . . . . . . . . . . . . . $ 4,185 $ 4,546Long-term deposits . . . . . . . . . . . . . . . . . . . . . . . . . . . . . . . . . . . . . . . . . . . . . . . . 8,447 6,682Purchased intangible assets, net of accumulated amortization of $2,573 and$678, respectively . . . . . . . . . . . . . . . . . . . . . . . . . . . . . . . . . . . . . . . . . . . . . . . 9,679 1,509
Other . . . . . . . . . . . . . . . . . . . . . . . . . . . . . . . . . . . . . . . . . . . . . . . . . . . . . . . . . . . 7,816 1,144
$30,127 $13,881
In August 2008, the Company acquired InStranet, Inc. Of the $32.3 million purchase price consideration$6.0 million was allocated to customer relationships which is included in the purchased intangible assets.Additionally, the Company acquired shares held by minority stockholders of Salesforce Japan of which$5.4 million of the total amounts paid was allocated to customer relationship intangible assets and JapaneseTerritory rights included in purchased intangible assets above.
Goodwill
Goodwill represents the excess of the purchase price in a business combination over the fair value of nettangible and tangible assets acquired. Goodwill amounts are not amortized, but rather tested for impairment atleast annually during the fourth quarter. There was no impairment of goodwill during fiscal 2009 and 2008.
Goodwill consists of the following (in thousands):
Total
Balance as of January 31, 2007 . . . . . . . . . . . . . . . . . . . . . . . . . . . . . . . . . . . . . . . . . . . . . . . . $ 6,705Salesforce Japan (See Note 6) . . . . . . . . . . . . . . . . . . . . . . . . . . . . . . . . . . . . . . . . . . . . . 1,851
Balance as of January 31, 2008 . . . . . . . . . . . . . . . . . . . . . . . . . . . . . . . . . . . . . . . . . . . . . . . . 8,556Salesforce Japan (See Note 6) . . . . . . . . . . . . . . . . . . . . . . . . . . . . . . . . . . . . . . . . . . . . . 16,340InStranet, Inc. (See Note 6) . . . . . . . . . . . . . . . . . . . . . . . . . . . . . . . . . . . . . . . . . . . . . . . 19,976
Balance as of January 31, 2009 . . . . . . . . . . . . . . . . . . . . . . . . . . . . . . . . . . . . . . . . . . . . . . . . $44,872
Accrued Expenses and Other Current Liabilities
Accrued expenses and other current liabilities consisted of the following (in thousands):
As of January 31,
2009 2008
Accrued compensation . . . . . . . . . . . . . . . . . . . . . . . . . . . . . . . . . . . . . . . . . . . $ 74,355 $ 63,327Accrued other liabilities . . . . . . . . . . . . . . . . . . . . . . . . . . . . . . . . . . . . . . . . . . 39,886 20,988Accrued other taxes payable . . . . . . . . . . . . . . . . . . . . . . . . . . . . . . . . . . . . . . . 27,596 19,564Accrued professional costs . . . . . . . . . . . . . . . . . . . . . . . . . . . . . . . . . . . . . . . . 3,950 6,980Accrued rent . . . . . . . . . . . . . . . . . . . . . . . . . . . . . . . . . . . . . . . . . . . . . . . . . . . 17,418 15,137
$163,205 $125,996
76
salesforce.com, inc.
Notes to Consolidated Financial Statements—(Continued)
3. Stockholders’ Equity
Stock Awards Issued to Employees
The 1999 Stock Option Plan (the “1999 Plan”) provides for the issuance of incentive and non-statutoryoptions to employees and nonemployees of the Company. In addition to the 1999 Plan, the Company maintainsthe 2004 Equity Incentive Plan, 2004 Employee Stock Purchase Plan and the 2004 Outside Directors Stock Plan.These plans, other than the 1999 Plan and the 2004 Outside Directors Stock Plan, provide for annual automaticincreases on February 1 to the shares reserved for issuance based on the lesser of (i) a specific percentage of thetotal number of shares outstanding at year end; (ii) a fixed number of shares; or (iii) a lesser number of shares setby the Company’s Board of Directors, all as specified in the respective plans.
On February 1, 2009, 3.5 million additional shares were reserved under the 2004 Equity Incentive Planpursuant to the automatic increase. The 2004 Employee Stock Purchase Plan will not be implemented unless anduntil the Company’s Board of Directors authorizes the commencement of one or more offerings under the plan.No offering periods have been authorized to date.
In April 2006, the Company’s Board of Directors approved the 2006 Inducement Equity Incentive Plan (the“Inducement Plan”) that allows for stock option and other equity incentive grants to employees in connectionwith merger or acquisition activity. The total number of shares reserved for issuance under the Inducement Planis 400,000 shares. As of January 31, 2009, there were 101,705 shares of common stock available for grant underthe Inducement Plan.
Prior to February 1, 2006, options issued under the Company’s stock option plans were generally for periodsnot to exceed 10 years and were issued at fair value of the shares of common stock on the date of grant asdetermined by the trading price of such stock on the New York Stock Exchange. After February 1, 2006, optionsissued to employees are for periods not to exceed 5 years. Grants made pursuant to the 2004 Equity IncentivePlan and the Inducement Plan do not provide for the immediate exercise of options.
77

salesforce.com, inc.
Notes to Consolidated Financial Statements—(Continued)
Stock option activity is as follows:
SharesAvailablefor Grant
Options Outstanding
OutstandingStockOptions
Weighted-Average
Exercise Price
AggregateIntrinsic Value(in thousands)
Balance as of January 31, 2007 . . . . . . . . . . . . . . . . . . . . 5,001,926 15,955,334 $19.67Increase in shares authorized:
2004 Equity Incentive Plan . . . . . . . . . . . . . . . 4,000,000 — —Options granted under all plans . . . . . . . . . . . . . . . . (3,359,448) 3,359,448 50.51Restricted stock unit activity . . . . . . . . . . . . . . . . . . (1,109,710) — —Stock grants to board members for board servicesand advisory board members . . . . . . . . . . . . . . . . (50,500) — —
Exercised . . . . . . . . . . . . . . . . . . . . . . . . . . . . . . . . . — (4,357,918) 13.94Cancelled . . . . . . . . . . . . . . . . . . . . . . . . . . . . . . . . . 1,547,519 (1,547,519) 31.98
Balance as of January 31, 2008 . . . . . . . . . . . . . . . . . . . . 6,029,787 13,409,345 27.83Increase in shares authorized:
2004 Equity Incentive Plan . . . . . . . . . . . . . . . 4,000,000 — —Options granted under all plans . . . . . . . . . . . . . . . . (4,948,026) 4,948,026 35.07Restricted stock unit activity . . . . . . . . . . . . . . . . . . (1,320,695) — —Stock grants to board members for board servicesand advisory board members . . . . . . . . . . . . . . . . (51,600) — —
Exercised . . . . . . . . . . . . . . . . . . . . . . . . . . . . . . . . . — (2,957,675) 14.64Cancelled . . . . . . . . . . . . . . . . . . . . . . . . . . . . . . . . . 482,176 (482,176) 38.47
Balance as of January 31, 2009 . . . . . . . . . . . . . . . . . . . . 4,191,642 14,917,520 $32.51 $55,274
Vested or expected to vest . . . . . . . . . . . . . . . . . . . . . . . . 13,471,754 $31.86 $54,710
Exercisable at January 31, 2009 . . . . . . . . . . . . . . . . . . . . 6,114,204 $23.99 $51,882
The total intrinsic value of the options exercised during fiscal 2009, 2008 and 2007 were $117.3 million,$155.8 million, and $111.1 million, respectively. The intrinsic value is the difference of the current market valueof the stock and the exercise price of the stock option.
The weighted-average remaining contractual life of vested and expected to vest options is approximately4 years.
As of January 31, 2009, options to purchase 6,114,204 shares were vested at a weighted average exerciseprice of $23.99 per share and a remaining weighted-average remaining contractual life of approximately 4 years.The total intrinsic value of these vested options as of January 31, 2009 was $51.9 million.
As of January 31, 2009, no shares issued pursuant to exercises of options issued under the 1999 Planremained subject to repurchase.
78

salesforce.com, inc.
Notes to Consolidated Financial Statements—(Continued)
The following table summarizes information about stock options outstanding as of January 31, 2009:
Options Outstanding Options Vested
Range of ExercisePrices
NumberOutstanding
Weighted-Average
RemainingContractualLife (Years)
Weighted-AverageExercisePrice
Number ofShares
Weighted-AverageExercisePrice
$13.89 2,318,177 4.80 $ 7.62 2,315,224 $ 7.61$14.39 to $25.19 1,293,066 5.51 19.57 1,072,379 19.24$25.97 3,360,833 4.73 25.97 — —$27.20 to $36.34 2,277,312 3.33 31.93 1,181,209 32.04$36.90 to $52.28 2,703,288 3.29 43.78 1,053,682 42.16$52.43 to $52.76 2,163,794 3.72 52.56 437,531 52.48$54.22 to $70.86 801,050 4.04 62.23 54,179 58.80
14,917,520 4.15 $32.51 6,114,204 $23.99
Restricted stock unit activity is as follows:
Restricted Stock Units Outstanding
Outstanding
Weighted-Average
Exercise Price
AggregateIntrinsicValue
(in thousands)
Balance as of January 31, 2007 . . . . . . . . . . . . . . . . . . . . 841,678 $ —Granted . . . . . . . . . . . . . . . . . . . . . . . . . . . . . . . . . . . 1,326,520 0.001Cancelled . . . . . . . . . . . . . . . . . . . . . . . . . . . . . . . . . (216,873) 0.001Vested and converted to shares . . . . . . . . . . . . . . . . (234,035) 0.001
Balance as of January 31, 2008 . . . . . . . . . . . . . . . . . . . . 1,717,290 0.001Granted . . . . . . . . . . . . . . . . . . . . . . . . . . . . . . . . . . . 1,475,314 0.001Cancelled . . . . . . . . . . . . . . . . . . . . . . . . . . . . . . . . . (157,743) 0.001Vested and converted to shares . . . . . . . . . . . . . . . . (535,710) 0.001
Balance as of January 31, 2009 . . . . . . . . . . . . . . . . . . . . 2,499,151 $0.001 $66,502
Expected to vest . . . . . . . . . . . . . . . . . . . . . . . . . . . . . . . . 2,090,074 $55,617
The restricted stock units, which entitles the holder to one share of common stock for each restricted stockunit upon vesting, have an exercise price of $0.001 per share, which is equal to the par value of the Company’scommon stock, and vest over 4 years. The Company first awarded restricted stock units in May 2006.
The weighted-average fair value of the restricted stock units issued in fiscal 2009 and 2008 was $39.41 and$48.26, respectively.
The Company realized tax benefits of $42.0 million from the exercise, sale or vesting of stock awardsduring fiscal 2009.
79

salesforce.com, inc.
Notes to Consolidated Financial Statements—(Continued)
Common Stock
The following number of shares of common stock were reserved and available for future issuance atJanuary 31, 2009:
Options outstanding . . . . . . . . . . . . . . . . . . . . . . . . . . . . . . . . . . . . . . . . . . . . . . . . . . . . . . . 14,917,520Restricted stock units outstanding . . . . . . . . . . . . . . . . . . . . . . . . . . . . . . . . . . . . . . . . . . . . 2,499,151Stock available for future grant:
1999 Stock Option Plan . . . . . . . . . . . . . . . . . . . . . . . . . . . . . . . . . . . . . . . . . . . . . . . . —2004 Equity Incentive Plan . . . . . . . . . . . . . . . . . . . . . . . . . . . . . . . . . . . . . . . . . . . . . 3,382,9372006 Inducement Equity Incentive Plan . . . . . . . . . . . . . . . . . . . . . . . . . . . . . . . . . . . 101,7052004 Employee Stock Purchase Plan . . . . . . . . . . . . . . . . . . . . . . . . . . . . . . . . . . . . . 1,000,0002004 Outside Directors Stock Plan . . . . . . . . . . . . . . . . . . . . . . . . . . . . . . . . . . . . . . . 707,000
22,608,313
During fiscal year 2009 and 2008, certain board members received stock grants totaling 48,000 and 47,500shares, respectively, of common stock for board services pursuant to the terms described in the 2004 OutsideDirectors Plan. The expenses related to these awards, which was expensed immediately at the time of theissuance, totaled $2.4 million and $2.3 million, in fiscal 2009 and 2008 respectively.
4. Preferred Stock
After the consummation of the initial public offering in June 2004 and the filing of the Company’s amendedand restated certificate of incorporation, the Company’s board of directors has the authority, without furtheraction by stockholders, to issue up to 5,000,000 shares of preferred stock in one or more series. The Company’sboard of directors may designate the rights, preferences, privileges and restrictions of the preferred stock,including dividend rights, conversion rights, voting rights, terms of redemption, liquidation preference, sinkingfund terms, and number of shares constituting any series or the designation of any series. The issuance ofpreferred stock could have the effect of restricting dividends on the Company’s common stock, diluting thevoting power of its common stock, impairing the liquidation rights of its common stock, or delaying orpreventing a change in control. The ability to issue preferred stock could delay or impede a change in control. AtJanuary 31, 2009 and 2008, no shares of preferred stock were outstanding.
5. Joint Venture
On December 7, 2000, the Company entered into a joint venture agreement with SunBridge, Inc., a Japanesecorporation, to establish Salesforce Japan. During the third quarter of fiscal 2009, the Company increased itsownership interest in the joint venture, from 65 to 72 percent in exchange for a cash payment of $21.6 million.The Company accounted for this investment as a step acquisition (see Note 6 Acquisitions).
Provided that the Company owns at least 30 percent of the outstanding voting shares of the joint venture, theCompany has the right to appoint three of the six board members of the joint venture, and together withSunBridge, may appoint a fourth director.
The Board of Directors of the joint venture has authorized option plans to purchase shares in SalesforceJapan. One of the option plans includes antidilution provisions such that the option holders are allowed additionaloptions if the joint venture issues additional stock and the exercise price of their options is reduced if theadditional stock is issued for an amount less than such exercise price.
80

salesforce.com, inc.
Notes to Consolidated Financial Statements—(Continued)
In fiscal 2009, 2008 and 2007, the joint venture granted options to purchase 16,500, 11,600 and 8,400shares, respectively, to its employees to purchase shares of common stock in the joint venture. The stock optionswere issued with an exercise price ranging from ¥20,000 to ¥60,000 per share (approximately $223 to $669 pershare), ¥20,000 (approximately $171 per share), and ¥4,000 to ¥15,000 a per share (approximately $34 to $129per share), respectively.
Given the Company’s majority ownership interest in the joint venture, the accounts of the joint venture havebeen consolidated with the accounts of the Company, and a minority interest has been recorded for the thirdparty’s interest in the net assets and operations of the joint venture to the extent of the minority partners’individual investments. All intercompany transactions have been eliminated, with the exception of minorityinterest.
Under the terms of the joint venture agreement, the joint venture will terminate if the joint venture becomesa public company or is sold to a third party, or upon the mutual agreement of the parties. In addition, if theCompany commits a breach of, or if the Company fails to perform, its material obligations under the jointventure agreement, which are not cured in a timely manner, SunBridge can require the Company to purchase allof its shares in the joint venture. The purchase price for SunBridge’s shares would be the then fair market valueplus a specified premium. In the event that SunBridge commits a breach of, or if it fails to perform, its materialobligations under the joint venture agreement, which it does not cure in a timely manner, or if SunBridge entersinto bankruptcy proceedings, the Company can require SunBridge to sell to it all of their shares in the jointventure. The purchase price for SunBridge’s shares would be the then fair market value less a specified discount.Additionally, if the Company and SunBridge are unable to agree on certain operational matters, either party canrequire the other to purchase all of its shares of the joint venture at a price equal to the then fair value marketvalue. Fair market value is to be determined by mutual agreement of the parties, or if the parties are unable toagree, by an independent appraiser.
6. Acquisitions
InStranet, Inc.
In August 2008, the Company acquired 100 percent of the outstanding stock of InStranet, Inc. (“InStranet”),a privately-held company with operations in Paris, France, and Chicago, Illinois for $32.3 million in cash,including $0.7 million in transaction costs. InStranet offers a knowledge management application for business toconsumer call centers. The Company acquired InStranet for its developed technology in order to expand its CRMcustomer service and support offerings in the customer service and support market. The Company accounted forthis acquisition using Statement of Financial Accounting Standards No. 141, Business Combinations.Accordingly, the results of operations for the acquired business are included in the accompanying consolidatedstatements of operations since the acquisition date, and the related assets and liabilities were recorded based upontheir fair values as of the acquisition date. Proforma results of operations have not been presented because theeffects of the acquisition was not significant.
81

salesforce.com, inc.
Notes to Consolidated Financial Statements—(Continued)
The valuation of acquired assets and liabilities is as follows (in thousands):
Net tangible assets . . . . . . . . . . . . . . . . . . . . . . . . . . . . . . . . . . . . . . . . . . . . . . . . . . . . . . . . . . $ 3,863Developed technology . . . . . . . . . . . . . . . . . . . . . . . . . . . . . . . . . . . . . . . . . . . . . . . . . . . . . . . 8,610Customer relationships . . . . . . . . . . . . . . . . . . . . . . . . . . . . . . . . . . . . . . . . . . . . . . . . . . . . . . . 5,950Goodwill . . . . . . . . . . . . . . . . . . . . . . . . . . . . . . . . . . . . . . . . . . . . . . . . . . . . . . . . . . . . . . . . . . 19,976Deferred income taxes . . . . . . . . . . . . . . . . . . . . . . . . . . . . . . . . . . . . . . . . . . . . . . . . . . . . . . . (6,122)
Total purchase price consideration . . . . . . . . . . . . . . . . . . . . . . . . . . . . . . . . . . . . . . . . . . . . . . $32,277
Customer relationships and developed technologies have a useful life of 3 years. The goodwill balance is notdeductible for tax purposes. This asset is attributed to the premium paid for an established knowledgemanagement application.
In performing the purchase price allocation, the Company considered, among other factors, its intention forfuture use of the acquired assets, analysis of historical financial performance and estimates of future performanceof InStranet’s knowledge management application. The fair value of intangible assets was primarily based on theincome approach.
Salesforce Japan
In the third quarter of fiscal 2009, the Company acquired shares held by minority shareholders of its jointventure Salesforce Japan and increased its ownership to 72 percent for $21.6 million in cash. The Companyaccounted for this purchase as a step-acquisition.
The allocation of the purchase price below is as follows (in thousands):
Customer relationships . . . . . . . . . . . . . . . . . . . . . . . . . . . . . . . . . . . . . . . . . . . . . . . . . . . . . . . $ 1,919Territory rights . . . . . . . . . . . . . . . . . . . . . . . . . . . . . . . . . . . . . . . . . . . . . . . . . . . . . . . . . . . . . 2,196Goodwill . . . . . . . . . . . . . . . . . . . . . . . . . . . . . . . . . . . . . . . . . . . . . . . . . . . . . . . . . . . . . . . . . . 16,340Deferred income taxes . . . . . . . . . . . . . . . . . . . . . . . . . . . . . . . . . . . . . . . . . . . . . . . . . . . . . . . (1,679)Minority interest adjustment . . . . . . . . . . . . . . . . . . . . . . . . . . . . . . . . . . . . . . . . . . . . . . . . . . 2,848
Total purchase price consideration . . . . . . . . . . . . . . . . . . . . . . . . . . . . . . . . . . . . . . . . . . . . . . $21,624
Customer relationships have a useful life of 3 years and Japan territory rights have a useful life of 7 years.The goodwill balance is not deductible for tax purposes. This asset is attributed to the premium paid for theterritory rights and customer relationships.
In December 2006, the Company acquired shares of its joint venture in Salesforce Japan for $2.8 million incash. The acquisition of the shares was accounted for as a step acquisition and as such an allocation of thepurchase was required.
82

salesforce.com, inc.
Notes to Consolidated Financial Statements—(Continued)
The allocation of the purchase price for the shares purchased in its Salesforce Japan in December 2006 is asfollows (in thousands):
Customer relationships . . . . . . . . . . . . . . . . . . . . . . . . . . . . . . . . . . . . . . . . . . . . . . . . . . . . . . . . $ 235Territory rights . . . . . . . . . . . . . . . . . . . . . . . . . . . . . . . . . . . . . . . . . . . . . . . . . . . . . . . . . . . . . . 1,008Goodwill . . . . . . . . . . . . . . . . . . . . . . . . . . . . . . . . . . . . . . . . . . . . . . . . . . . . . . . . . . . . . . . . . . . 1,851Deferred income taxes . . . . . . . . . . . . . . . . . . . . . . . . . . . . . . . . . . . . . . . . . . . . . . . . . . . . . . . . (503)Minority interest adjustment . . . . . . . . . . . . . . . . . . . . . . . . . . . . . . . . . . . . . . . . . . . . . . . . . . . 186
Total purchase price consideration . . . . . . . . . . . . . . . . . . . . . . . . . . . . . . . . . . . . . . . . . . . . . . . $2,777
Customer relationships have a useful life of 3 years and Japan territory rights have a useful life of 7 years.The goodwill balance is not deductible for tax purposes. This asset is attributed to the premium paid for theterritory rights and customer relationships.
Sendia Corporation
On April 10, 2006, the Company acquired 100 percent of the outstanding stock of Sendia Corporation, aprivately-held company based in Santa Monica, California, for $15.2 million in cash and $304,000 in acquisitioncosts. Approximately $1.8 million of the purchase price was attributed to assumed debt that was repaidimmediately following the close of the transaction. The Company acquired Sendia because it had an establishedwireless solution technology.
The following table summarizes the allocation of the purchase price for the Sendia Corporation acquisition,(in thousands):
Net tangible assets . . . . . . . . . . . . . . . . . . . . . . . . . . . . . . . . . . . . . . . . . . . . . . . . . . . . . . . . . . $ 447Developed technology . . . . . . . . . . . . . . . . . . . . . . . . . . . . . . . . . . . . . . . . . . . . . . . . . . . . . . . 5,710Customer relationships . . . . . . . . . . . . . . . . . . . . . . . . . . . . . . . . . . . . . . . . . . . . . . . . . . . . . . . 690Goodwill . . . . . . . . . . . . . . . . . . . . . . . . . . . . . . . . . . . . . . . . . . . . . . . . . . . . . . . . . . . . . . . . . . 6,705Deferred income taxes . . . . . . . . . . . . . . . . . . . . . . . . . . . . . . . . . . . . . . . . . . . . . . . . . . . . . . . 2,650Deferred revenue . . . . . . . . . . . . . . . . . . . . . . . . . . . . . . . . . . . . . . . . . . . . . . . . . . . . . . . . . . . (700 )
Total purchase price consideration . . . . . . . . . . . . . . . . . . . . . . . . . . . . . . . . . . . . . . . . . . . . . . $15,502
Customer relationships and developed technology have a useful life of 3 years. The goodwill balance is notdeductible for tax purposes. This asset is attributed to the premium paid for an established wireless solution.
Intangible assets acquired resulting from the acquisitions described above as of January 31, 2009 are asfollows (in thousands):
GrossFair Value
AccumulatedAmortization
NetBook Value
WeightedAverage Remaining
Useful Life
Territory rights . . . . . . . . . . . . . . . . . . . . $ 3,203 $ (431) $ 2,772 6.1 yearsDeveloped technology . . . . . . . . . . . . . . . 14,320 (6,704) 7,616 2.4 yearsCustomer relationships . . . . . . . . . . . . . . 8,794 (2,073) 6,721 2.4 years
$26,317 $(9,208) $17,109
83

salesforce.com, inc.
Notes to Consolidated Financial Statements—(Continued)
The expected future amortization expense for these intangible assets for each of the fiscal years endedthereafter is as follows (in thousands):
Fiscal Period:Fiscal 2010 . . . . . . . . . . . . . . . . . . . . . . . . . . . . . . . . . . . . . . . . . . . . . . . . . . . . . . . . . . . . . . . . $ 6,383Fiscal 2011 . . . . . . . . . . . . . . . . . . . . . . . . . . . . . . . . . . . . . . . . . . . . . . . . . . . . . . . . . . . . . . . . 5,951Fiscal 2012 . . . . . . . . . . . . . . . . . . . . . . . . . . . . . . . . . . . . . . . . . . . . . . . . . . . . . . . . . . . . . . . . 3,377Fiscal 2013 . . . . . . . . . . . . . . . . . . . . . . . . . . . . . . . . . . . . . . . . . . . . . . . . . . . . . . . . . . . . . . . . 458Fiscal 2014 . . . . . . . . . . . . . . . . . . . . . . . . . . . . . . . . . . . . . . . . . . . . . . . . . . . . . . . . . . . . . . . . 446Thereafter . . . . . . . . . . . . . . . . . . . . . . . . . . . . . . . . . . . . . . . . . . . . . . . . . . . . . . . . . . . . . . . . . 494
Total amortization expense . . . . . . . . . . . . . . . . . . . . . . . . . . . . . . . . . . . . . . . . . . . . . . . . . . . $17,109
7. Income Taxes
The domestic and foreign components of income before provision (benefit) for income taxes and minorityinterest consisted of the following (in thousands):
Fiscal Year Ended January 31,
2009 2008 2007
Domestic . . . . . . . . . . . . . . . . . . . . . . . . . . . . . . . . . . . . . . . . . . . . . . $83,590 $51,911 $ 23,498Foreign . . . . . . . . . . . . . . . . . . . . . . . . . . . . . . . . . . . . . . . . . . . . . . . 2,002 (5,698) (11,002)
$85,592 $46,213 $ 12,496
The provision for income taxes consisted of the following (in thousands):
Fiscal Year Ended January 31,
2009 2008 2007
Current:Federal . . . . . . . . . . . . . . . . . . . . . . . . . . . . . . . . . . . . . . . . . . . $ 55,228 $ 31,245 $15,243State . . . . . . . . . . . . . . . . . . . . . . . . . . . . . . . . . . . . . . . . . . . . . 7,701 4,515 1,362Foreign . . . . . . . . . . . . . . . . . . . . . . . . . . . . . . . . . . . . . . . . . . . 7,699 6,502 2,514
Total . . . . . . . . . . . . . . . . . . . . . . . . . . . . . . . . . . . . . . . . . . . . . 70,628 42,262 19,119Deferred:
Federal . . . . . . . . . . . . . . . . . . . . . . . . . . . . . . . . . . . . . . . . . . . (26,979) (13,800) (7,122)State . . . . . . . . . . . . . . . . . . . . . . . . . . . . . . . . . . . . . . . . . . . . . (5,372) (3,192) (1,368)Foreign . . . . . . . . . . . . . . . . . . . . . . . . . . . . . . . . . . . . . . . . . . . (720) (1,885) (834)
Total . . . . . . . . . . . . . . . . . . . . . . . . . . . . . . . . . . . . . . . . . . . . . (33,071) (18,877) (9,324)
Provision for income taxes . . . . . . . . . . . . . . . . . . . . . . . . . . . $ 37,557 $ 23,385 $ 9,795
84

salesforce.com, inc.
Notes to Consolidated Financial Statements—(Continued)
A reconciliation of income taxes at the statutory federal income tax rate to the provision for income taxesincluded in the accompanying consolidated statements of operations is as follows (in thousands):
Fiscal Year Ended January 31,
2009 2008 2007
U.S. federal taxes at statutory rate . . . . . . . . . . . . . . . . . . . . . . . . . . . $29,957 $16,175 $ 4,374State, net of the federal benefit . . . . . . . . . . . . . . . . . . . . . . . . . . . . . . 4,685 2,916 1,146Foreign losses providing no benefit . . . . . . . . . . . . . . . . . . . . . . . . . . 3,091 4,547 3,766Foreign taxes in excess of the U.S. statutory rate . . . . . . . . . . . . . . . . 3,537 3,296 1,889Tax credits . . . . . . . . . . . . . . . . . . . . . . . . . . . . . . . . . . . . . . . . . . . . . . (5,222) (3,817) (2,851)Change in valuation allowance . . . . . . . . . . . . . . . . . . . . . . . . . . . . . . — (970) —Non-deductible expenses . . . . . . . . . . . . . . . . . . . . . . . . . . . . . . . . . . 901 1,346 1,762Other, net . . . . . . . . . . . . . . . . . . . . . . . . . . . . . . . . . . . . . . . . . . . . . . . 608 (108) (291)
$37,557 $23,385 $ 9,795
Deferred income taxes reflect the net tax effect of temporary differences between the carrying amounts ofassets and liabilities for financial reporting purposes and the amounts used for income tax purposes. Significantcomponents of the Company’s deferred tax assets and liabilities were as follows (in thousands):
As of January 31,
2009 2008
Deferred tax assets:Net operating loss carryforwards . . . . . . . . . . . . . . . . . . . . . . . . . . . . . . . . $ 6,212 $ 7,096Deferred stock compensation . . . . . . . . . . . . . . . . . . . . . . . . . . . . . . . . . . . 26,288 16,347Tax credits . . . . . . . . . . . . . . . . . . . . . . . . . . . . . . . . . . . . . . . . . . . . . . . . . 14,004 8,135Deferred rent expense . . . . . . . . . . . . . . . . . . . . . . . . . . . . . . . . . . . . . . . . . 6,244 5,530Accrued liabilities . . . . . . . . . . . . . . . . . . . . . . . . . . . . . . . . . . . . . . . . . . . . 17,564 7,273Deferred revenue . . . . . . . . . . . . . . . . . . . . . . . . . . . . . . . . . . . . . . . . . . . . 11,131 8,447Other . . . . . . . . . . . . . . . . . . . . . . . . . . . . . . . . . . . . . . . . . . . . . . . . . . . . . . 10,479 6,825
Total deferred tax assets . . . . . . . . . . . . . . . . . . . . . . . . . . . . . . . . . . . . . . . . . . . 91,922 59,653Less valuation allowance . . . . . . . . . . . . . . . . . . . . . . . . . . . . . . . . . . . . . . . . . . (2,344) (1,650)
Total deferred tax assets . . . . . . . . . . . . . . . . . . . . . . . . . . . . . . . . . . . . . . . . . . . 89,578 58,003Deferred tax liabilities:
Deferred commissions . . . . . . . . . . . . . . . . . . . . . . . . . . . . . . . . . . . . . . . . (18,274) (16,562)Purchased intangibles . . . . . . . . . . . . . . . . . . . . . . . . . . . . . . . . . . . . . . . . . (7,912) (3,756)Unrealized gains on investments . . . . . . . . . . . . . . . . . . . . . . . . . . . . . . . . (626) (1,321)Other . . . . . . . . . . . . . . . . . . . . . . . . . . . . . . . . . . . . . . . . . . . . . . . . . . . . . . (4,277) (2,679)
Total deferred tax liabilities . . . . . . . . . . . . . . . . . . . . . . . . . . . . . . . . . . . . . . . . (31,089) (24,318)
Net deferred tax assets . . . . . . . . . . . . . . . . . . . . . . . . . . . . . . . . . . . . . . . . . . . . $ 58,489 $ 33,685
Realization of deferred tax assets is dependent on future earnings, if any, the timing and amount of whichare uncertain. Accordingly, the deferred tax assets have been partially offset by a valuation allowance. Thevaluation allowance relates to net deferred tax assets from operating losses of certain foreign subsidiaries. Sincethe adoption of SFAS 123R, excess tax benefits associated with stock option exercises are recorded directly tostockholders’ equity only when realized. As a result, the excess tax benefits included in net operating losscarryforwards but not reflected in deferred tax assets for fiscal year 2009 and 2008 are $30.4 million and $60.2million, respectively.
85

salesforce.com, inc.
Notes to Consolidated Financial Statements—(Continued)
At January 31, 2009, the Company had net operating loss carryforwards for federal income tax purposes ofapproximately $70.8 million, which expire in 2023 through 2029, federal research and development tax credits ofapproximately $10.9 million, which expire in 2020 through 2029 and minimum tax credits of $1.7 million whichdo not expire. The Company also has state net operating loss carryforwards of approximately $165.0 millionwhich expire beginning in 2011, state research and development tax credits of approximately $9.5 million and$1.2 million of state enterprise zone tax credits, which do not expire.
Utilization of the Company’s net operating loss carryforwards may be subject to substantial annuallimitation due to the ownership change limitations provided by the Internal Revenue Code and similar stateprovisions. Such an annual limitation could result in the expiration of the net operating loss and tax creditcarryforwards before utilization.
The Company had gross unrecognized tax benefits of $16.5 million and $11.8 million at the end ofJanuary 31, 2009 and January 31, 2008 respectively.
A reconciliation of the beginning and ending balance of total unrecognized tax benefits for fiscal 2009 and2008 is as follows (in thousands):
Fiscal Year Ended January 31,
2009 2008
Balance as of February 1 . . . . . . . . . . . . . . . . . . . . . . . . . . . . . . . . . . . . . $11,771 $ 6,542Tax positions taken in prior period:
Gross increases . . . . . . . . . . . . . . . . . . . . . . . . . . . . . . . . . . . . . . . . . 17 —Gross decreases . . . . . . . . . . . . . . . . . . . . . . . . . . . . . . . . . . . . . . . . . (148) (125)
Tax positions taken in current period:Gross increases . . . . . . . . . . . . . . . . . . . . . . . . . . . . . . . . . . . . . . . . . 5,955 5,129Gross decreases . . . . . . . . . . . . . . . . . . . . . . . . . . . . . . . . . . . . . . . . . — —
Settlements . . . . . . . . . . . . . . . . . . . . . . . . . . . . . . . . . . . . . . . . . . . . . . . . (149) —
Lapse of statute of limitations . . . . . . . . . . . . . . . . . . . . . . . . . . . . . . . . . . — —Currency translation effect . . . . . . . . . . . . . . . . . . . . . . . . . . . . . . . . . . . . (974) 225
Balance as of January 31 . . . . . . . . . . . . . . . . . . . . . . . . . . . . . . . . . . . . . $16,472 $11,771
For fiscal year 2009 and 2008, total unrecognized tax benefits in an amount of $11.8 million and $7.9million respectively, if recognized, would reduce income tax expense and the Company’s effective tax rate.
The Company recognizes interest accrued and penalties related to unrecognized tax benefits in its incometax provision. As of January 31, 2009, the Company accrued no penalties and an insignificant amount of interestwas recorded in income tax expense.
Tax positions for the Company and its subsidiaries are subject to income tax audits by many taxjurisdictions throughout the world. The Company’s U.S. federal and state tax returns for all tax years sinceFebruary 1999, which was the inception of the Company, remain open to examination. Outside the U.S., taxreturns filed in major jurisdictions where the Company operates, including Canada, United Kingdom, andAustralia generally remain open to examination for all tax years, while for Japan, the statute of limitationscurrently remains open for tax years after fiscal year 2003. During fiscal year 2009, the Internal Revenue Servicecompleted its examination of the Company’s federal income tax return for fiscal year ended January 31, 2006.No adjustment was made as a result of the audit.
86

salesforce.com, inc.
Notes to Consolidated Financial Statements—(Continued)
Management does not believe that it is reasonably possible that the estimates of unrecognized tax benefitswill change significantly in the next twelve months. However, an adverse resolution of one or more uncertain taxpositions in any period could have a material impact on the results of operations for that period.
8. Commitments and Contingencies
Letters of Credit
As of January 31, 2009, the Company had a total of $8.3 million in letters of credit outstanding substantiallyin favor of its landlords for office space in San Francisco, California, New York City, Singapore, Sweden andSwitzerland. These letters of credit renew annually and mature at various dates through December 2016.
Leases
The Company leases office space and equipment under noncancelable operating and capital leases withvarious expiration dates.
As of January 31, 2009, the future minimum lease payments under noncancelable operating and capitalleases are as follows (in thousands):
CapitalLeases
OperatingLeases
Fiscal Period:Fiscal 2010 . . . . . . . . . . . . . . . . . . . . . . . . . . . . . . . . . . . . . . . . . . . . . . . . . . . . . . $2,599 $ 80,503Fiscal 2011 . . . . . . . . . . . . . . . . . . . . . . . . . . . . . . . . . . . . . . . . . . . . . . . . . . . . . . 2,599 61,655Fiscal 2012 . . . . . . . . . . . . . . . . . . . . . . . . . . . . . . . . . . . . . . . . . . . . . . . . . . . . . . 1,798 43,940Fiscal 2013 . . . . . . . . . . . . . . . . . . . . . . . . . . . . . . . . . . . . . . . . . . . . . . . . . . . . . . — 35,566Fiscal 2014 . . . . . . . . . . . . . . . . . . . . . . . . . . . . . . . . . . . . . . . . . . . . . . . . . . . . . . — 31,458Thereafter . . . . . . . . . . . . . . . . . . . . . . . . . . . . . . . . . . . . . . . . . . . . . . . . . . . . . . . — 59,514
Total minimum lease payments . . . . . . . . . . . . . . . . . . . . . . . . . . . . . . . . . . . . . . 6,996 $312,636
Less: amount representing interest . . . . . . . . . . . . . . . . . . . . . . . . . . . . . . . . . . . . (552)
Present value of capital lease obligations . . . . . . . . . . . . . . . . . . . . . . . . . . . . . . . $6,444
The terms of the lease agreements provide for rental payments on a graduated basis. The Companyrecognizes rent expense on the straight-line basis over the lease period and has accrued for rent expense incurredbut not paid. Of the total operating lease commitment balance of $312.6 million, $257.2 million is related tofacilities space. The remaining $55.4 million commitment is related to computer equipment and other leases.
Our agreements for the facilities and certain services provide us with the option to renew. Our futurecontractual obligations would change if we exercised these options.
Rent expense for fiscal 2009, 2008 and 2007 was $36.0 million, $23.0 million and $16.8 million,respectively.
9. Legal Proceedings
The Company is involved in various legal proceedings arising from the normal course of business activities.In management’s opinion, resolution of these matters is not expected to have a material adverse impact on the
87

salesforce.com, inc.
Notes to Consolidated Financial Statements—(Continued)
Company’s consolidated results of operations, cash flows or its financial position. However, depending on thenature and timing of any such dispute, an unfavorable resolution of a matter could materially affect theCompany’s future results of operations, cash flows or financial position in a particular period.
10. Employee Benefit Plan
The Company has a 401(k) plan covering all eligible employees in the United States. Since January 1, 2006,the Company has been contributing to the plan. Total contributions during fiscal 2009, 2008 and 2007, were $6.7million, $3.9 million and $2.9 million, respectively.
11. Related-Party Transactions
In January 1999, the salesforce.com/foundation, commonly referred to as the Foundation, a non-profitpublic charity, was chartered to build philanthropic programs that are focused on youth and technology. TheCompany’s chairman is the chairman of the Foundation. He, one of the Company’s officers and one of theCompany’s board members hold three of the Foundation’s seven board seats. The Company is not the primarybeneficiary of the Foundation’s activities, and accordingly, the Company does not consolidate the Foundation’sstatement of activities with its financial results.
Since the Foundation’s inception, the Company has provided at no charge certain resources to Foundationemployees such as office space. The value of these items totals approximately $35,000 per quarter.
In addition to the resource sharing with the Foundation, the Company issued the Foundation warrants inAugust 2002 to purchase 500,000 shares of common stock. Through January 31, 2009, the Foundation exercisedall of these warrants. As of January 31, 2009, the Foundation held 191,500 shares of salesforce.com commonstock. Additionally, the Company has donated subscriptions to the Company’s service to other qualifiednon-profit organizations. The fair value of these donated subscriptions is in excess of $5.1 million per month.The Company plans to continue providing free subscriptions to qualified non-profit organizations through itsrelationship with the Foundation.
88
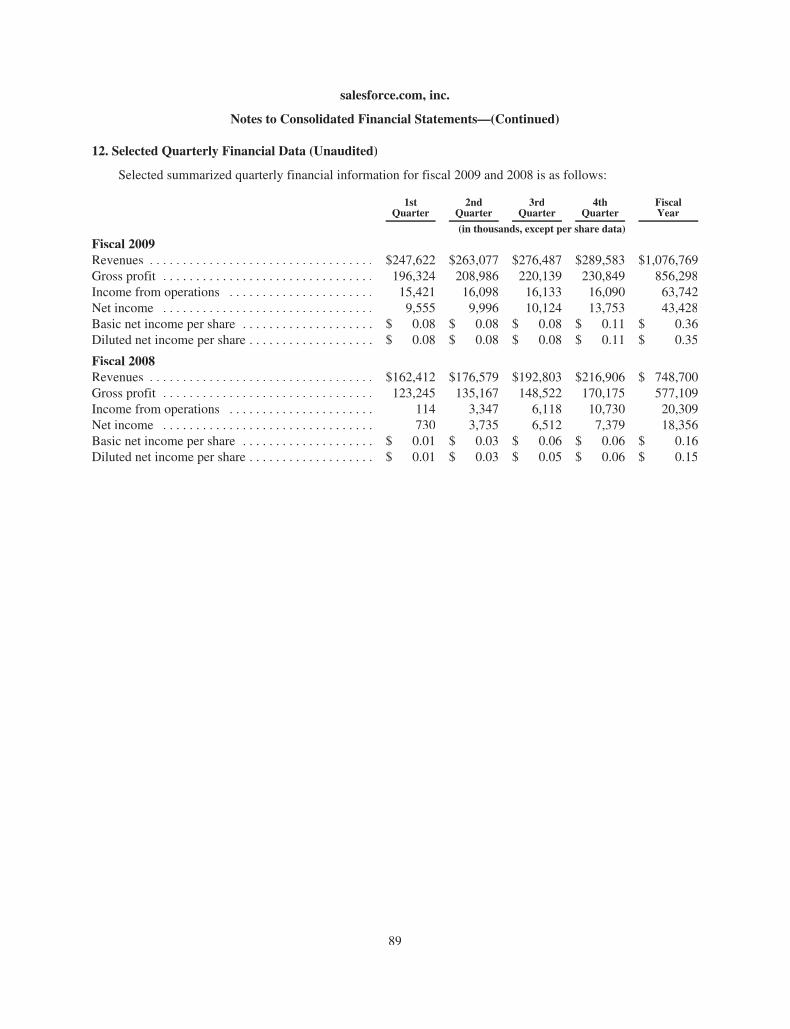
salesforce.com, inc.
Notes to Consolidated Financial Statements—(Continued)
12. Selected Quarterly Financial Data (Unaudited)
Selected summarized quarterly financial information for fiscal 2009 and 2008 is as follows:
1stQuarter
2ndQuarter
3rdQuarter
4thQuarter
FiscalYear
(in thousands, except per share data)
Fiscal 2009Revenues . . . . . . . . . . . . . . . . . . . . . . . . . . . . . . . . . . $247,622 $263,077 $276,487 $289,583 $1,076,769Gross profit . . . . . . . . . . . . . . . . . . . . . . . . . . . . . . . . 196,324 208,986 220,139 230,849 856,298Income from operations . . . . . . . . . . . . . . . . . . . . . . 15,421 16,098 16,133 16,090 63,742Net income . . . . . . . . . . . . . . . . . . . . . . . . . . . . . . . . 9,555 9,996 10,124 13,753 43,428Basic net income per share . . . . . . . . . . . . . . . . . . . . $ 0.08 $ 0.08 $ 0.08 $ 0.11 $ 0.36Diluted net income per share . . . . . . . . . . . . . . . . . . . $ 0.08 $ 0.08 $ 0.08 $ 0.11 $ 0.35
Fiscal 2008Revenues . . . . . . . . . . . . . . . . . . . . . . . . . . . . . . . . . . $162,412 $176,579 $192,803 $216,906 $ 748,700Gross profit . . . . . . . . . . . . . . . . . . . . . . . . . . . . . . . . 123,245 135,167 148,522 170,175 577,109Income from operations . . . . . . . . . . . . . . . . . . . . . . 114 3,347 6,118 10,730 20,309Net income . . . . . . . . . . . . . . . . . . . . . . . . . . . . . . . . 730 3,735 6,512 7,379 18,356Basic net income per share . . . . . . . . . . . . . . . . . . . . $ 0.01 $ 0.03 $ 0.06 $ 0.06 $ 0.16Diluted net income per share . . . . . . . . . . . . . . . . . . . $ 0.01 $ 0.03 $ 0.05 $ 0.06 $ 0.15
89
ITEM 9. CHANGES IN AND DISAGREEMENTSWITH ACCOUNTANTS ON ACCOUNTING ANDFINANCIAL DISCLOSURE
None.
ITEM 9A. CONTROLS AND PROCEDURES
(a) Evaluation of disclosure controls and procedures
Our management with the participation of our Chief Executive Officer and our Chief Financial Officer,evaluated the effectiveness of our disclosure controls and procedures, as such term is defined in Rules 13a-15(e)or 15d-15(e) promulgated under the Securities Exchange Act of 1934, as amended, as of the end of the periodcovered by this Annual Report on Form 10-K (the “Evaluation Date”). Based on this evaluation, our ChiefExecutive Officer and Chief Financial Officer concluded as of the Evaluation Date that our disclosure controlsand procedures were effective to provide reasonable assurance that the information required to be disclosed by usin periodic SEC reports is accumulated and communicated to our management, including our Chief ExecutiveOfficer and Chief Financial Officer, as appropriate to allow timely decisions regarding required disclosure, andthat such information is recorded, processed, summarized and reported within the time periods specified in SECrules and forms.
(b) Management’s Report on Internal Control over Financial Reporting
Our management is responsible for establishing and maintaining adequate internal control over financialreporting, as such term is defined in Exchange Act Rules 13a-15(f) and 15d-15(f). Under the supervision andwith the participation of our management, including our Chief Executive Officer and Chief Financial Officer, weconducted an evaluation of the effectiveness of our internal control over financial reporting as of January 31,2009 based on the guidelines established in Internal Control—Integrated Framework issued by the Committee ofSponsoring Organizations of the Treadway Commission (COSO). Our internal control over financial reportingincludes policies and procedures that provide reasonable assurance regarding the reliability of financial reportingand the preparation of financial statements for external reporting purposes in accordance with U.S. generallyaccepted accounting principles.
Based on the results of our evaluation, our management concluded that our internal control over financialreporting was effective as of January 31, 2009. We reviewed the results of management’s assessment with ourAudit Committee.
The effectiveness of our internal control over financial reporting as of January 31, 2009 has been audited byErnst & Young LLP, an independent registered public accounting firm, as stated in its report which is included inItem 8 of this Annual Report on Form 10-K.
(c) Changes in internal control over financial reporting
There was no change in our internal control over financial reporting that occurred during the quarter endedJanuary 31, 2009 that has materially affected, or is reasonably likely to materially affect, our internal control overfinancial reporting.
(d) Inherent Limitations on Effectiveness of Controls
Our management, including our Chief Executive Officer and Chief Financial Officer, do not expect that ourdisclosure controls or our internal control over financial reporting will prevent all errors and all fraud. A controlsystem, no matter how well conceived and operated, can provide only reasonable, not absolute, assurance that theobjectives of the control system are met. Further, the design of a control system must reflect the fact that thereare resource constraints, and the benefits of controls must be considered relative to their costs. Because of the
90
inherent limitations in all control systems, no evaluation of controls can provide absolute assurance that allcontrol issues and instances of fraud, if any, within the Company have been detected. These inherent limitationsinclude the realities that judgments in decision-making can be faulty, and that breakdowns can occur because of asimple error or mistake. Additionally, controls can be circumvented by the individual acts of some persons, bycollusion of two or more people or by management override of the controls. The design of any system of controlsalso is based in part upon certain assumptions about the likelihood of future events, and there can be no assurancethat any design will succeed in achieving its stated goals under all potential future conditions; over time, controlsmay become inadequate because of changes in conditions, or the degree of compliance with policies orprocedures may deteriorate. Because of the inherent limitations in a cost-effective control system, misstatementsdue to error or fraud may occur and not be detected.
ITEM 9B. OTHER INFORMATION
Not applicable.
91
PART III
ITEM 10. DIRECTORS, EXECUTIVE OFFICERS OF THE REGISTRANT AND CORPORATEGOVERNANCEMATTERS
The information concerning our directors, compliance with Section 16(a) of the Securities Exchange Act of1934, as amended, our code of ethics that applies to our principal executive officer, principal financial officer andprincipal accounting officer, our audit committee and any changes to the process by which stockholders mayrecommend nominees to the Board required by this Item are incorporated herein by reference to informationcontained in the Proxy Statement, including “Election of Directors,” “Corporate Governance and BoardCommittees,” and “Section 16(a) Beneficial Ownership Reporting Compliance.”
The information concerning our executive officers required by this Item is incorporated by reference hereinto the section of this Report in Part I, entitled “Executive Officers of the Registrant.”
We have adopted a Code of Conduct that applies to all employees, including our principal executive officer,Marc Benioff, principal financial and accounting officer, Graham Smith, and all other executive officers. TheCode of Conduct is available on our Web site at http://www.salesforce.com/company/investor/governance/. A//copy may also be obtained without charge by contacting Investor Relations, salesforce.com, inc., The Landmark@ One Market, Suite 300, San Francisco, California 94105 or by calling (415) 901-7000.
We plan to post on our Web site at the address described above any future amendments or waivers of ourCode of Conduct.
ITEM 11. EXECUTIVE COMPENSATION
The information required by this Item is incorporated herein by reference to information contained in theProxy Statement, including “Compensation Discussion and Analysis,” “Committee Reports,” “Election ofDirectors” and “Executive Compensation and Other Matters.”
ITEM 12. SECURITY OWNERSHIP OF CERTAIN BENEFICIAL OWNERS ANDMANAGEMENTAND RELATED STOCKHOLDERMATTERS
The information required by this Item is incorporated herein by reference to information contained in theProxy Statement, including “Security Ownership of Certain Beneficial Owners and Management and RelatedStockholder Matters” and “Equity Compensation Plan Information.”
ITEM 13. CERTAIN RELATIONSHIPS AND RELATED TRANSACTIONS AND DIRECTORINDEPENDENCE
The information required by this Item is incorporated herein by reference to information contained in theProxy Statement, including “Election of Directors” and “Employment Contracts and Certain Transactions.”
ITEM 14. PRINCIPAL ACCOUNTING FEES AND SERVICES
The information required by this Item is incorporated herein by reference to information contained in theProxy Statement, including “Ratification of Appointment of Independent Auditors.”
92
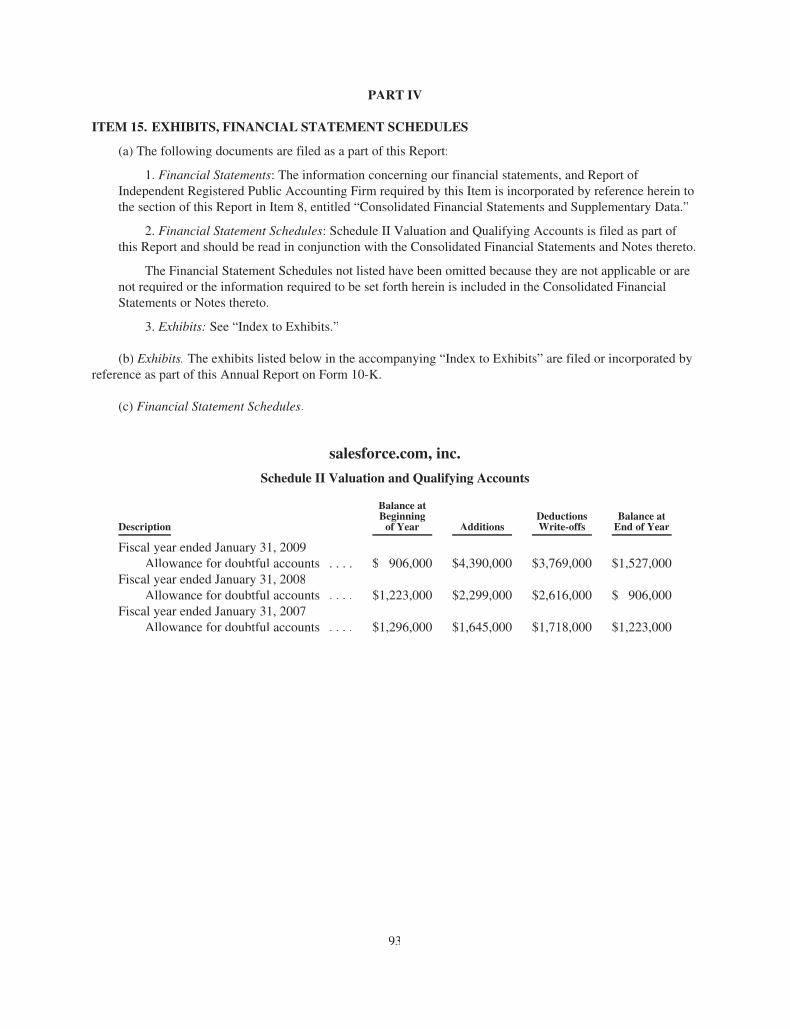
PART IV
ITEM 15. EXHIBITS, FINANCIAL STATEMENT SCHEDULES
(a) The following documents are filed as a part of this Report:
1. Financial Statements: The information concerning our financial statements, and Report ofIndependent Registered Public Accounting Firm required by this Item is incorporated by reference herein tothe section of this Report in Item 8, entitled “Consolidated Financial Statements and Supplementary Data.”
2. Financial Statement Schedules: Schedule II Valuation and Qualifying Accounts is filed as part ofthis Report and should be read in conjunction with the Consolidated Financial Statements and Notes thereto.
The Financial Statement Schedules not listed have been omitted because they are not applicable or arenot required or the information required to be set forth herein is included in the Consolidated FinancialStatements or Notes thereto.
3. Exhibits: See “Index to Exhibits.”
(b) Exhibits. The exhibits listed below in the accompanying “Index to Exhibits” are filed or incorporated byreference as part of this Annual Report on Form 10-K.
(c) Financial Statement Schedules.
salesforce.com, inc.
Schedule II Valuation and Qualifying Accounts
Description
Balance atBeginningof Year Additions
DeductionsWrite-offs
Balance atEnd of Year
Fiscal year ended January 31, 2009Allowance for doubtful accounts . . . . $ 906,000 $4,390,000 $3,769,000 $1,527,000
Fiscal year ended January 31, 2008Allowance for doubtful accounts . . . . $1,223,000 $2,299,000 $2,616,000 $ 906,000
Fiscal year ended January 31, 2007Allowance for doubtful accounts . . . . $1,296,000 $1,645,000 $1,718,000 $1,223,000
93

SIGNATURES
Pursuant to the requirements of Section 13 or 15(d) of the Securities Exchange Act of 1934, the registrant has dulycaused this report to be signed on its behalf by the undersigned thereunto duly authorized.
Dated: March 9, 2009
salesforce.com, inc.
/s/ GRAHAM SMITH
Graham SmithChief Financial Officer
(Principal Financial Officer and Duly Authorized Officer)
POWER OF ATTORNEY AND SIGNATURES
KNOW ALL PERSONS BY THESE PRESENT, that each person whose signature appears below constitutes andappoints Marc Benioff, Graham Smith and David Schellhase, his attorney-in-fact, each with the power of substitution,for him in any and all capacities, to sign any amendments to this annual report on Form 10-K, and to file the same, withexhibits thereto and other documents in connection therewith, with the Securities and Exchange Commission, herebyratifying and confirming all that said attorney-in-fact, or his substitute or substitutes, may do or cause to be done byvirtue hereof.
Pursuant to the requirements of the Securities Exchange Act of 1934, this report has been signed below by thefollowing persons on behalf of the registrant and in the capacities and on the dates indicated.
Signature Title Date
/S/ MARC BENIOFF
Marc Benioff
Chairman of the Board of Directorsand Chief Executive Officer(Principal Executive Officer)
March 9, 2009
/S/ GRAHAM SMITH
Graham Smith
Chief Financial Officer (PrincipalFinancial & Accounting Officer)
March 9, 2009
/S/ CRAIG CONWAY
Craig Conway
Director March 9, 2009
/S/ ALAN HASSENFELD
Alan Hassenfeld
Director March 9, 2009
/S/ CRAIG RAMSEY
Craig Ramsey
Director March 9, 2009
/S/ SANFORD R. ROBERTSON
Sanford R. Robertson
Director March 9, 2009
/S/ STRATTON SCLAVOSStratton Sclavos
Director March 9, 2009
/S/ LARRY TOMLINSON
Larry Tomlinson
Director March 9, 2009
/S/ MAYNARD WEBB
Maynard Webb
Director March 9, 2009
/S/ SHIRLEY YOUNG
Shirley Young
Director March 9, 2009
94

Index to Exhibits
Exhibit 3.1 (1) Amended and Restated Certificate of Incorporation of salesforce.com, inc.
Exhibit 3.2 (2) Amended and Restated Bylaws of salesforce.com, inc.
Exhibit 4.1 (1) Specimen Common Stock Certificate
Exhibit 10.1* (1) Form of Indemnification Agreement between salesforce.com, inc and its officers anddirectors
Exhibit 10.2* (3) 1999 Stock Option Plan, as amended
Exhibit 10.3* (4) 2004 Equity Incentive Plan, as amended
Exhibit 10.4* (1) 2004 Employee Stock Purchase Plan
Exhibit 10.5* (5) 2004 Outside Directors Stock Plan, as amended
Exhibit 10.6* (6) 2006 Inducement Equity Incentive Plan
Exhibit 10.7** (3) Master Service Agreement dated May 17, 2005 between salesforce.com, inc. and Equinix,Inc.
Exhibit 10.10 Resource Sharing Agreement dated as of January 29, 2009 between salesforce.com, inc.,salesforce.com foundation, and salesforce.org
Exhibit 10.11 (7) Joint Venture Agreement dated as of December 7, 2000 among salesforce.com, inc.,SunBridge, Inc. and Kabushiki Kaisha salesforce.com
Exhibit 10.12* Form of Offer Letter and schedule of omitted details thereto
Exhibit 10.13* Change of Control and Retention Agreement as entered into with Marc Benioff
Exhibit 10.14* Form of Change of Control and Retention Agreement as entered into with Parker Harris,George Hu, Kenneth Juster, Graham Smith, Jim Steele, Polly Sumner and Frank vanVeenendaal
Exhibit 10.15* Change of Control and Retention Agreement as entered into with David Schellhase
Exhibit 21.1 List of Subsidiaries
Exhibit 23.1 Consent of Independent Registered Public Accounting Firm
Exhibit 24.1 Power of Attorney (See page 94)
Exhibit 31.1 Certification of Chief Executive Officer pursuant to Exchange Act Rule 13a-14(a) or 15(d)-14(a), as adopted pursuant to Section 302 of the Sarbanes-Oxley Act of 2002
Exhibit 31.2 Certification of Chief Financial Officer pursuant to Exchange Act Rule 13a-14(a) or 15(d)-14(a), as adopted pursuant to Section 302 of the Sarbanes-Oxley Act of 2002
Exhibit 32.1 Certification of Chief Executive Officer and Chief Financial Officer pursuant to 18 U.S.C.Section 1350, as adopted pursuant to Section 906 of the Sarbanes-Oxley Act of 2002
* Denotes a management contract or compensatory plan or arrangement.** Confidential treatment has been requested for a portion of this exhibit.(1) Incorporated by reference from the Company’s registration statement on Form S-1 (No. 333-111289),
Amendment No. 3, as filed with the Securities and Exchange Commission on April 20, 2004.(2) Incorporated by reference from the Company’s Form 8-K as filed with the Securities and Exchange
Commission on December 7, 2007.

(3) Incorporated by reference from the Company’s Form 10-K for the annual period ended January 31, 2006 asfiled with the Securities and Exchange Commission on March 15, 2006.
(4) Incorporated by reference from the Company’s Form 10-Q for the quarterly period ended July 31, 2008 asfiled with the Securities and Exchange Commission on August 22, 2008.
(5) Incorporated by reference from the Company’s Form 10-Q for the quarterly period ended October 31, 2007as filed with the Securities and Exchange Commission on November 19, 2007.
(6) Incorporated by reference from the Company’s Form 10-Q for the quarterly period ended April 30, 2006 asfiled with the Securities and Exchange Commission on May 19, 2006.
(7) Incorporated by reference from the Company’s initial registration statement filing on Form S-1 (No.333-111289) as filed with the Securities and Exchange Commission on December 18, 2003.

[THIS PAGE INTENTIONALLY LEFT BLANK]

[THIS PAGE INTENTIONALLY LEFT BLANK]

[THIS PAGE INTENTIONALLY LEFT BLANK]