Embed Size (px)
Citation preview
FY13 OPERATING BUDGET
YEAR ENDING JUNE 30, 2013

i
TABLE OF CONTENTS
Resolution ..........................................................................................................1 – 2 Appropriation Review ..............................................................................................3 Budget Summary – All Funds ............................................................................ 4 - 5 Operating Fund ................................................................................................ 6 - 13 Designated Funds Summary ............................................................................................ 14 - 15 Dedicated Student Fees ...................................................................... 16 - 17 Broadcast Services .....................................................................................18 Defense & Strategic Studies ......................................................................19 Jordan Valley Innovation Center ...............................................................20 Juanita K Hammons Hall for the Performing Arts ....................................21 Auxiliary System Fund Summary ............................................................................................ 22 - 23 Athletic Facilities Summary .............................................................. 24 - 25 Athletic Facilities – Plaster Sports Complex .............................................26 Athletic Facilities – Hammons Student Center ..........................................27 Athletic Facilities – JQH Arena .................................................................28 Bookstore ...................................................................................................29 Residence Life ...........................................................................................30 Plaster Student Union ................................................................................31 Taylor Health Center ..................................................................................32 Intercollegiate Athletics .............................................................................33 Transit System ...........................................................................................34 Bill R Foster and Family Recreation Center ..............................................35 West Plains Campus Summary ....................................................................................................36 Operating....................................................................................................37 Auxiliary Summary ....................................................................................38 West Plains Bookstore ...............................................................................39 West Plains Food Service ..........................................................................40 West Plains Residence Life .......................................................................41 West Plains Recreation Center ...................................................................42

1
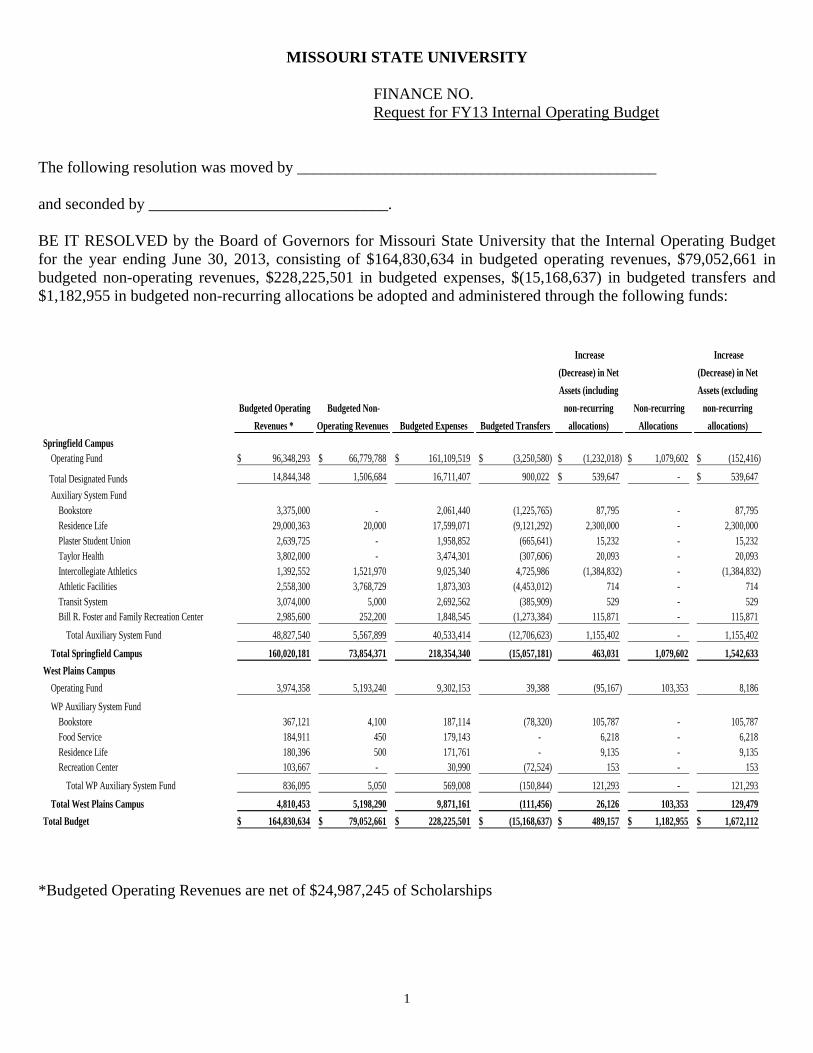
MISSOURI STATE UNIVERSITY FINANCE NO. Request for FY13 Internal Operating Budget The following resolution was moved by _____________________________________________ and seconded by ______________________________. BE IT RESOLVED by the Board of Governors for Missouri State University that the Internal Operating Budget for the year ending June 30, 2013, consisting of $164,830,634 in budgeted operating revenues, $79,052,661 in budgeted non-operating revenues, $228,225,501 in budgeted expenses, $(15,168,637) in budgeted transfers and $1,182,955 in budgeted non-recurring allocations be adopted and administered through the following funds:
Budgeted Operating
Revenues *
Budgeted Non-
Operating Revenues Budgeted Expenses Budgeted Transfers
Increase
(Decrease) in Net
Assets (including
non-recurring
allocations)
Non-recurring
Allocations
Increase
(Decrease) in Net
Assets (excluding
non-recurring
allocations)
Springfield CampusOperating Fund 96,348,293$ 66,779,788$ 161,109,519$ (3,250,580)$ (1,232,018)$ 1,079,602$ (152,416)$
Total Designated Funds 14,844,348 1,506,684 16,711,407 900,022 539,647$ - 539,647$
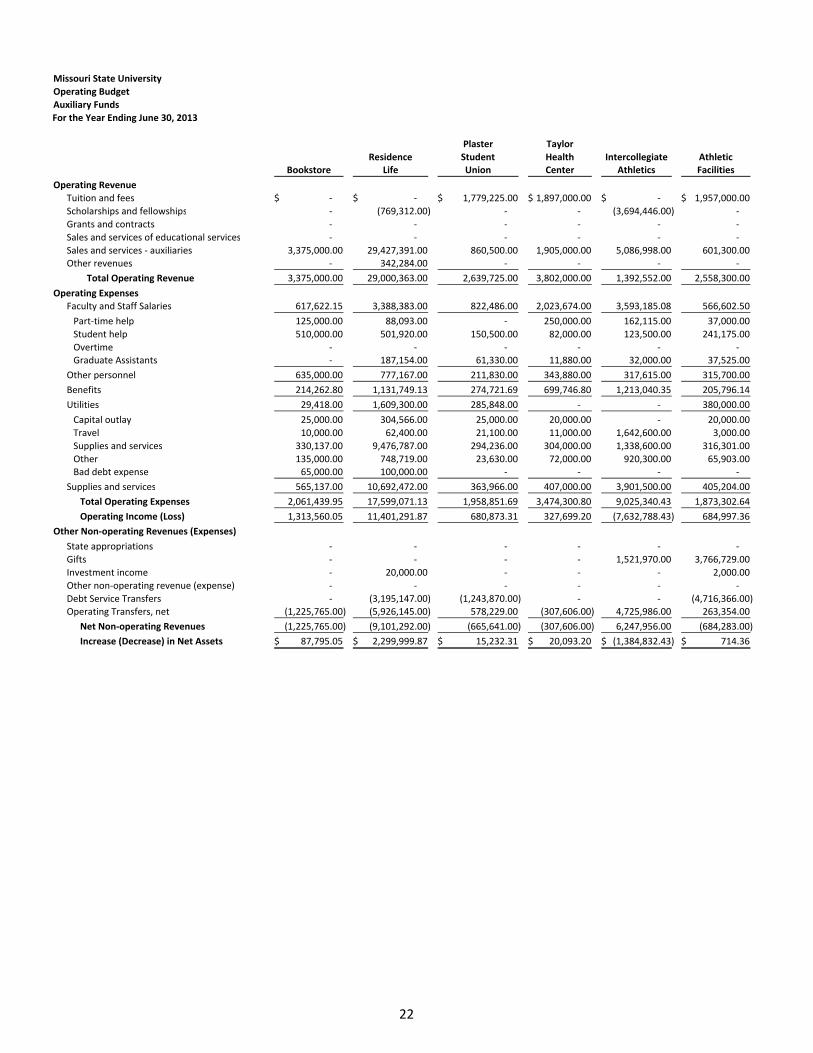
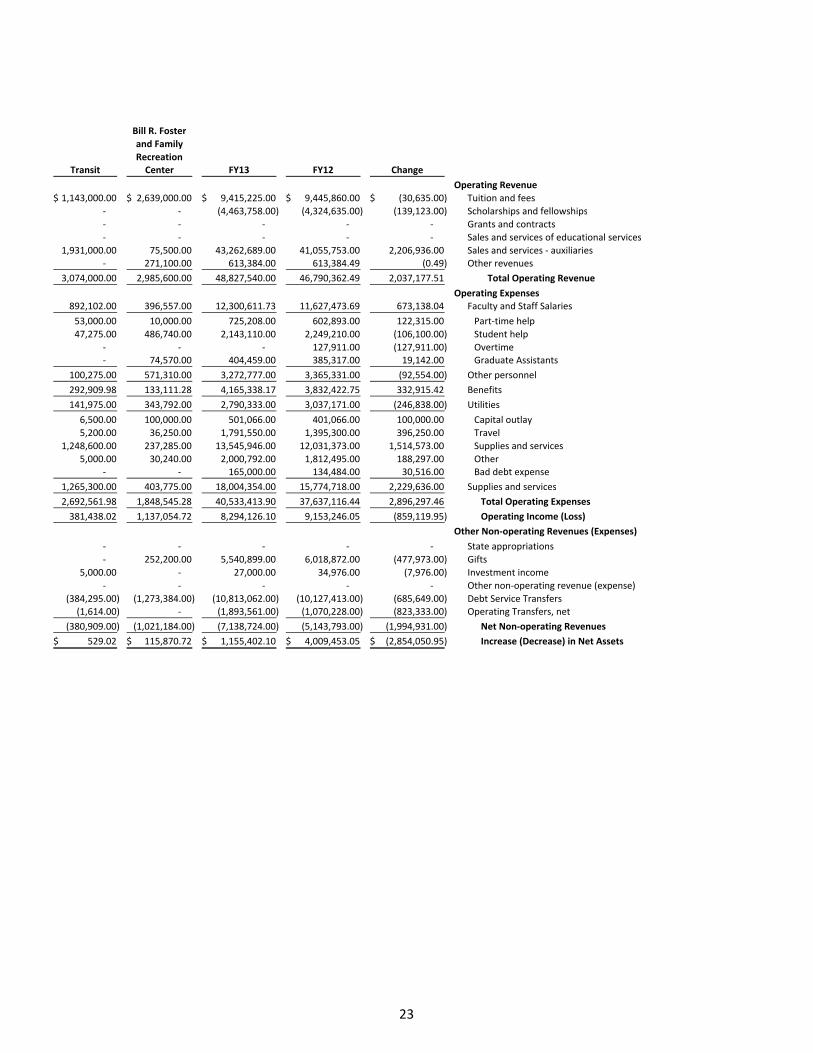
Auxiliary System FundBookstore 3,375,000 - 2,061,440 (1,225,765) 87,795 - 87,795 Residence Life 29,000,363 20,000 17,599,071 (9,121,292) 2,300,000 - 2,300,000 Plaster Student Union 2,639,725 - 1,958,852 (665,641) 15,232 - 15,232 Taylor Health 3,802,000 - 3,474,301 (307,606) 20,093 - 20,093 Intercollegiate Athletics 1,392,552 1,521,970 9,025,340 4,725,986 (1,384,832) - (1,384,832) Athletic Facilities 2,558,300 3,768,729 1,873,303 (4,453,012) 714 - 714 Transit System 3,074,000 5,000 2,692,562 (385,909) 529 - 529 Bill R. Foster and Family Recreation Center 2,985,600 252,200 1,848,545 (1,273,384) 115,871 - 115,871
Total Auxiliary System Fund 48,827,540 5,567,899 40,533,414 (12,706,623) 1,155,402 - 1,155,402
Total Springfield Campus 160,020,181 73,854,371 218,354,340 (15,057,181) 463,031 1,079,602 1,542,633
West Plains Campus
Operating Fund 3,974,358 5,193,240 9,302,153 39,388 (95,167) 103,353 8,186
WP Auxiliary System FundBookstore 367,121 4,100 187,114 (78,320) 105,787 - 105,787 Food Service 184,911 450 179,143 - 6,218 - 6,218 Residence Life 180,396 500 171,761 - 9,135 - 9,135 Recreation Center 103,667 - 30,990 (72,524) 153 - 153
Total WP Auxiliary System Fund 836,095 5,050 569,008 (150,844) 121,293 - 121,293
Total West Plains Campus 4,810,453 5,198,290 9,871,161 (111,456) 26,126 103,353 129,479
Total Budget 164,830,634$ 79,052,661$ 228,225,501$ (15,168,637)$ 489,157$ 1,182,955$ 1,672,112$
*Budgeted Operating Revenues are net of $24,987,245 of Scholarships
2
_________________________________ Gordon Elliott Chair of the Board Passed at Meeting of June 22, 2012 ______________________________ John W. McAlear Secretary
INTERNAL OPERATING
BUDGET
YEAR ENDING JUNE 30, 2013

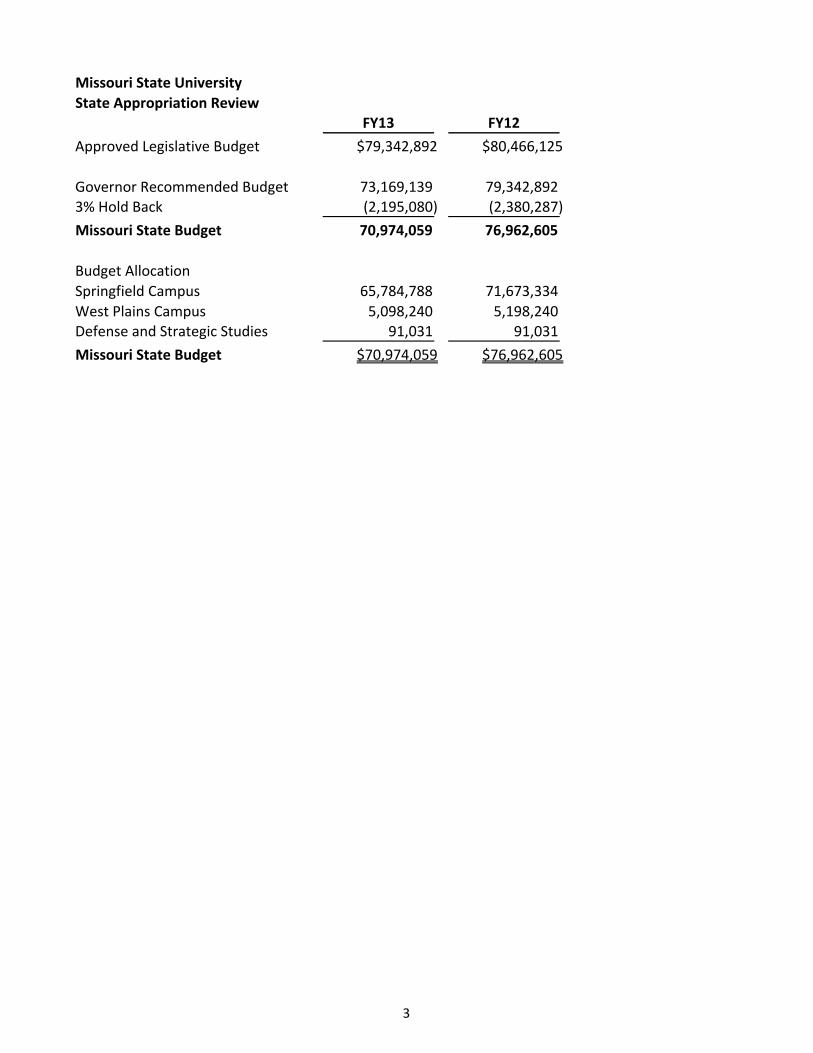
Missouri State University
State Appropriation ReviewFY13 FY12
Approved Legislative Budget $79,342,892 $80,466,125
Governor Recommended Budget 73,169,139 79,342,892 3% Hold Back (2,195,080) (2,380,287)
Missouri State Budget 70,974,059 76,962,605
Budget Allocation
Springfield Campus 65,784,788 71,673,334
West Plains Campus 5,098,240 5,198,240 Defense and Strategic Studies 91,031 91,031
Missouri State Budget $70,974,059 $76,962,605
3
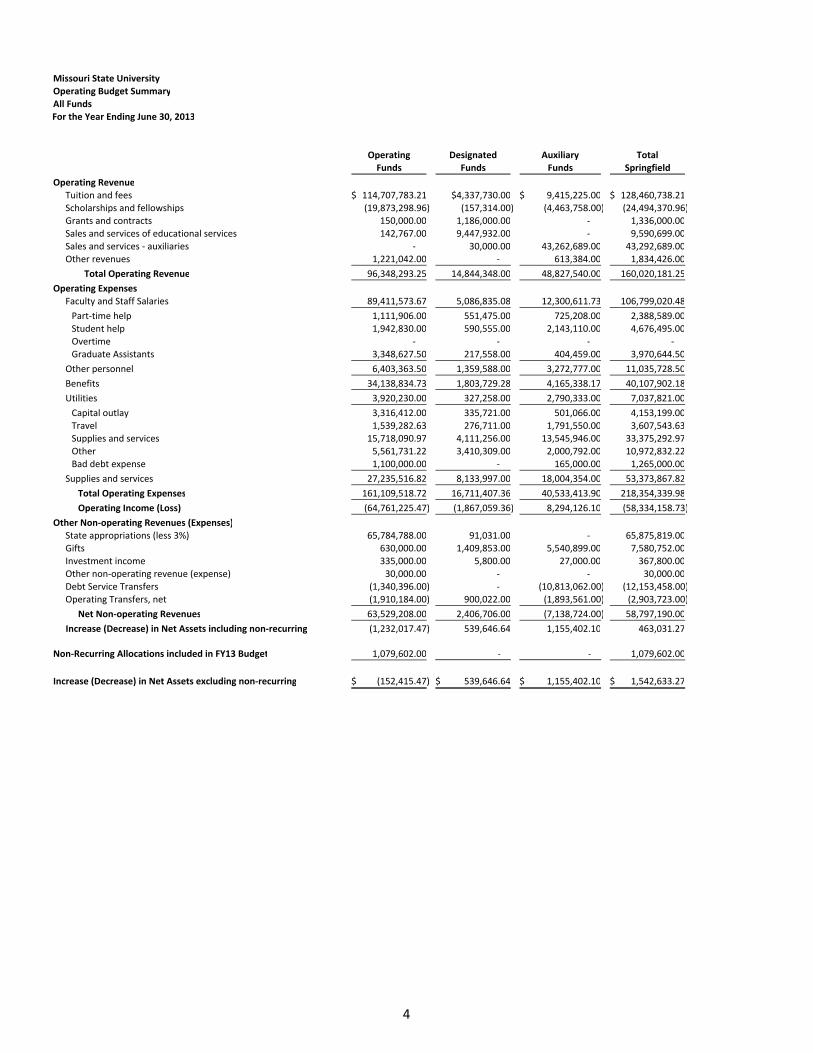
Missouri State UniversityOperating Budget Summary
All Funds For the Year Ending June 30, 2013
Operating Designated Auxiliary TotalFunds Funds Funds Springfield
Operating Revenue
Tuition and fees 114,707,783.21$ $4,337,730.00 9,415,225.00$ 128,460,738.21$ Scholarships and fellowships (19,873,298.96) (157,314.00) (4,463,758.00) (24,494,370.96) Grants and contracts 150,000.00 1,186,000.00 ‐ 1,336,000.00 Sales and services of educational services 142,767.00 9,447,932.00 ‐ 9,590,699.00 Sales and services ‐ auxiliaries ‐ 30,000.00 43,262,689.00 43,292,689.00 Other revenues 1,221,042.00 ‐ 613,384.00 1,834,426.00
Total Operating Revenue 96,348,293.25 14,844,348.00 48,827,540.00 160,020,181.25
Operating Expenses
Faculty and Staff Salaries 89,411,573.67 5,086,835.08 12,300,611.73 106,799,020.48
Part‐time help 1,111,906.00 551,475.00 725,208.00 2,388,589.00 Student help 1,942,830.00 590,555.00 2,143,110.00 4,676,495.00 Overtime ‐ ‐ ‐ ‐ Graduate Assistants 3,348,627.50 217,558.00 404,459.00 3,970,644.50
Other personnel 6,403,363.50 1,359,588.00 3,272,777.00 11,035,728.50
Benefits 34,138,834.73 1,803,729.28 4,165,338.17 40,107,902.18
Utilities 3,920,230.00 327,258.00 2,790,333.00 7,037,821.00
Capital outlay 3,316,412.00 335,721.00 501,066.00 4,153,199.00
Travel 1,539,282.63 276,711.00 1,791,550.00 3,607,543.63
Supplies and services 15,718,090.97 4,111,256.00 13,545,946.00 33,375,292.97
Other 5,561,731.22 3,410,309.00 2,000,792.00 10,972,832.22
Bad debt expense 1,100,000.00 ‐ 165,000.00 1,265,000.00
Supplies and services 27,235,516.82 8,133,997.00 18,004,354.00 53,373,867.82
Total Operating Expenses 161,109,518.72 16,711,407.36 40,533,413.90 218,354,339.98
Operating Income (Loss) (64,761,225.47) (1,867,059.36) 8,294,126.10 (58,334,158.73)
Other Non‐operating Revenues (Expenses)State appropriations (less 3%) 65,784,788.00 91,031.00 ‐ 65,875,819.00
Gifts 630,000.00 1,409,853.00 5,540,899.00 7,580,752.00
Investment income 335,000.00 5,800.00 27,000.00 367,800.00
Other non‐operating revenue (expense) 30,000.00 ‐ ‐ 30,000.00
Debt Service Transfers (1,340,396.00) ‐ (10,813,062.00) (12,153,458.00)
Operating Transfers, net (1,910,184.00) 900,022.00 (1,893,561.00) (2,903,723.00)
Net Non‐operating Revenues 63,529,208.00 2,406,706.00 (7,138,724.00) 58,797,190.00
Increase (Decrease) in Net Assets including non‐recurring (1,232,017.47) 539,646.64 1,155,402.10 463,031.27
Non‐Recurring Allocations included in FY13 Budget 1,079,602.00 ‐ ‐ 1,079,602.00
Increase (Decrease) in Net Assets excluding non‐recurring (152,415.47)$ 539,646.64$ 1,155,402.10$ 1,542,633.27$
4
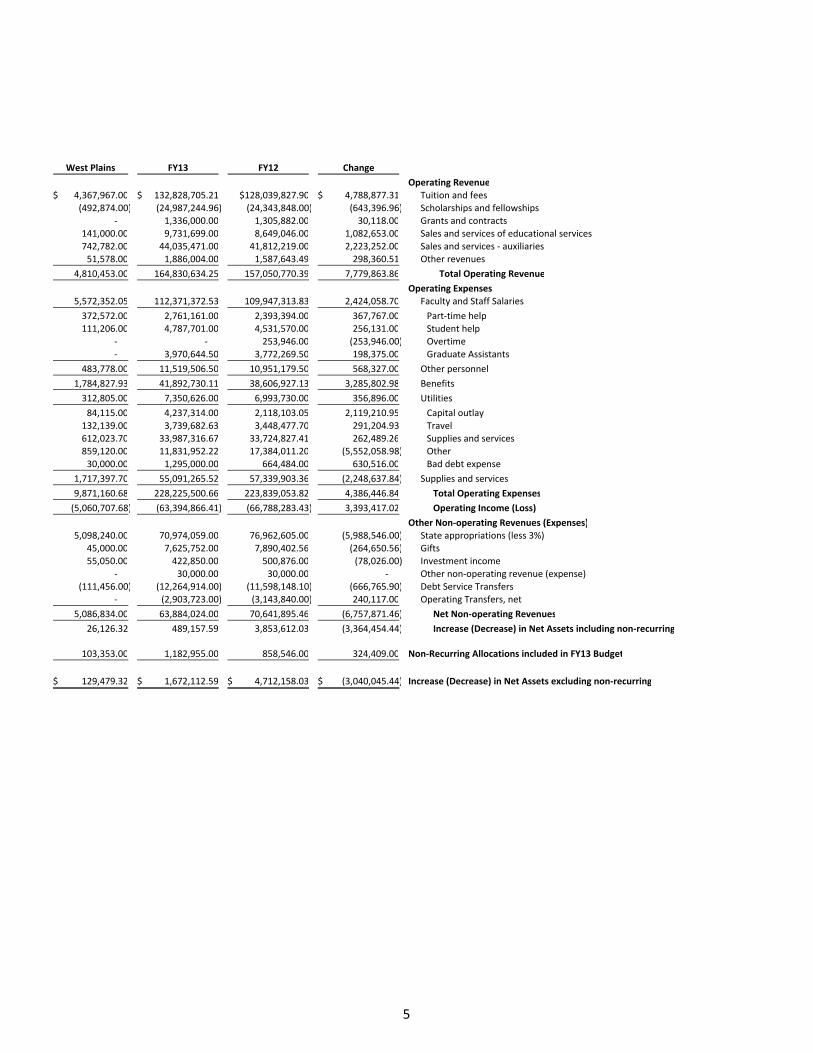
West Plains FY13 FY12 Change
Operating Revenue
4,367,967.00$ 132,828,705.21$ $128,039,827.90 4,788,877.31$ Tuition and fees(492,874.00) (24,987,244.96) (24,343,848.00) (643,396.96) Scholarships and fellowships
‐ 1,336,000.00 1,305,882.00 30,118.00 Grants and contracts141,000.00 9,731,699.00 8,649,046.00 1,082,653.00 Sales and services of educational services742,782.00 44,035,471.00 41,812,219.00 2,223,252.00 Sales and services ‐ auxiliaries51,578.00 1,886,004.00 1,587,643.49 298,360.51 Other revenues
4,810,453.00 164,830,634.25 157,050,770.39 7,779,863.86 Total Operating Revenue
Operating Expenses
5,572,352.05 112,371,372.53 109,947,313.83 2,424,058.70 Faculty and Staff Salaries
372,572.00 2,761,161.00 2,393,394.00 367,767.00 Part‐time help111,206.00 4,787,701.00 4,531,570.00 256,131.00 Student help
‐ ‐ 253,946.00 (253,946.00) Overtime‐ 3,970,644.50 3,772,269.50 198,375.00 Graduate Assistants
483,778.00 11,519,506.50 10,951,179.50 568,327.00 Other personnel
1,784,827.93 41,892,730.11 38,606,927.13 3,285,802.98 Benefits
312,805.00 7,350,626.00 6,993,730.00 356,896.00 Utilities
84,115.00 4,237,314.00 2,118,103.05 2,119,210.95 Capital outlay
132,139.00 3,739,682.63 3,448,477.70 291,204.93 Travel
612,023.70 33,987,316.67 33,724,827.41 262,489.26 Supplies and services
859,120.00 11,831,952.22 17,384,011.20 (5,552,058.98) Other
30,000.00 1,295,000.00 664,484.00 630,516.00 Bad debt expense
1,717,397.70 55,091,265.52 57,339,903.36 (2,248,637.84) Supplies and services
9,871,160.68 228,225,500.66 223,839,053.82 4,386,446.84 Total Operating Expenses
(5,060,707.68) (63,394,866.41) (66,788,283.43) 3,393,417.02 Operating Income (Loss)
Other Non‐operating Revenues (Expenses)5,098,240.00 70,974,059.00 76,962,605.00 (5,988,546.00) State appropriations (less 3%)
45,000.00 7,625,752.00 7,890,402.56 (264,650.56) Gifts
55,050.00 422,850.00 500,876.00 (78,026.00) Investment income
‐ 30,000.00 30,000.00 ‐ Other non‐operating revenue (expense)
(111,456.00) (12,264,914.00) (11,598,148.10) (666,765.90) Debt Service Transfers
‐ (2,903,723.00) (3,143,840.00) 240,117.00 Operating Transfers, net
5,086,834.00 63,884,024.00 70,641,895.46 (6,757,871.46) Net Non‐operating Revenues
26,126.32 489,157.59 3,853,612.03 (3,364,454.44) Increase (Decrease) in Net Assets including non‐recurring
103,353.00 1,182,955.00 858,546.00 324,409.00 Non‐Recurring Allocations included in FY13 Budget
129,479.32$ 1,672,112.59$ 4,712,158.03$ (3,040,045.44)$ Increase (Decrease) in Net Assets excluding non‐recurring
5

OPERATING FUND
YEAR ENDING JUNE 30, 2013
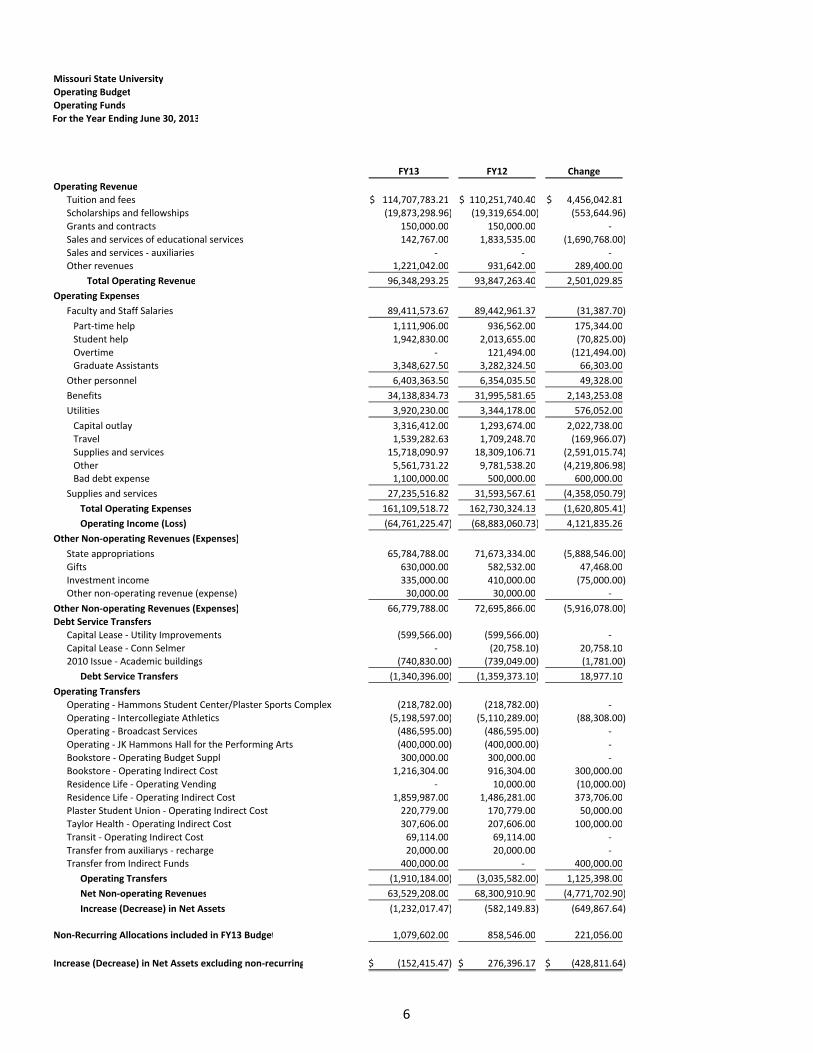
Missouri State University
Operating Budget
Operating Funds
For the Year Ending June 30, 2013
FY13 FY12 Change
Operating Revenue
Tuition and fees 114,707,783.21$ 110,251,740.40$ 4,456,042.81$
Scholarships and fellowships (19,873,298.96) (19,319,654.00) (553,644.96)
Grants and contracts 150,000.00 150,000.00 ‐
Sales and services of educational services 142,767.00 1,833,535.00 (1,690,768.00)
Sales and services ‐ auxiliaries ‐ ‐ ‐ Other revenues 1,221,042.00 931,642.00 289,400.00
Total Operating Revenue 96,348,293.25 93,847,263.40 2,501,029.85
Operating Expenses
Faculty and Staff Salaries 89,411,573.67 89,442,961.37 (31,387.70)
Part‐time help 1,111,906.00 936,562.00 175,344.00
Student help 1,942,830.00 2,013,655.00 (70,825.00)
Overtime ‐ 121,494.00 (121,494.00) Graduate Assistants 3,348,627.50 3,282,324.50 66,303.00
Other personnel 6,403,363.50 6,354,035.50 49,328.00
Benefits 34,138,834.73 31,995,581.65 2,143,253.08
Utilities 3,920,230.00 3,344,178.00 576,052.00
Capital outlay 3,316,412.00 1,293,674.00 2,022,738.00
Travel 1,539,282.63 1,709,248.70 (169,966.07)
Supplies and services 15,718,090.97 18,309,106.71 (2,591,015.74)
Other 5,561,731.22 9,781,538.20 (4,219,806.98) Bad debt expense 1,100,000.00 500,000.00 600,000.00
Supplies and services 27,235,516.82 31,593,567.61 (4,358,050.79)
Total Operating Expenses 161,109,518.72 162,730,324.13 (1,620,805.41)
Operating Income (Loss) (64,761,225.47) (68,883,060.73) 4,121,835.26
Other Non‐operating Revenues (Expenses)
State appropriations 65,784,788.00 71,673,334.00 (5,888,546.00)
Gifts 630,000.00 582,532.00 47,468.00
Investment income 335,000.00 410,000.00 (75,000.00) Other non‐operating revenue (expense) 30,000.00 30,000.00 ‐
Other Non‐operating Revenues (Expenses) 66,779,788.00 72,695,866.00 (5,916,078.00)
Debt Service Transfers
Capital Lease ‐ Utility Improvements (599,566.00) (599,566.00) ‐
Capital Lease ‐ Conn Selmer ‐ (20,758.10) 20,758.10 2010 Issue ‐ Academic buildings (740,830.00) (739,049.00) (1,781.00)
Debt Service Transfers (1,340,396.00) (1,359,373.10) 18,977.10
Operating Transfers
Operating ‐ Hammons Student Center/Plaster Sports Complex (218,782.00) (218,782.00) ‐
Operating ‐ Intercollegiate Athletics (5,198,597.00) (5,110,289.00) (88,308.00)
Operating ‐ Broadcast Services (486,595.00) (486,595.00) ‐
Operating ‐ JK Hammons Hall for the Performing Arts (400,000.00) (400,000.00) ‐
Bookstore ‐ Operating Budget Suppl 300,000.00 300,000.00 ‐
Bookstore ‐ Operating Indirect Cost 1,216,304.00 916,304.00 300,000.00
Residence Life ‐ Operating Vending ‐ 10,000.00 (10,000.00)
Residence Life ‐ Operating Indirect Cost 1,859,987.00 1,486,281.00 373,706.00
Plaster Student Union ‐ Operating Indirect Cost 220,779.00 170,779.00 50,000.00
Taylor Health ‐ Operating Indirect Cost 307,606.00 207,606.00 100,000.00
Transit ‐ Operating Indirect Cost 69,114.00 69,114.00 ‐
Transfer from auxiliarys ‐ recharge 20,000.00 20,000.00 ‐ Transfer from Indirect Funds 400,000.00 ‐ 400,000.00
Operating Transfers (1,910,184.00) (3,035,582.00) 1,125,398.00
Net Non‐operating Revenues 63,529,208.00 68,300,910.90 (4,771,702.90)
Increase (Decrease) in Net Assets (1,232,017.47) (582,149.83) (649,867.64)
Non‐Recurring Allocations included in FY13 Budget 1,079,602.00 858,546.00 221,056.00
Increase (Decrease) in Net Assets excluding non‐recurring (152,415.47)$ 276,396.17$ (428,811.64)$
6
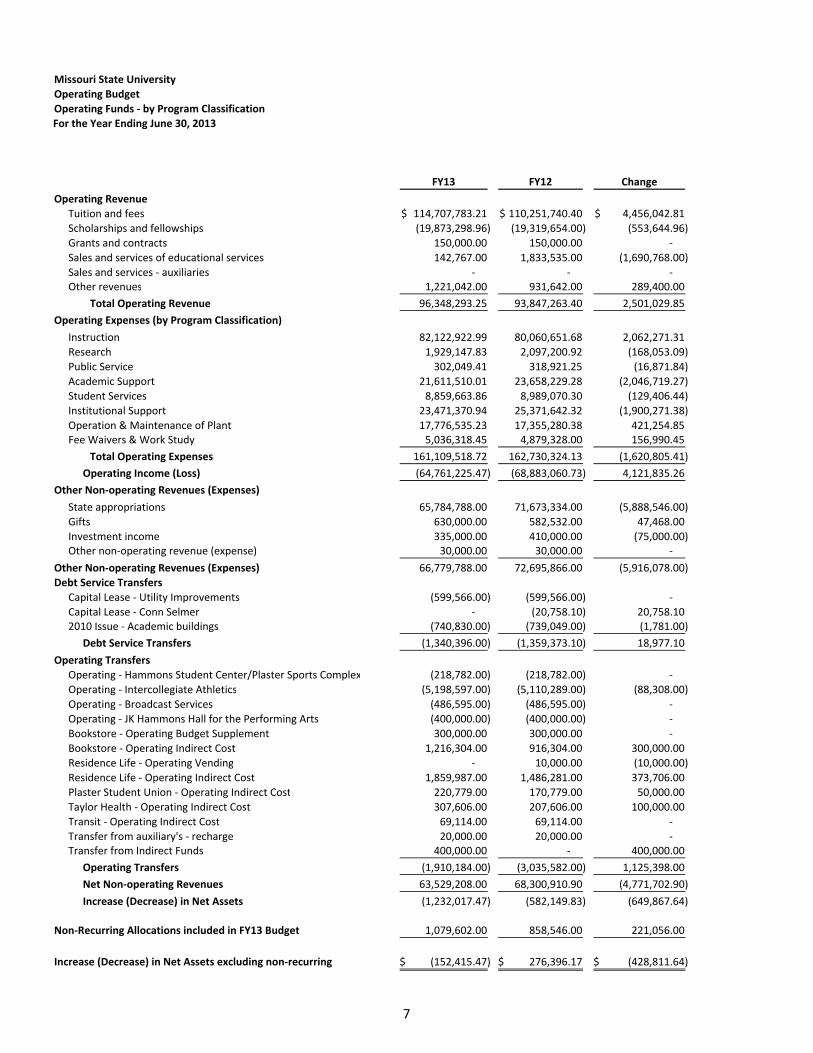
Missouri State University
Operating Budget
Operating Funds ‐ by Program Classification
For the Year Ending June 30, 2013
FY13 FY12 Change
Operating Revenue
Tuition and fees 114,707,783.21$ 110,251,740.40$ 4,456,042.81$
Scholarships and fellowships (19,873,298.96) (19,319,654.00) (553,644.96)
Grants and contracts 150,000.00 150,000.00 ‐
Sales and services of educational services 142,767.00 1,833,535.00 (1,690,768.00)
Sales and services ‐ auxiliaries ‐ ‐ ‐ Other revenues 1,221,042.00 931,642.00 289,400.00
Total Operating Revenue 96,348,293.25 93,847,263.40 2,501,029.85
Operating Expenses (by Program Classification)
Instruction 82,122,922.99 80,060,651.68 2,062,271.31
Research 1,929,147.83 2,097,200.92 (168,053.09)
Public Service 302,049.41 318,921.25 (16,871.84)
Academic Support 21,611,510.01 23,658,229.28 (2,046,719.27)
Student Services 8,859,663.86 8,989,070.30 (129,406.44)
Institutional Support 23,471,370.94 25,371,642.32 (1,900,271.38)
Operation & Maintenance of Plant 17,776,535.23 17,355,280.38 421,254.85 Fee Waivers & Work Study 5,036,318.45 4,879,328.00 156,990.45
Total Operating Expenses 161,109,518.72 162,730,324.13 (1,620,805.41)
Operating Income (Loss) (64,761,225.47) (68,883,060.73) 4,121,835.26
Other Non‐operating Revenues (Expenses)
State appropriations 65,784,788.00 71,673,334.00 (5,888,546.00)
Gifts 630,000.00 582,532.00 47,468.00
Investment income 335,000.00 410,000.00 (75,000.00) Other non‐operating revenue (expense) 30,000.00 30,000.00 ‐
Other Non‐operating Revenues (Expenses) 66,779,788.00 72,695,866.00 (5,916,078.00)
Debt Service Transfers
Capital Lease ‐ Utility Improvements (599,566.00) (599,566.00) ‐
Capital Lease ‐ Conn Selmer ‐ (20,758.10) 20,758.10 2010 Issue ‐ Academic buildings (740,830.00) (739,049.00) (1,781.00)
Debt Service Transfers (1,340,396.00) (1,359,373.10) 18,977.10
Operating Transfers
Operating ‐ Hammons Student Center/Plaster Sports Complex (218,782.00) (218,782.00) ‐
Operating ‐ Intercollegiate Athletics (5,198,597.00) (5,110,289.00) (88,308.00)
Operating ‐ Broadcast Services (486,595.00) (486,595.00) ‐
Operating ‐ JK Hammons Hall for the Performing Arts (400,000.00) (400,000.00) ‐
Bookstore ‐ Operating Budget Supplement 300,000.00 300,000.00 ‐
Bookstore ‐ Operating Indirect Cost 1,216,304.00 916,304.00 300,000.00
Residence Life ‐ Operating Vending ‐ 10,000.00 (10,000.00)
Residence Life ‐ Operating Indirect Cost 1,859,987.00 1,486,281.00 373,706.00
Plaster Student Union ‐ Operating Indirect Cost 220,779.00 170,779.00 50,000.00
Taylor Health ‐ Operating Indirect Cost 307,606.00 207,606.00 100,000.00
Transit ‐ Operating Indirect Cost 69,114.00 69,114.00 ‐
Transfer from auxiliary's ‐ recharge 20,000.00 20,000.00 ‐ Transfer from Indirect Funds 400,000.00 ‐ 400,000.00
Operating Transfers (1,910,184.00) (3,035,582.00) 1,125,398.00
Net Non‐operating Revenues 63,529,208.00 68,300,910.90 (4,771,702.90)
Increase (Decrease) in Net Assets (1,232,017.47) (582,149.83) (649,867.64)
Non‐Recurring Allocations included in FY13 Budget 1,079,602.00 858,546.00 221,056.00
Increase (Decrease) in Net Assets excluding non‐recurring (152,415.47)$ 276,396.17$ (428,811.64)$
7

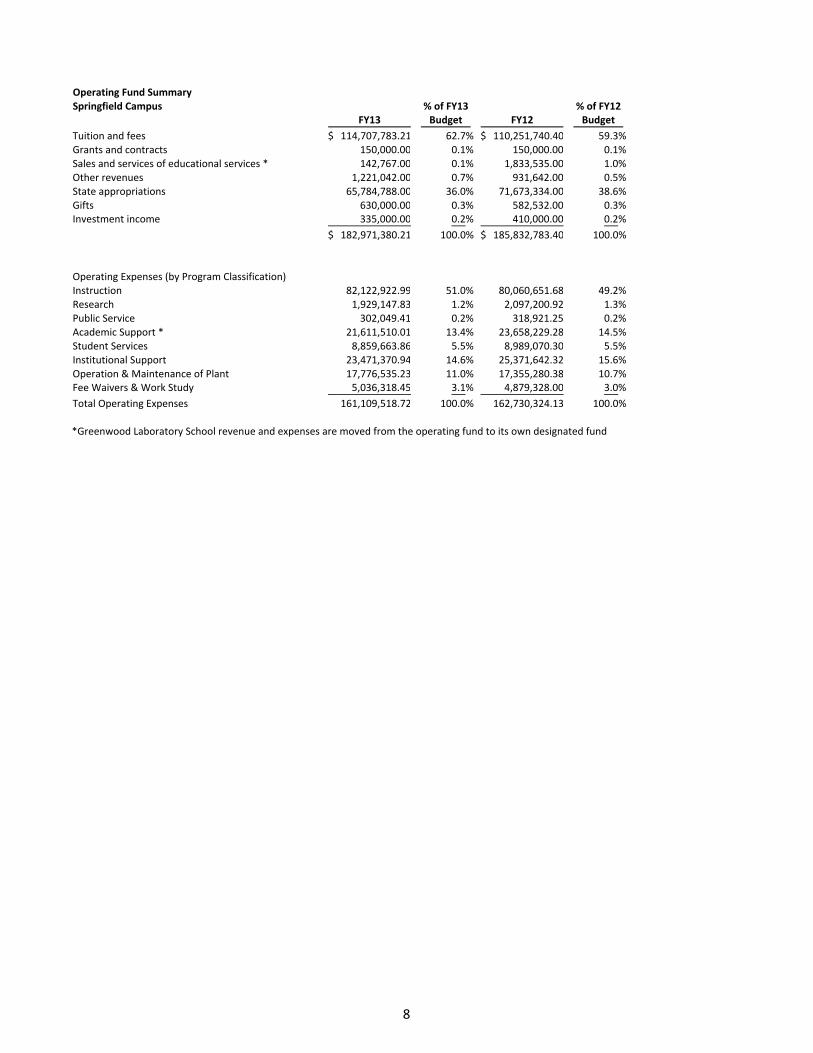
Operating Fund SummarySpringfield Campus % of FY13 % of FY12
FY13 Budget FY12 Budget
Tuition and fees 114,707,783.21$ 62.7% 110,251,740.40$ 59.3%Grants and contracts 150,000.00 0.1% 150,000.00 0.1%Sales and services of educational services * 142,767.00 0.1% 1,833,535.00 1.0%Other revenues 1,221,042.00 0.7% 931,642.00 0.5%State appropriations 65,784,788.00 36.0% 71,673,334.00 38.6%Gifts 630,000.00 0.3% 582,532.00 0.3%Investment income 335,000.00 0.2% 410,000.00 0.2%
182,971,380.21$ 100.0% 185,832,783.40$ 100.0%
Operating Expenses (by Program Classification)Instruction 82,122,922.99 51.0% 80,060,651.68 49.2%Research 1,929,147.83 1.2% 2,097,200.92 1.3%Public Service 302,049.41 0.2% 318,921.25 0.2%Academic Support * 21,611,510.01 13.4% 23,658,229.28 14.5%Student Services 8,859,663.86 5.5% 8,989,070.30 5.5%Institutional Support 23,471,370.94 14.6% 25,371,642.32 15.6%Operation & Maintenance of Plant 17,776,535.23 11.0% 17,355,280.38 10.7%Fee Waivers & Work Study 5,036,318.45 3.1% 4,879,328.00 3.0%
Total Operating Expenses 161,109,518.72 100.0% 162,730,324.13 100.0%
*Greenwood Laboratory School revenue and expenses are moved from the operating fund to its own designated fund
8
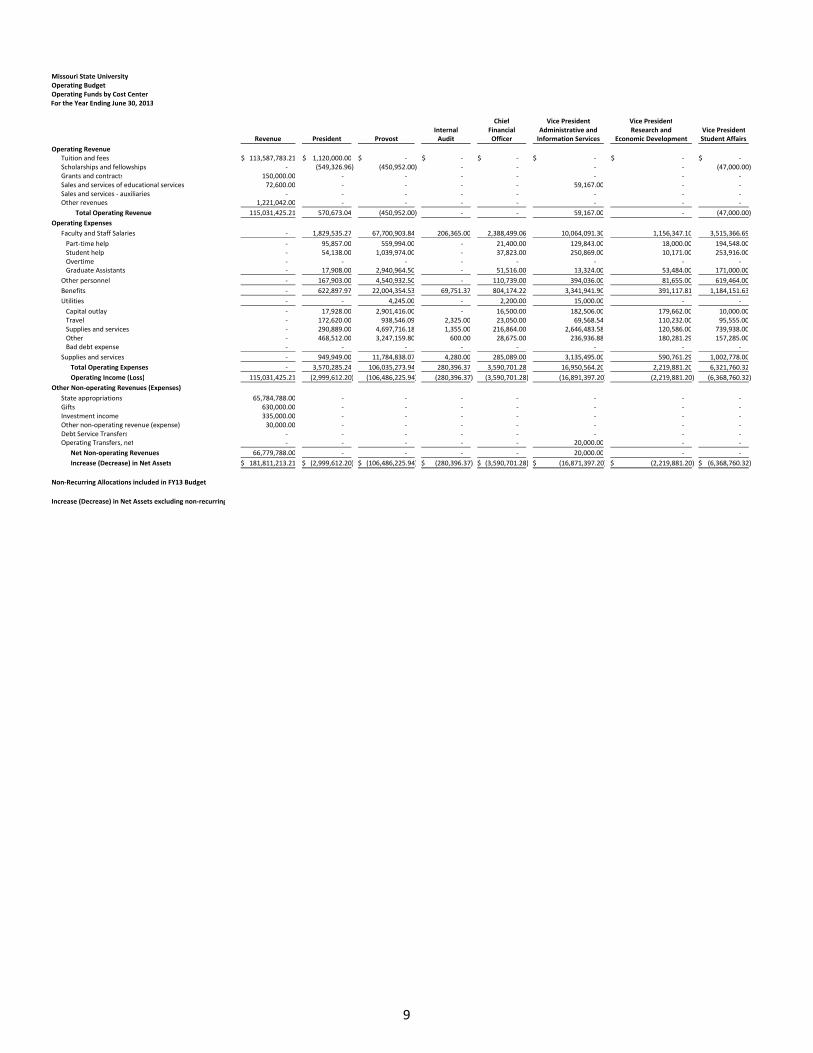
Missouri State UniversityOperating BudgetOperating Funds by Cost Center For the Year Ending June 30, 2013
Chief Vice President Vice PresidentInternal Financial Administrative and Research and Vice President
Revenue President Provost Audit Officer Information Services Economic Development Student Affairs
Operating RevenueTuition and fees 113,587,783.21$ 1,120,000.00$ ‐$ ‐$ ‐$ ‐$ ‐$ ‐$ Scholarships and fellowships ‐ (549,326.96) (450,952.00) ‐ ‐ ‐ ‐ (47,000.00) Grants and contracts 150,000.00 ‐ ‐ ‐ ‐ ‐ ‐ ‐ Sales and services of educational services 72,600.00 ‐ ‐ ‐ ‐ 59,167.00 ‐ ‐ Sales and services ‐ auxiliaries ‐ ‐ ‐ ‐ ‐ ‐ ‐ ‐ Other revenues 1,221,042.00 ‐ ‐ ‐ ‐ ‐ ‐ ‐
Total Operating Revenue 115,031,425.21 570,673.04 (450,952.00) ‐ ‐ 59,167.00 ‐ (47,000.00)
Operating Expenses
Faculty and Staff Salaries ‐ 1,829,535.27 67,700,903.84 206,365.00 2,388,499.06 10,064,091.30 1,156,347.10 3,515,366.69
Part‐time help ‐ 95,857.00 559,994.00 ‐ 21,400.00 129,843.00 18,000.00 194,548.00 Student help ‐ 54,138.00 1,039,974.00 ‐ 37,823.00 250,869.00 10,171.00 253,916.00 Overtime ‐ ‐ ‐ ‐ ‐ ‐ ‐ ‐ Graduate Assistants ‐ 17,908.00 2,940,964.50 ‐ 51,516.00 13,324.00 53,484.00 171,000.00
Other personnel ‐ 167,903.00 4,540,932.50 ‐ 110,739.00 394,036.00 81,655.00 619,464.00
Benefits ‐ 622,897.97 22,004,354.53 69,751.37 804,174.22 3,341,941.90 391,117.81 1,184,151.63
Utilities ‐ ‐ 4,245.00 ‐ 2,200.00 15,000.00 ‐ ‐
Capital outlay ‐ 17,928.00 2,901,416.00 ‐ 16,500.00 182,506.00 179,662.00 10,000.00 Travel ‐ 172,620.00 938,546.09 2,325.00 23,050.00 69,568.54 110,232.00 95,555.00 Supplies and services ‐ 290,889.00 4,697,716.18 1,355.00 216,864.00 2,646,483.58 120,586.00 739,938.00 Other ‐ 468,512.00 3,247,159.80 600.00 28,675.00 236,936.88 180,281.29 157,285.00 Bad debt expense ‐ ‐ ‐ ‐ ‐ ‐ ‐ ‐
Supplies and services ‐ 949,949.00 11,784,838.07 4,280.00 285,089.00 3,135,495.00 590,761.29 1,002,778.00
Total Operating Expenses ‐ 3,570,285.24 106,035,273.94 280,396.37 3,590,701.28 16,950,564.20 2,219,881.20 6,321,760.32
Operating Income (Loss) 115,031,425.21 (2,999,612.20) (106,486,225.94) (280,396.37) (3,590,701.28) (16,891,397.20) (2,219,881.20) (6,368,760.32)
Other Non‐operating Revenues (Expenses)
State appropriations 65,784,788.00 ‐ ‐ ‐ ‐ ‐ ‐ ‐ Gifts 630,000.00 ‐ ‐ ‐ ‐ ‐ ‐ ‐ Investment income 335,000.00 ‐ ‐ ‐ ‐ ‐ ‐ ‐ Other non‐operating revenue (expense) 30,000.00 ‐ ‐ ‐ ‐ ‐ ‐ ‐ Debt Service Transfers ‐ ‐ ‐ ‐ ‐ ‐ ‐ ‐ Operating Transfers, net ‐ ‐ ‐ ‐ ‐ 20,000.00 ‐ ‐
Net Non‐operating Revenues 66,779,788.00 ‐ ‐ ‐ ‐ 20,000.00 ‐ ‐
Increase (Decrease) in Net Assets 181,811,213.21$ (2,999,612.20)$ (106,486,225.94)$ (280,396.37)$ (3,590,701.28)$ (16,871,397.20)$ (2,219,881.20)$ (6,368,760.32)$
Non‐Recurring Allocations included in FY13 Budget
Increase (Decrease) in Net Assets excluding non‐recurring
9
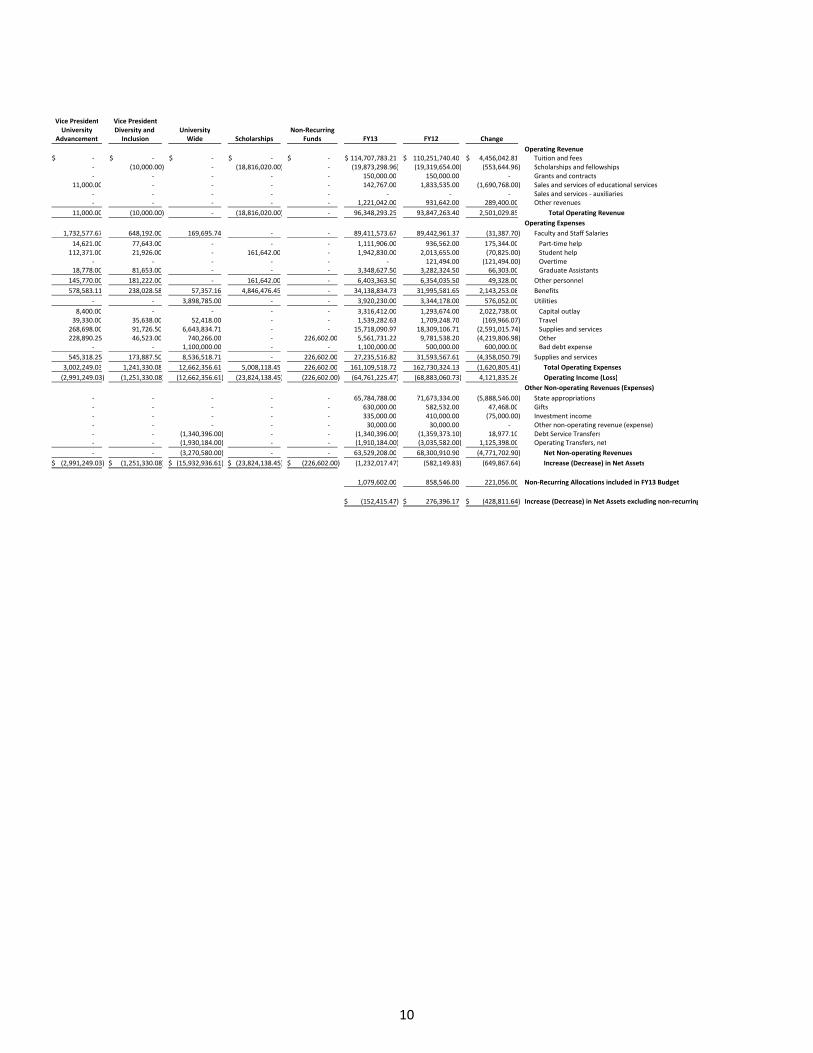
Vice President Vice PresidentUniversity Diversity and University Non‐Recurring
Advancement Inclusion Wide Scholarships Funds FY13 FY12 Change
Operating Revenue‐$ ‐$ ‐$ ‐$ ‐$ 114,707,783.21$ 110,251,740.40$ 4,456,042.81$ Tuition and fees‐ (10,000.00) ‐ (18,816,020.00) ‐ (19,873,298.96) (19,319,654.00) (553,644.96) Scholarships and fellowships‐ ‐ ‐ ‐ ‐ 150,000.00 150,000.00 ‐ Grants and contracts
11,000.00 ‐ ‐ ‐ ‐ 142,767.00 1,833,535.00 (1,690,768.00) Sales and services of educational services‐ ‐ ‐ ‐ ‐ ‐ ‐ ‐ Sales and services ‐ auxiliaries‐ ‐ ‐ ‐ ‐ 1,221,042.00 931,642.00 289,400.00 Other revenues
11,000.00 (10,000.00) ‐ (18,816,020.00) ‐ 96,348,293.25 93,847,263.40 2,501,029.85 Total Operating Revenue
Operating Expenses
1,732,577.67 648,192.00 169,695.74 ‐ ‐ 89,411,573.67 89,442,961.37 (31,387.70) Faculty and Staff Salaries
14,621.00 77,643.00 ‐ ‐ ‐ 1,111,906.00 936,562.00 175,344.00 Part‐time help112,371.00 21,926.00 ‐ 161,642.00 ‐ 1,942,830.00 2,013,655.00 (70,825.00) Student help
‐ ‐ ‐ ‐ ‐ ‐ 121,494.00 (121,494.00) Overtime18,778.00 81,653.00 ‐ ‐ ‐ 3,348,627.50 3,282,324.50 66,303.00 Graduate Assistants
145,770.00 181,222.00 ‐ 161,642.00 ‐ 6,403,363.50 6,354,035.50 49,328.00 Other personnel
578,583.11 238,028.58 57,357.16 4,846,476.45 ‐ 34,138,834.73 31,995,581.65 2,143,253.08 Benefits
‐ ‐ 3,898,785.00 ‐ ‐ 3,920,230.00 3,344,178.00 576,052.00 Utilities
8,400.00 ‐ ‐ ‐ ‐ 3,316,412.00 1,293,674.00 2,022,738.00 Capital outlay39,330.00 35,638.00 52,418.00 ‐ ‐ 1,539,282.63 1,709,248.70 (169,966.07) Travel268,698.00 91,726.50 6,643,834.71 ‐ ‐ 15,718,090.97 18,309,106.71 (2,591,015.74) Supplies and services228,890.25 46,523.00 740,266.00 ‐ 226,602.00 5,561,731.22 9,781,538.20 (4,219,806.98) Other
‐ ‐ 1,100,000.00 ‐ ‐ 1,100,000.00 500,000.00 600,000.00 Bad debt expense
545,318.25 173,887.50 8,536,518.71 ‐ 226,602.00 27,235,516.82 31,593,567.61 (4,358,050.79) Supplies and services
3,002,249.03 1,241,330.08 12,662,356.61 5,008,118.45 226,602.00 161,109,518.72 162,730,324.13 (1,620,805.41) Total Operating Expenses
(2,991,249.03) (1,251,330.08) (12,662,356.61) (23,824,138.45) (226,602.00) (64,761,225.47) (68,883,060.73) 4,121,835.26 Operating Income (Loss)
Other Non‐operating Revenues (Expenses)
‐ ‐ ‐ ‐ ‐ 65,784,788.00 71,673,334.00 (5,888,546.00) State appropriations‐ ‐ ‐ ‐ ‐ 630,000.00 582,532.00 47,468.00 Gifts‐ ‐ ‐ ‐ ‐ 335,000.00 410,000.00 (75,000.00) Investment income‐ ‐ ‐ ‐ ‐ 30,000.00 30,000.00 ‐ Other non‐operating revenue (expense)‐ ‐ (1,340,396.00) ‐ ‐ (1,340,396.00) (1,359,373.10) 18,977.10 Debt Service Transfers‐ ‐ (1,930,184.00) ‐ ‐ (1,910,184.00) (3,035,582.00) 1,125,398.00 Operating Transfers, net
‐ ‐ (3,270,580.00) ‐ ‐ 63,529,208.00 68,300,910.90 (4,771,702.90) Net Non‐operating Revenues
(2,991,249.03)$ (1,251,330.08)$ (15,932,936.61)$ (23,824,138.45)$ (226,602.00)$ (1,232,017.47) (582,149.83) (649,867.64) Increase (Decrease) in Net Assets
1,079,602.00 858,546.00 221,056.00 Non‐Recurring Allocations included in FY13 Budget
(152,415.47)$ 276,396.17$ (428,811.64)$ Increase (Decrease) in Net Assets excluding non‐recurring
10
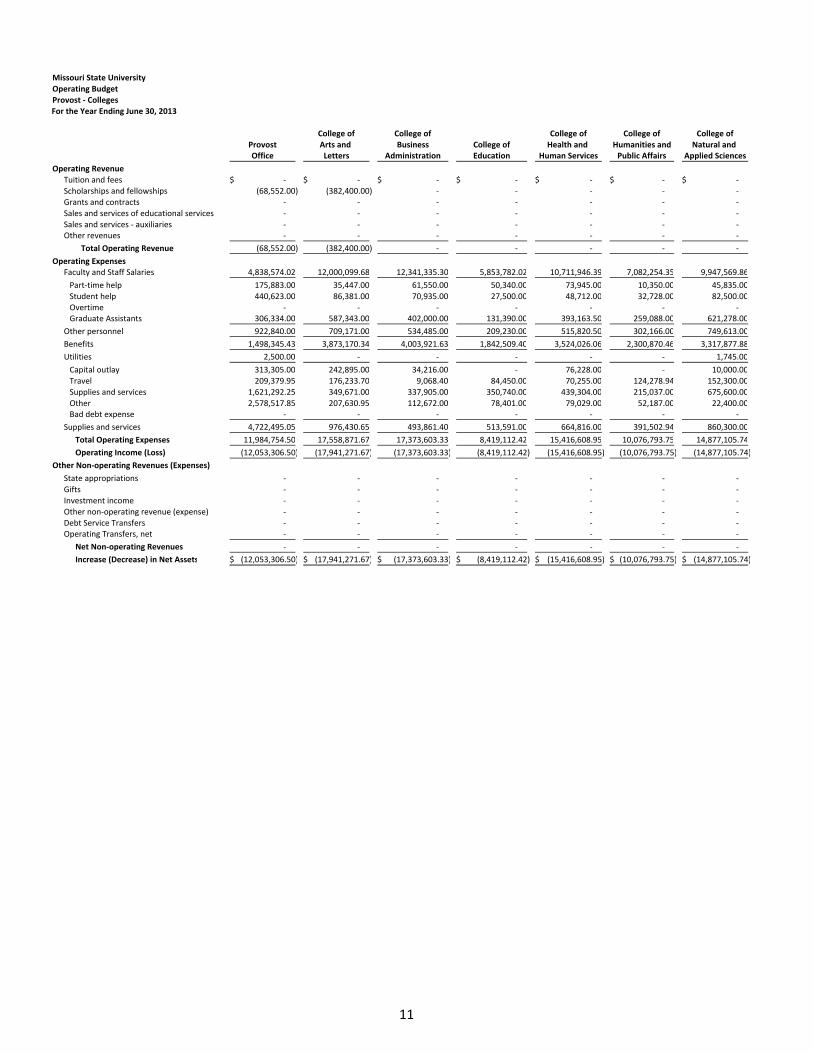
Missouri State University
Operating Budget
Provost ‐ Colleges
For the Year Ending June 30, 2013
College of College of College of College of College of
Provost Arts and Business College of Health and Humanities and Natural and Office Letters Administration Education Human Services Public Affairs Applied Sciences
Operating Revenue
Tuition and fees ‐$ ‐$ ‐$ ‐$ ‐$ ‐$ ‐$
Scholarships and fellowships (68,552.00) (382,400.00) ‐ ‐ ‐ ‐ ‐
Grants and contracts ‐ ‐ ‐ ‐ ‐ ‐ ‐
Sales and services of educational services ‐ ‐ ‐ ‐ ‐ ‐ ‐
Sales and services ‐ auxiliaries ‐ ‐ ‐ ‐ ‐ ‐ ‐ Other revenues ‐ ‐ ‐ ‐ ‐ ‐ ‐
Total Operating Revenue (68,552.00) (382,400.00) ‐ ‐ ‐ ‐ ‐
Operating ExpensesFaculty and Staff Salaries 4,838,574.02 12,000,099.68 12,341,335.30 5,853,782.02 10,711,946.39 7,082,254.35 9,947,569.86
Part‐time help 175,883.00 35,447.00 61,550.00 50,340.00 73,945.00 10,350.00 45,835.00
Student help 440,623.00 86,381.00 70,935.00 27,500.00 48,712.00 32,728.00 82,500.00
Overtime ‐ ‐ ‐ ‐ ‐ ‐ ‐ Graduate Assistants 306,334.00 587,343.00 402,000.00 131,390.00 393,163.50 259,088.00 621,278.00
Other personnel 922,840.00 709,171.00 534,485.00 209,230.00 515,820.50 302,166.00 749,613.00
Benefits 1,498,345.43 3,873,170.34 4,003,921.63 1,842,509.40 3,524,026.06 2,300,870.46 3,317,877.88
Utilities 2,500.00 ‐ ‐ ‐ ‐ ‐ 1,745.00
Capital outlay 313,305.00 242,895.00 34,216.00 ‐ 76,228.00 ‐ 10,000.00 Travel 209,379.95 176,233.70 9,068.40 84,450.00 70,255.00 124,278.94 152,300.00 Supplies and services 1,621,292.25 349,671.00 337,905.00 350,740.00 439,304.00 215,037.00 675,600.00 Other 2,578,517.85 207,630.95 112,672.00 78,401.00 79,029.00 52,187.00 22,400.00 Bad debt expense ‐ ‐ ‐ ‐ ‐ ‐ ‐
Supplies and services 4,722,495.05 976,430.65 493,861.40 513,591.00 664,816.00 391,502.94 860,300.00
Total Operating Expenses 11,984,754.50 17,558,871.67 17,373,603.33 8,419,112.42 15,416,608.95 10,076,793.75 14,877,105.74
Operating Income (Loss) (12,053,306.50) (17,941,271.67) (17,373,603.33) (8,419,112.42) (15,416,608.95) (10,076,793.75) (14,877,105.74)
Other Non‐operating Revenues (Expenses)
State appropriations ‐ ‐ ‐ ‐ ‐ ‐ ‐ Gifts ‐ ‐ ‐ ‐ ‐ ‐ ‐ Investment income ‐ ‐ ‐ ‐ ‐ ‐ ‐ Other non‐operating revenue (expense) ‐ ‐ ‐ ‐ ‐ ‐ ‐ Debt Service Transfers ‐ ‐ ‐ ‐ ‐ ‐ ‐ Operating Transfers, net ‐ ‐ ‐ ‐ ‐ ‐ ‐
Net Non‐operating Revenues ‐ ‐ ‐ ‐ ‐ ‐ ‐
Increase (Decrease) in Net Assets (12,053,306.50)$ (17,941,271.67)$ (17,373,603.33)$ (8,419,112.42)$ (15,416,608.95)$ (10,076,793.75)$ (14,877,105.74)$
11
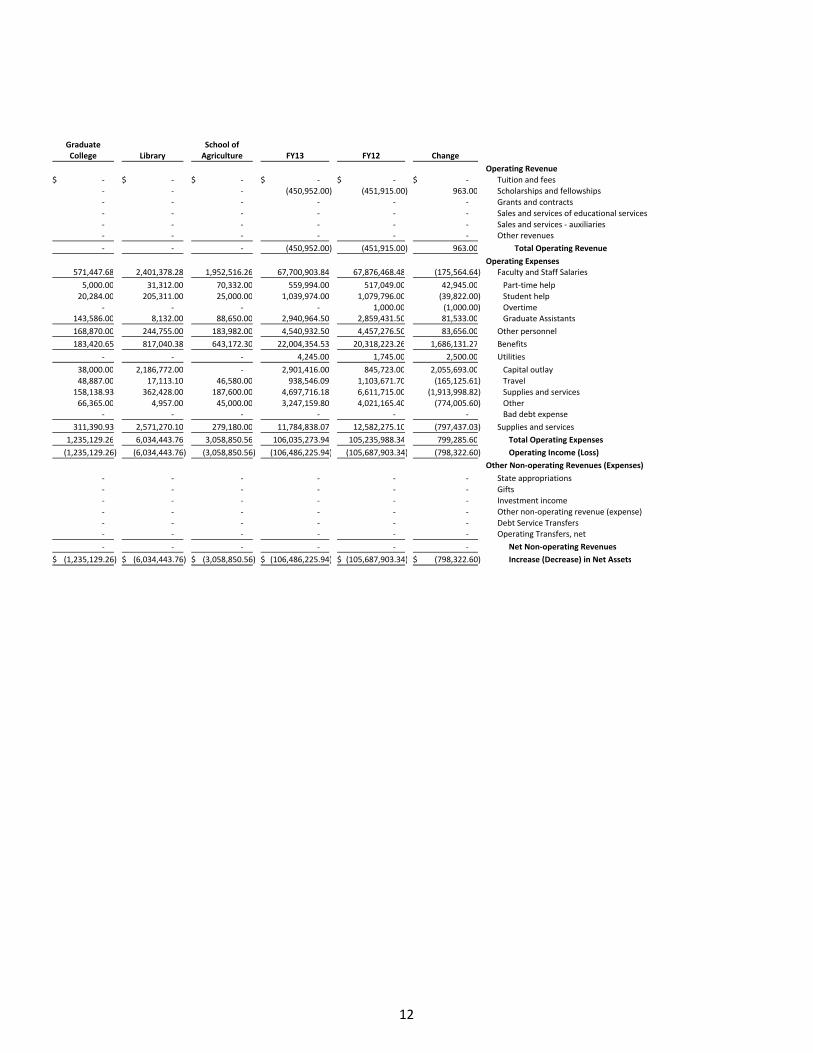
Graduate School ofCollege Library Agriculture FY13 FY12 Change
Operating Revenue
‐$ ‐$ ‐$ ‐$ ‐$ ‐$ Tuition and fees
‐ ‐ ‐ (450,952.00) (451,915.00) 963.00 Scholarships and fellowships
‐ ‐ ‐ ‐ ‐ ‐ Grants and contracts
‐ ‐ ‐ ‐ ‐ ‐ Sales and services of educational services
‐ ‐ ‐ ‐ ‐ ‐ Sales and services ‐ auxiliaries‐ ‐ ‐ ‐ ‐ ‐ Other revenues
‐ ‐ ‐ (450,952.00) (451,915.00) 963.00 Total Operating Revenue
Operating Expenses571,447.68 2,401,378.28 1,952,516.26 67,700,903.84 67,876,468.48 (175,564.64) Faculty and Staff Salaries
5,000.00 31,312.00 70,332.00 559,994.00 517,049.00 42,945.00 Part‐time help
20,284.00 205,311.00 25,000.00 1,039,974.00 1,079,796.00 (39,822.00) Student help
‐ ‐ ‐ ‐ 1,000.00 (1,000.00) Overtime143,586.00 8,132.00 88,650.00 2,940,964.50 2,859,431.50 81,533.00 Graduate Assistants
168,870.00 244,755.00 183,982.00 4,540,932.50 4,457,276.50 83,656.00 Other personnel
183,420.65 817,040.38 643,172.30 22,004,354.53 20,318,223.26 1,686,131.27 Benefits
‐ ‐ ‐ 4,245.00 1,745.00 2,500.00 Utilities
38,000.00 2,186,772.00 ‐ 2,901,416.00 845,723.00 2,055,693.00 Capital outlay48,887.00 17,113.10 46,580.00 938,546.09 1,103,671.70 (165,125.61) Travel158,138.93 362,428.00 187,600.00 4,697,716.18 6,611,715.00 (1,913,998.82) Supplies and services66,365.00 4,957.00 45,000.00 3,247,159.80 4,021,165.40 (774,005.60) Other
‐ ‐ ‐ ‐ ‐ ‐ Bad debt expense
311,390.93 2,571,270.10 279,180.00 11,784,838.07 12,582,275.10 (797,437.03) Supplies and services
1,235,129.26 6,034,443.76 3,058,850.56 106,035,273.94 105,235,988.34 799,285.60 Total Operating Expenses
(1,235,129.26) (6,034,443.76) (3,058,850.56) (106,486,225.94) (105,687,903.34) (798,322.60) Operating Income (Loss)
Other Non‐operating Revenues (Expenses)
‐ ‐ ‐ ‐ ‐ ‐ State appropriations‐ ‐ ‐ ‐ ‐ ‐ Gifts‐ ‐ ‐ ‐ ‐ ‐ Investment income‐ ‐ ‐ ‐ ‐ ‐ Other non‐operating revenue (expense)‐ ‐ ‐ ‐ ‐ ‐ Debt Service Transfers‐ ‐ ‐ ‐ ‐ ‐ Operating Transfers, net
‐ ‐ ‐ ‐ ‐ ‐ Net Non‐operating Revenues
(1,235,129.26)$ (6,034,443.76)$ (3,058,850.56)$ (106,486,225.94)$ (105,687,903.34)$ (798,322.60)$ Increase (Decrease) in Net Assets
12
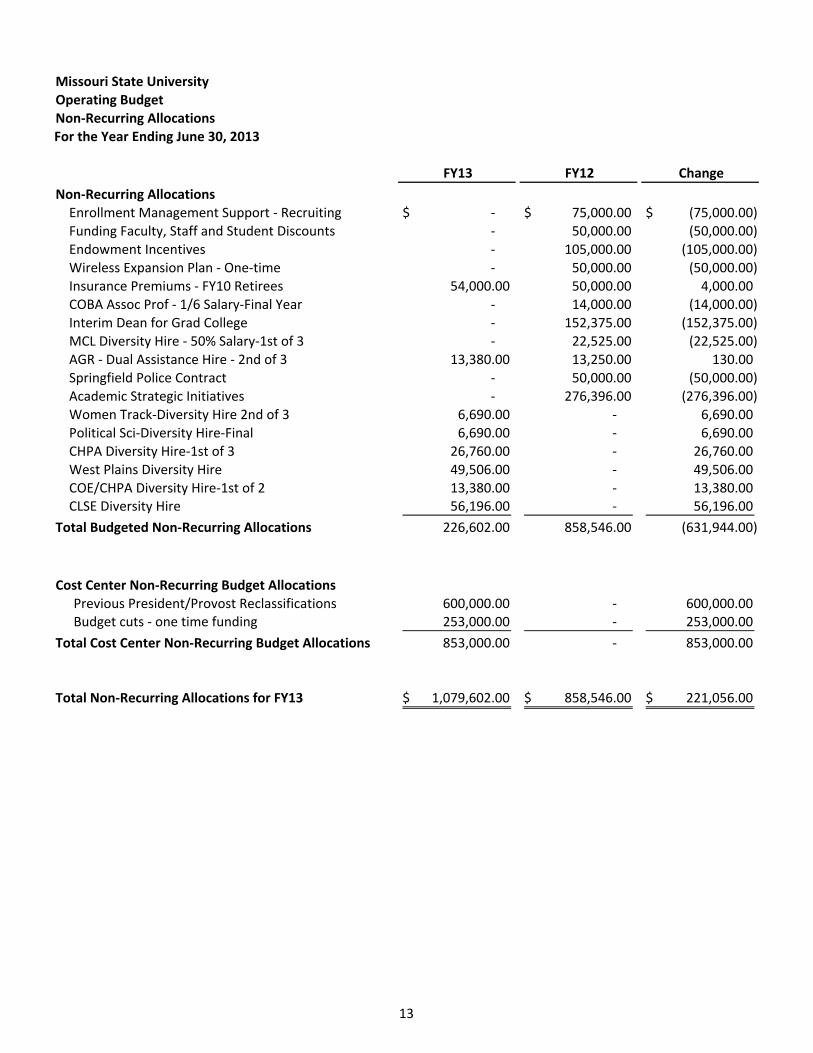
Missouri State UniversityOperating BudgetNon‐Recurring Allocations For the Year Ending June 30, 2013
FY13 FY12 Change
Non‐Recurring AllocationsEnrollment Management Support ‐ Recruiting ‐$ 75,000.00$ (75,000.00)$ Funding Faculty, Staff and Student Discounts ‐ 50,000.00 (50,000.00) Endowment Incentives ‐ 105,000.00 (105,000.00) Wireless Expansion Plan ‐ One‐time ‐ 50,000.00 (50,000.00) Insurance Premiums ‐ FY10 Retirees 54,000.00 50,000.00 4,000.00 COBA Assoc Prof ‐ 1/6 Salary‐Final Year ‐ 14,000.00 (14,000.00) Interim Dean for Grad College ‐ 152,375.00 (152,375.00) MCL Diversity Hire ‐ 50% Salary‐1st of 3 ‐ 22,525.00 (22,525.00) AGR ‐ Dual Assistance Hire ‐ 2nd of 3 13,380.00 13,250.00 130.00 Springfield Police Contract ‐ 50,000.00 (50,000.00) Academic Strategic Initiatives ‐ 276,396.00 (276,396.00) Women Track‐Diversity Hire 2nd of 3 6,690.00 ‐ 6,690.00 Political Sci‐Diversity Hire‐Final 6,690.00 ‐ 6,690.00 CHPA Diversity Hire‐1st of 3 26,760.00 ‐ 26,760.00 West Plains Diversity Hire 49,506.00 ‐ 49,506.00 COE/CHPA Diversity Hire‐1st of 2 13,380.00 ‐ 13,380.00 CLSE Diversity Hire 56,196.00 ‐ 56,196.00
Total Budgeted Non‐Recurring Allocations 226,602.00 858,546.00 (631,944.00)
Cost Center Non‐Recurring Budget AllocationsPrevious President/Provost Reclassifications 600,000.00 ‐ 600,000.00 Budget cuts ‐ one time funding 253,000.00 ‐ 253,000.00
Total Cost Center Non‐Recurring Budget Allocations 853,000.00 ‐ 853,000.00
Total Non‐Recurring Allocations for FY13 1,079,602.00$ 858,546.00$ 221,056.00$
13
DESIGNATED FUNDS
YEAR ENDING JUNE 30, 2013
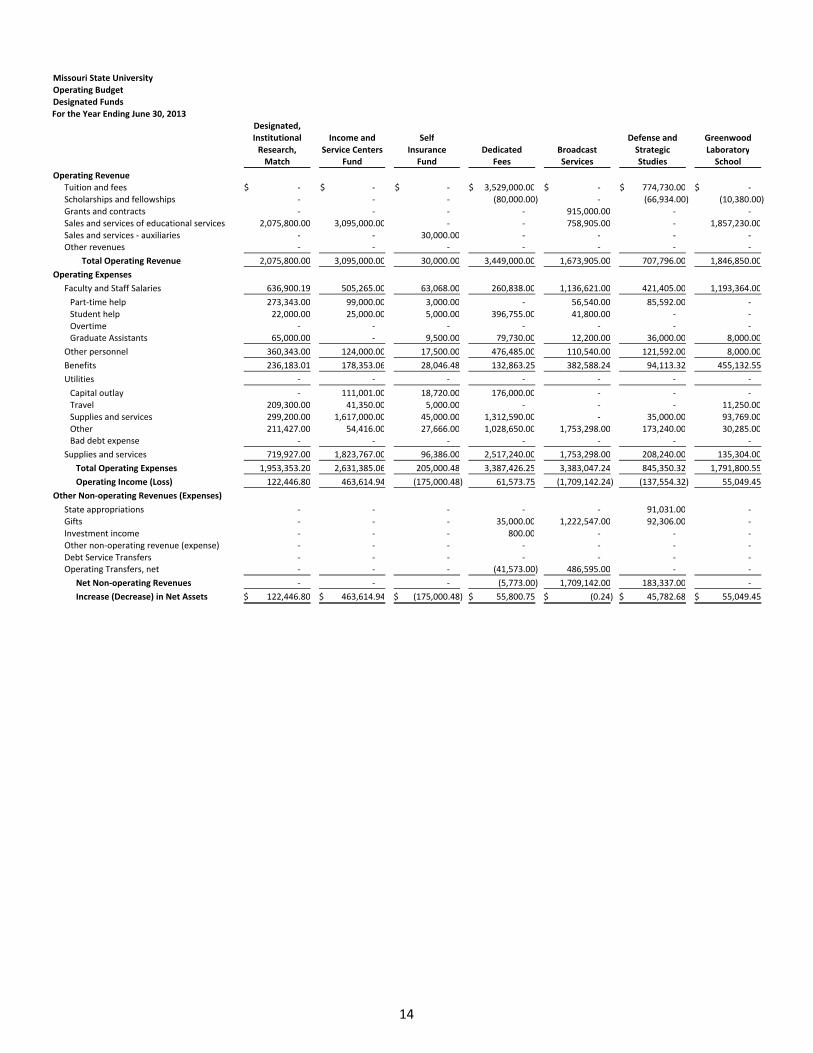
Missouri State UniversityOperating BudgetDesignated Funds For the Year Ending June 30, 2013
Designated,Institutional Income and Self Defense and GreenwoodResearch, Service Centers Insurance Dedicated Broadcast Strategic LaboratoryMatch Fund Fund Fees Services Studies School
Operating RevenueTuition and fees ‐$ ‐$ ‐$ 3,529,000.00$ ‐$ 774,730.00$ ‐$ Scholarships and fellowships ‐ ‐ ‐ (80,000.00) ‐ (66,934.00) (10,380.00) Grants and contracts ‐ ‐ ‐ ‐ 915,000.00 ‐ ‐ Sales and services of educational services 2,075,800.00 3,095,000.00 ‐ ‐ 758,905.00 ‐ 1,857,230.00 Sales and services ‐ auxiliaries ‐ ‐ 30,000.00 ‐ ‐ ‐ ‐ Other revenues ‐ ‐ ‐ ‐ ‐ ‐ ‐
Total Operating Revenue 2,075,800.00 3,095,000.00 30,000.00 3,449,000.00 1,673,905.00 707,796.00 1,846,850.00
Operating Expenses
Faculty and Staff Salaries 636,900.19 505,265.00 63,068.00 260,838.00 1,136,621.00 421,405.00 1,193,364.00
Part‐time help 273,343.00 99,000.00 3,000.00 ‐ 56,540.00 85,592.00 ‐ Student help 22,000.00 25,000.00 5,000.00 396,755.00 41,800.00 ‐ ‐ Overtime ‐ ‐ ‐ ‐ ‐ ‐ ‐ Graduate Assistants 65,000.00 ‐ 9,500.00 79,730.00 12,200.00 36,000.00 8,000.00
Other personnel 360,343.00 124,000.00 17,500.00 476,485.00 110,540.00 121,592.00 8,000.00
Benefits 236,183.01 178,353.06 28,046.48 132,863.25 382,588.24 94,113.32 455,132.55
Utilities ‐ ‐ ‐ ‐ ‐ ‐ ‐
Capital outlay ‐ 111,001.00 18,720.00 176,000.00 ‐ ‐ ‐ Travel 209,300.00 41,350.00 5,000.00 ‐ ‐ ‐ 11,250.00 Supplies and services 299,200.00 1,617,000.00 45,000.00 1,312,590.00 ‐ 35,000.00 93,769.00 Other 211,427.00 54,416.00 27,666.00 1,028,650.00 1,753,298.00 173,240.00 30,285.00 Bad debt expense ‐ ‐ ‐ ‐ ‐ ‐ ‐
Supplies and services 719,927.00 1,823,767.00 96,386.00 2,517,240.00 1,753,298.00 208,240.00 135,304.00
Total Operating Expenses 1,953,353.20 2,631,385.06 205,000.48 3,387,426.25 3,383,047.24 845,350.32 1,791,800.55
Operating Income (Loss) 122,446.80 463,614.94 (175,000.48) 61,573.75 (1,709,142.24) (137,554.32) 55,049.45
Other Non‐operating Revenues (Expenses)
State appropriations ‐ ‐ ‐ ‐ ‐ 91,031.00 ‐ Gifts ‐ ‐ ‐ 35,000.00 1,222,547.00 92,306.00 ‐ Investment income ‐ ‐ ‐ 800.00 ‐ ‐ ‐ Other non‐operating revenue (expense) ‐ ‐ ‐ ‐ ‐ ‐ ‐ Debt Service Transfers ‐ ‐ ‐ ‐ ‐ ‐ ‐ Operating Transfers, net ‐ ‐ ‐ (41,573.00) 486,595.00 ‐ ‐
Net Non‐operating Revenues ‐ ‐ ‐ (5,773.00) 1,709,142.00 183,337.00 ‐
Increase (Decrease) in Net Assets 122,446.80$ 463,614.94$ (175,000.48)$ 55,800.75$ (0.24)$ 45,782.68$ 55,049.45$
14
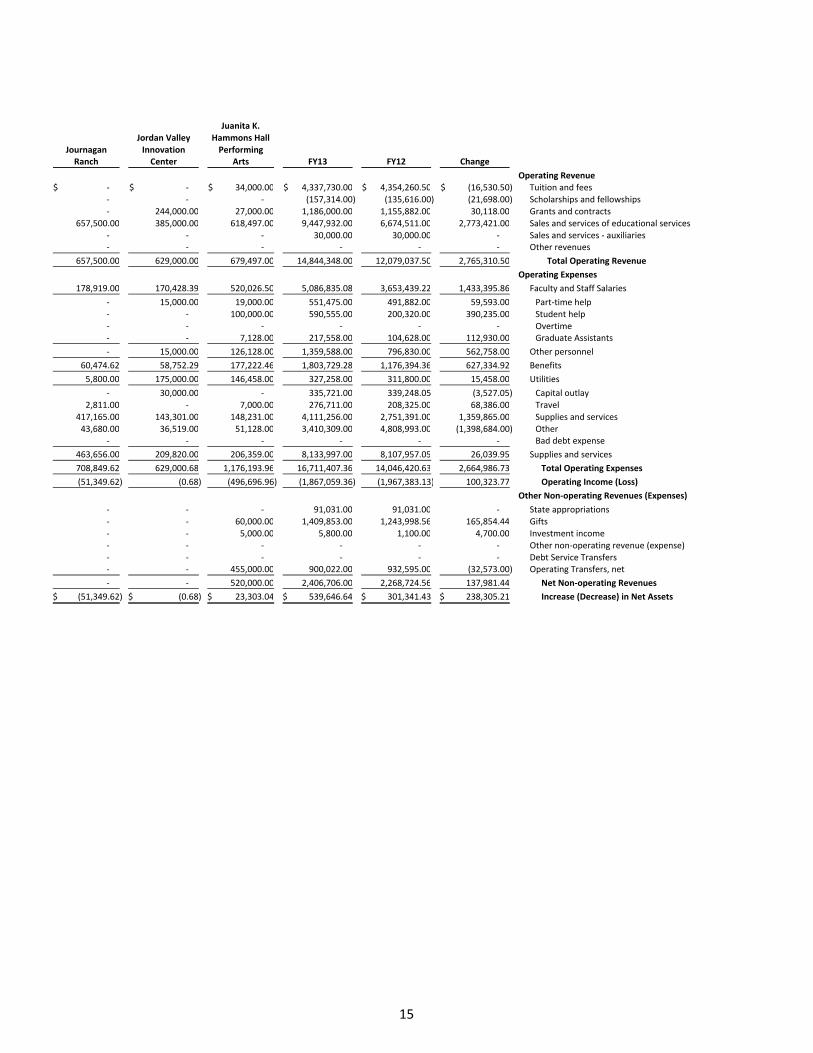
Juanita K.Jordan Valley Hammons Hall
Journagan Innovation PerformingRanch Center Arts FY13 FY12 Change
Operating Revenue‐$ ‐$ 34,000.00$ 4,337,730.00$ 4,354,260.50$ (16,530.50)$ Tuition and fees‐ ‐ ‐ (157,314.00) (135,616.00) (21,698.00) Scholarships and fellowships‐ 244,000.00 27,000.00 1,186,000.00 1,155,882.00 30,118.00 Grants and contracts
657,500.00 385,000.00 618,497.00 9,447,932.00 6,674,511.00 2,773,421.00 Sales and services of educational services‐ ‐ ‐ 30,000.00 30,000.00 ‐ Sales and services ‐ auxiliaries‐ ‐ ‐ ‐ ‐ ‐ Other revenues
657,500.00 629,000.00 679,497.00 14,844,348.00 12,079,037.50 2,765,310.50 Total Operating Revenue
Operating Expenses
178,919.00 170,428.39 520,026.50 5,086,835.08 3,653,439.22 1,433,395.86 Faculty and Staff Salaries
‐ 15,000.00 19,000.00 551,475.00 491,882.00 59,593.00 Part‐time help‐ ‐ 100,000.00 590,555.00 200,320.00 390,235.00 Student help‐ ‐ ‐ ‐ ‐ ‐ Overtime‐ ‐ 7,128.00 217,558.00 104,628.00 112,930.00 Graduate Assistants
‐ 15,000.00 126,128.00 1,359,588.00 796,830.00 562,758.00 Other personnel
60,474.62 58,752.29 177,222.46 1,803,729.28 1,176,394.36 627,334.92 Benefits
5,800.00 175,000.00 146,458.00 327,258.00 311,800.00 15,458.00 Utilities
‐ 30,000.00 ‐ 335,721.00 339,248.05 (3,527.05) Capital outlay2,811.00 ‐ 7,000.00 276,711.00 208,325.00 68,386.00 Travel
417,165.00 143,301.00 148,231.00 4,111,256.00 2,751,391.00 1,359,865.00 Supplies and services43,680.00 36,519.00 51,128.00 3,410,309.00 4,808,993.00 (1,398,684.00) Other
‐ ‐ ‐ ‐ ‐ ‐ Bad debt expense
463,656.00 209,820.00 206,359.00 8,133,997.00 8,107,957.05 26,039.95 Supplies and services
708,849.62 629,000.68 1,176,193.96 16,711,407.36 14,046,420.63 2,664,986.73 Total Operating Expenses
(51,349.62) (0.68) (496,696.96) (1,867,059.36) (1,967,383.13) 100,323.77 Operating Income (Loss)
Other Non‐operating Revenues (Expenses)
‐ ‐ ‐ 91,031.00 91,031.00 ‐ State appropriations‐ ‐ 60,000.00 1,409,853.00 1,243,998.56 165,854.44 Gifts‐ ‐ 5,000.00 5,800.00 1,100.00 4,700.00 Investment income‐ ‐ ‐ ‐ ‐ ‐ Other non‐operating revenue (expense)‐ ‐ ‐ ‐ ‐ ‐ Debt Service Transfers‐ ‐ 455,000.00 900,022.00 932,595.00 (32,573.00) Operating Transfers, net
‐ ‐ 520,000.00 2,406,706.00 2,268,724.56 137,981.44 Net Non‐operating Revenues
(51,349.62)$ (0.68)$ 23,303.04$ 539,646.64$ 301,341.43$ 238,305.21$ Increase (Decrease) in Net Assets
15
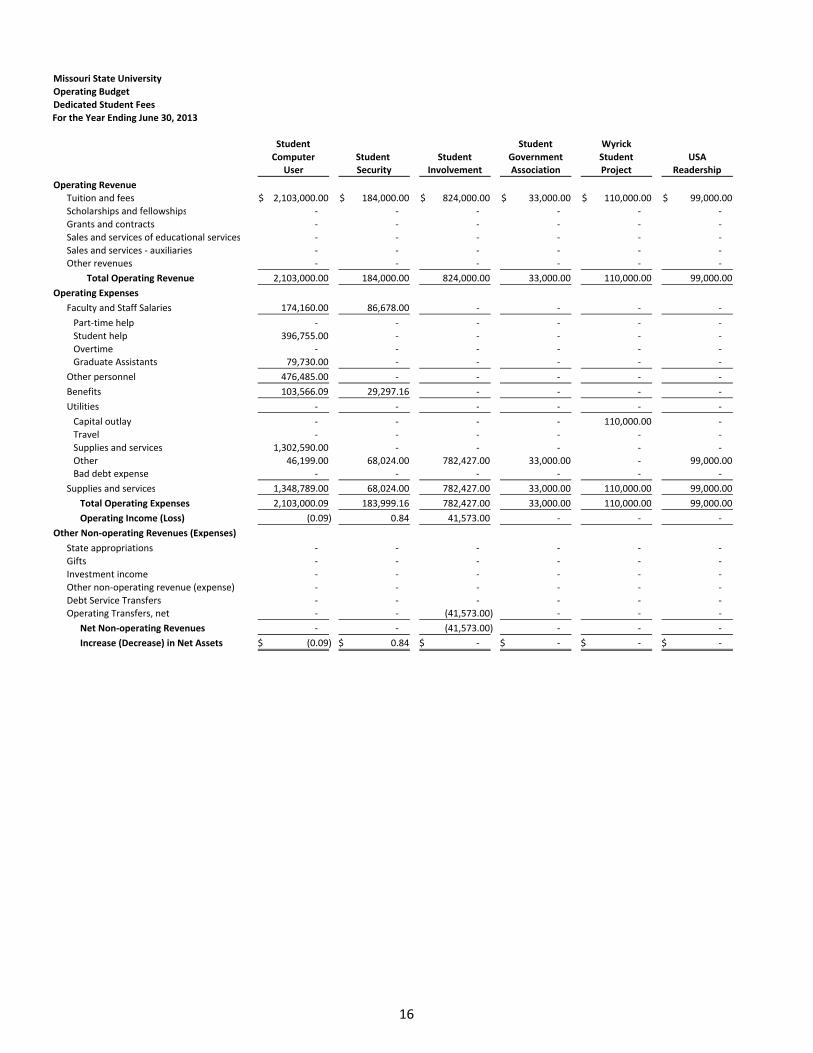
Missouri State University
Operating Budget
Dedicated Student Fees
For the Year Ending June 30, 2013
Student Student Wyrick
Computer Student Student Government Student USAUser Security Involvement Association Project Readership
Operating Revenue
Tuition and fees 2,103,000.00$ 184,000.00$ 824,000.00$ 33,000.00$ 110,000.00$ 99,000.00$
Scholarships and fellowships ‐ ‐ ‐ ‐ ‐ ‐
Grants and contracts ‐ ‐ ‐ ‐ ‐ ‐
Sales and services of educational services ‐ ‐ ‐ ‐ ‐ ‐
Sales and services ‐ auxiliaries ‐ ‐ ‐ ‐ ‐ ‐ Other revenues ‐ ‐ ‐ ‐ ‐ ‐
Total Operating Revenue 2,103,000.00 184,000.00 824,000.00 33,000.00 110,000.00 99,000.00
Operating Expenses
Faculty and Staff Salaries 174,160.00 86,678.00 ‐ ‐ ‐ ‐
Part‐time help ‐ ‐ ‐ ‐ ‐ ‐
Student help 396,755.00 ‐ ‐ ‐ ‐ ‐
Overtime ‐ ‐ ‐ ‐ ‐ ‐ Graduate Assistants 79,730.00 ‐ ‐ ‐ ‐ ‐
Other personnel 476,485.00 ‐ ‐ ‐ ‐ ‐
Benefits 103,566.09 29,297.16 ‐ ‐ ‐ ‐
Utilities ‐ ‐ ‐ ‐ ‐ ‐
Capital outlay ‐ ‐ ‐ ‐ 110,000.00 ‐
Travel ‐ ‐ ‐ ‐ ‐ ‐
Supplies and services 1,302,590.00 ‐ ‐ ‐ ‐ ‐
Other 46,199.00 68,024.00 782,427.00 33,000.00 ‐ 99,000.00 Bad debt expense ‐ ‐ ‐ ‐ ‐ ‐
Supplies and services 1,348,789.00 68,024.00 782,427.00 33,000.00 110,000.00 99,000.00
Total Operating Expenses 2,103,000.09 183,999.16 782,427.00 33,000.00 110,000.00 99,000.00
Operating Income (Loss) (0.09) 0.84 41,573.00 ‐ ‐ ‐
Other Non‐operating Revenues (Expenses)
State appropriations ‐ ‐ ‐ ‐ ‐ ‐
Gifts ‐ ‐ ‐ ‐ ‐ ‐
Investment income ‐ ‐ ‐ ‐ ‐ ‐
Other non‐operating revenue (expense) ‐ ‐ ‐ ‐ ‐ ‐
Debt Service Transfers ‐ ‐ ‐ ‐ ‐ ‐ Operating Transfers, net ‐ ‐ (41,573.00) ‐ ‐ ‐
Net Non‐operating Revenues ‐ ‐ (41,573.00) ‐ ‐ ‐
Increase (Decrease) in Net Assets (0.09)$ 0.84$ ‐$ ‐$ ‐$ ‐$
16
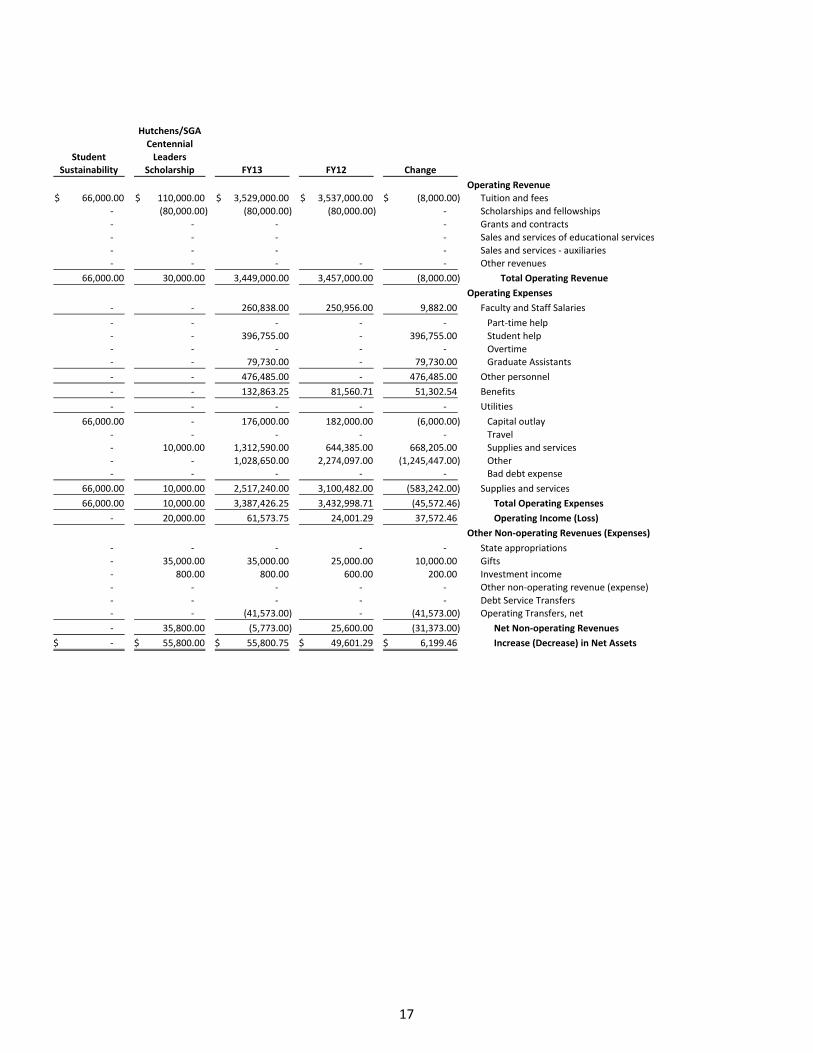
Hutchens/SGA
Centennial
Student LeadersSustainability Scholarship FY13 FY12 Change
Operating Revenue
66,000.00$ 110,000.00$ 3,529,000.00$ 3,537,000.00$ (8,000.00)$ Tuition and fees
‐ (80,000.00) (80,000.00) (80,000.00) ‐ Scholarships and fellowships
‐ ‐ ‐ ‐ Grants and contracts
‐ ‐ ‐ ‐ Sales and services of educational services
‐ ‐ ‐ ‐ Sales and services ‐ auxiliaries‐ ‐ ‐ ‐ ‐ Other revenues
66,000.00 30,000.00 3,449,000.00 3,457,000.00 (8,000.00) Total Operating Revenue
Operating Expenses
‐ ‐ 260,838.00 250,956.00 9,882.00 Faculty and Staff Salaries
‐ ‐ ‐ ‐ ‐ Part‐time help
‐ ‐ 396,755.00 ‐ 396,755.00 Student help
‐ ‐ ‐ ‐ ‐ Overtime‐ ‐ 79,730.00 ‐ 79,730.00 Graduate Assistants
‐ ‐ 476,485.00 ‐ 476,485.00 Other personnel
‐ ‐ 132,863.25 81,560.71 51,302.54 Benefits
‐ ‐ ‐ ‐ ‐ Utilities
66,000.00 ‐ 176,000.00 182,000.00 (6,000.00) Capital outlay
‐ ‐ ‐ ‐ ‐ Travel
‐ 10,000.00 1,312,590.00 644,385.00 668,205.00 Supplies and services
‐ ‐ 1,028,650.00 2,274,097.00 (1,245,447.00) Other‐ ‐ ‐ ‐ ‐ Bad debt expense
66,000.00 10,000.00 2,517,240.00 3,100,482.00 (583,242.00) Supplies and services
66,000.00 10,000.00 3,387,426.25 3,432,998.71 (45,572.46) Total Operating Expenses
‐ 20,000.00 61,573.75 24,001.29 37,572.46 Operating Income (Loss)
Other Non‐operating Revenues (Expenses)
‐ ‐ ‐ ‐ ‐ State appropriations
‐ 35,000.00 35,000.00 25,000.00 10,000.00 Gifts
‐ 800.00 800.00 600.00 200.00 Investment income
‐ ‐ ‐ ‐ ‐ Other non‐operating revenue (expense)
‐ ‐ ‐ ‐ ‐ Debt Service Transfers‐ ‐ (41,573.00) ‐ (41,573.00) Operating Transfers, net
‐ 35,800.00 (5,773.00) 25,600.00 (31,373.00) Net Non‐operating Revenues
‐$ 55,800.00$ 55,800.75$ 49,601.29$ 6,199.46$ Increase (Decrease) in Net Assets
17
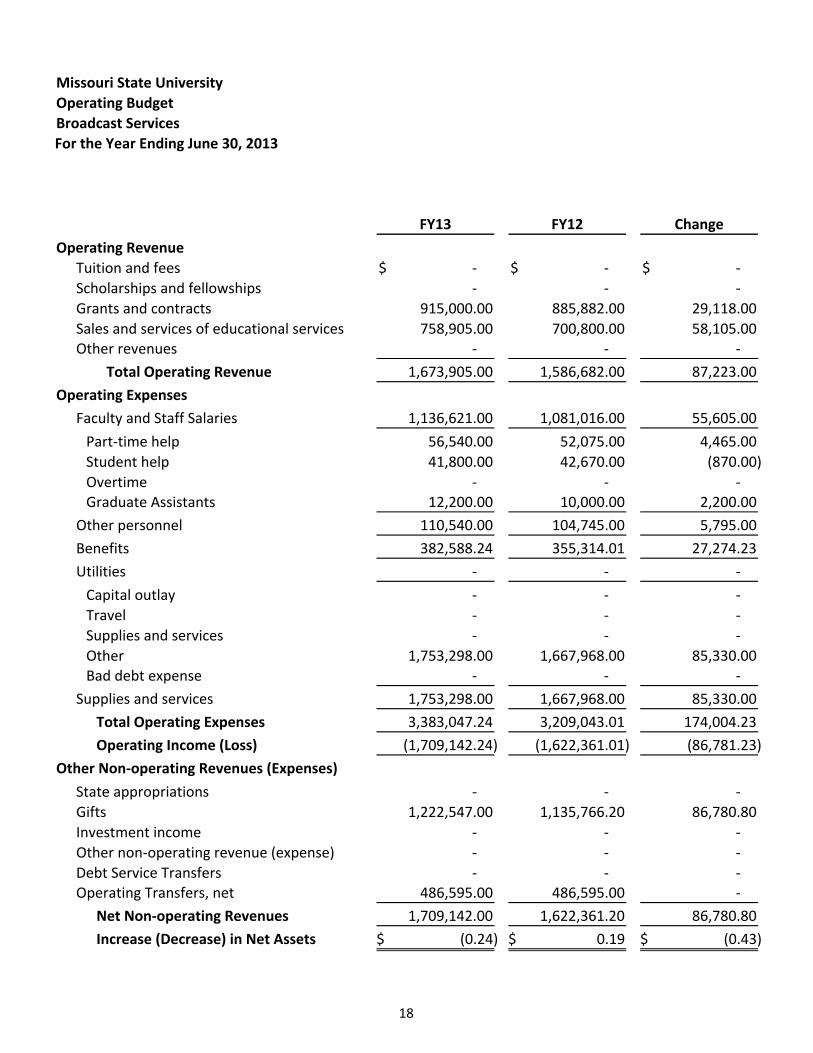
Missouri State University
Operating Budget
Broadcast Services
For the Year Ending June 30, 2013
FY13 FY12 Change
Operating Revenue
Tuition and fees ‐$ ‐$ ‐$
Scholarships and fellowships ‐ ‐ ‐
Grants and contracts 915,000.00 885,882.00 29,118.00
Sales and services of educational services 758,905.00 700,800.00 58,105.00 Other revenues ‐ ‐ ‐
Total Operating Revenue 1,673,905.00 1,586,682.00 87,223.00
Operating Expenses
Faculty and Staff Salaries 1,136,621.00 1,081,016.00 55,605.00
Part‐time help 56,540.00 52,075.00 4,465.00
Student help 41,800.00 42,670.00 (870.00)
Overtime ‐ ‐ ‐ Graduate Assistants 12,200.00 10,000.00 2,200.00
Other personnel 110,540.00 104,745.00 5,795.00
Benefits 382,588.24 355,314.01 27,274.23
Utilities ‐ ‐ ‐
Capital outlay ‐ ‐ ‐
Travel ‐ ‐ ‐
Supplies and services ‐ ‐ ‐
Other 1,753,298.00 1,667,968.00 85,330.00 Bad debt expense ‐ ‐ ‐
Supplies and services 1,753,298.00 1,667,968.00 85,330.00
Total Operating Expenses 3,383,047.24 3,209,043.01 174,004.23
Operating Income (Loss) (1,709,142.24) (1,622,361.01) (86,781.23)
Other Non‐operating Revenues (Expenses)
State appropriations ‐ ‐ ‐
Gifts 1,222,547.00 1,135,766.20 86,780.80
Investment income ‐ ‐ ‐
Other non‐operating revenue (expense) ‐ ‐ ‐
Debt Service Transfers ‐ ‐ ‐ Operating Transfers, net 486,595.00 486,595.00 ‐
Net Non‐operating Revenues 1,709,142.00 1,622,361.20 86,780.80
Increase (Decrease) in Net Assets (0.24)$ 0.19$ (0.43)$
18
Missouri State University
Operating Budget
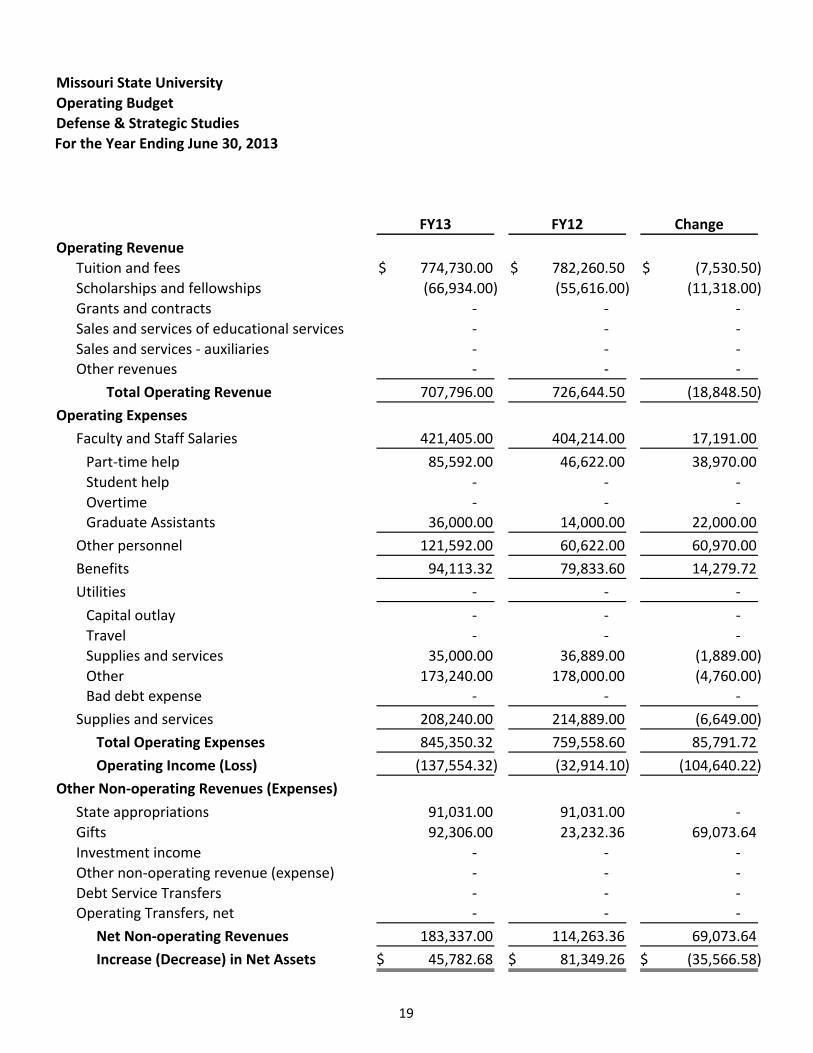
Defense & Strategic Studies
For the Year Ending June 30, 2013
FY13 FY12 Change
Operating Revenue
Tuition and fees 774,730.00$ 782,260.50$ (7,530.50)$
Scholarships and fellowships (66,934.00) (55,616.00) (11,318.00)
Grants and contracts ‐ ‐ ‐
Sales and services of educational services ‐ ‐ ‐
Sales and services ‐ auxiliaries ‐ ‐ ‐ Other revenues ‐ ‐ ‐
Total Operating Revenue 707,796.00 726,644.50 (18,848.50)
Operating Expenses
Faculty and Staff Salaries 421,405.00 404,214.00 17,191.00
Part‐time help 85,592.00 46,622.00 38,970.00
Student help ‐ ‐ ‐
Overtime ‐ ‐ ‐ Graduate Assistants 36,000.00 14,000.00 22,000.00
Other personnel 121,592.00 60,622.00 60,970.00
Benefits 94,113.32 79,833.60 14,279.72
Utilities ‐ ‐ ‐
Capital outlay ‐ ‐ ‐
Travel ‐ ‐ ‐
Supplies and services 35,000.00 36,889.00 (1,889.00)
Other 173,240.00 178,000.00 (4,760.00) Bad debt expense ‐ ‐ ‐
Supplies and services 208,240.00 214,889.00 (6,649.00)
Total Operating Expenses 845,350.32 759,558.60 85,791.72
Operating Income (Loss) (137,554.32) (32,914.10) (104,640.22)
Other Non‐operating Revenues (Expenses)
State appropriations 91,031.00 91,031.00 ‐
Gifts 92,306.00 23,232.36 69,073.64
Investment income ‐ ‐ ‐
Other non‐operating revenue (expense) ‐ ‐ ‐
Debt Service Transfers ‐ ‐ ‐ Operating Transfers, net ‐ ‐ ‐
Net Non‐operating Revenues 183,337.00 114,263.36 69,073.64
Increase (Decrease) in Net Assets 45,782.68$ 81,349.26$ (35,566.58)$
19
Missouri State University
Operating Budget
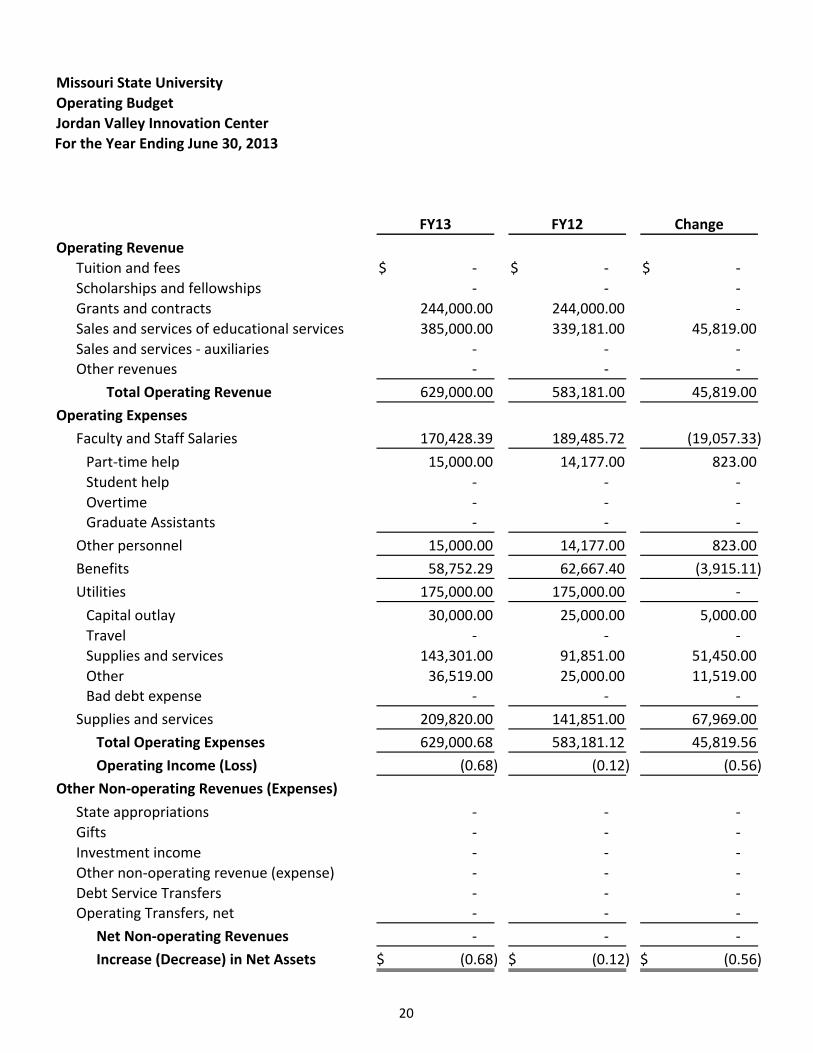
Jordan Valley Innovation Center
For the Year Ending June 30, 2013
FY13 FY12 Change
Operating Revenue
Tuition and fees ‐$ ‐$ ‐$
Scholarships and fellowships ‐ ‐ ‐
Grants and contracts 244,000.00 244,000.00 ‐
Sales and services of educational services 385,000.00 339,181.00 45,819.00
Sales and services ‐ auxiliaries ‐ ‐ ‐ Other revenues ‐ ‐ ‐
Total Operating Revenue 629,000.00 583,181.00 45,819.00
Operating Expenses
Faculty and Staff Salaries 170,428.39 189,485.72 (19,057.33)
Part‐time help 15,000.00 14,177.00 823.00
Student help ‐ ‐ ‐
Overtime ‐ ‐ ‐ Graduate Assistants ‐ ‐ ‐
Other personnel 15,000.00 14,177.00 823.00
Benefits 58,752.29 62,667.40 (3,915.11)
Utilities 175,000.00 175,000.00 ‐
Capital outlay 30,000.00 25,000.00 5,000.00
Travel ‐ ‐ ‐
Supplies and services 143,301.00 91,851.00 51,450.00
Other 36,519.00 25,000.00 11,519.00 Bad debt expense ‐ ‐ ‐
Supplies and services 209,820.00 141,851.00 67,969.00
Total Operating Expenses 629,000.68 583,181.12 45,819.56
Operating Income (Loss) (0.68) (0.12) (0.56)
Other Non‐operating Revenues (Expenses)
State appropriations ‐ ‐ ‐
Gifts ‐ ‐ ‐
Investment income ‐ ‐ ‐
Other non‐operating revenue (expense) ‐ ‐ ‐
Debt Service Transfers ‐ ‐ ‐ Operating Transfers, net ‐ ‐ ‐
Net Non‐operating Revenues ‐ ‐ ‐
Increase (Decrease) in Net Assets (0.68)$ (0.12)$ (0.56)$
20
Missouri State University
Operating Budget
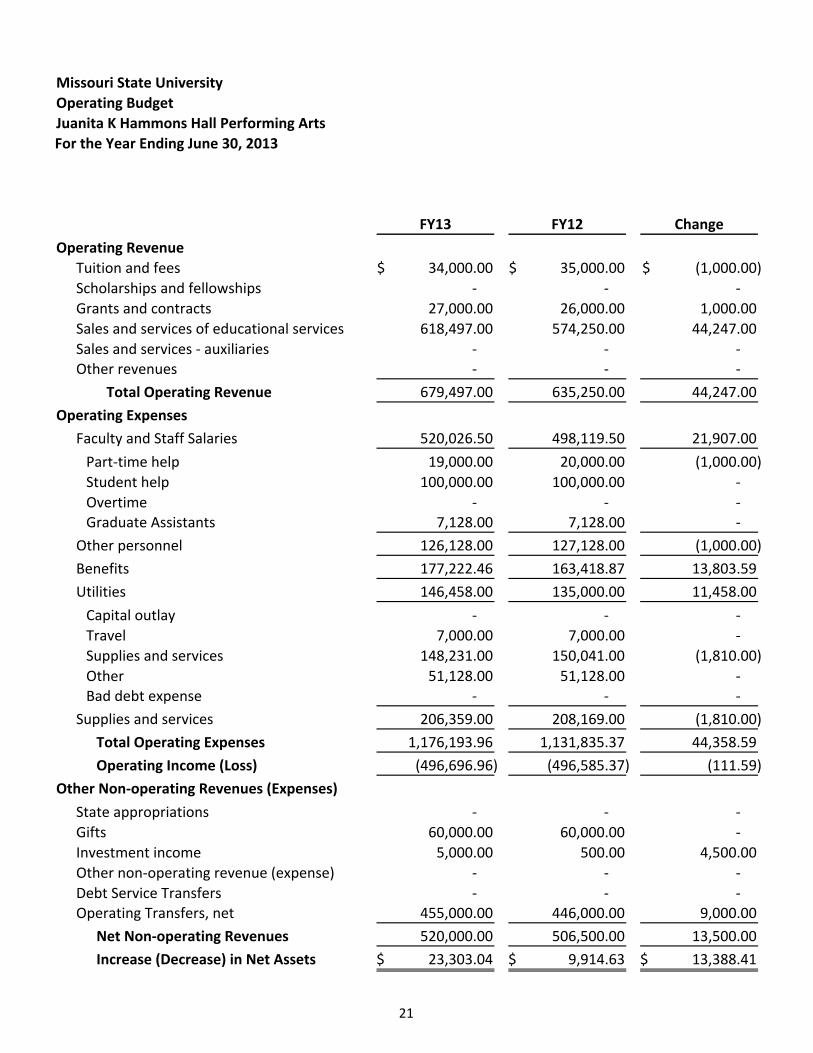
Juanita K Hammons Hall Performing Arts
For the Year Ending June 30, 2013
FY13 FY12 Change
Operating Revenue
Tuition and fees 34,000.00$ 35,000.00$ (1,000.00)$
Scholarships and fellowships ‐ ‐ ‐
Grants and contracts 27,000.00 26,000.00 1,000.00
Sales and services of educational services 618,497.00 574,250.00 44,247.00
Sales and services ‐ auxiliaries ‐ ‐ ‐ Other revenues ‐ ‐ ‐
Total Operating Revenue 679,497.00 635,250.00 44,247.00
Operating Expenses
Faculty and Staff Salaries 520,026.50 498,119.50 21,907.00
Part‐time help 19,000.00 20,000.00 (1,000.00)
Student help 100,000.00 100,000.00 ‐
Overtime ‐ ‐ ‐ Graduate Assistants 7,128.00 7,128.00 ‐
Other personnel 126,128.00 127,128.00 (1,000.00)
Benefits 177,222.46 163,418.87 13,803.59
Utilities 146,458.00 135,000.00 11,458.00
Capital outlay ‐ ‐ ‐
Travel 7,000.00 7,000.00 ‐
Supplies and services 148,231.00 150,041.00 (1,810.00)
Other 51,128.00 51,128.00 ‐ Bad debt expense ‐ ‐ ‐
Supplies and services 206,359.00 208,169.00 (1,810.00)
Total Operating Expenses 1,176,193.96 1,131,835.37 44,358.59
Operating Income (Loss) (496,696.96) (496,585.37) (111.59)
Other Non‐operating Revenues (Expenses)
State appropriations ‐ ‐ ‐
Gifts 60,000.00 60,000.00 ‐
Investment income 5,000.00 500.00 4,500.00
Other non‐operating revenue (expense) ‐ ‐ ‐
Debt Service Transfers ‐ ‐ ‐ Operating Transfers, net 455,000.00 446,000.00 9,000.00
Net Non‐operating Revenues 520,000.00 506,500.00 13,500.00
Increase (Decrease) in Net Assets 23,303.04$ 9,914.63$ 13,388.41$
21

AUXILIARY SYSTEM FUND
YEAR ENDING JUNE 30, 2013
Missouri State University
Operating Budget
Auxiliary Funds
For the Year Ending June 30, 2013
Plaster Taylor
Residence Student Health Intercollegiate AthleticBookstore Life Union Center Athletics Facilities
Operating Revenue
Tuition and fees ‐$ ‐$ 1,779,225.00$ 1,897,000.00$ ‐$ 1,957,000.00$
Scholarships and fellowships ‐ (769,312.00) ‐ ‐ (3,694,446.00) ‐
Grants and contracts ‐ ‐ ‐ ‐ ‐ ‐
Sales and services of educational services ‐ ‐ ‐ ‐ ‐ ‐
Sales and services ‐ auxiliaries 3,375,000.00 29,427,391.00 860,500.00 1,905,000.00 5,086,998.00 601,300.00 Other revenues ‐ 342,284.00 ‐ ‐ ‐ ‐
Total Operating Revenue 3,375,000.00 29,000,363.00 2,639,725.00 3,802,000.00 1,392,552.00 2,558,300.00
Operating ExpensesFaculty and Staff Salaries 617,622.15 3,388,383.00 822,486.00 2,023,674.00 3,593,185.08 566,602.50
Part‐time help 125,000.00 88,093.00 ‐ 250,000.00 162,115.00 37,000.00
Student help 510,000.00 501,920.00 150,500.00 82,000.00 123,500.00 241,175.00
Overtime ‐ ‐ ‐ ‐ ‐ ‐ Graduate Assistants ‐ 187,154.00 61,330.00 11,880.00 32,000.00 37,525.00
Other personnel 635,000.00 777,167.00 211,830.00 343,880.00 317,615.00 315,700.00
Benefits 214,262.80 1,131,749.13 274,721.69 699,746.80 1,213,040.35 205,796.14
Utilities 29,418.00 1,609,300.00 285,848.00 ‐ ‐ 380,000.00
Capital outlay 25,000.00 304,566.00 25,000.00 20,000.00 ‐ 20,000.00
Travel 10,000.00 62,400.00 21,100.00 11,000.00 1,642,600.00 3,000.00
Supplies and services 330,137.00 9,476,787.00 294,236.00 304,000.00 1,338,600.00 316,301.00
Other 135,000.00 748,719.00 23,630.00 72,000.00 920,300.00 65,903.00 Bad debt expense 65,000.00 100,000.00 ‐ ‐ ‐ ‐
Supplies and services 565,137.00 10,692,472.00 363,966.00 407,000.00 3,901,500.00 405,204.00
Total Operating Expenses 2,061,439.95 17,599,071.13 1,958,851.69 3,474,300.80 9,025,340.43 1,873,302.64
Operating Income (Loss) 1,313,560.05 11,401,291.87 680,873.31 327,699.20 (7,632,788.43) 684,997.36
Other Non‐operating Revenues (Expenses)
State appropriations ‐ ‐ ‐ ‐ ‐ ‐
Gifts ‐ ‐ ‐ ‐ 1,521,970.00 3,766,729.00
Investment income ‐ 20,000.00 ‐ ‐ ‐ 2,000.00
Other non‐operating revenue (expense) ‐ ‐ ‐ ‐ ‐ ‐
Debt Service Transfers ‐ (3,195,147.00) (1,243,870.00) ‐ ‐ (4,716,366.00) Operating Transfers, net (1,225,765.00) (5,926,145.00) 578,229.00 (307,606.00) 4,725,986.00 263,354.00
Net Non‐operating Revenues (1,225,765.00) (9,101,292.00) (665,641.00) (307,606.00) 6,247,956.00 (684,283.00)
Increase (Decrease) in Net Assets 87,795.05$ 2,299,999.87$ 15,232.31$ 20,093.20$ (1,384,832.43)$ 714.36$
22
Bill R. Foster
and Family
RecreationTransit Center FY13 FY12 Change
Operating Revenue
1,143,000.00$ 2,639,000.00$ 9,415,225.00$ 9,445,860.00$ (30,635.00)$ Tuition and fees
‐ ‐ (4,463,758.00) (4,324,635.00) (139,123.00) Scholarships and fellowships
‐ ‐ ‐ ‐ ‐ Grants and contracts
‐ ‐ ‐ ‐ ‐ Sales and services of educational services
1,931,000.00 75,500.00 43,262,689.00 41,055,753.00 2,206,936.00 Sales and services ‐ auxiliaries‐ 271,100.00 613,384.00 613,384.49 (0.49) Other revenues
3,074,000.00 2,985,600.00 48,827,540.00 46,790,362.49 2,037,177.51 Total Operating Revenue
Operating Expenses892,102.00 396,557.00 12,300,611.73 11,627,473.69 673,138.04 Faculty and Staff Salaries
53,000.00 10,000.00 725,208.00 602,893.00 122,315.00 Part‐time help
47,275.00 486,740.00 2,143,110.00 2,249,210.00 (106,100.00) Student help
‐ ‐ ‐ 127,911.00 (127,911.00) Overtime‐ 74,570.00 404,459.00 385,317.00 19,142.00 Graduate Assistants
100,275.00 571,310.00 3,272,777.00 3,365,331.00 (92,554.00) Other personnel
292,909.98 133,111.28 4,165,338.17 3,832,422.75 332,915.42 Benefits
141,975.00 343,792.00 2,790,333.00 3,037,171.00 (246,838.00) Utilities
6,500.00 100,000.00 501,066.00 401,066.00 100,000.00 Capital outlay
5,200.00 36,250.00 1,791,550.00 1,395,300.00 396,250.00 Travel
1,248,600.00 237,285.00 13,545,946.00 12,031,373.00 1,514,573.00 Supplies and services
5,000.00 30,240.00 2,000,792.00 1,812,495.00 188,297.00 Other‐ ‐ 165,000.00 134,484.00 30,516.00 Bad debt expense
1,265,300.00 403,775.00 18,004,354.00 15,774,718.00 2,229,636.00 Supplies and services
2,692,561.98 1,848,545.28 40,533,413.90 37,637,116.44 2,896,297.46 Total Operating Expenses
381,438.02 1,137,054.72 8,294,126.10 9,153,246.05 (859,119.95) Operating Income (Loss)
Other Non‐operating Revenues (Expenses)
‐ ‐ ‐ ‐ ‐ State appropriations
‐ 252,200.00 5,540,899.00 6,018,872.00 (477,973.00) Gifts
5,000.00 ‐ 27,000.00 34,976.00 (7,976.00) Investment income
‐ ‐ ‐ ‐ ‐ Other non‐operating revenue (expense)
(384,295.00) (1,273,384.00) (10,813,062.00) (10,127,413.00) (685,649.00) Debt Service Transfers(1,614.00) ‐ (1,893,561.00) (1,070,228.00) (823,333.00) Operating Transfers, net
(380,909.00) (1,021,184.00) (7,138,724.00) (5,143,793.00) (1,994,931.00) Net Non‐operating Revenues
529.02$ 115,870.72$ 1,155,402.10$ 4,009,453.05$ (2,854,050.95)$ Increase (Decrease) in Net Assets
23
Missouri State University
Operating Budget
Athletic Facilities
For the Year Ending June 30, 2013
Plaster Hammons
Sports Student JQHComplex Center Arena
Operating Revenue
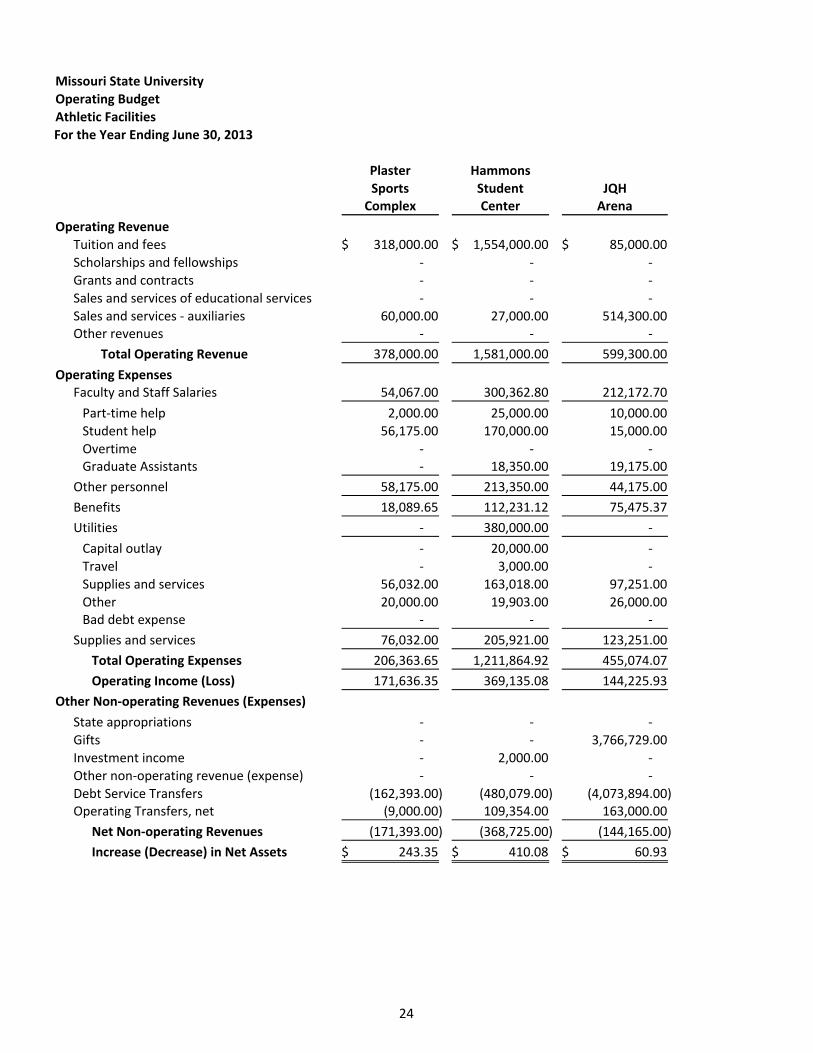
Tuition and fees 318,000.00$ 1,554,000.00$ 85,000.00$
Scholarships and fellowships ‐ ‐ ‐
Grants and contracts ‐ ‐ ‐
Sales and services of educational services ‐ ‐ ‐
Sales and services ‐ auxiliaries 60,000.00 27,000.00 514,300.00 Other revenues ‐ ‐ ‐
Total Operating Revenue 378,000.00 1,581,000.00 599,300.00
Operating ExpensesFaculty and Staff Salaries 54,067.00 300,362.80 212,172.70
Part‐time help 2,000.00 25,000.00 10,000.00
Student help 56,175.00 170,000.00 15,000.00
Overtime ‐ ‐ ‐ Graduate Assistants ‐ 18,350.00 19,175.00
Other personnel 58,175.00 213,350.00 44,175.00
Benefits 18,089.65 112,231.12 75,475.37
Utilities ‐ 380,000.00 ‐
Capital outlay ‐ 20,000.00 ‐
Travel ‐ 3,000.00 ‐
Supplies and services 56,032.00 163,018.00 97,251.00
Other 20,000.00 19,903.00 26,000.00 Bad debt expense ‐ ‐ ‐
Supplies and services 76,032.00 205,921.00 123,251.00
Total Operating Expenses 206,363.65 1,211,864.92 455,074.07
Operating Income (Loss) 171,636.35 369,135.08 144,225.93
Other Non‐operating Revenues (Expenses)
State appropriations ‐ ‐ ‐
Gifts ‐ ‐ 3,766,729.00
Investment income ‐ 2,000.00 ‐
Other non‐operating revenue (expense) ‐ ‐ ‐
Debt Service Transfers (162,393.00) (480,079.00) (4,073,894.00) Operating Transfers, net (9,000.00) 109,354.00 163,000.00
Net Non‐operating Revenues (171,393.00) (368,725.00) (144,165.00)
Increase (Decrease) in Net Assets 243.35$ 410.08$ 60.93$
24
FY13 FY12 Change
Operating Revenue
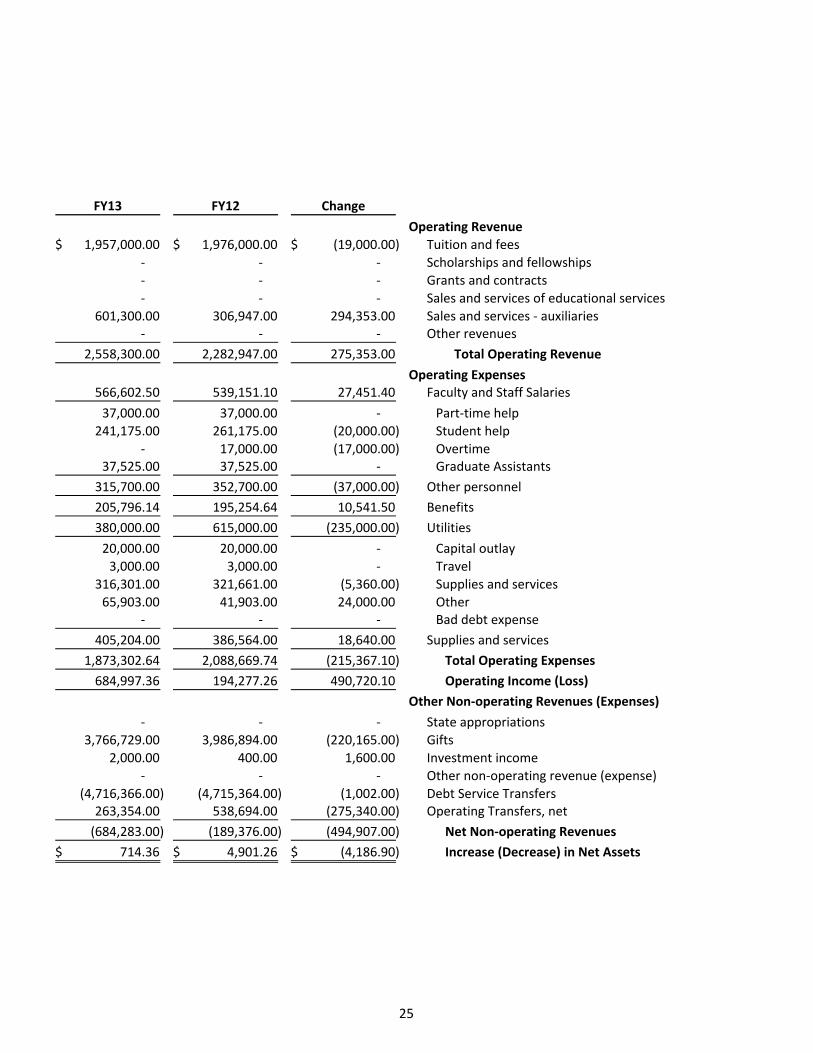
1,957,000.00$ 1,976,000.00$ (19,000.00)$ Tuition and fees
‐ ‐ ‐ Scholarships and fellowships
‐ ‐ ‐ Grants and contracts
‐ ‐ ‐ Sales and services of educational services
601,300.00 306,947.00 294,353.00 Sales and services ‐ auxiliaries‐ ‐ ‐ Other revenues
2,558,300.00 2,282,947.00 275,353.00 Total Operating Revenue
Operating Expenses566,602.50 539,151.10 27,451.40 Faculty and Staff Salaries
37,000.00 37,000.00 ‐ Part‐time help
241,175.00 261,175.00 (20,000.00) Student help
‐ 17,000.00 (17,000.00) Overtime37,525.00 37,525.00 ‐ Graduate Assistants
315,700.00 352,700.00 (37,000.00) Other personnel
205,796.14 195,254.64 10,541.50 Benefits
380,000.00 615,000.00 (235,000.00) Utilities
20,000.00 20,000.00 ‐ Capital outlay
3,000.00 3,000.00 ‐ Travel
316,301.00 321,661.00 (5,360.00) Supplies and services
65,903.00 41,903.00 24,000.00 Other‐ ‐ ‐ Bad debt expense
405,204.00 386,564.00 18,640.00 Supplies and services
1,873,302.64 2,088,669.74 (215,367.10) Total Operating Expenses
684,997.36 194,277.26 490,720.10 Operating Income (Loss)
Other Non‐operating Revenues (Expenses)
‐ ‐ ‐ State appropriations
3,766,729.00 3,986,894.00 (220,165.00) Gifts
2,000.00 400.00 1,600.00 Investment income
‐ ‐ ‐ Other non‐operating revenue (expense)
(4,716,366.00) (4,715,364.00) (1,002.00) Debt Service Transfers263,354.00 538,694.00 (275,340.00) Operating Transfers, net
(684,283.00) (189,376.00) (494,907.00) Net Non‐operating Revenues
714.36$ 4,901.26$ (4,186.90)$ Increase (Decrease) in Net Assets
25
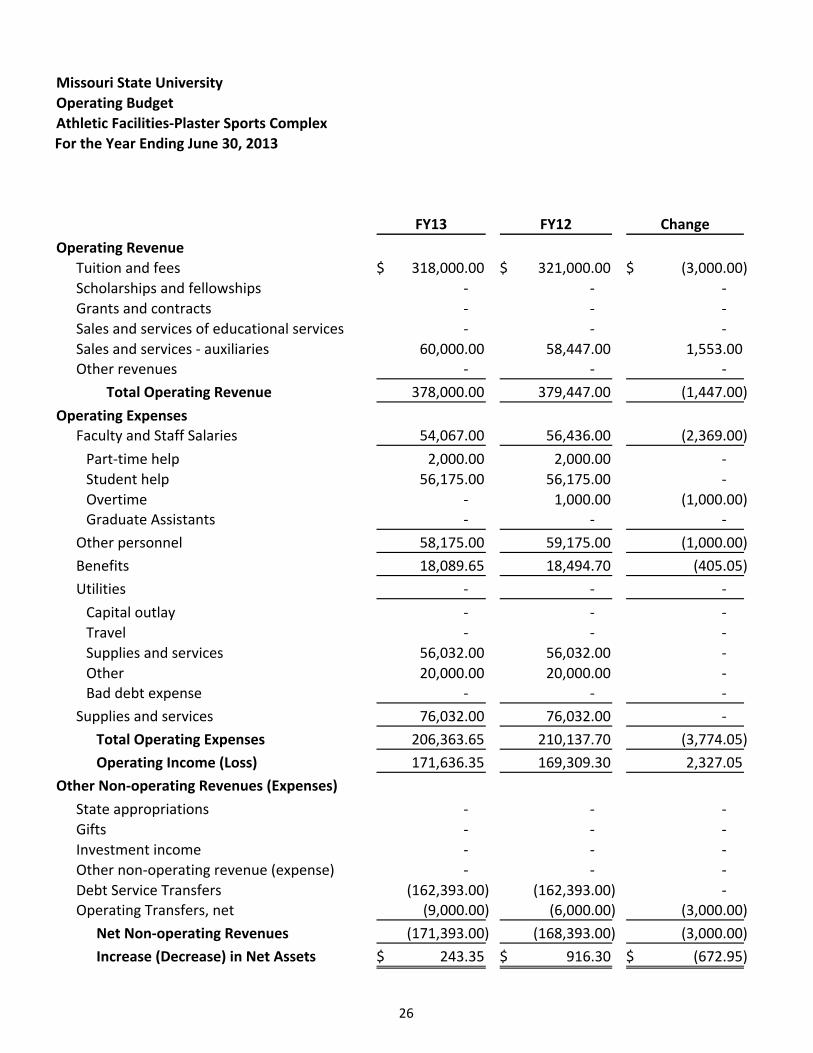
Missouri State University
Operating Budget
Athletic Facilities‐Plaster Sports Complex
For the Year Ending June 30, 2013
FY13 FY12 Change
Operating Revenue
Tuition and fees 318,000.00$ 321,000.00$ (3,000.00)$
Scholarships and fellowships ‐ ‐ ‐
Grants and contracts ‐ ‐ ‐
Sales and services of educational services ‐ ‐ ‐
Sales and services ‐ auxiliaries 60,000.00 58,447.00 1,553.00 Other revenues ‐ ‐ ‐
Total Operating Revenue 378,000.00 379,447.00 (1,447.00)
Operating ExpensesFaculty and Staff Salaries 54,067.00 56,436.00 (2,369.00)
Part‐time help 2,000.00 2,000.00 ‐
Student help 56,175.00 56,175.00 ‐
Overtime ‐ 1,000.00 (1,000.00) Graduate Assistants ‐ ‐ ‐
Other personnel 58,175.00 59,175.00 (1,000.00)
Benefits 18,089.65 18,494.70 (405.05)
Utilities ‐ ‐ ‐
Capital outlay ‐ ‐ ‐
Travel ‐ ‐ ‐
Supplies and services 56,032.00 56,032.00 ‐
Other 20,000.00 20,000.00 ‐
Bad debt expense ‐ ‐ ‐
Supplies and services 76,032.00 76,032.00 ‐
Total Operating Expenses 206,363.65 210,137.70 (3,774.05)
Operating Income (Loss) 171,636.35 169,309.30 2,327.05
Other Non‐operating Revenues (Expenses)
State appropriations ‐ ‐ ‐
Gifts ‐ ‐ ‐
Investment income ‐ ‐ ‐
Other non‐operating revenue (expense) ‐ ‐ ‐
Debt Service Transfers (162,393.00) (162,393.00) ‐ Operating Transfers, net (9,000.00) (6,000.00) (3,000.00)
Net Non‐operating Revenues (171,393.00) (168,393.00) (3,000.00)
Increase (Decrease) in Net Assets 243.35$ 916.30$ (672.95)$
26
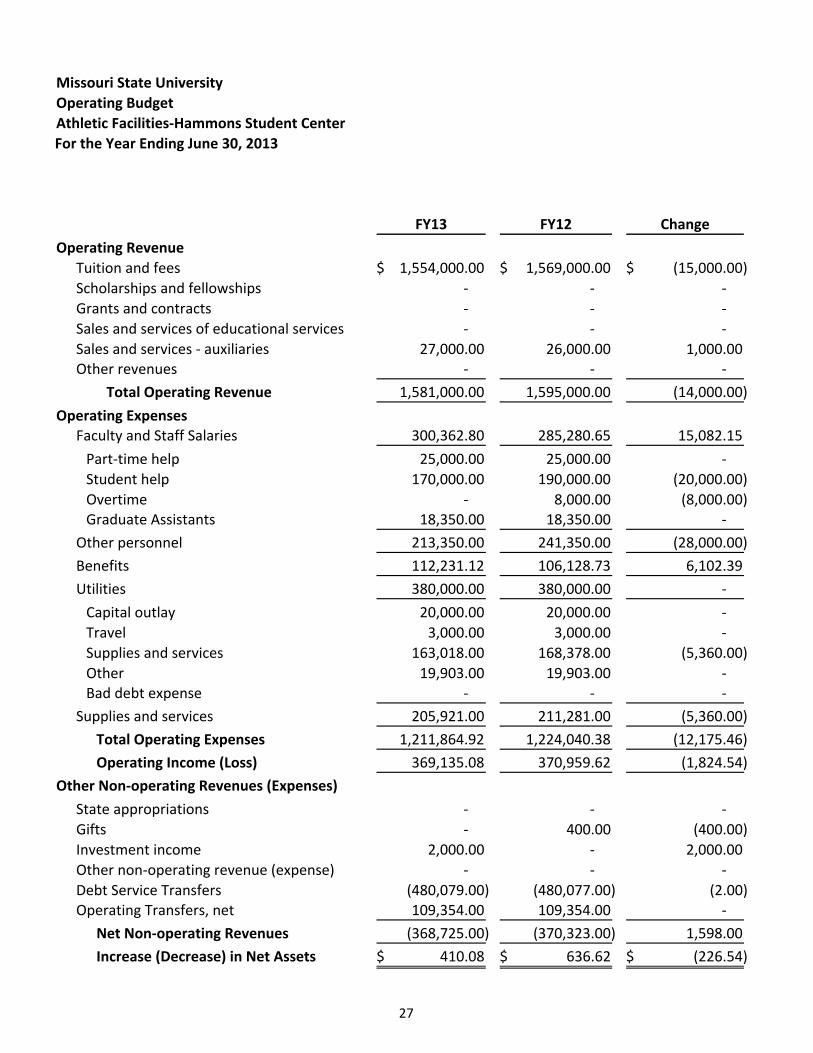
Missouri State University
Operating Budget
Athletic Facilities‐Hammons Student Center
For the Year Ending June 30, 2013
FY13 FY12 Change
Operating Revenue
Tuition and fees 1,554,000.00$ 1,569,000.00$ (15,000.00)$
Scholarships and fellowships ‐ ‐ ‐
Grants and contracts ‐ ‐ ‐
Sales and services of educational services ‐ ‐ ‐
Sales and services ‐ auxiliaries 27,000.00 26,000.00 1,000.00 Other revenues ‐ ‐ ‐
Total Operating Revenue 1,581,000.00 1,595,000.00 (14,000.00)
Operating ExpensesFaculty and Staff Salaries 300,362.80 285,280.65 15,082.15
Part‐time help 25,000.00 25,000.00 ‐
Student help 170,000.00 190,000.00 (20,000.00)
Overtime ‐ 8,000.00 (8,000.00) Graduate Assistants 18,350.00 18,350.00 ‐
Other personnel 213,350.00 241,350.00 (28,000.00)
Benefits 112,231.12 106,128.73 6,102.39
Utilities 380,000.00 380,000.00 ‐
Capital outlay 20,000.00 20,000.00 ‐
Travel 3,000.00 3,000.00 ‐
Supplies and services 163,018.00 168,378.00 (5,360.00)
Other 19,903.00 19,903.00 ‐
Bad debt expense ‐ ‐ ‐
Supplies and services 205,921.00 211,281.00 (5,360.00)
Total Operating Expenses 1,211,864.92 1,224,040.38 (12,175.46)
Operating Income (Loss) 369,135.08 370,959.62 (1,824.54)
Other Non‐operating Revenues (Expenses)
State appropriations ‐ ‐ ‐
Gifts ‐ 400.00 (400.00)
Investment income 2,000.00 ‐ 2,000.00
Other non‐operating revenue (expense) ‐ ‐ ‐
Debt Service Transfers (480,079.00) (480,077.00) (2.00) Operating Transfers, net 109,354.00 109,354.00 ‐
Net Non‐operating Revenues (368,725.00) (370,323.00) 1,598.00
Increase (Decrease) in Net Assets 410.08$ 636.62$ (226.54)$
27
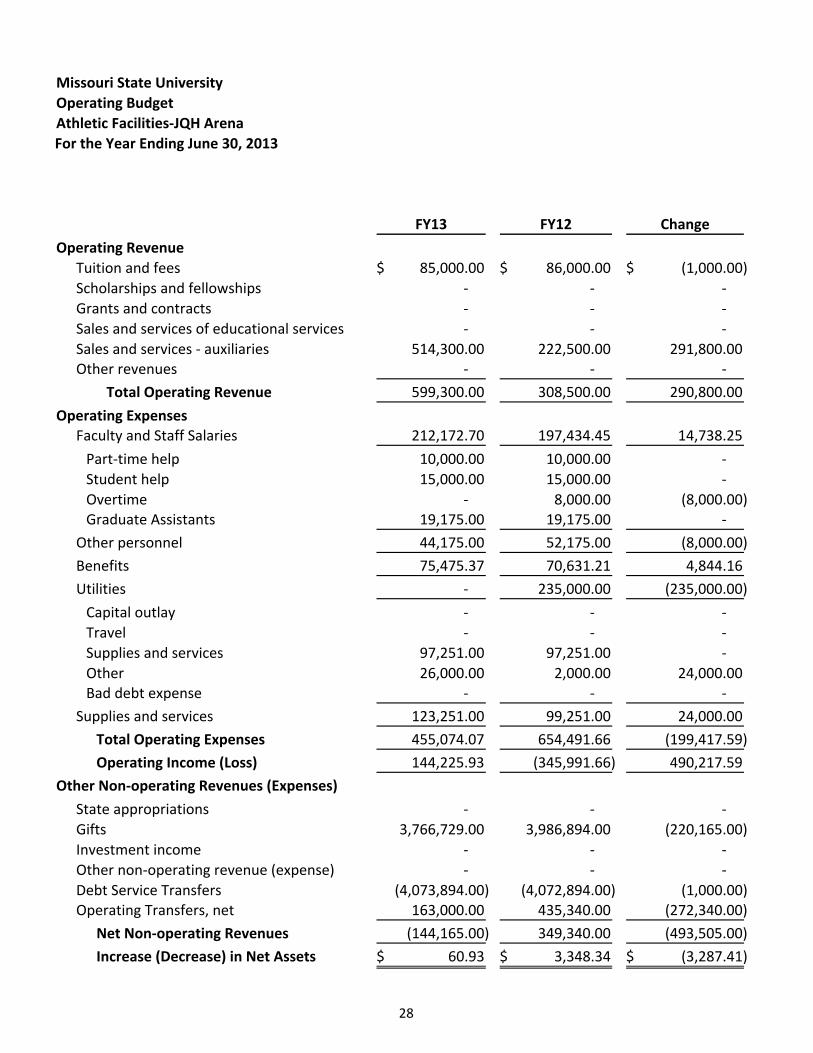
Missouri State University
Operating Budget
Athletic Facilities‐JQH Arena
For the Year Ending June 30, 2013
FY13 FY12 Change
Operating Revenue
Tuition and fees 85,000.00$ 86,000.00$ (1,000.00)$
Scholarships and fellowships ‐ ‐ ‐
Grants and contracts ‐ ‐ ‐
Sales and services of educational services ‐ ‐ ‐
Sales and services ‐ auxiliaries 514,300.00 222,500.00 291,800.00 Other revenues ‐ ‐ ‐
Total Operating Revenue 599,300.00 308,500.00 290,800.00
Operating ExpensesFaculty and Staff Salaries 212,172.70 197,434.45 14,738.25
Part‐time help 10,000.00 10,000.00 ‐
Student help 15,000.00 15,000.00 ‐
Overtime ‐ 8,000.00 (8,000.00) Graduate Assistants 19,175.00 19,175.00 ‐
Other personnel 44,175.00 52,175.00 (8,000.00)
Benefits 75,475.37 70,631.21 4,844.16
Utilities ‐ 235,000.00 (235,000.00)
Capital outlay ‐ ‐ ‐
Travel ‐ ‐ ‐
Supplies and services 97,251.00 97,251.00 ‐
Other 26,000.00 2,000.00 24,000.00
Bad debt expense ‐ ‐ ‐
Supplies and services 123,251.00 99,251.00 24,000.00
Total Operating Expenses 455,074.07 654,491.66 (199,417.59)
Operating Income (Loss) 144,225.93 (345,991.66) 490,217.59
Other Non‐operating Revenues (Expenses)
State appropriations ‐ ‐ ‐
Gifts 3,766,729.00 3,986,894.00 (220,165.00)
Investment income ‐ ‐ ‐
Other non‐operating revenue (expense) ‐ ‐ ‐
Debt Service Transfers (4,073,894.00) (4,072,894.00) (1,000.00) Operating Transfers, net 163,000.00 435,340.00 (272,340.00)
Net Non‐operating Revenues (144,165.00) 349,340.00 (493,505.00)
Increase (Decrease) in Net Assets 60.93$ 3,348.34$ (3,287.41)$
28
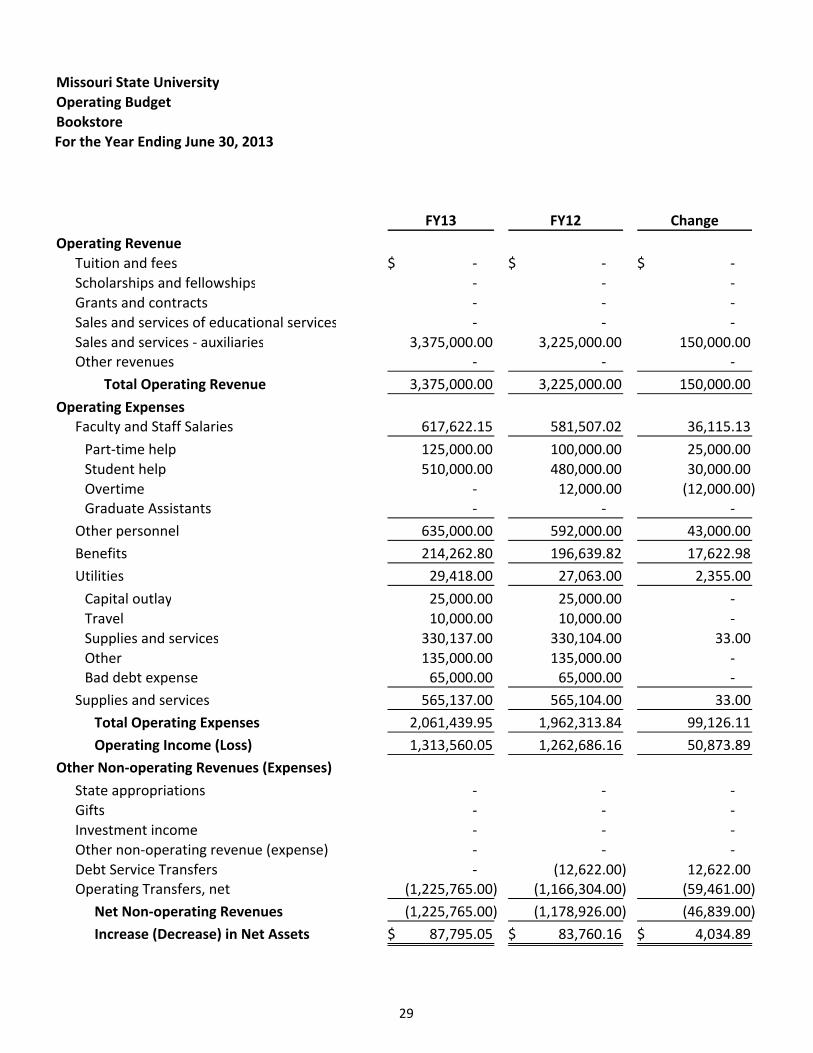
Missouri State University
Operating Budget
Bookstore
For the Year Ending June 30, 2013
FY13 FY12 Change
Operating Revenue
Tuition and fees ‐$ ‐$ ‐$
Scholarships and fellowships ‐ ‐ ‐
Grants and contracts ‐ ‐ ‐
Sales and services of educational services ‐ ‐ ‐
Sales and services ‐ auxiliaries 3,375,000.00 3,225,000.00 150,000.00 Other revenues ‐ ‐ ‐
Total Operating Revenue 3,375,000.00 3,225,000.00 150,000.00
Operating ExpensesFaculty and Staff Salaries 617,622.15 581,507.02 36,115.13
Part‐time help 125,000.00 100,000.00 25,000.00
Student help 510,000.00 480,000.00 30,000.00
Overtime ‐ 12,000.00 (12,000.00) Graduate Assistants ‐ ‐ ‐
Other personnel 635,000.00 592,000.00 43,000.00
Benefits 214,262.80 196,639.82 17,622.98
Utilities 29,418.00 27,063.00 2,355.00
Capital outlay 25,000.00 25,000.00 ‐
Travel 10,000.00 10,000.00 ‐
Supplies and services 330,137.00 330,104.00 33.00
Other 135,000.00 135,000.00 ‐ Bad debt expense 65,000.00 65,000.00 ‐
Supplies and services 565,137.00 565,104.00 33.00
Total Operating Expenses 2,061,439.95 1,962,313.84 99,126.11
Operating Income (Loss) 1,313,560.05 1,262,686.16 50,873.89
Other Non‐operating Revenues (Expenses)
State appropriations ‐ ‐ ‐
Gifts ‐ ‐ ‐
Investment income ‐ ‐ ‐
Other non‐operating revenue (expense) ‐ ‐ ‐
Debt Service Transfers ‐ (12,622.00) 12,622.00 Operating Transfers, net (1,225,765.00) (1,166,304.00) (59,461.00)
Net Non‐operating Revenues (1,225,765.00) (1,178,926.00) (46,839.00)
Increase (Decrease) in Net Assets 87,795.05$ 83,760.16$ 4,034.89$
29
Missouri State University
Operating Budget
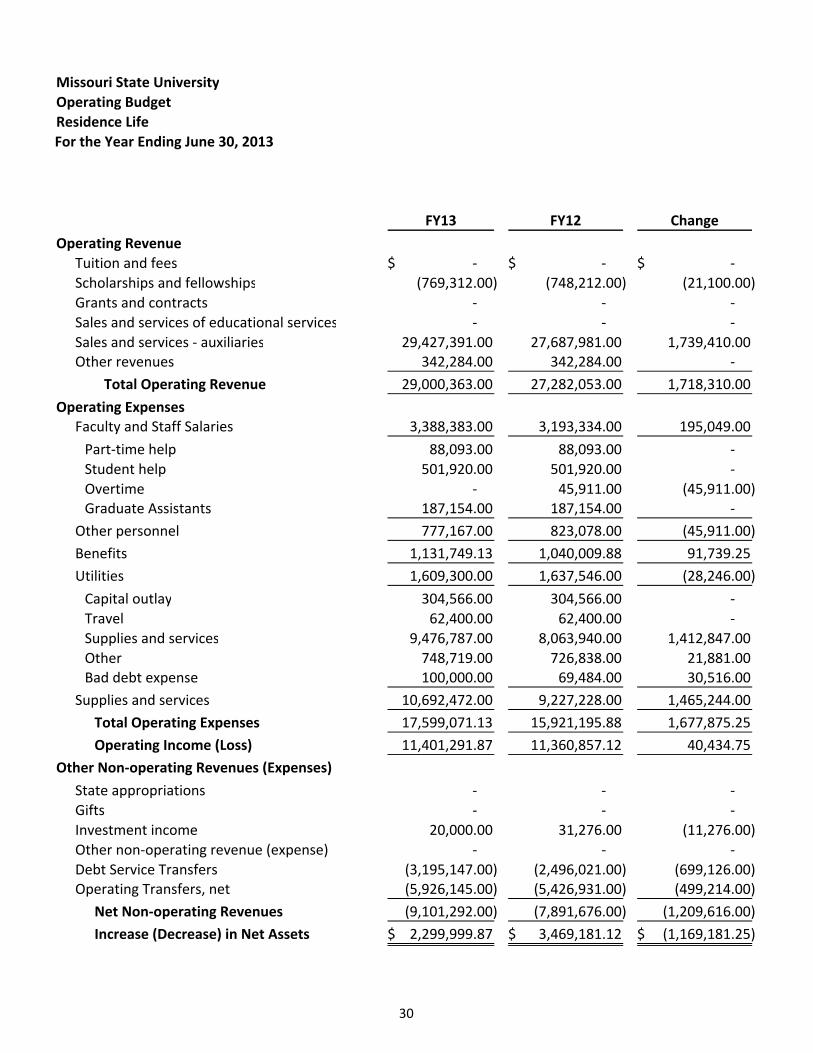
Residence Life
For the Year Ending June 30, 2013
FY13 FY12 Change
Operating Revenue
Tuition and fees ‐$ ‐$ ‐$
Scholarships and fellowships (769,312.00) (748,212.00) (21,100.00)
Grants and contracts ‐ ‐ ‐
Sales and services of educational services ‐ ‐ ‐
Sales and services ‐ auxiliaries 29,427,391.00 27,687,981.00 1,739,410.00 Other revenues 342,284.00 342,284.00 ‐
Total Operating Revenue 29,000,363.00 27,282,053.00 1,718,310.00
Operating ExpensesFaculty and Staff Salaries 3,388,383.00 3,193,334.00 195,049.00
Part‐time help 88,093.00 88,093.00 ‐
Student help 501,920.00 501,920.00 ‐
Overtime ‐ 45,911.00 (45,911.00) Graduate Assistants 187,154.00 187,154.00 ‐
Other personnel 777,167.00 823,078.00 (45,911.00)
Benefits 1,131,749.13 1,040,009.88 91,739.25
Utilities 1,609,300.00 1,637,546.00 (28,246.00)
Capital outlay 304,566.00 304,566.00 ‐
Travel 62,400.00 62,400.00 ‐
Supplies and services 9,476,787.00 8,063,940.00 1,412,847.00
Other 748,719.00 726,838.00 21,881.00 Bad debt expense 100,000.00 69,484.00 30,516.00
Supplies and services 10,692,472.00 9,227,228.00 1,465,244.00
Total Operating Expenses 17,599,071.13 15,921,195.88 1,677,875.25
Operating Income (Loss) 11,401,291.87 11,360,857.12 40,434.75
Other Non‐operating Revenues (Expenses)
State appropriations ‐ ‐ ‐
Gifts ‐ ‐ ‐
Investment income 20,000.00 31,276.00 (11,276.00)
Other non‐operating revenue (expense) ‐ ‐ ‐
Debt Service Transfers (3,195,147.00) (2,496,021.00) (699,126.00) Operating Transfers, net (5,926,145.00) (5,426,931.00) (499,214.00)
Net Non‐operating Revenues (9,101,292.00) (7,891,676.00) (1,209,616.00)
Increase (Decrease) in Net Assets 2,299,999.87$ 3,469,181.12$ (1,169,181.25)$
30
Missouri State University
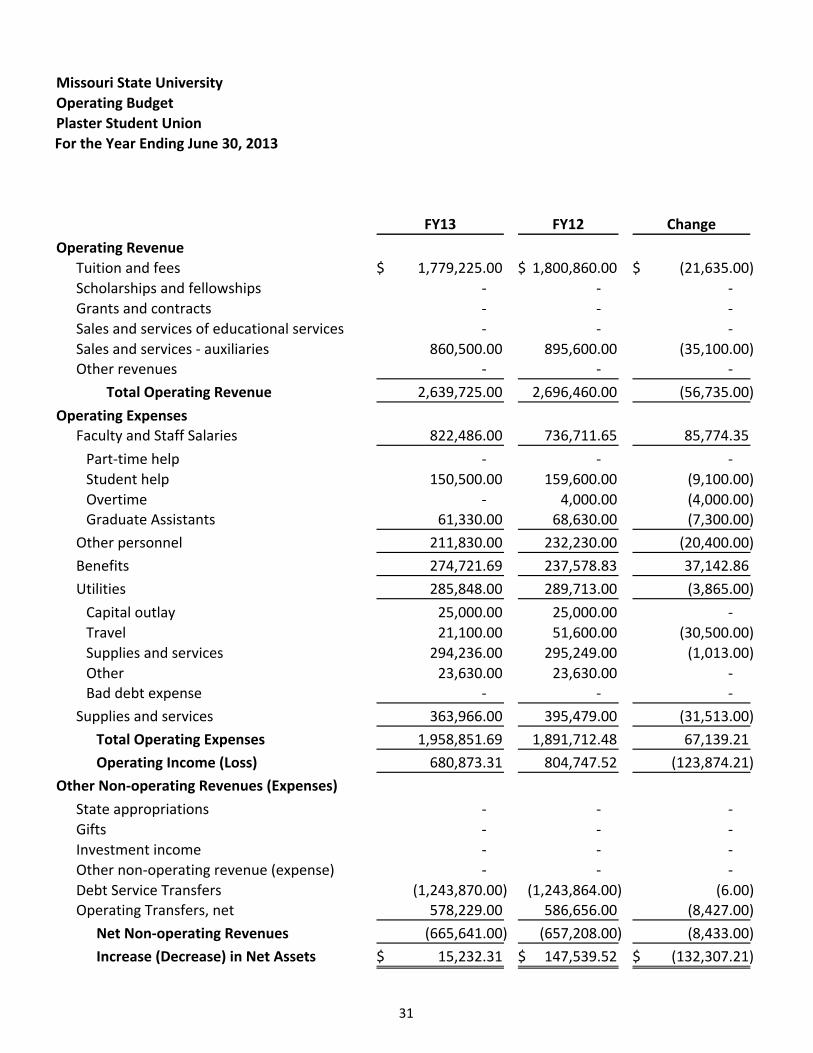
Operating Budget
Plaster Student Union
For the Year Ending June 30, 2013
FY13 FY12 Change
Operating Revenue
Tuition and fees 1,779,225.00$ 1,800,860.00$ (21,635.00)$
Scholarships and fellowships ‐ ‐ ‐
Grants and contracts ‐ ‐ ‐
Sales and services of educational services ‐ ‐ ‐
Sales and services ‐ auxiliaries 860,500.00 895,600.00 (35,100.00) Other revenues ‐ ‐ ‐
Total Operating Revenue 2,639,725.00 2,696,460.00 (56,735.00)
Operating ExpensesFaculty and Staff Salaries 822,486.00 736,711.65 85,774.35
Part‐time help ‐ ‐ ‐
Student help 150,500.00 159,600.00 (9,100.00)
Overtime ‐ 4,000.00 (4,000.00) Graduate Assistants 61,330.00 68,630.00 (7,300.00)
Other personnel 211,830.00 232,230.00 (20,400.00)
Benefits 274,721.69 237,578.83 37,142.86
Utilities 285,848.00 289,713.00 (3,865.00)
Capital outlay 25,000.00 25,000.00 ‐
Travel 21,100.00 51,600.00 (30,500.00)
Supplies and services 294,236.00 295,249.00 (1,013.00)
Other 23,630.00 23,630.00 ‐
Bad debt expense ‐ ‐ ‐
Supplies and services 363,966.00 395,479.00 (31,513.00)
Total Operating Expenses 1,958,851.69 1,891,712.48 67,139.21
Operating Income (Loss) 680,873.31 804,747.52 (123,874.21)
Other Non‐operating Revenues (Expenses)
State appropriations ‐ ‐ ‐
Gifts ‐ ‐ ‐
Investment income ‐ ‐ ‐
Other non‐operating revenue (expense) ‐ ‐ ‐
Debt Service Transfers (1,243,870.00) (1,243,864.00) (6.00) Operating Transfers, net 578,229.00 586,656.00 (8,427.00)
Net Non‐operating Revenues (665,641.00) (657,208.00) (8,433.00)
Increase (Decrease) in Net Assets 15,232.31$ 147,539.52$ (132,307.21)$
31
Missouri State University
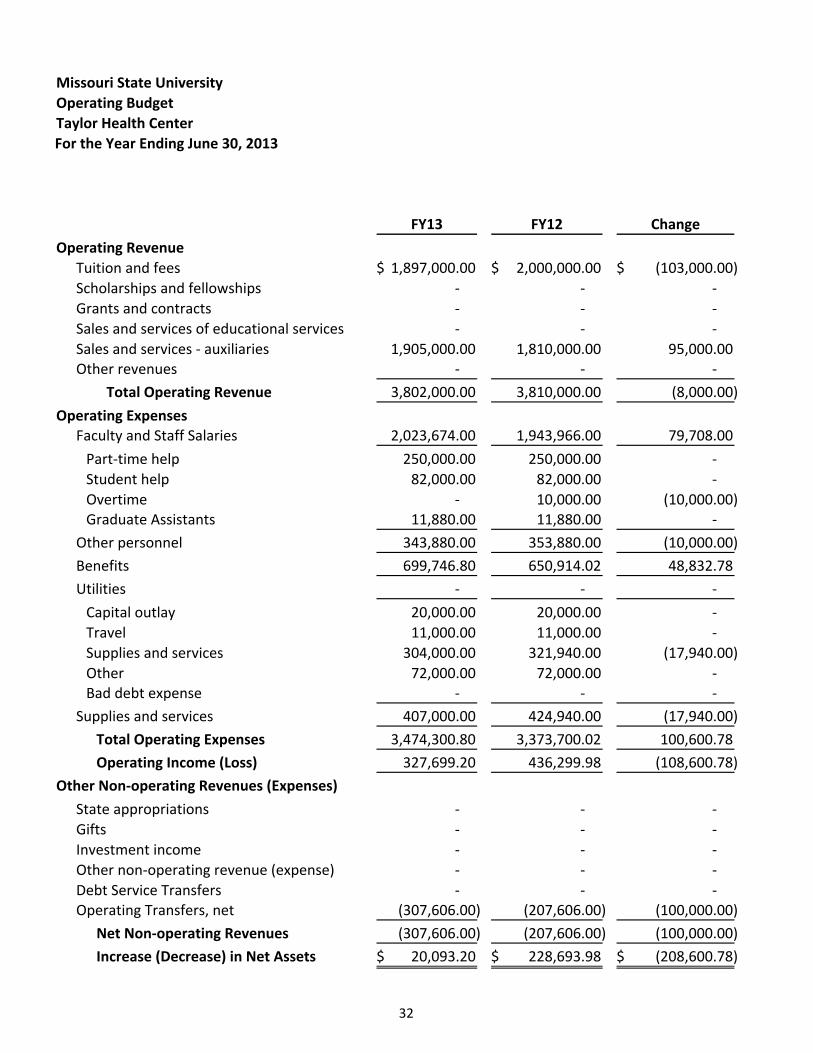
Operating Budget
Taylor Health Center
For the Year Ending June 30, 2013
FY13 FY12 Change
Operating Revenue
Tuition and fees 1,897,000.00$ 2,000,000.00$ (103,000.00)$
Scholarships and fellowships ‐ ‐ ‐
Grants and contracts ‐ ‐ ‐
Sales and services of educational services ‐ ‐ ‐
Sales and services ‐ auxiliaries 1,905,000.00 1,810,000.00 95,000.00 Other revenues ‐ ‐ ‐
Total Operating Revenue 3,802,000.00 3,810,000.00 (8,000.00)
Operating ExpensesFaculty and Staff Salaries 2,023,674.00 1,943,966.00 79,708.00
Part‐time help 250,000.00 250,000.00 ‐
Student help 82,000.00 82,000.00 ‐
Overtime ‐ 10,000.00 (10,000.00) Graduate Assistants 11,880.00 11,880.00 ‐
Other personnel 343,880.00 353,880.00 (10,000.00)
Benefits 699,746.80 650,914.02 48,832.78
Utilities ‐ ‐ ‐
Capital outlay 20,000.00 20,000.00 ‐
Travel 11,000.00 11,000.00 ‐
Supplies and services 304,000.00 321,940.00 (17,940.00)
Other 72,000.00 72,000.00 ‐
Bad debt expense ‐ ‐ ‐
Supplies and services 407,000.00 424,940.00 (17,940.00)
Total Operating Expenses 3,474,300.80 3,373,700.02 100,600.78
Operating Income (Loss) 327,699.20 436,299.98 (108,600.78)
Other Non‐operating Revenues (Expenses)
State appropriations ‐ ‐ ‐
Gifts ‐ ‐ ‐
Investment income ‐ ‐ ‐
Other non‐operating revenue (expense) ‐ ‐ ‐
Debt Service Transfers ‐ ‐ ‐ Operating Transfers, net (307,606.00) (207,606.00) (100,000.00)
Net Non‐operating Revenues (307,606.00) (207,606.00) (100,000.00)
Increase (Decrease) in Net Assets 20,093.20$ 228,693.98$ (208,600.78)$
32
Missouri State University
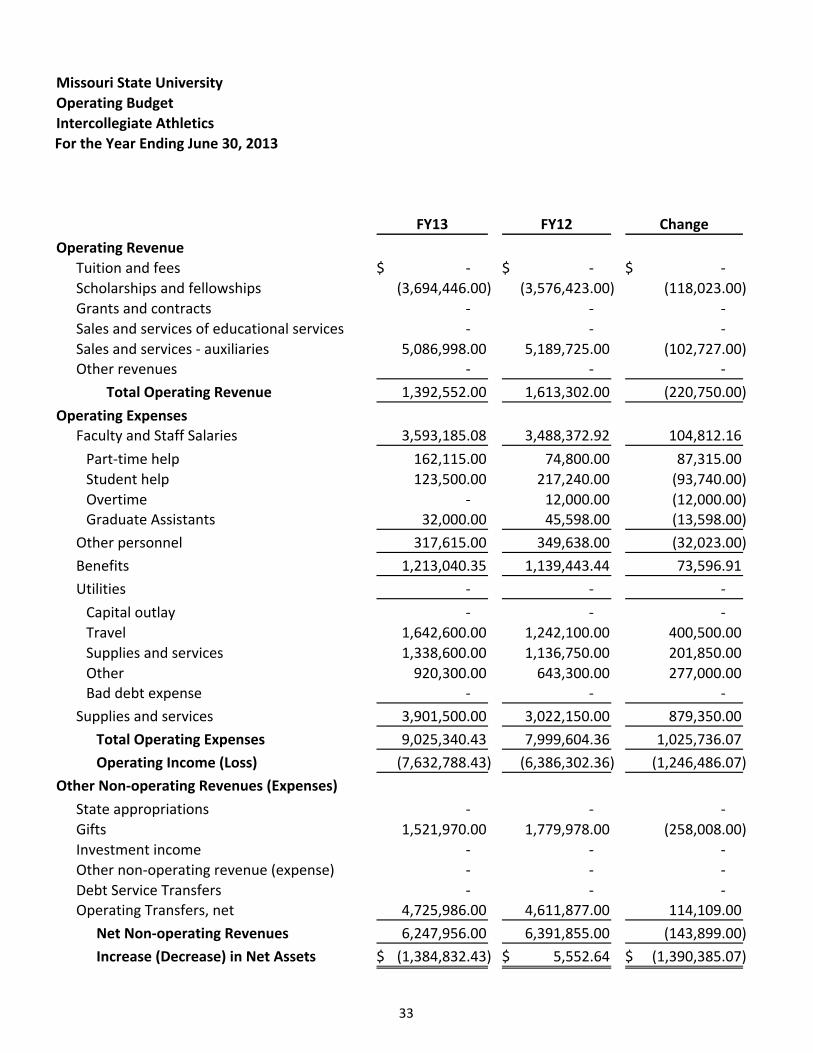
Operating Budget
Intercollegiate Athletics
For the Year Ending June 30, 2013
FY13 FY12 Change
Operating Revenue
Tuition and fees ‐$ ‐$ ‐$
Scholarships and fellowships (3,694,446.00) (3,576,423.00) (118,023.00)
Grants and contracts ‐ ‐ ‐
Sales and services of educational services ‐ ‐ ‐
Sales and services ‐ auxiliaries 5,086,998.00 5,189,725.00 (102,727.00) Other revenues ‐ ‐ ‐
Total Operating Revenue 1,392,552.00 1,613,302.00 (220,750.00)
Operating ExpensesFaculty and Staff Salaries 3,593,185.08 3,488,372.92 104,812.16
Part‐time help 162,115.00 74,800.00 87,315.00
Student help 123,500.00 217,240.00 (93,740.00)
Overtime ‐ 12,000.00 (12,000.00) Graduate Assistants 32,000.00 45,598.00 (13,598.00)
Other personnel 317,615.00 349,638.00 (32,023.00)
Benefits 1,213,040.35 1,139,443.44 73,596.91
Utilities ‐ ‐ ‐
Capital outlay ‐ ‐ ‐
Travel 1,642,600.00 1,242,100.00 400,500.00
Supplies and services 1,338,600.00 1,136,750.00 201,850.00
Other 920,300.00 643,300.00 277,000.00
Bad debt expense ‐ ‐ ‐
Supplies and services 3,901,500.00 3,022,150.00 879,350.00
Total Operating Expenses 9,025,340.43 7,999,604.36 1,025,736.07
Operating Income (Loss) (7,632,788.43) (6,386,302.36) (1,246,486.07)
Other Non‐operating Revenues (Expenses)
State appropriations ‐ ‐ ‐
Gifts 1,521,970.00 1,779,978.00 (258,008.00)
Investment income ‐ ‐ ‐
Other non‐operating revenue (expense) ‐ ‐ ‐
Debt Service Transfers ‐ ‐ ‐ Operating Transfers, net 4,725,986.00 4,611,877.00 114,109.00
Net Non‐operating Revenues 6,247,956.00 6,391,855.00 (143,899.00)
Increase (Decrease) in Net Assets (1,384,832.43)$ 5,552.64$ (1,390,385.07)$
33
Missouri State University
Operating Budget
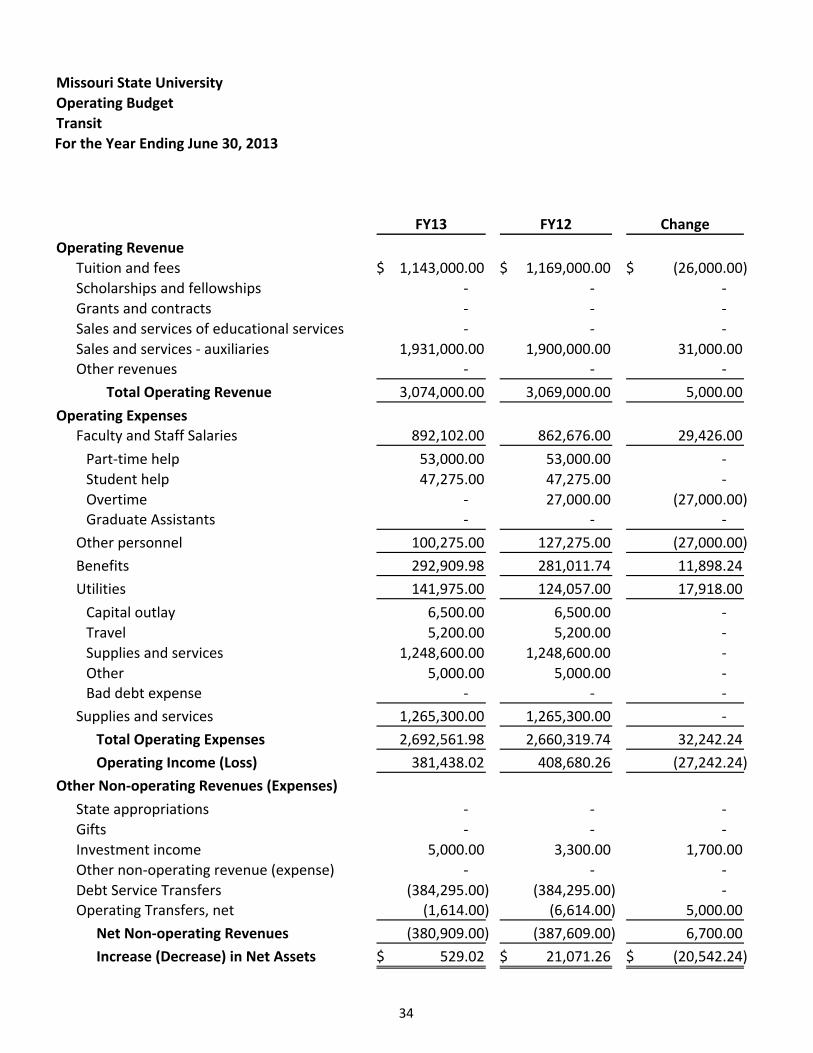
Transit
For the Year Ending June 30, 2013
FY13 FY12 Change
Operating Revenue
Tuition and fees 1,143,000.00$ 1,169,000.00$ (26,000.00)$
Scholarships and fellowships ‐ ‐ ‐
Grants and contracts ‐ ‐ ‐
Sales and services of educational services ‐ ‐ ‐
Sales and services ‐ auxiliaries 1,931,000.00 1,900,000.00 31,000.00 Other revenues ‐ ‐ ‐
Total Operating Revenue 3,074,000.00 3,069,000.00 5,000.00
Operating ExpensesFaculty and Staff Salaries 892,102.00 862,676.00 29,426.00
Part‐time help 53,000.00 53,000.00 ‐
Student help 47,275.00 47,275.00 ‐
Overtime ‐ 27,000.00 (27,000.00) Graduate Assistants ‐ ‐ ‐
Other personnel 100,275.00 127,275.00 (27,000.00)
Benefits 292,909.98 281,011.74 11,898.24
Utilities 141,975.00 124,057.00 17,918.00
Capital outlay 6,500.00 6,500.00 ‐
Travel 5,200.00 5,200.00 ‐
Supplies and services 1,248,600.00 1,248,600.00 ‐
Other 5,000.00 5,000.00 ‐
Bad debt expense ‐ ‐ ‐
Supplies and services 1,265,300.00 1,265,300.00 ‐
Total Operating Expenses 2,692,561.98 2,660,319.74 32,242.24
Operating Income (Loss) 381,438.02 408,680.26 (27,242.24)
Other Non‐operating Revenues (Expenses)
State appropriations ‐ ‐ ‐
Gifts ‐ ‐ ‐
Investment income 5,000.00 3,300.00 1,700.00
Other non‐operating revenue (expense) ‐ ‐ ‐
Debt Service Transfers (384,295.00) (384,295.00) ‐ Operating Transfers, net (1,614.00) (6,614.00) 5,000.00
Net Non‐operating Revenues (380,909.00) (387,609.00) 6,700.00
Increase (Decrease) in Net Assets 529.02$ 21,071.26$ (20,542.24)$
34
Missouri State University
Operating Budget
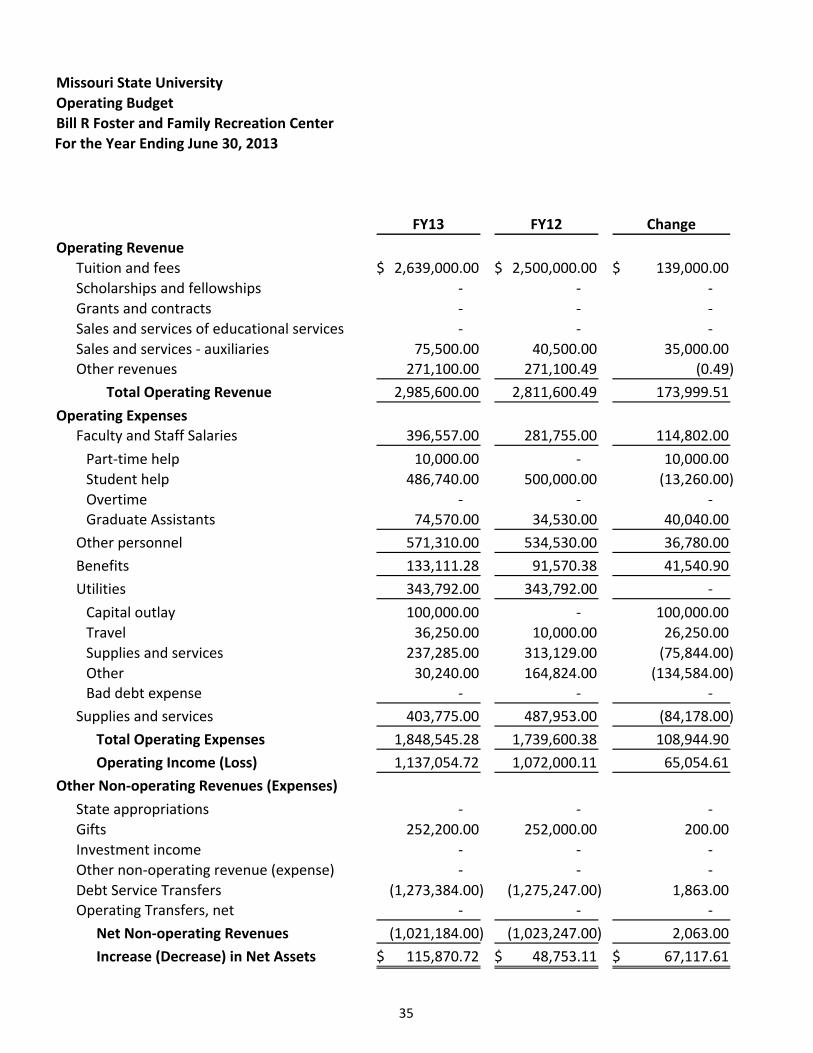
Bill R Foster and Family Recreation Center
For the Year Ending June 30, 2013
FY13 FY12 Change
Operating Revenue
Tuition and fees 2,639,000.00$ 2,500,000.00$ 139,000.00$
Scholarships and fellowships ‐ ‐ ‐
Grants and contracts ‐ ‐ ‐
Sales and services of educational services ‐ ‐ ‐
Sales and services ‐ auxiliaries 75,500.00 40,500.00 35,000.00 Other revenues 271,100.00 271,100.49 (0.49)
Total Operating Revenue 2,985,600.00 2,811,600.49 173,999.51
Operating ExpensesFaculty and Staff Salaries 396,557.00 281,755.00 114,802.00
Part‐time help 10,000.00 ‐ 10,000.00
Student help 486,740.00 500,000.00 (13,260.00)
Overtime ‐ ‐ ‐ Graduate Assistants 74,570.00 34,530.00 40,040.00
Other personnel 571,310.00 534,530.00 36,780.00
Benefits 133,111.28 91,570.38 41,540.90
Utilities 343,792.00 343,792.00 ‐
Capital outlay 100,000.00 ‐ 100,000.00
Travel 36,250.00 10,000.00 26,250.00
Supplies and services 237,285.00 313,129.00 (75,844.00)
Other 30,240.00 164,824.00 (134,584.00)
Bad debt expense ‐ ‐ ‐
Supplies and services 403,775.00 487,953.00 (84,178.00)
Total Operating Expenses 1,848,545.28 1,739,600.38 108,944.90
Operating Income (Loss) 1,137,054.72 1,072,000.11 65,054.61
Other Non‐operating Revenues (Expenses)
State appropriations ‐ ‐ ‐
Gifts 252,200.00 252,000.00 200.00
Investment income ‐ ‐ ‐
Other non‐operating revenue (expense) ‐ ‐ ‐
Debt Service Transfers (1,273,384.00) (1,275,247.00) 1,863.00 Operating Transfers, net ‐ ‐ ‐
Net Non‐operating Revenues (1,021,184.00) (1,023,247.00) 2,063.00
Increase (Decrease) in Net Assets 115,870.72$ 48,753.11$ 67,117.61$
35

WEST PLAINS CAMPUS – OPERATING & AUXILIARY
YEAR ENDING JUNE 30, 2013
Missouri State University
Operating Budget
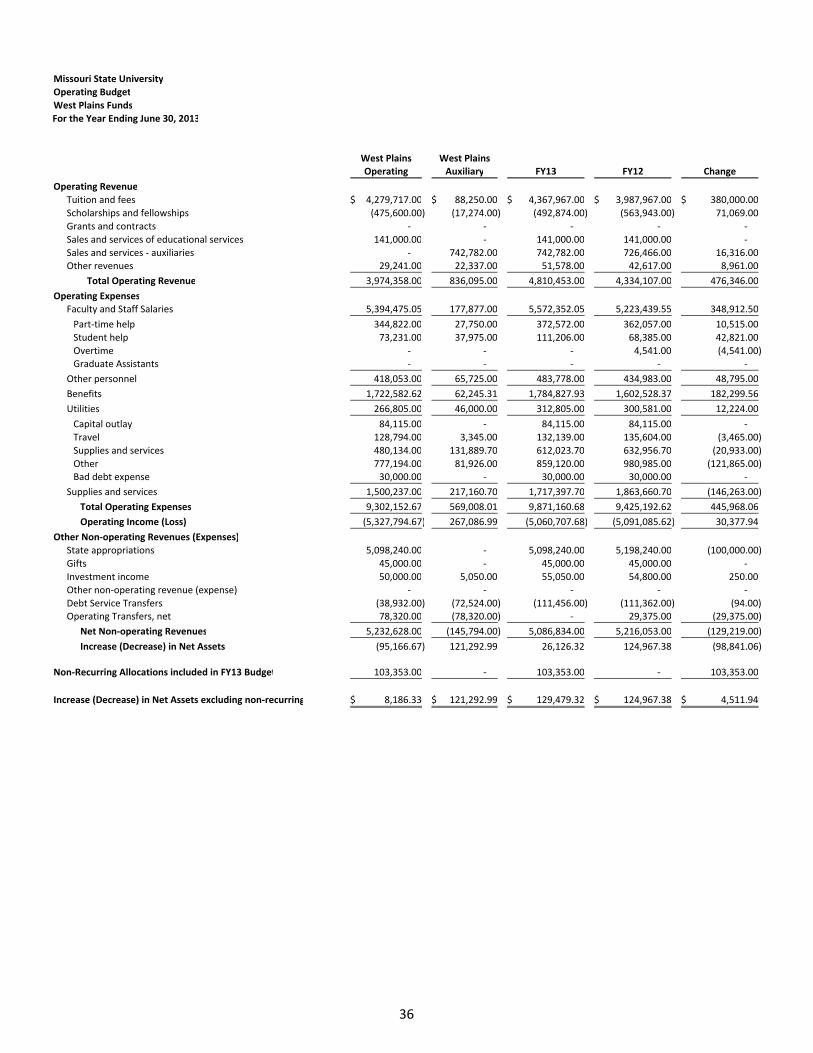
West Plains Funds
For the Year Ending June 30, 2013
West Plains West PlainsOperating Auxiliary FY13 FY12 Change
Operating Revenue
Tuition and fees 4,279,717.00$ 88,250.00$ 4,367,967.00$ 3,987,967.00$ 380,000.00$
Scholarships and fellowships (475,600.00) (17,274.00) (492,874.00) (563,943.00) 71,069.00
Grants and contracts ‐ ‐ ‐ ‐ ‐
Sales and services of educational services 141,000.00 ‐ 141,000.00 141,000.00 ‐
Sales and services ‐ auxiliaries ‐ 742,782.00 742,782.00 726,466.00 16,316.00 Other revenues 29,241.00 22,337.00 51,578.00 42,617.00 8,961.00
Total Operating Revenue 3,974,358.00 836,095.00 4,810,453.00 4,334,107.00 476,346.00
Operating ExpensesFaculty and Staff Salaries 5,394,475.05 177,877.00 5,572,352.05 5,223,439.55 348,912.50
Part‐time help 344,822.00 27,750.00 372,572.00 362,057.00 10,515.00
Student help 73,231.00 37,975.00 111,206.00 68,385.00 42,821.00
Overtime ‐ ‐ ‐ 4,541.00 (4,541.00) Graduate Assistants ‐ ‐ ‐ ‐ ‐
Other personnel 418,053.00 65,725.00 483,778.00 434,983.00 48,795.00
Benefits 1,722,582.62 62,245.31 1,784,827.93 1,602,528.37 182,299.56
Utilities 266,805.00 46,000.00 312,805.00 300,581.00 12,224.00
Capital outlay 84,115.00 ‐ 84,115.00 84,115.00 ‐
Travel 128,794.00 3,345.00 132,139.00 135,604.00 (3,465.00)
Supplies and services 480,134.00 131,889.70 612,023.70 632,956.70 (20,933.00)
Other 777,194.00 81,926.00 859,120.00 980,985.00 (121,865.00) Bad debt expense 30,000.00 ‐ 30,000.00 30,000.00 ‐
Supplies and services 1,500,237.00 217,160.70 1,717,397.70 1,863,660.70 (146,263.00)
Total Operating Expenses 9,302,152.67 569,008.01 9,871,160.68 9,425,192.62 445,968.06
Operating Income (Loss) (5,327,794.67) 267,086.99 (5,060,707.68) (5,091,085.62) 30,377.94
Other Non‐operating Revenues (Expenses)
State appropriations 5,098,240.00 ‐ 5,098,240.00 5,198,240.00 (100,000.00)
Gifts 45,000.00 ‐ 45,000.00 45,000.00 ‐
Investment income 50,000.00 5,050.00 55,050.00 54,800.00 250.00
Other non‐operating revenue (expense) ‐ ‐ ‐ ‐ ‐
Debt Service Transfers (38,932.00) (72,524.00) (111,456.00) (111,362.00) (94.00) Operating Transfers, net 78,320.00 (78,320.00) ‐ 29,375.00 (29,375.00)
Net Non‐operating Revenues 5,232,628.00 (145,794.00) 5,086,834.00 5,216,053.00 (129,219.00)
Increase (Decrease) in Net Assets (95,166.67) 121,292.99 26,126.32 124,967.38 (98,841.06)
Non‐Recurring Allocations included in FY13 Budget 103,353.00 ‐ 103,353.00 ‐ 103,353.00
Increase (Decrease) in Net Assets excluding non‐recurring 8,186.33$ 121,292.99$ 129,479.32$ 124,967.38$ 4,511.94$
36
Missouri State University
Operating Budget
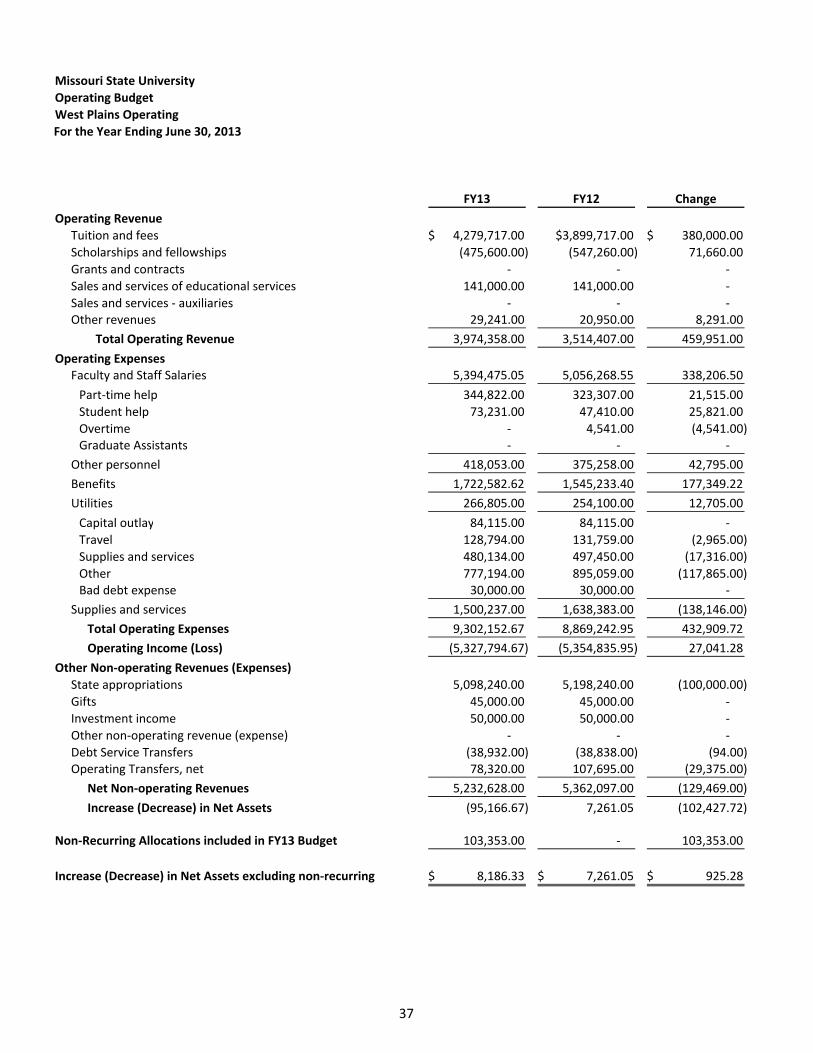
West Plains Operating
For the Year Ending June 30, 2013
FY13 FY12 Change
Operating Revenue
Tuition and fees 4,279,717.00$ $3,899,717.00 380,000.00$
Scholarships and fellowships (475,600.00) (547,260.00) 71,660.00
Grants and contracts ‐ ‐ ‐
Sales and services of educational services 141,000.00 141,000.00 ‐
Sales and services ‐ auxiliaries ‐ ‐ ‐ Other revenues 29,241.00 20,950.00 8,291.00
Total Operating Revenue 3,974,358.00 3,514,407.00 459,951.00
Operating ExpensesFaculty and Staff Salaries 5,394,475.05 5,056,268.55 338,206.50
Part‐time help 344,822.00 323,307.00 21,515.00
Student help 73,231.00 47,410.00 25,821.00
Overtime ‐ 4,541.00 (4,541.00) Graduate Assistants ‐ ‐ ‐
Other personnel 418,053.00 375,258.00 42,795.00
Benefits 1,722,582.62 1,545,233.40 177,349.22
Utilities 266,805.00 254,100.00 12,705.00
Capital outlay 84,115.00 84,115.00 ‐
Travel 128,794.00 131,759.00 (2,965.00)
Supplies and services 480,134.00 497,450.00 (17,316.00)
Other 777,194.00 895,059.00 (117,865.00) Bad debt expense 30,000.00 30,000.00 ‐
Supplies and services 1,500,237.00 1,638,383.00 (138,146.00)
Total Operating Expenses 9,302,152.67 8,869,242.95 432,909.72
Operating Income (Loss) (5,327,794.67) (5,354,835.95) 27,041.28
Other Non‐operating Revenues (Expenses)
State appropriations 5,098,240.00 5,198,240.00 (100,000.00)
Gifts 45,000.00 45,000.00 ‐
Investment income 50,000.00 50,000.00 ‐
Other non‐operating revenue (expense) ‐ ‐ ‐
Debt Service Transfers (38,932.00) (38,838.00) (94.00) Operating Transfers, net 78,320.00 107,695.00 (29,375.00)
Net Non‐operating Revenues 5,232,628.00 5,362,097.00 (129,469.00)
Increase (Decrease) in Net Assets (95,166.67) 7,261.05 (102,427.72)
Non‐Recurring Allocations included in FY13 Budget 103,353.00 ‐ 103,353.00
Increase (Decrease) in Net Assets excluding non‐recurring 8,186.33$ 7,261.05$ 925.28$
37

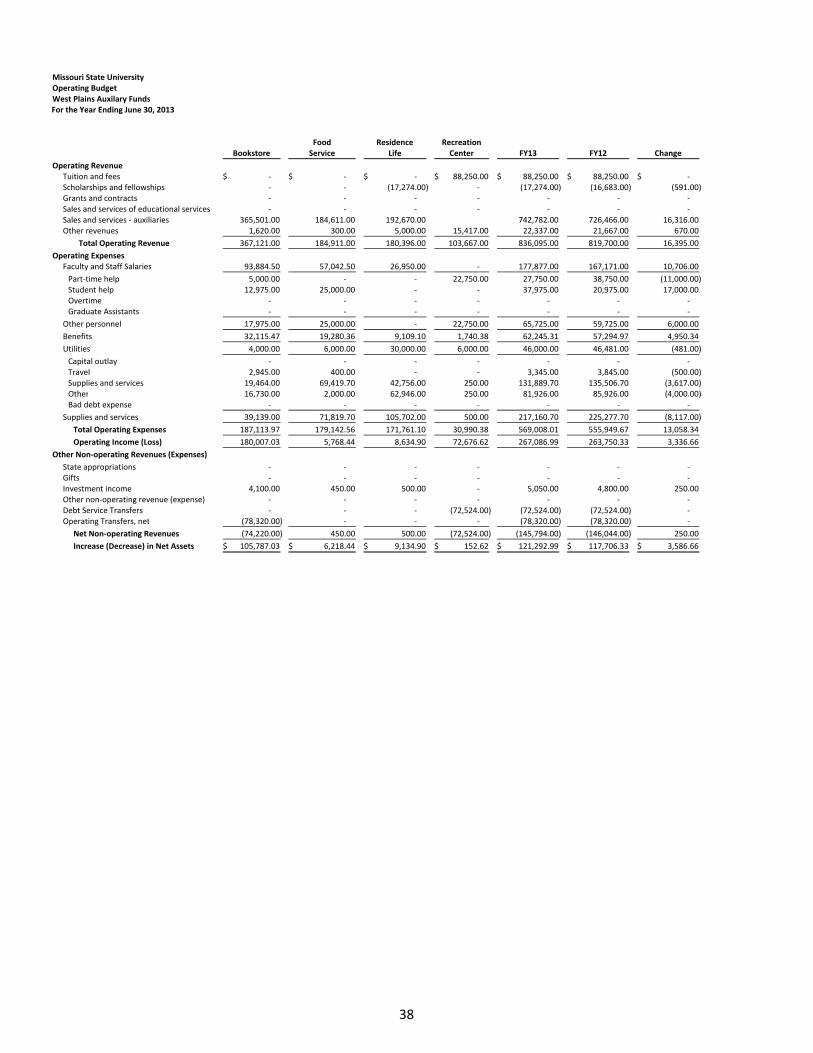
Missouri State UniversityOperating BudgetWest Plains Auxilary Funds For the Year Ending June 30, 2013
Food Residence RecreationBookstore Service Life Center FY13 FY12 Change
Operating RevenueTuition and fees ‐$ ‐$ ‐$ 88,250.00$ 88,250.00$ 88,250.00$ ‐$ Scholarships and fellowships ‐ ‐ (17,274.00) ‐ (17,274.00) (16,683.00) (591.00) Grants and contracts ‐ ‐ ‐ ‐ ‐ ‐ ‐ Sales and services of educational services ‐ ‐ ‐ ‐ ‐ ‐ ‐ Sales and services ‐ auxiliaries 365,501.00 184,611.00 192,670.00 742,782.00 726,466.00 16,316.00 Other revenues 1,620.00 300.00 5,000.00 15,417.00 22,337.00 21,667.00 670.00
Total Operating Revenue 367,121.00 184,911.00 180,396.00 103,667.00 836,095.00 819,700.00 16,395.00
Operating ExpensesFaculty and Staff Salaries 93,884.50 57,042.50 26,950.00 ‐ 177,877.00 167,171.00 10,706.00
Part‐time help 5,000.00 ‐ ‐ 22,750.00 27,750.00 38,750.00 (11,000.00) Student help 12,975.00 25,000.00 ‐ ‐ 37,975.00 20,975.00 17,000.00 Overtime ‐ ‐ ‐ ‐ ‐ ‐ ‐ Graduate Assistants ‐ ‐ ‐ ‐ ‐ ‐ ‐
Other personnel 17,975.00 25,000.00 ‐ 22,750.00 65,725.00 59,725.00 6,000.00
Benefits 32,115.47 19,280.36 9,109.10 1,740.38 62,245.31 57,294.97 4,950.34
Utilities 4,000.00 6,000.00 30,000.00 6,000.00 46,000.00 46,481.00 (481.00)
Capital outlay ‐ ‐ ‐ ‐ ‐ ‐ ‐ Travel 2,945.00 400.00 ‐ ‐ 3,345.00 3,845.00 (500.00) Supplies and services 19,464.00 69,419.70 42,756.00 250.00 131,889.70 135,506.70 (3,617.00) Other 16,730.00 2,000.00 62,946.00 250.00 81,926.00 85,926.00 (4,000.00) Bad debt expense ‐ ‐ ‐ ‐ ‐ ‐ ‐
Supplies and services 39,139.00 71,819.70 105,702.00 500.00 217,160.70 225,277.70 (8,117.00)
Total Operating Expenses 187,113.97 179,142.56 171,761.10 30,990.38 569,008.01 555,949.67 13,058.34
Operating Income (Loss) 180,007.03 5,768.44 8,634.90 72,676.62 267,086.99 263,750.33 3,336.66
Other Non‐operating Revenues (Expenses)
State appropriations ‐ ‐ ‐ ‐ ‐ ‐ ‐ Gifts ‐ ‐ ‐ ‐ ‐ ‐ ‐ Investment income 4,100.00 450.00 500.00 ‐ 5,050.00 4,800.00 250.00 Other non‐operating revenue (expense) ‐ ‐ ‐ ‐ ‐ ‐ ‐ Debt Service Transfers ‐ ‐ ‐ (72,524.00) (72,524.00) (72,524.00) ‐ Operating Transfers, net (78,320.00) ‐ ‐ ‐ (78,320.00) (78,320.00) ‐
Net Non‐operating Revenues (74,220.00) 450.00 500.00 (72,524.00) (145,794.00) (146,044.00) 250.00
Increase (Decrease) in Net Assets 105,787.03$ 6,218.44$ 9,134.90$ 152.62$ 121,292.99$ 117,706.33$ 3,586.66$
38
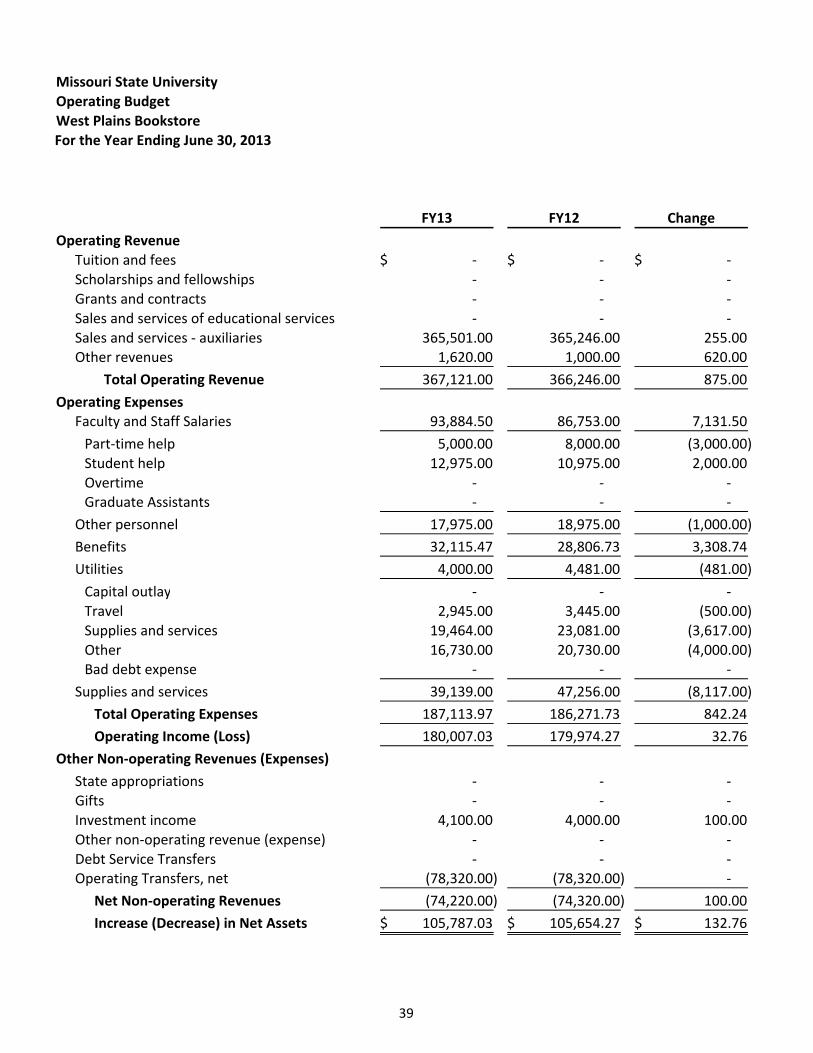
Missouri State University
Operating Budget
West Plains Bookstore
For the Year Ending June 30, 2013
FY13 FY12 Change
Operating Revenue
Tuition and fees ‐$ ‐$ ‐$
Scholarships and fellowships ‐ ‐ ‐
Grants and contracts ‐ ‐ ‐
Sales and services of educational services ‐ ‐ ‐
Sales and services ‐ auxiliaries 365,501.00 365,246.00 255.00 Other revenues 1,620.00 1,000.00 620.00
Total Operating Revenue 367,121.00 366,246.00 875.00
Operating ExpensesFaculty and Staff Salaries 93,884.50 86,753.00 7,131.50
Part‐time help 5,000.00 8,000.00 (3,000.00)
Student help 12,975.00 10,975.00 2,000.00
Overtime ‐ ‐ ‐ Graduate Assistants ‐ ‐ ‐
Other personnel 17,975.00 18,975.00 (1,000.00)
Benefits 32,115.47 28,806.73 3,308.74
Utilities 4,000.00 4,481.00 (481.00)
Capital outlay ‐ ‐ ‐
Travel 2,945.00 3,445.00 (500.00)
Supplies and services 19,464.00 23,081.00 (3,617.00)
Other 16,730.00 20,730.00 (4,000.00) Bad debt expense ‐ ‐ ‐
Supplies and services 39,139.00 47,256.00 (8,117.00)
Total Operating Expenses 187,113.97 186,271.73 842.24
Operating Income (Loss) 180,007.03 179,974.27 32.76
Other Non‐operating Revenues (Expenses)
State appropriations ‐ ‐ ‐
Gifts ‐ ‐ ‐
Investment income 4,100.00 4,000.00 100.00
Other non‐operating revenue (expense) ‐ ‐ ‐
Debt Service Transfers ‐ ‐ ‐ Operating Transfers, net (78,320.00) (78,320.00) ‐
Net Non‐operating Revenues (74,220.00) (74,320.00) 100.00
Increase (Decrease) in Net Assets 105,787.03$ 105,654.27$ 132.76$
39
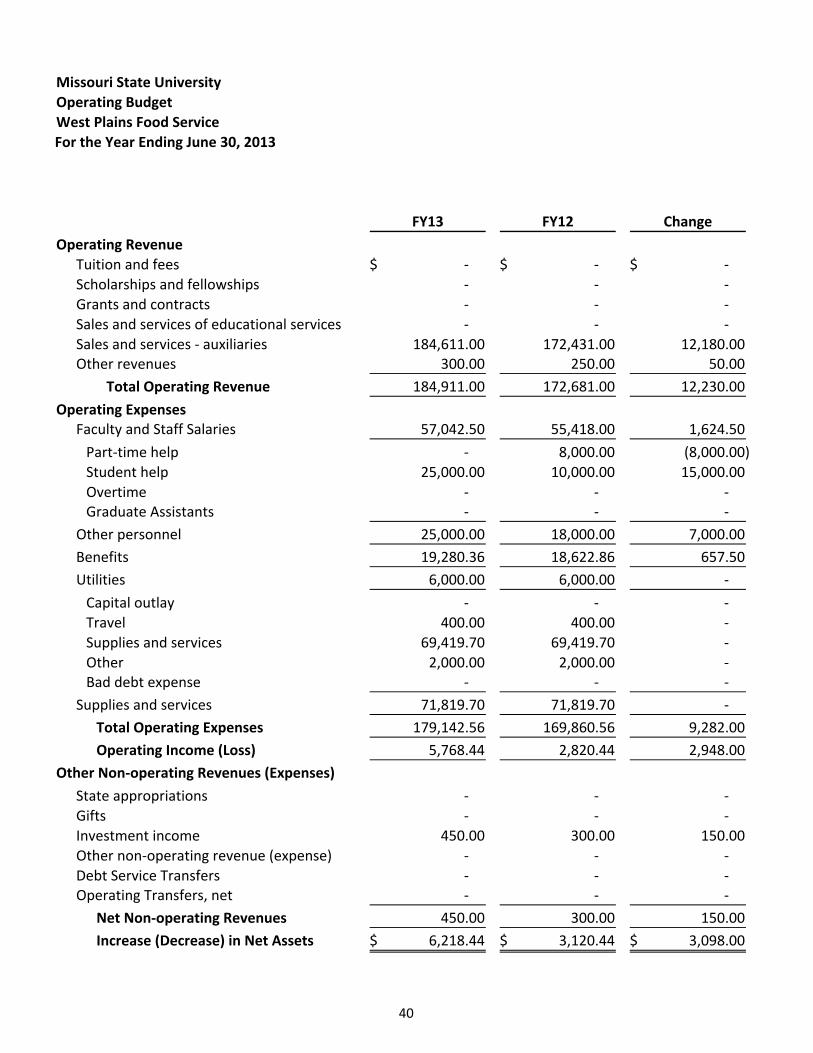
Missouri State University
Operating Budget
West Plains Food Service
For the Year Ending June 30, 2013
FY13 FY12 Change
Operating Revenue
Tuition and fees ‐$ ‐$ ‐$
Scholarships and fellowships ‐ ‐ ‐
Grants and contracts ‐ ‐ ‐
Sales and services of educational services ‐ ‐ ‐
Sales and services ‐ auxiliaries 184,611.00 172,431.00 12,180.00 Other revenues 300.00 250.00 50.00
Total Operating Revenue 184,911.00 172,681.00 12,230.00
Operating ExpensesFaculty and Staff Salaries 57,042.50 55,418.00 1,624.50
Part‐time help ‐ 8,000.00 (8,000.00)
Student help 25,000.00 10,000.00 15,000.00
Overtime ‐ ‐ ‐ Graduate Assistants ‐ ‐ ‐
Other personnel 25,000.00 18,000.00 7,000.00
Benefits 19,280.36 18,622.86 657.50
Utilities 6,000.00 6,000.00 ‐
Capital outlay ‐ ‐ ‐
Travel 400.00 400.00 ‐
Supplies and services 69,419.70 69,419.70 ‐
Other 2,000.00 2,000.00 ‐ Bad debt expense ‐ ‐ ‐
Supplies and services 71,819.70 71,819.70 ‐
Total Operating Expenses 179,142.56 169,860.56 9,282.00
Operating Income (Loss) 5,768.44 2,820.44 2,948.00
Other Non‐operating Revenues (Expenses)
State appropriations ‐ ‐ ‐
Gifts ‐ ‐ ‐
Investment income 450.00 300.00 150.00
Other non‐operating revenue (expense) ‐ ‐ ‐
Debt Service Transfers ‐ ‐ ‐ Operating Transfers, net ‐ ‐ ‐
Net Non‐operating Revenues 450.00 300.00 150.00
Increase (Decrease) in Net Assets 6,218.44$ 3,120.44$ 3,098.00$
40
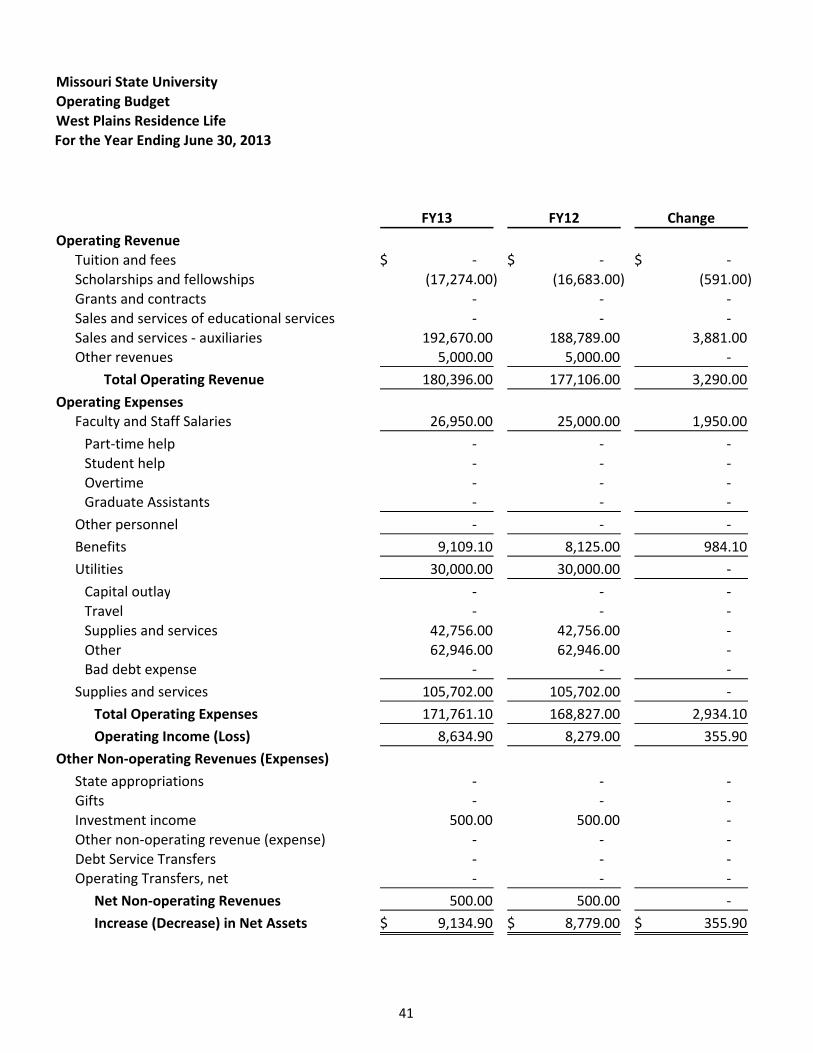
Missouri State University
Operating Budget
West Plains Residence Life
For the Year Ending June 30, 2013
FY13 FY12 Change
Operating Revenue
Tuition and fees ‐$ ‐$ ‐$
Scholarships and fellowships (17,274.00) (16,683.00) (591.00)
Grants and contracts ‐ ‐ ‐
Sales and services of educational services ‐ ‐ ‐
Sales and services ‐ auxiliaries 192,670.00 188,789.00 3,881.00 Other revenues 5,000.00 5,000.00 ‐
Total Operating Revenue 180,396.00 177,106.00 3,290.00
Operating ExpensesFaculty and Staff Salaries 26,950.00 25,000.00 1,950.00
Part‐time help ‐ ‐ ‐
Student help ‐ ‐ ‐
Overtime ‐ ‐ ‐ Graduate Assistants ‐ ‐ ‐
Other personnel ‐ ‐ ‐
Benefits 9,109.10 8,125.00 984.10
Utilities 30,000.00 30,000.00 ‐
Capital outlay ‐ ‐ ‐
Travel ‐ ‐ ‐
Supplies and services 42,756.00 42,756.00 ‐
Other 62,946.00 62,946.00 ‐ Bad debt expense ‐ ‐ ‐
Supplies and services 105,702.00 105,702.00 ‐
Total Operating Expenses 171,761.10 168,827.00 2,934.10
Operating Income (Loss) 8,634.90 8,279.00 355.90
Other Non‐operating Revenues (Expenses)
State appropriations ‐ ‐ ‐
Gifts ‐ ‐ ‐
Investment income 500.00 500.00 ‐
Other non‐operating revenue (expense) ‐ ‐ ‐
Debt Service Transfers ‐ ‐ ‐ Operating Transfers, net ‐ ‐ ‐
Net Non‐operating Revenues 500.00 500.00 ‐
Increase (Decrease) in Net Assets 9,134.90$ 8,779.00$ 355.90$
41
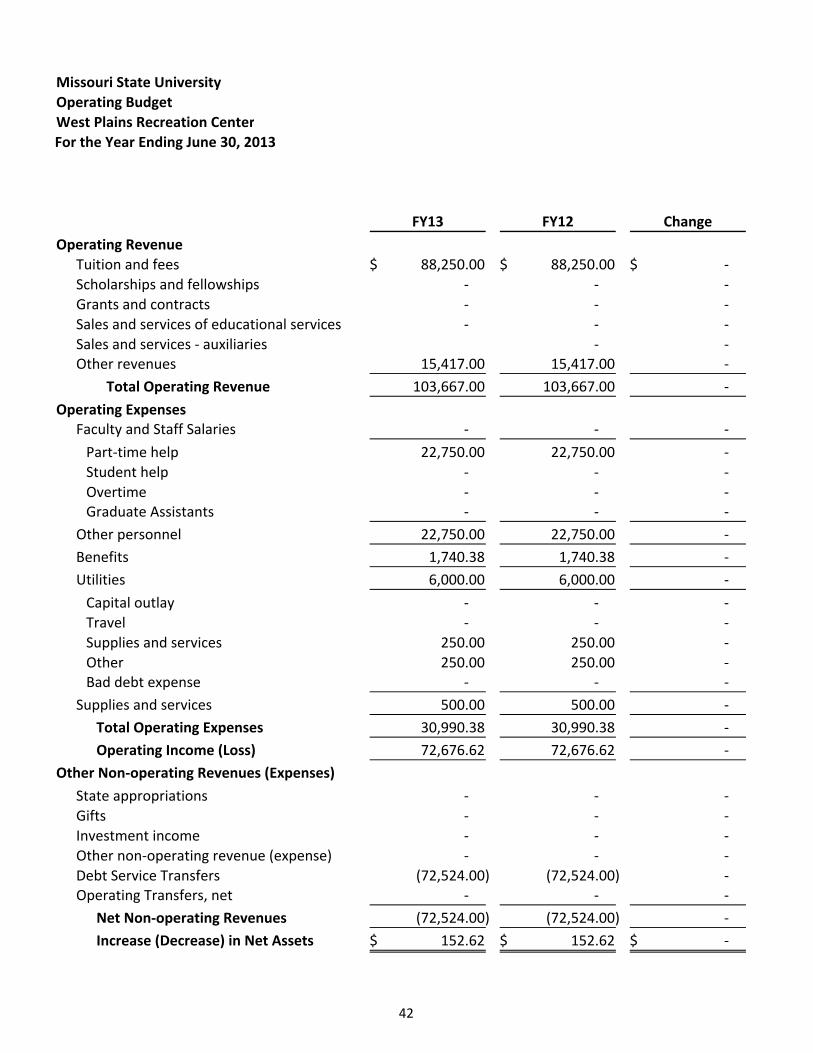
Missouri State University
Operating Budget
West Plains Recreation Center
For the Year Ending June 30, 2013
FY13 FY12 Change
Operating Revenue
Tuition and fees 88,250.00$ 88,250.00$ ‐$
Scholarships and fellowships ‐ ‐ ‐
Grants and contracts ‐ ‐ ‐
Sales and services of educational services ‐ ‐ ‐
Sales and services ‐ auxiliaries ‐ ‐ Other revenues 15,417.00 15,417.00 ‐
Total Operating Revenue 103,667.00 103,667.00 ‐
Operating ExpensesFaculty and Staff Salaries ‐ ‐ ‐
Part‐time help 22,750.00 22,750.00 ‐
Student help ‐ ‐ ‐
Overtime ‐ ‐ ‐ Graduate Assistants ‐ ‐ ‐
Other personnel 22,750.00 22,750.00 ‐
Benefits 1,740.38 1,740.38 ‐
Utilities 6,000.00 6,000.00 ‐
Capital outlay ‐ ‐ ‐
Travel ‐ ‐ ‐
Supplies and services 250.00 250.00 ‐
Other 250.00 250.00 ‐ Bad debt expense ‐ ‐ ‐
Supplies and services 500.00 500.00 ‐
Total Operating Expenses 30,990.38 30,990.38 ‐
Operating Income (Loss) 72,676.62 72,676.62 ‐
Other Non‐operating Revenues (Expenses)
State appropriations ‐ ‐ ‐
Gifts ‐ ‐ ‐
Investment income ‐ ‐ ‐
Other non‐operating revenue (expense) ‐ ‐ ‐
Debt Service Transfers (72,524.00) (72,524.00) ‐ Operating Transfers, net ‐ ‐ ‐
Net Non‐operating Revenues (72,524.00) (72,524.00) ‐
Increase (Decrease) in Net Assets 152.62$ 152.62$ ‐$
42