Embed Size (px)
Citation preview
FY14 Budget and Caseload Update
Fiscal CommitteeJanuary 6, 2014
FY14 November Caseload Review
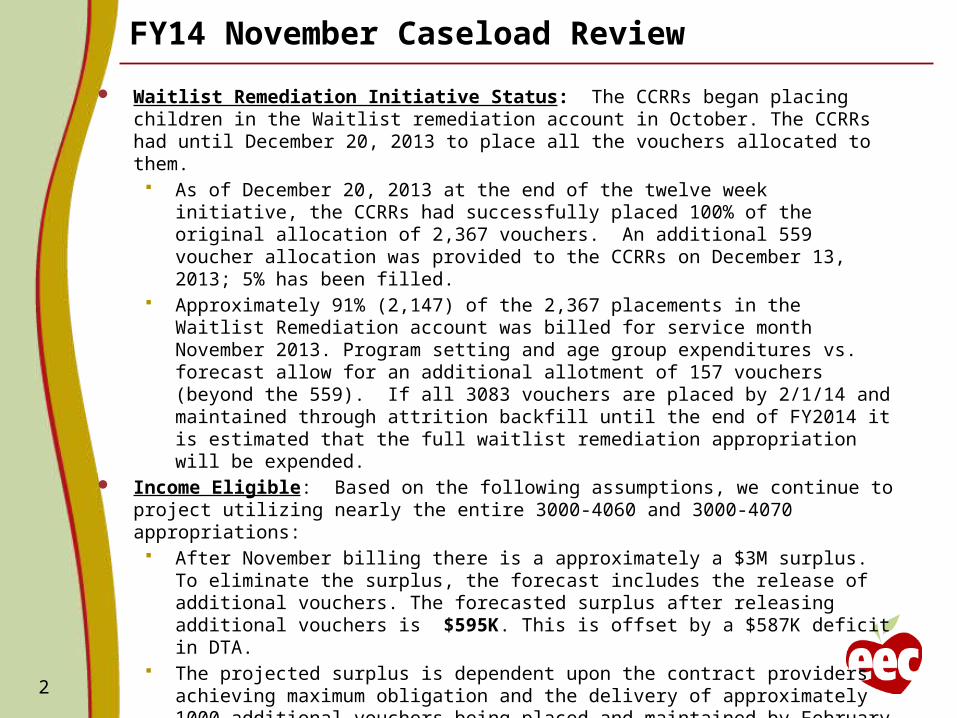
Waitlist Remediation Initiative Status: The CCRRs began placing children in the Waitlist remediation account in October. The CCRRs had until December 20, 2013 to place all the vouchers allocated to them.
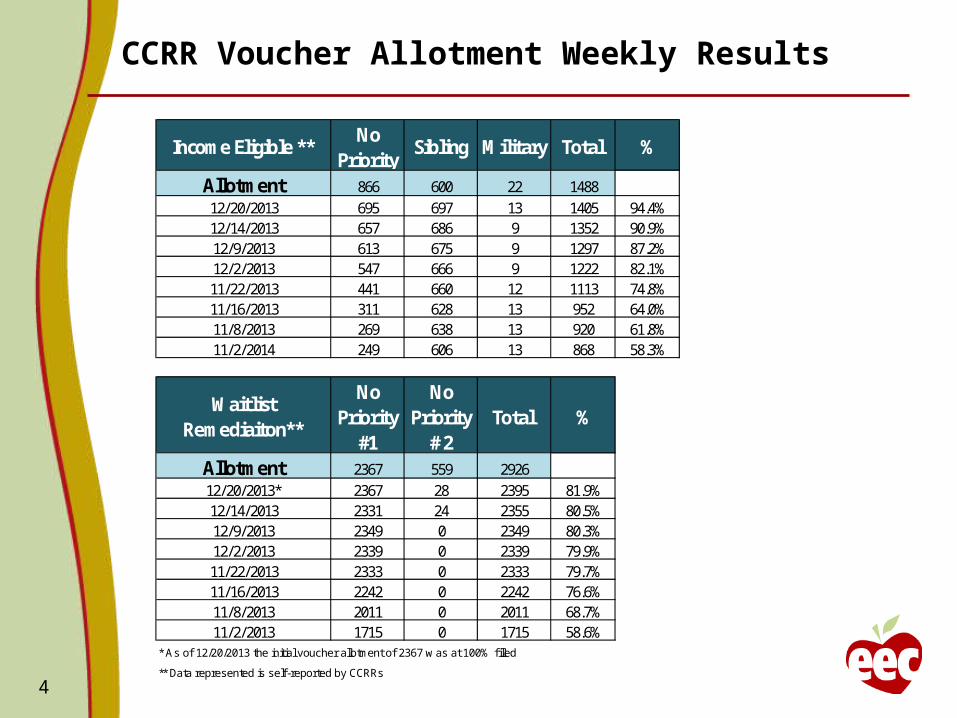
As of December 20, 2013 at the end of the twelve week initiative, the CCRRs had successfully placed 100% of the original allocation of 2,367 vouchers. An additional 559 voucher allocation was provided to the CCRRs on December 13, 2013; 5% has been filled.
Approximately 91% (2,147) of the 2,367 placements in the Waitlist Remediation account was billed for service month November 2013. Program setting and age group expenditures vs. forecast allow for an additional allotment of 157 vouchers (beyond the 559). If all 3083 vouchers are placed by 2/1/14 and maintained through attrition backfill until the end of FY2014 it is estimated that the full waitlist remediation appropriation will be expended.
Income Eligible: Based on the following assumptions, we continue to project utilizing nearly the entire 3000-4060 and 3000-4070 appropriations:
After November billing there is a approximately a $3M surplus. To eliminate the surplus, the forecast includes the release of additional vouchers. The forecasted surplus after releasing additional vouchers is $595K. This is offset by a $587K deficit in DTA.
The projected surplus is dependent upon the contract providers achieving maximum obligation and the delivery of approximately 1000 additional vouchers being placed and maintained by February 1, 2014.
All the CCRRs have started filling the additional attrition backfill allotment in the Income Eligible 3000-4060 account. They are at 80%.
2
FY14 November Caseload Review
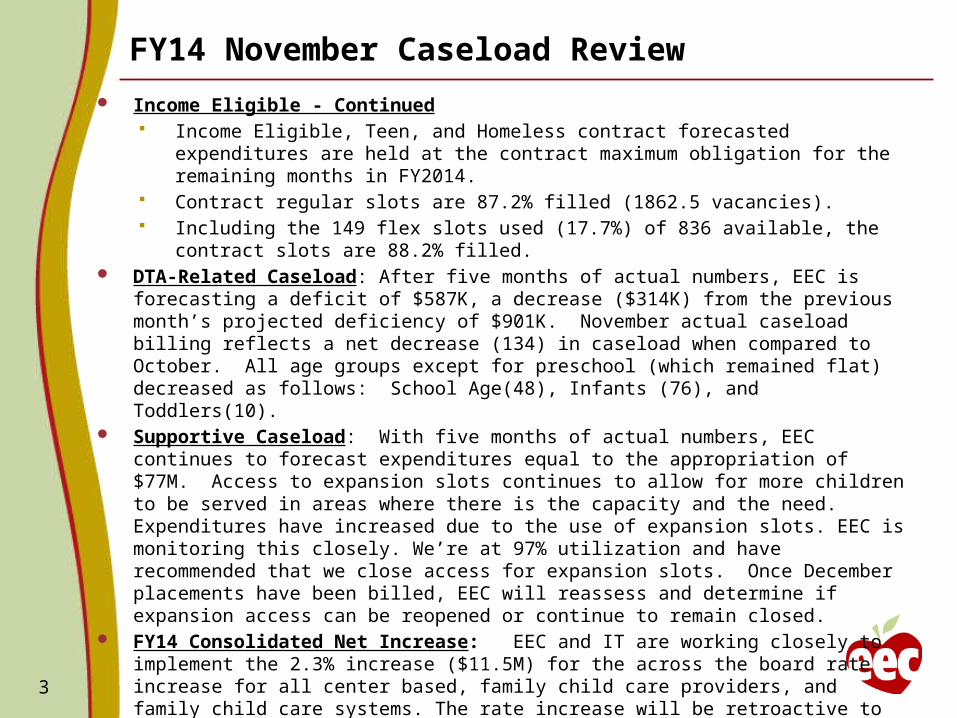
Income Eligible - Continued Income Eligible, Teen, and Homeless contract forecasted expenditures are
held at the contract maximum obligation for the remaining months in FY2014.
Contract regular slots are 87.2% filled (1862.5 vacancies). Including the 149 flex slots used (17.7%) of 836 available, the contract slots
are 88.2% filled. DTA-Related Caseload: After five months of actual numbers, EEC is forecasting
a deficit of $587K, a decrease ($314K) from the previous month’s projected deficiency of $901K. November actual caseload billing reflects a net decrease (134) in caseload when compared to October. All age groups except for preschool (which remained flat) decreased as follows: School Age(48), Infants (76), and Toddlers(10).
Supportive Caseload: With five months of actual numbers, EEC continues to forecast expenditures equal to the appropriation of $77M. Access to expansion slots continues to allow for more children to be served in areas where there is the capacity and the need. Expenditures have increased due to the use of expansion slots. EEC is monitoring this closely. We’re at 97% utilization and have recommended that we close access for expansion slots. Once December placements have been billed, EEC will reassess and determine if expansion access can be reopened or continue to remain closed.
FY14 Consolidated Net Increase: EEC and IT are working closely to implement the 2.3% increase ($11.5M) for the across the board rate increase for all center based, family child care providers, and family child care systems. The rate increase will be retroactive to July 1, 2013. 3
CCRR Voucher Allotment Weekly Results
4
Income Eligible **No
PrioritySibling Military Total %
Allotment 866 600 22 148812/20/2013 695 697 13 1405 94.4%12/14/2013 657 686 9 1352 90.9%12/9/2013 613 675 9 1297 87.2%12/2/2013 547 666 9 1222 82.1%11/22/2013 441 660 12 1113 74.8%11/16/2013 311 628 13 952 64.0%11/8/2013 269 638 13 920 61.8%11/2/2014 249 606 13 868 58.3%
Waitlist Remediaiton**
No Priority
#1
No Priority
# 2Total %
Allotment 2367 559 292612/20/2013* 2367 28 2395 81.9%12/14/2013 2331 24 2355 80.5%12/9/2013 2349 0 2349 80.3%12/2/2013 2339 0 2339 79.9%11/22/2013 2333 0 2333 79.7%11/16/2013 2242 0 2242 76.6%11/8/2013 2011 0 2011 68.7%11/2/2013 1715 0 1715 58.6%
* As of 12/20/2013 the initial voucher allotment of 2367 w as at 100% filled
** Data represented is self-reported by CCRRs
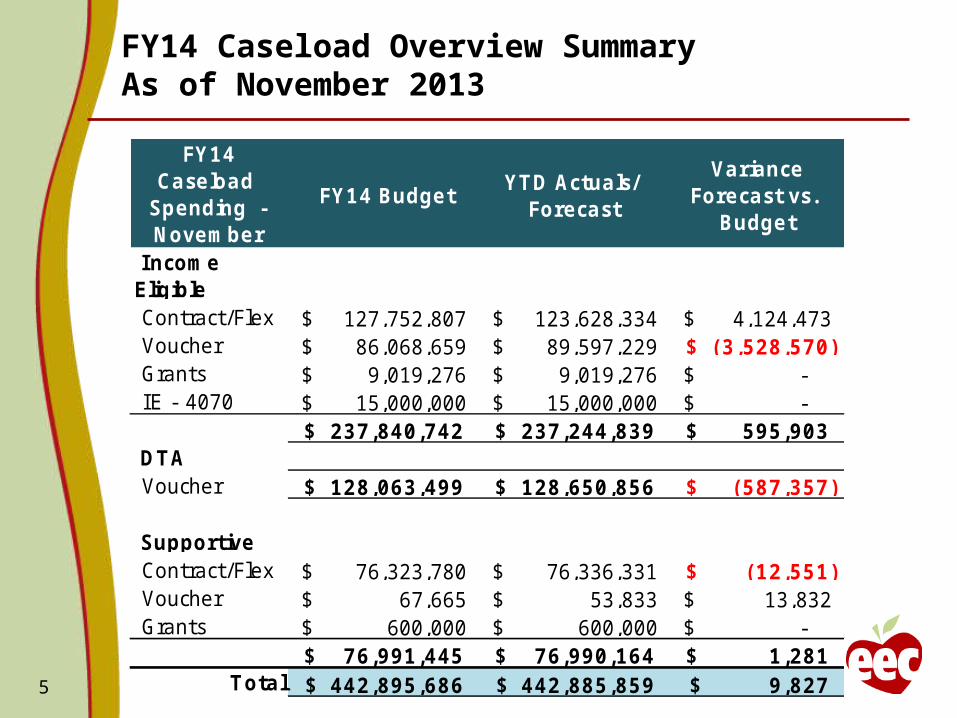
FY14 Caseload Overview SummaryAs of November 2013
5
FY14 Caseload
Spending -November
FY14 Budget YTD Actuals/
Forecast
Variance Forecast vs.
Budget
Income Eligible Contract/Flex 127,752,807$ 123,628,334$ 4,124,473$ Voucher 86,068,659$ 89,597,229$ (3,528,570)$ Grants 9,019,276$ 9,019,276$ -$ I E - 4070 15,000,000$ 15,000,000$ -$
237,840,742$ 237,244,839$ 595,903$ DTA Voucher 128,063,499$ 128,650,856$ (587,357)$
Supportive Contract/Flex 76,323,780$ 76,336,331$ (12,551)$ Voucher 67,665$ 53,833$ 13,832$ Grants 600,000$ 600,000$ -$
76,991,445$ 76,990,164$ 1,281$ Total 442,895,686$ 442,885,859$ 9,827$
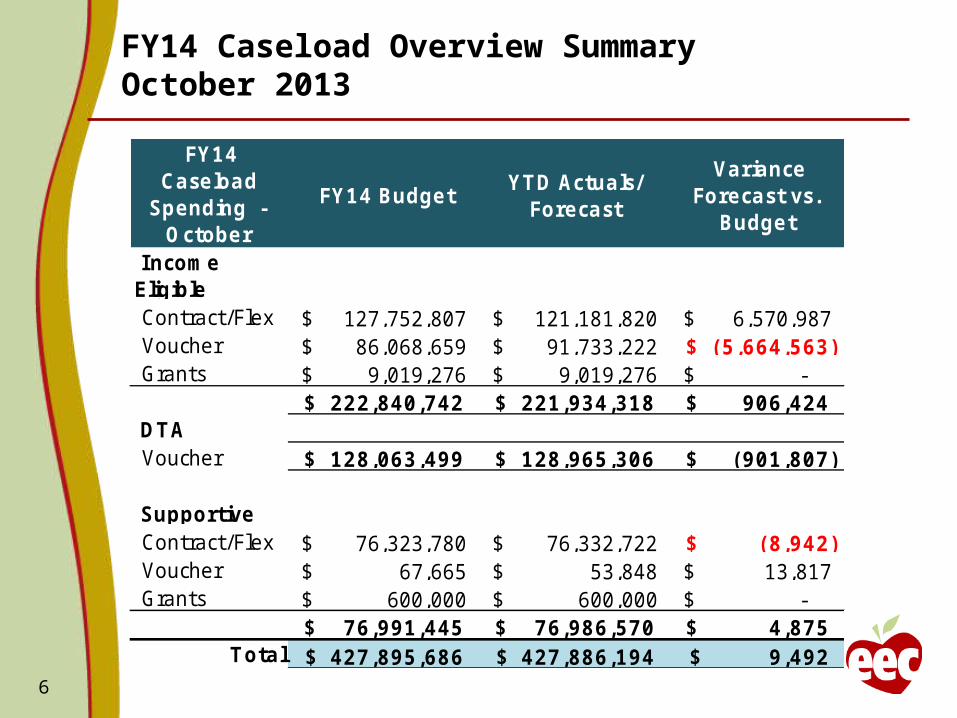
FY14 Caseload Overview SummaryOctober 2013
6
FY14 Caseload
Spending - October
FY14 Budget YTD Actuals/
Forecast
Variance Forecast vs.
Budget
Income Eligible Contract/Flex 127,752,807$ 121,181,820$ 6,570,987$ Voucher 86,068,659$ 91,733,222$ (5,664,563)$ Grants 9,019,276$ 9,019,276$ -$
222,840,742$ 221,934,318$ 906,424$ DTA Voucher 128,063,499$ 128,965,306$ (901,807)$
Supportive Contract/Flex 76,323,780$ 76,332,722$ (8,942)$ Voucher 67,665$ 53,848$ 13,817$ Grants 600,000$ 600,000$ -$
76,991,445$ 76,986,570$ 4,875$ Total 427,895,686$ 427,886,194$ 9,492$
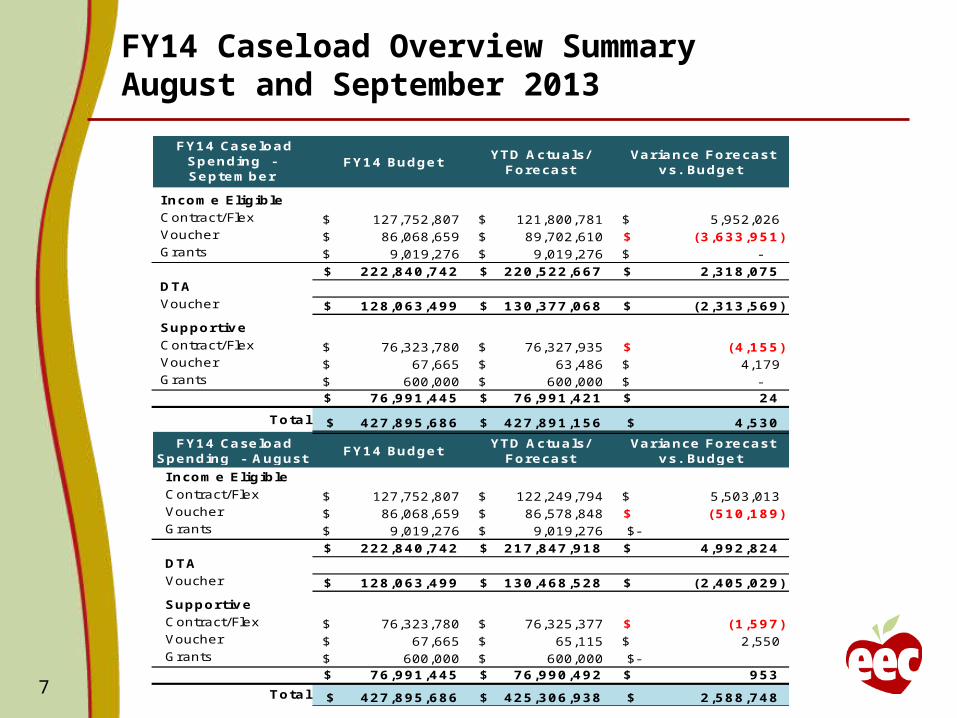
FY14 Caseload Overview SummaryAugust and September 2013
7
FY14 Caseload Spending - September
FY14 Budget YTD Actuals/
Forecast Variance Forecast
vs. Budget
I ncome Eligible Contract/Flex 127,752,807$ 121,800,781$ 5,952,026$ Voucher 86,068,659$ 89,702,610$ (3,633,951)$ Grants 9,019,276$ 9,019,276$ -$
222,840,742$ 220,522,667$ 2,318,075$ DTA Voucher 128,063,499$ 130,377,068$ (2,313,569)$
Supportive Contract/Flex 76,323,780$ 76,327,935$ (4,155)$ Voucher 67,665$ 63,486$ 4,179$ Grants 600,000$ 600,000$ -$
76,991,445$ 76,991,421$ 24$
Total 427,895,686$ 427,891,156$ 4,530$
FY14 Caseload Spending - August
FY14 Budget YTD Actuals/
Forecast Variance Forecast
vs. Budget
I ncome Eligible Contract/Flex 127,752,807$ 122,249,794$ 5,503,013$ Voucher 86,068,659$ 86,578,848$ (510,189)$ Grants 9,019,276$ 9,019,276$ $-
222,840,742$ 217,847,918$ 4,992,824$ DTA Voucher 128,063,499$ 130,468,528$ (2,405,029)$
Supportive Contract/Flex 76,323,780$ 76,325,377$ (1,597)$ Voucher 67,665$ 65,115$ 2,550$ Grants 600,000$ 600,000$ $-
76,991,445$ 76,990,492$ 953$
Total 427,895,686$ 425,306,938$ 2,588,748$
8
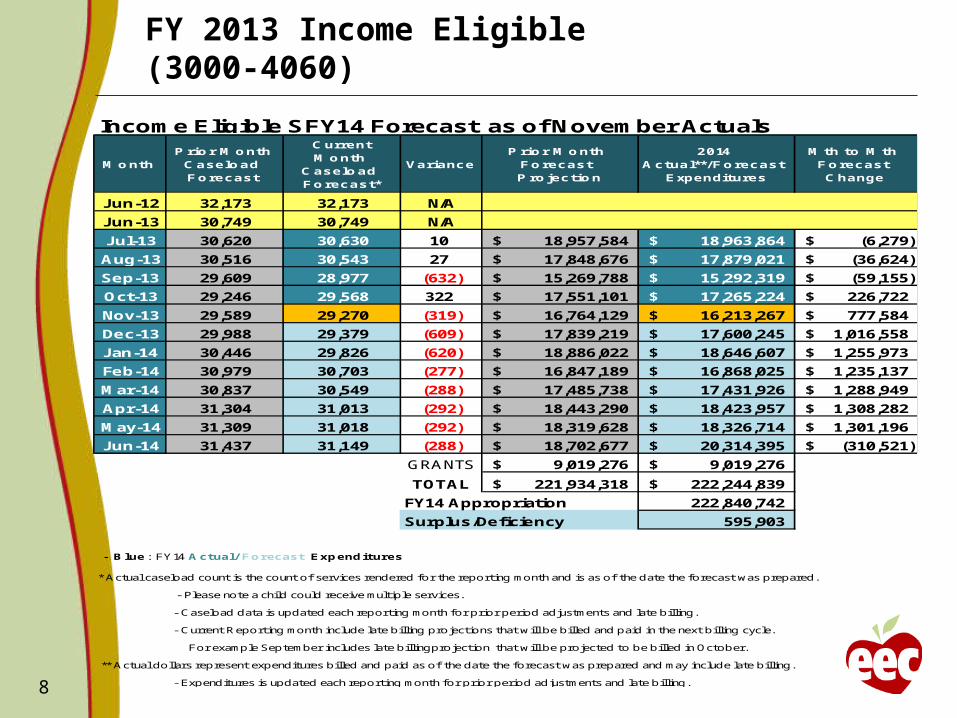
FY 2013 Income Eligible(3000-4060)
Month Prior Month
Caseload Forecast
Current Month
Caseload Forecast*
VariancePrior Month
Forecast Projection
2014 Actual**/Forecast
Expenditures
Mth to Mth Forecast Change
Jun-12 32,173 32,173 N/A
Jun-13 30,749 30,749 N/A
Jul-13 30,620 30,630 10 18,957,584$ 18,963,864$ (6,279)$
Aug-13 30,516 30,543 27 17,848,676$ 17,879,021$ (36,624)$
Sep-13 29,609 28,977 (632) 15,269,788$ 15,292,319$ (59,155)$
Oct-13 29,246 29,568 322 17,551,101$ 17,265,224$ 226,722$
Nov-13 29,589 29,270 (319) 16,764,129$ 16,213,267$ 777,584$
Dec-13 29,988 29,379 (609) 17,839,219$ 17,600,245$ 1,016,558$
Jan-14 30,446 29,826 (620) 18,886,022$ 18,646,607$ 1,255,973$
Feb-14 30,979 30,703 (277) 16,847,189$ 16,868,025$ 1,235,137$
Mar-14 30,837 30,549 (288) 17,485,738$ 17,431,926$ 1,288,949$
Apr-14 31,304 31,013 (292) 18,443,290$ 18,423,957$ 1,308,282$
May-14 31,309 31,018 (292) 18,319,628$ 18,326,714$ 1,301,196$
Jun-14 31,437 31,149 (288) 18,702,677$ 20,314,395$ (310,521)$
GRANTS 9,019,276$ 9,019,276$
TOTAL 221,934,318$ 222,244,839$
FY14 Appropriation 222,840,742
Surplus/Deficiency 595,903
- Blue: FY14 Actual/ Forecast Expenditures
* Actual caseload count is the count of services rendered for the reporting month and is as of the date the forecast was prepared.
- Please note a child could receive multiple services.
- Caseload data is updated each reporting month for prior period adjustments and late billing.
- Current Reporting month include late billing projections that will be billed and paid in the next billing cycle.
For example September includes late billingprojection that will be projected to be billed in October.
** Actual dollars represent expenditures billed and paid as of the date the forecast was prepared and may include late billing.
- Expenditures is updated each reporting month for prior period adjustments and late billing.
Income Eligible SFY14 Forecast as of November Actuals
9
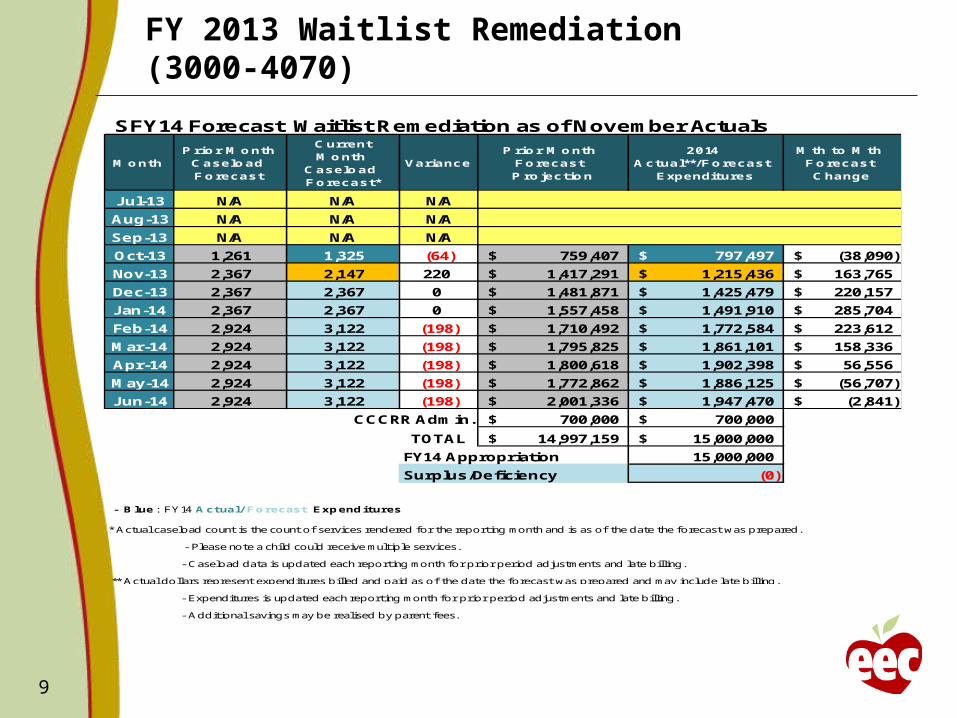
FY 2013 Waitlist Remediation(3000-4070)
Month Prior Month
Caseload Forecast
Current Month
Caseload Forecast*
VariancePrior Month
Forecast Projection
2014 Actual**/Forecast
Expenditures
Mth to Mth Forecast Change
Jul-13 N/A N/A N/A
Aug-13 N/A N/A N/A
Sep-13 N/A N/A N/A
Oct-13 1,261 1,325 (64) 759,407$ 797,497$ (38,090)$
Nov-13 2,367 2,147 220 1,417,291$ 1,215,436$ 163,765$
Dec-13 2,367 2,367 0 1,481,871$ 1,425,479$ 220,157$
Jan-14 2,367 2,367 0 1,557,458$ 1,491,910$ 285,704$
Feb-14 2,924 3,122 (198) 1,710,492$ 1,772,584$ 223,612$
Mar-14 2,924 3,122 (198) 1,795,825$ 1,861,101$ 158,336$
Apr-14 2,924 3,122 (198) 1,800,618$ 1,902,398$ 56,556$
May-14 2,924 3,122 (198) 1,772,862$ 1,886,125$ (56,707)$
Jun-14 2,924 3,122 (198) 2,001,336$ 1,947,470$ (2,841)$
CCCRR Admin. 700,000$ 700,000$
TOTAL 14,997,159$ 15,000,000$
FY14 Appropriation 15,000,000
Surplus/Deficiency (0)
- Blue: FY14 Actual/ Forecast Expenditures
* Actual caseload count is the count of services rendered for the reporting month and is as of the date the forecast was prepared.
- Please note a child could receive multiple services.
- Caseload data is updated each reporting month for prior period adjustments and late billing.
** Actual dollars represent expenditures billed and paid as of the date the forecast was prepared and may include late billing.
- Expenditures is updated each reporting month for prior period adjustments and late billing.
- Additional savings may be realised by parent fees.
SFY14 Forecast Waitlist Remediation as of November Actuals
10
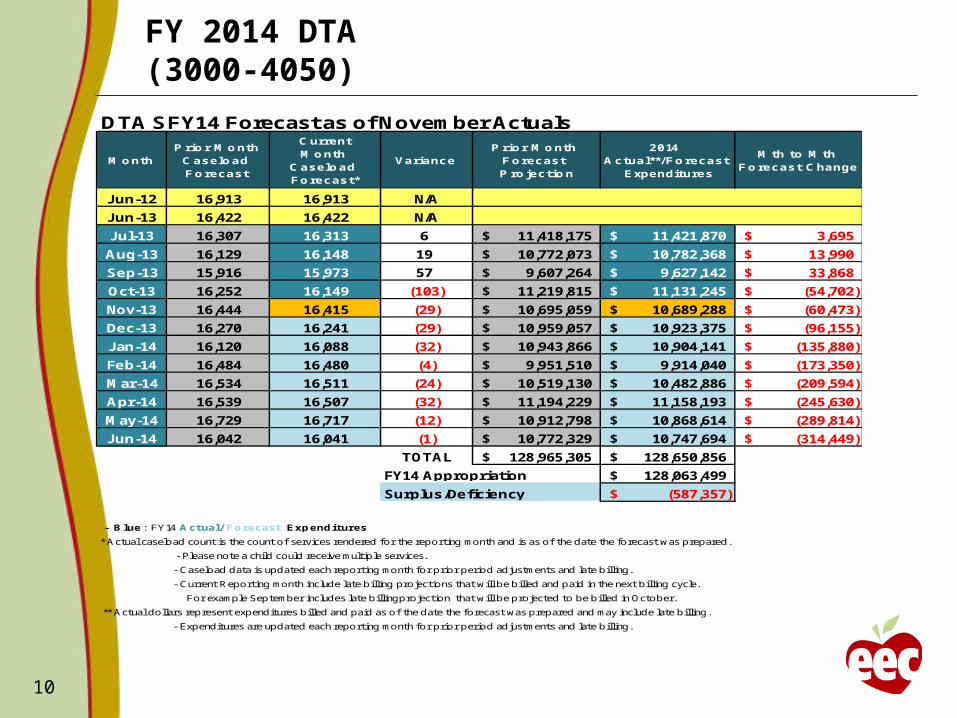
FY 2014 DTA (3000-4050)
Month Prior Month
Caseload Forecast
Current Month
Caseload Forecast*
VariancePrior Month
Forecast Projection
2014 Actual**/Forecast
Expenditures
Mth to Mth Forecast Change
Jun-12 16,913 16,913 N/A
Jun-13 16,422 16,422 N/A
Jul-13 16,307 16,313 6 11,418,175$ 11,421,870$ 3,695$
Aug-13 16,129 16,148 19 10,772,073$ 10,782,368$ 13,990$
Sep-13 15,916 15,973 57 9,607,264$ 9,627,142$ 33,868$
Oct-13 16,252 16,149 (103) 11,219,815$ 11,131,245$ (54,702)$
Nov-13 16,444 16,415 (29) 10,695,059$ 10,689,288$ (60,473)$
Dec-13 16,270 16,241 (29) 10,959,057$ 10,923,375$ (96,155)$
Jan-14 16,120 16,088 (32) 10,943,866$ 10,904,141$ (135,880)$
Feb-14 16,484 16,480 (4) 9,951,510$ 9,914,040$ (173,350)$
Mar-14 16,534 16,511 (24) 10,519,130$ 10,482,886$ (209,594)$
Apr-14 16,539 16,507 (32) 11,194,229$ 11,158,193$ (245,630)$
May-14 16,729 16,717 (12) 10,912,798$ 10,868,614$ (289,814)$
Jun-14 16,042 16,041 (1) 10,772,329$ 10,747,694$ (314,449)$
TOTAL 128,965,305$ 128,650,856$
128,063,499$
(587,357)$
- Blue: FY14 Actual/ Forecast Expenditures
* Actual caseload count is the count of services rendered for the reporting month and is as of the date the forecast was prepared.
- Please note a child could receive multiple services.
- Caseload data is updated each reporting month for prior period adjustments and late billing.
- Current Reporting month include late billing projections that will be billed and paid in the next billing cycle.
For example September includes late billingprojection that will be projected to be billed in October.
** Actual dollars represent expenditures billed and paid as of the date the forecast was prepared and may include late billing.
- Expenditures are updated each reporting month for prior period adjustments and late billing.
DTA SFY14 Forecast as of November Actuals
FY14 Appropriation
Surplus/Deficiency
11
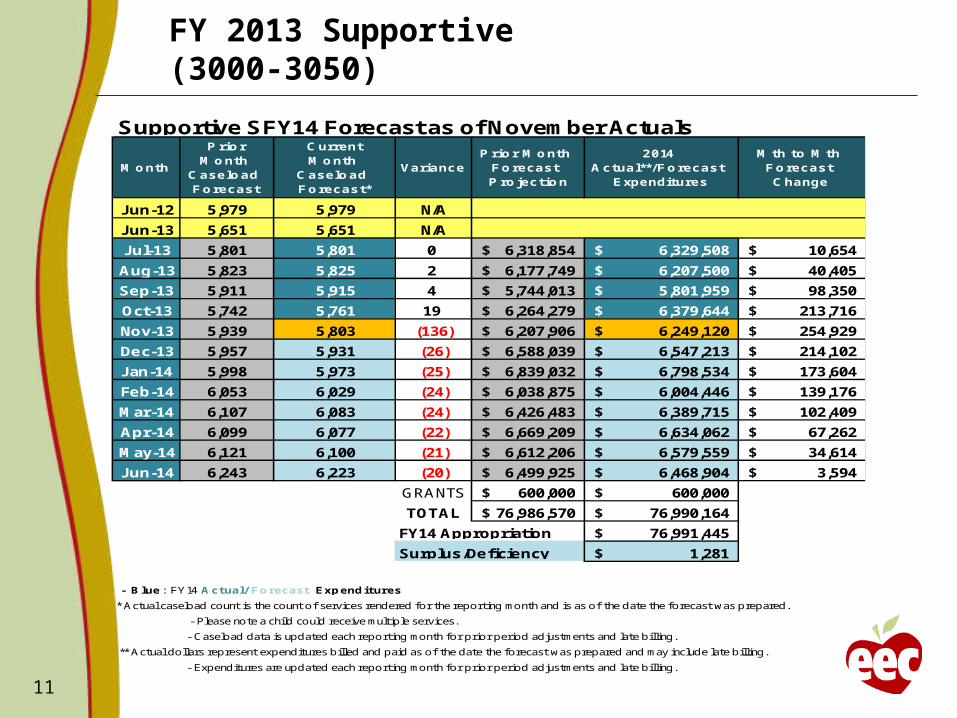
Month
Prior Month
Caseload Forecast
Current Month
Caseload Forecast*
VariancePrior Month
Forecast Projection
2014 Actual**/Forecast
Expenditures
Mth to Mth Forecast Change
Jun-12 5,979 5,979 N/A
Jun-13 5,651 5,651 N/A
Jul-13 5,801 5,801 0 6,318,854$ 6,329,508$ 10,654$
Aug-13 5,823 5,825 2 6,177,749$ 6,207,500$ 40,405$
Sep-13 5,911 5,915 4 5,744,013$ 5,801,959$ 98,350$
Oct-13 5,742 5,761 19 6,264,279$ 6,379,644$ 213,716$
Nov-13 5,939 5,803 (136) 6,207,906$ 6,249,120$ 254,929$
Dec-13 5,957 5,931 (26) 6,588,039$ 6,547,213$ 214,102$
Jan-14 5,998 5,973 (25) 6,839,032$ 6,798,534$ 173,604$
Feb-14 6,053 6,029 (24) 6,038,875$ 6,004,446$ 139,176$
Mar-14 6,107 6,083 (24) 6,426,483$ 6,389,715$ 102,409$
Apr-14 6,099 6,077 (22) 6,669,209$ 6,634,062$ 67,262$
May-14 6,121 6,100 (21) 6,612,206$ 6,579,559$ 34,614$
Jun-14 6,243 6,223 (20) 6,499,925$ 6,468,904$ 3,594$
GRANTS 600,000$ 600,000$
TOTAL 76,986,570$ 76,990,164$
76,991,445$
1,281$
- Blue: FY14 Actual/ Forecast Expenditures
* Actual caseload count is the count of services rendered for the reporting month and is as of the date the forecast was prepared.
- Please note a child could receive multiple services.
- Caseload data is updated each reporting month for prior period adjustments and late billing.
** Actual dollars represent expenditures billed and paid as of the date the forecast was prepared and may include late billing.
- Expenditures are updated each reporting month for prior period adjustments and late billing.
Supportive SFY14 Forecast as of November Actuals
FY14 Appropriation
Surplus/Deficiency
FY 2013 Supportive (3000-3050)
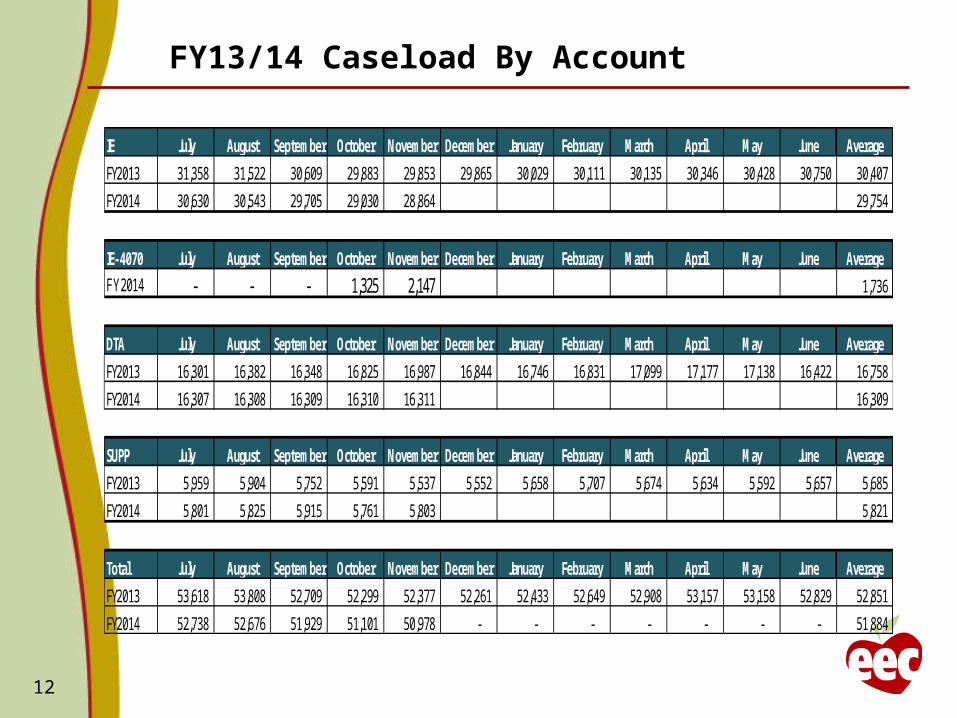
FY13/14 Caseload By Account
12
IE July August September October November December January February March April May June Average
FY2013 31,358 31,522 30,609 29,883 29,853 29,865 30,029 30,111 30,135 30,346 30,428 30,750 30,407
FY2014 30,630 30,543 29,705 29,030 28,864 29,754
IE- 4070 July August September October November December January February March April May June Average
FY2014 - - - 1,325 2,147 1,736
DTA July August September October November December January February March April May June Average
FY2013 16,301 16,382 16,348 16,825 16,987 16,844 16,746 16,831 17,099 17,177 17,138 16,422 16,758
FY2014 16,307 16,308 16,309 16,310 16,311 16,309
SUPP July August September October November December January February March April May June Average
FY2013 5,959 5,904 5,752 5,591 5,537 5,552 5,658 5,707 5,674 5,634 5,592 5,657 5,685
FY2014 5,801 5,825 5,915 5,761 5,803 5,821
Total July August September October November December January February March April May June Average
FY2013 53,618 53,808 52,709 52,299 52,377 52,261 52,433 52,649 52,908 53,157 53,158 52,829 52,851
FY2014 52,738 52,676 51,929 51,101 50,978 - - - - - - - 51,884
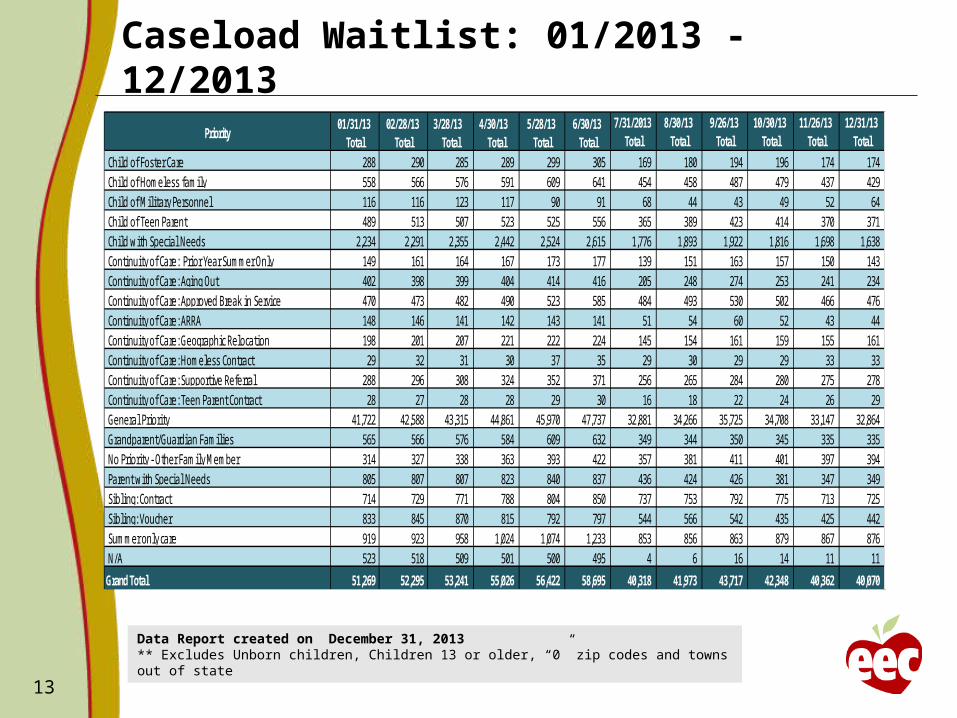
Caseload Waitlist: 01/2013 - 12/2013
13.
Data Report created on December 31, 2013** Excludes Unborn children, Children 13 or older, “0” zip codes and towns out of state
Priority01/31/13
Total02/28/13
Total3/28/13
Total4/30/13
Total5/28/13
Total6/30/13
Total7/31/2013
Total8/30/13
Total9/26/13
Total10/30/13
Total11/26/13
Total12/31/13
Total Chi ld of Foster Care 288 290 285 289 299 305 169 180 194 196 174 174 Chi ld of Homeless fami ly 558 566 576 591 609 641 454 458 487 479 437 429 Chi ld of Mi l i tary Personnel 116 116 123 117 90 91 68 44 43 49 52 64 Chi ld of Teen Parent 489 513 507 523 525 556 365 389 423 414 370 371 Chi ld with Specia l Needs 2,234 2,291 2,355 2,442 2,524 2,615 1,776 1,893 1,922 1,816 1,698 1,638 Continuity of Care: Prior Year Summer Only 149 161 164 167 173 177 139 151 163 157 150 143 Continuity of Care: Aging Out 402 398 399 404 414 416 205 248 274 253 241 234 Continuity of Care: Approved Break in Service 470 473 482 490 523 585 484 493 530 502 466 476 Continuity of Care: ARRA 148 146 141 142 143 141 51 54 60 52 43 44 Continuity of Care: Geographic Relocation 198 201 207 221 222 224 145 154 161 159 155 161 Continuity of Care: Homeless Contract 29 32 31 30 37 35 29 30 29 29 33 33 Continuity of Care: Supportive Referra l 288 296 308 324 352 371 256 265 284 280 275 278 Continuity of Care: Teen Parent Contract 28 27 28 28 29 30 16 18 22 24 26 29 Genera l Priori ty 41,722 42,588 43,315 44,861 45,970 47,737 32,881 34,266 35,725 34,708 33,147 32,864 Grandparent/Guardian Fami l ies 565 566 576 584 609 632 349 344 350 345 335 335 No Priori ty - Other Fami ly Member 314 327 338 363 393 422 357 381 411 401 397 394 Parent with Specia l Needs 805 807 807 823 840 837 436 424 426 381 347 349 Sibl ing: Contract 714 729 771 788 804 850 737 753 792 775 713 725 Sibl ing: Voucher 833 845 870 815 792 797 544 566 542 435 425 442 Summer only care 919 923 958 1,024 1,074 1,233 853 856 863 879 867 876 N/A 523 518 509 501 500 495 4 6 16 14 11 11
Grand Total 51,269 52,295 53,241 55,026 56,422 58,695 40,318 41,973 43,717 42,348 40,362 40,070
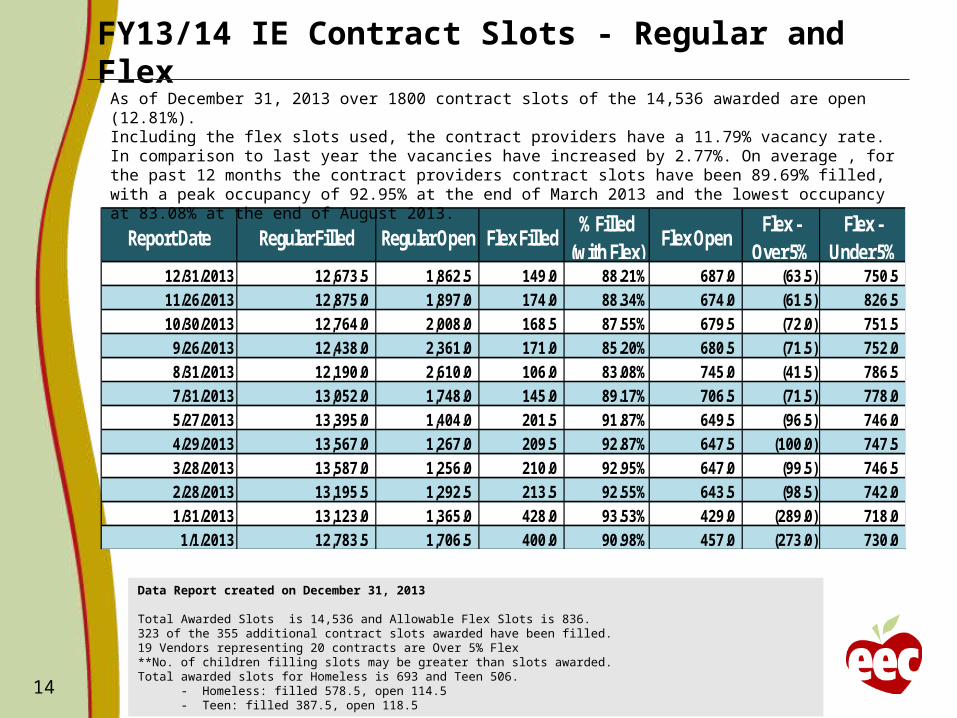
FY13/14 IE Contract Slots - Regular and Flex
14
Data Report created on December 31, 2013
Total Awarded Slots is 14,536 and Allowable Flex Slots is 836. 323 of the 355 additional contract slots awarded have been filled. 19 Vendors representing 20 contracts are Over 5% Flex **No. of children filling slots may be greater than slots awarded.Total awarded slots for Homeless is 693 and Teen 506. - Homeless: filled 578.5, open 114.5 - Teen: filled 387.5, open 118.5
Report Date Regular Filled Regular Open Flex Filled% Filled
(with Flex)Flex Open
Flex - Over 5%
Flex - Under 5%
12/31/2013 12,673.5 1,862.5 149.0 88.21% 687.0 (63.5) 750.5
11/26/2013 12,875.0 1,897.0 174.0 88.34% 674.0 (61.5) 826.5
10/30/2013 12,764.0 2,008.0 168.5 87.55% 679.5 (72.0) 751.5
9/26/2013 12,438.0 2,361.0 171.0 85.20% 680.5 (71.5) 752.0
8/31/2013 12,190.0 2,610.0 106.0 83.08% 745.0 (41.5) 786.5
7/31/2013 13,052.0 1,748.0 145.0 89.17% 706.5 (71.5) 778.0
5/27/2013 13,395.0 1,404.0 201.5 91.87% 649.5 (96.5) 746.0
4/29/2013 13,567.0 1,267.0 209.5 92.87% 647.5 (100.0) 747.5
3/28/2013 13,587.0 1,256.0 210.0 92.95% 647.0 (99.5) 746.5
2/28/2013 13,195.5 1,292.5 213.5 92.55% 643.5 (98.5) 742.0
1/31/2013 13,123.0 1,365.0 428.0 93.53% 429.0 (289.0) 718.0
1/1/2013 12,783.5 1,706.5 400.0 90.98% 457.0 (273.0) 730.0
As of December 31, 2013 over 1800 contract slots of the 14,536 awarded are open (12.81%).Including the flex slots used, the contract providers have a 11.79% vacancy rate. In comparison to last year the vacancies have increased by 2.77%. On average , for the past 12 months the contract providers contract slots have been 89.69% filled, with a peak occupancy of 92.95% at the end of March 2013 and the lowest occupancy at 83.08% at the end of August 2013.
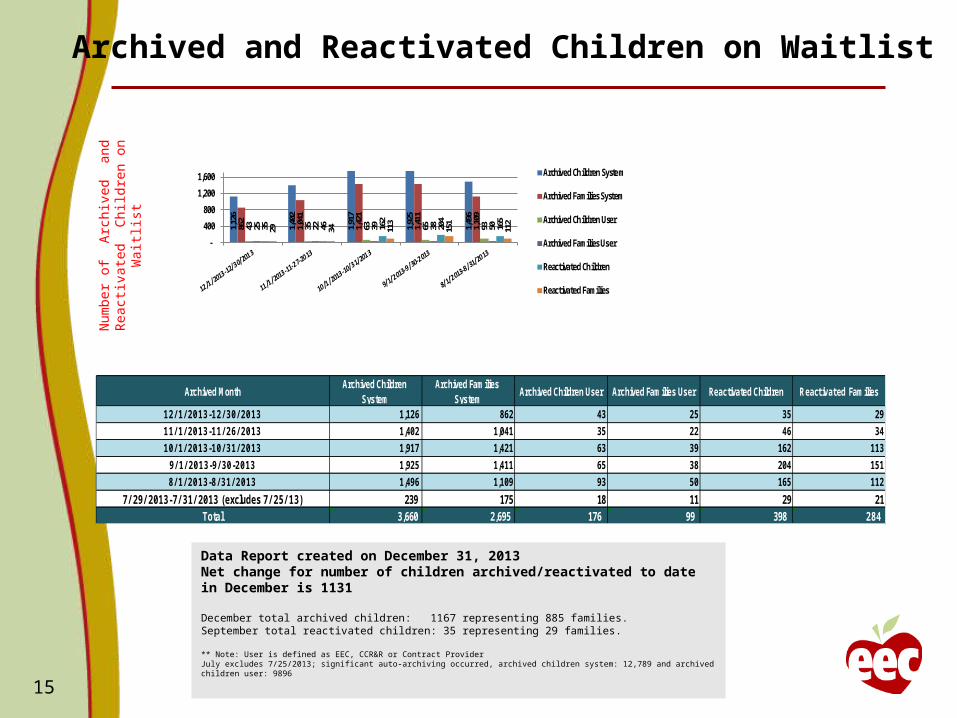
Archived and Reactivated Children on Waitlist
15
Data Report created on December 31, 2013Net change for number of children archived/reactivated to date in December is 1131
December total archived children: 1167 representing 885 families.September total reactivated children: 35 representing 29 families.
** Note: User is defined as EEC, CCR&R or Contract ProviderJuly excludes 7/25/2013; significant auto-archiving occurred, archived children system: 12,789 and archived children user: 9896
Num
ber
of A
rchi
ved
and
R
eact
ivat
ed C
hild
ren
on W
aitli
st
Archived MonthArchived Children
SystemArchived Families
SystemArchived Children User Archived Families User Reactivated Children Reactivated Families
12/ 1/ 2013-12/ 30/ 2013 1,126 862 43 25 35 29
11/ 1/ 2013-11/ 26/ 2013 1,402 1,041 35 22 46 34
10/ 1/ 2013-10/ 31/ 2013 1,917 1,421 63 39 162 113
9/ 1/ 2013-9/ 30-2013 1,925 1,411 65 38 204 151
8/ 1/ 2013-8/ 31/ 2013 1,496 1,109 93 50 165 112
7/ 29/ 2013-7/ 31/ 2013 (excludes 7/ 25/ 13) 239 175 18 11 29 21Total 3,660 2,695 176 99 398 284
1,12
6
1,40
2
1,91
7
1,92
5
1,49
6
862
1,04
1
1,42
1
1,41
1
1,10
9
43
35
63
65
93
25
22
39
38
50
35
46
162
204
165
29
34
113
151
112
-
400
800
1,200
1,600 Archived Children Syste m
Archived Families System
Archived Children User
Archived Families User
Reactivated Children
Reactivated Families