Embed Size (px)
Citation preview

FY14 Half Year Result PresentationFebruary 26, 2014
1
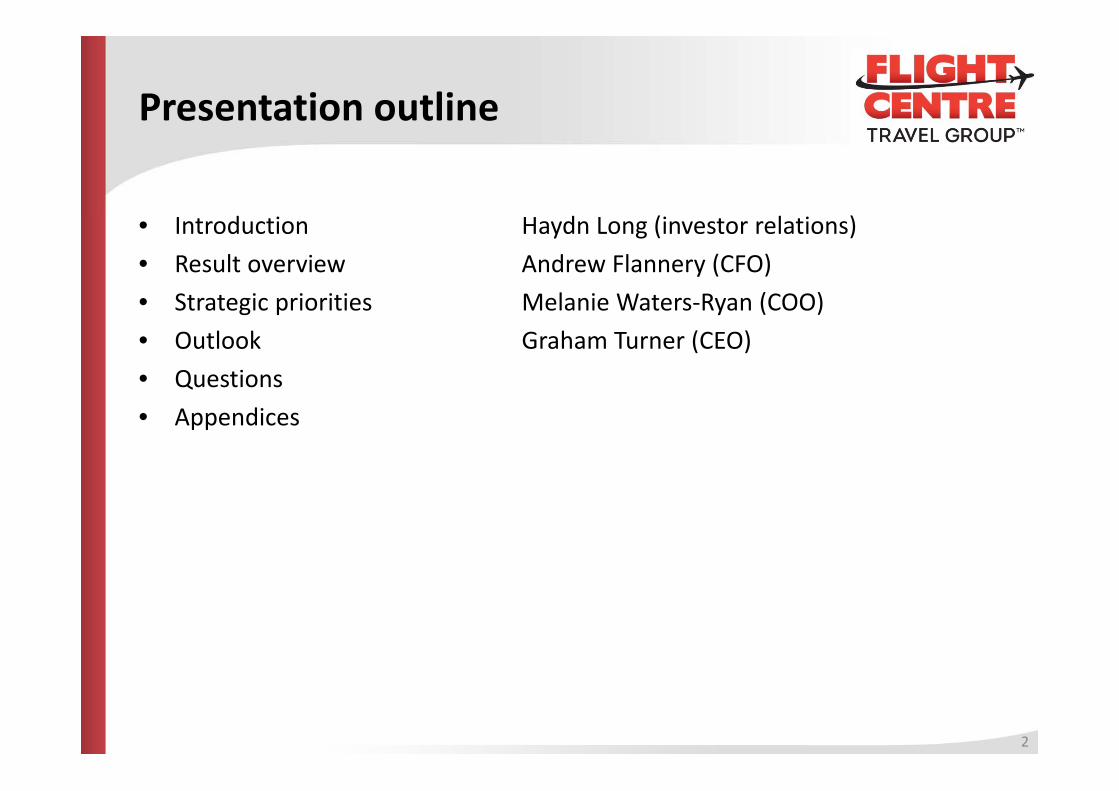
Presentation outline
d d ( l )• Introduction Haydn Long (investor relations)• Result overview Andrew Flannery (CFO)• Strategic priorities Melanie Waters‐Ryan (COO)Strategic priorities Melanie Waters Ryan (COO)• Outlook Graham Turner (CEO)• Questions• Appendices
2
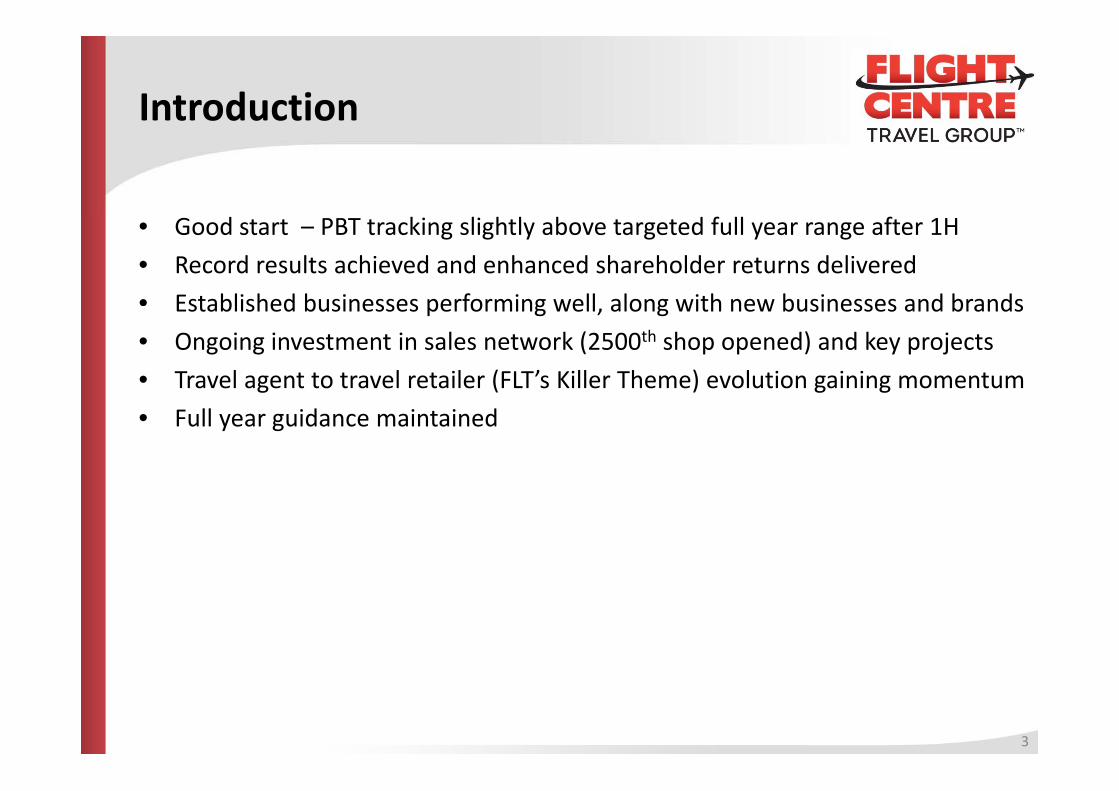
Introduction
• Good start – PBT tracking slightly above targeted full year range after 1H• Record results achieved and enhanced shareholder returns delivered• Established businesses performing well along with new businesses and brandsEstablished businesses performing well, along with new businesses and brands• Ongoing investment in sales network (2500th shop opened) and key projects• Travel agent to travel retailer (FLT’s Killer Theme) evolution gaining momentum• Full year guidance maintained
3

Result overview: 1H highlights
Highlights
TTV $7 5b 13 5%
g g
TTV $7.5b 13.5%
Revenue $1.1b 15.1%
PBT (actual) $155.0m 19.7%( ) $
PBT (underlying) $146.3m 13.0%
NPAT (actual) $110.8m 20.7%
NPAT (underlying) $104.7m 14.1%
Key Drivers• Expansion: 8.2% shop growth during past year – 1100 new jobs created• Global sales growth: In‐store, online and in both leisure and corporate travel • Enhanced Productivity: Sales growth outpaced network growth• Enhanced Productivity: Sales growth outpaced network growth• Margin maintenance: Income margin up slightly, net margin maintained • Diversity: Record 1H EBIT in four countries. Overseas EBIT up more than 30%
4

Result overview: 1H 2014 summaryy
DECEMBER 2013 DECEMBER 2012 Variance %RESULTS IN BRIEF
TTV $7.5b $6.6b 13.5%
Revenue $1,054m $915m 15.1%
Income margin 14.1% 13.9% 20bps
Net margin (underlying) 2.0% 2.0% ‐
Profit Before Tax (actual) $155.0m $129.5m 19.7%
Abnormal items* $8.7m ‐ ‐
Profit Before Tax (underlying) $146.3m $129.5m 13.0%
Net Profit After Tax (actual) $110.8m $91.8m 20.7%
Net Profit After Tax (underlying) $104.7m $91.8m 14.1%
Effective tax rate 28.5% 29.1%
Dividends
Interim Dividend 55.0c 46.0c 19.6%
* Actual PBT for the first half of 2013/14 includes an $8.7m one‐off gain. Underlying results exclude this gain
5
Result overview: The Aussie dollar
W k AUD h t d l ff t d A t li tb d t l FLT’• Weaker AUD has not adversely affected Australian outbound travel or FLT’s Australian business, which generated record 1H results
• ABS data shows Australian outbound travel growth actually accelerated during 1H as AUD dropped (see Appendix 3)
• Has affected some results, including:
– Translation of overseas sales – had the AUD remained at 12/13 levels, TTV would have increased in the order of 10%
– Costs – weaker AUD inflated the expenses incurred by the overseas businesses; and
– Profit – weaker AUD positively impacted overseas profit translation, as experienced in the UK, but negatively affected translation of overseas losses, as experienced in the USA, p
6
Result overview: Cash & dividends
$1b l b l h d i t t tf li t D 31 2013 1H d• $1b global cash and investment portfolio at Dec 31, 2013 – 1H record• Includes $401.9m in general funds (company cash), up from $319.5m at
Dec 31, 2012• Modest debt maintained ($44.6m) – $357.3m positive net debt position• Operating cash outflow as expected during 1H – 2H inflow now underway
$• More than $55m to be returned to shareholders via 55 cents per share interim dividend (fully franked)
• More than $1b in dividends now paid to FLT shareholders since floato e a $ b d de ds o pa d o s a e o de s s ce oa
7
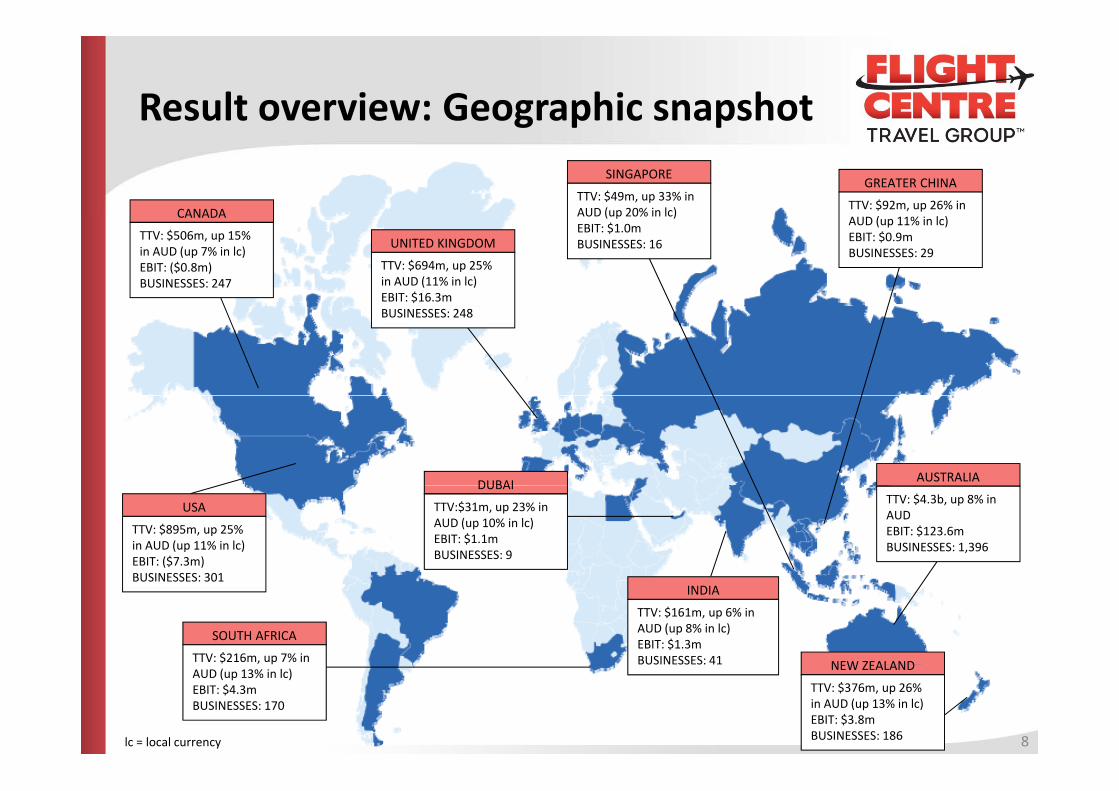
Result overview: Geographic snapshotg p p
CANADA
SINGAPORE
TTV: $49m, up 33% in AUD (up 20% in lc)
GREATER CHINA
TTV: $92m, up 26% in ( )CANADA
TTV: $506m, up 15% in AUD (up 7% in lc)EBIT: ($0.8m)BUSINESSES: 247
UNITED KINGDOM
TTV: $694m, up 25% in AUD (11% in lc)EBIT: $16.3m
AUD (up 20% in lc)EBIT: $1.0mBUSINESSES: 16
AUD (up 11% in lc)EBIT: $0.9mBUSINESSES: 29
BUSINESSES: 248
AUSTRALIADUBAITTV: $4.3b, up 8% in AUDEBIT: $123.6mBUSINESSES: 1,396
DUBAI
TTV:$31m, up 23% in AUD (up 10% in lc)EBIT: $1.1mBUSINESSES: 9
USA
TTV: $895m, up 25% in AUD (up 11% in lc)EBIT: ($7.3m)BUSINESSES 301
NEW ZEALAND
INDIA
TTV: $161m, up 6% in AUD (up 8% in lc)EBIT: $1.3mBUSINESSES: 41
SOUTH AFRICA
TTV: $216m, up 7% in
BUSINESSES: 301
NEW ZEALAND
TTV: $376m, up 26% in AUD (up 13% in lc)EBIT: $3.8mBUSINESSES: 186
AUD (up 13% in lc)EBIT: $4.3mBUSINESSES: 170
lc = local currency 8
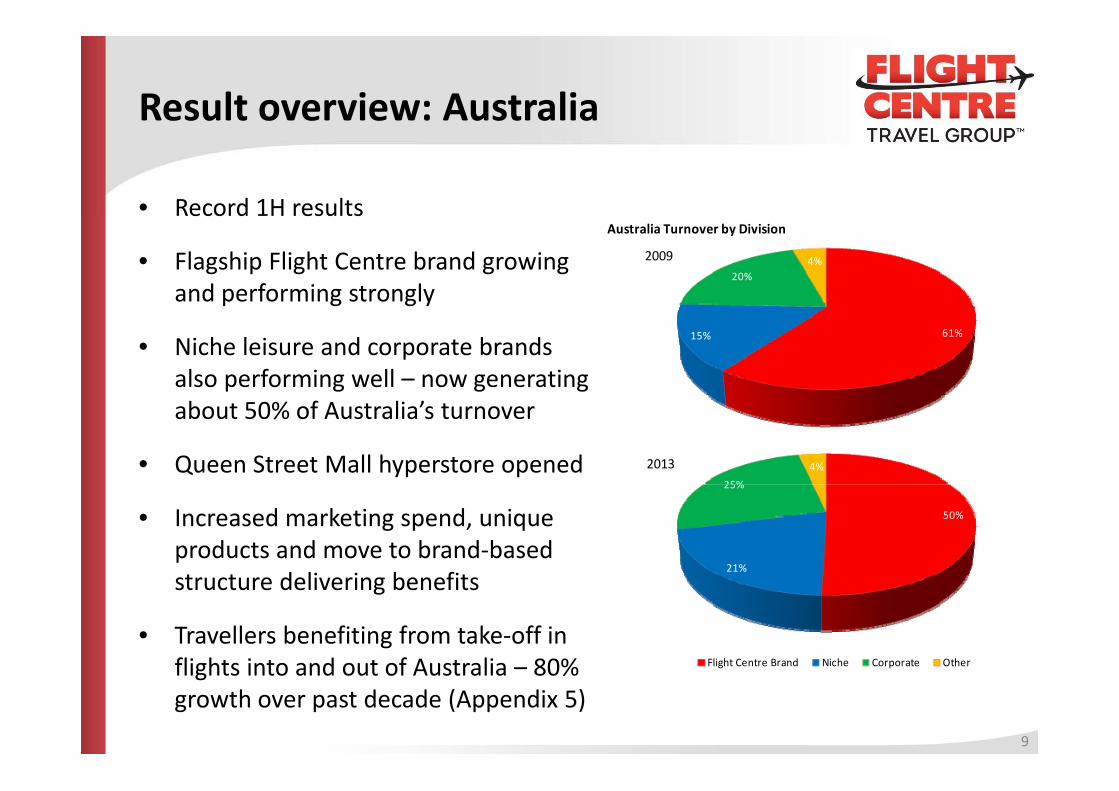
Result overview: Australia
• Record 1H resultseco d esu s
• Flagship Flight Centre brand growing and performing strongly
20%4%2009
Australia Turnover by Division
p g g y
• Niche leisure and corporate brands also performing well – now generating
61%15%
about 50% of Australia’s turnover
• Queen Street Mall hyperstore opened Flight Centre Brand Niche Corporate Other25%
4%2013
• Increased marketing spend, unique products and move to brand‐based t t d li i b fit
50%
21%
25%
structure delivering benefits
• Travellers benefiting from take‐off in flights into and out of Australia 80% Flight Centre Brand Niche Corporate Otherflights into and out of Australia – 80% growth over past decade (Appendix 5)
9
Flight Centre Brand Niche Corporate Other
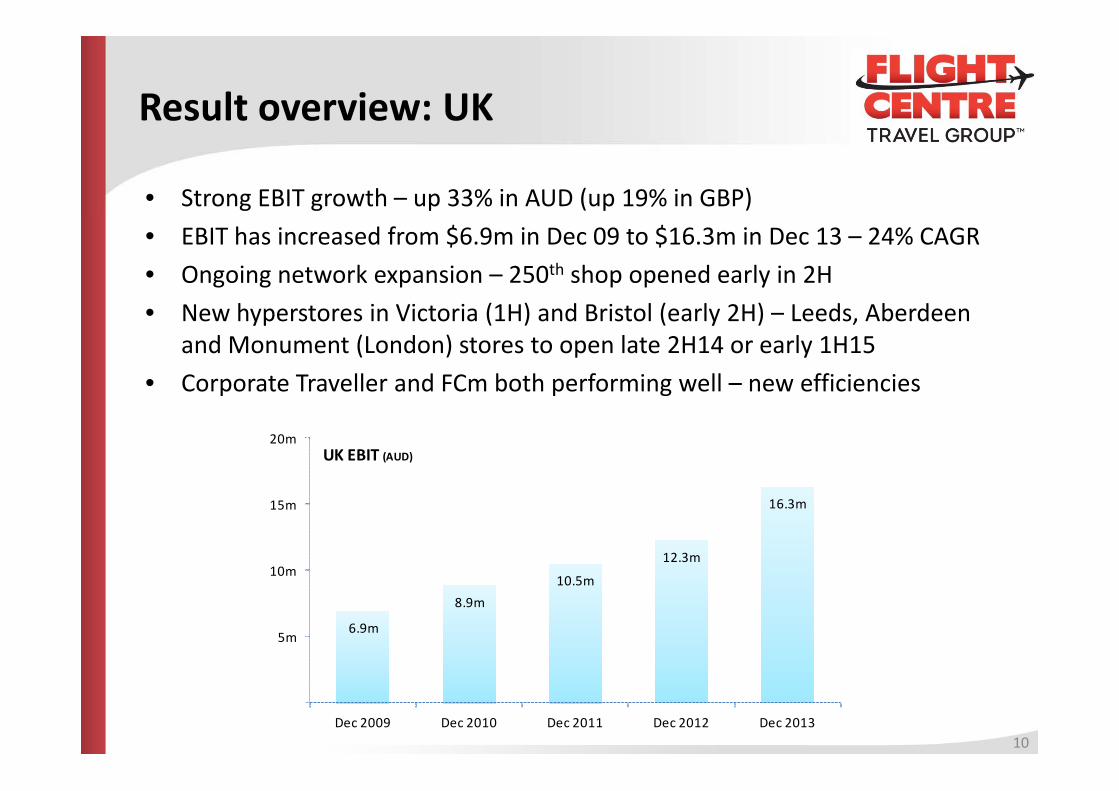
Result overview: UK
• Strong EBIT growth – up 33% in AUD (up 19% in GBP)• EBIT has increased from $6.9m in Dec 09 to $16.3m in Dec 13 – 24% CAGR• Ongoing network expansion – 250th shop opened early in 2H
N h t i Vi t i (1H) d B i t l ( l 2H) L d Ab d• New hyperstores in Victoria (1H) and Bristol (early 2H) – Leeds, Aberdeen and Monument (London) stores to open late 2H14 or early 1H15
• Corporate Traveller and FCm both performing well – new efficienciesp p g
20mUK EBIT (AUD)
12.3m
16.3m
10m
15m
6.9m
8.9m10.5m
5m
10m
10Dec 2009 Dec 2010 Dec 2011 Dec 2012 Dec 2013
Result overview: USA
• Losses during seasonally slower trading period – early 2H results also impacted by severe weather
• Modest sales growth in leisure and wholesale – bottom‐line growth needed• Corporate growth trajectory continuing generated 47% of 1H turnover• Corporate growth trajectory continuing – generated 47% of 1H turnover• Miami and Atlanta offices to open in 2H, giving FLT a 17‐city US footprint • Boston hyperstore opened this week, Philadelphia store to open 1H15yp p p p• Transactional Liberty website launched early in 2H • Developing unique Liberty product lines to broaden sales mix
11
Result overview: Rest of the world
SOUTH AFRICA• Good year‐on‐year growth in profit and sales• Transactional Flight Centre website launched
NEW ZEALAND• EBIT up more than 80% in AUD – best 1H result since Dec 07 • Flight Centre brand performing strongly• Flight Centre brand performing strongly
CANADAO ll l b l i• Overall results below expectations
• Continued corporate travel profits, aiming for leisure travel recovery during seasonally stronger 2H
CHINA, SINGAPORE, INDIA AND DUBAI• Record 1H EBIT from emerging Greater China and Singapore businesses• Continued profits in India and Dubai
12
Strategic priorities: FLT’s transitiong p
FLT is transitioning from a travel agent to a world class
retailer of travel products to leisure and corporate customers
Being a world class retailer means we areBeing a world class retailer means we are
the brand/business people identify with and go to
It is very different to being an agent, a middle man,
a dealer for someone else’s product
13
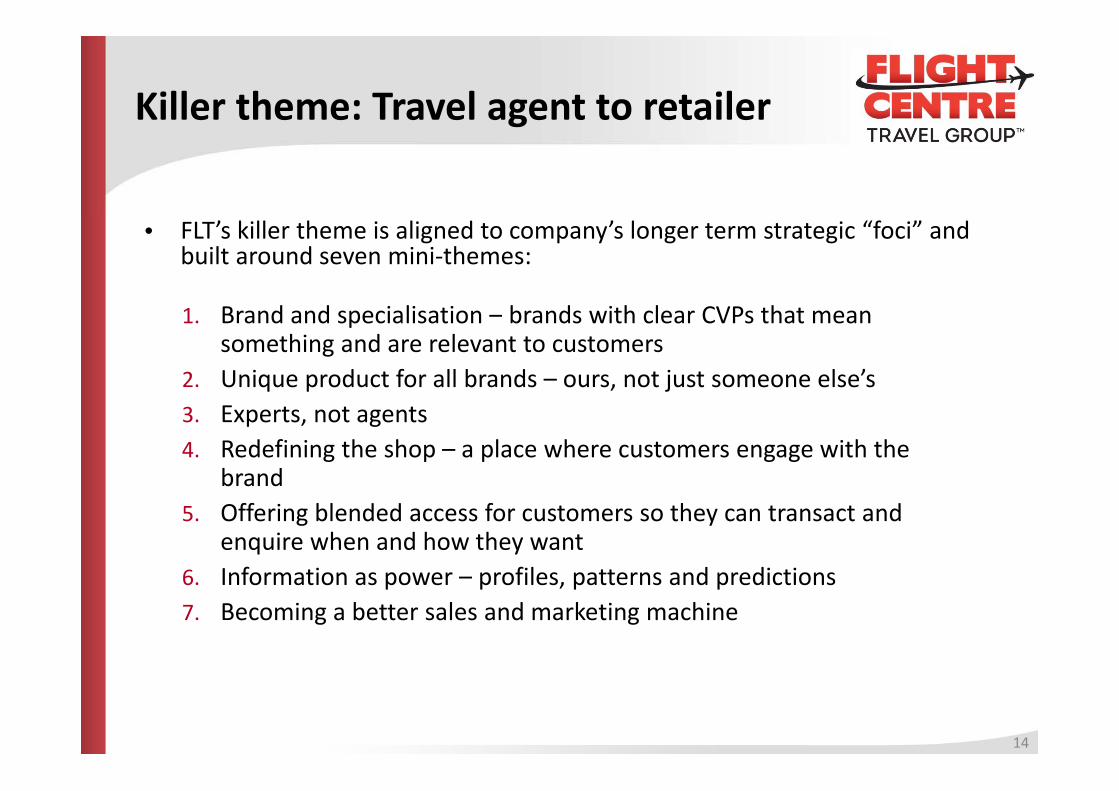
Killer theme: Travel agent to retailerg
• FLT’s killer theme is aligned to company’s longer term strategic “foci” and built around seven mini‐themes:
d d l b d h l h1. Brand and specialisation – brands with clear CVPs that mean something and are relevant to customers
2. Unique product for all brands – ours, not just someone else’s3. Experts, not agents4. Redefining the shop – a place where customers engage with the
brandbrand5. Offering blended access for customers so they can transact and
enquire when and how they want6 Information as power profiles patterns and predictions6. Information as power – profiles, patterns and predictions7. Becoming a better sales and marketing machine
14
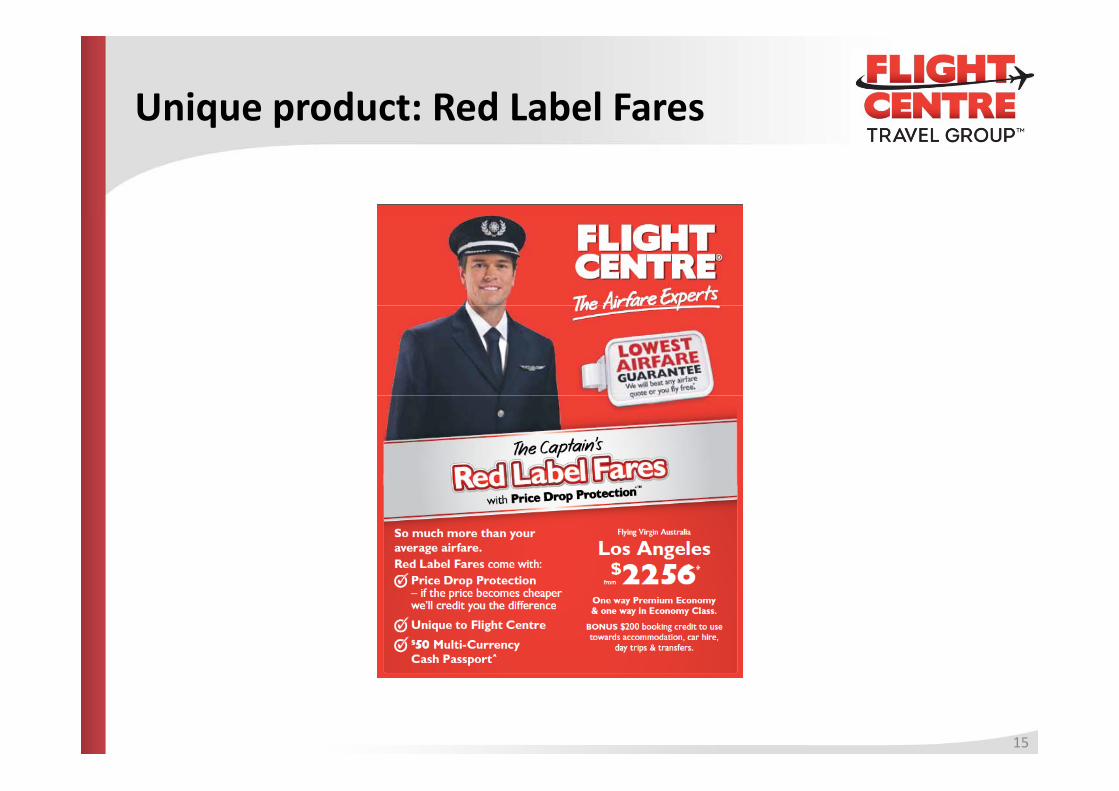
Unique product: Red Label Faresq p
15
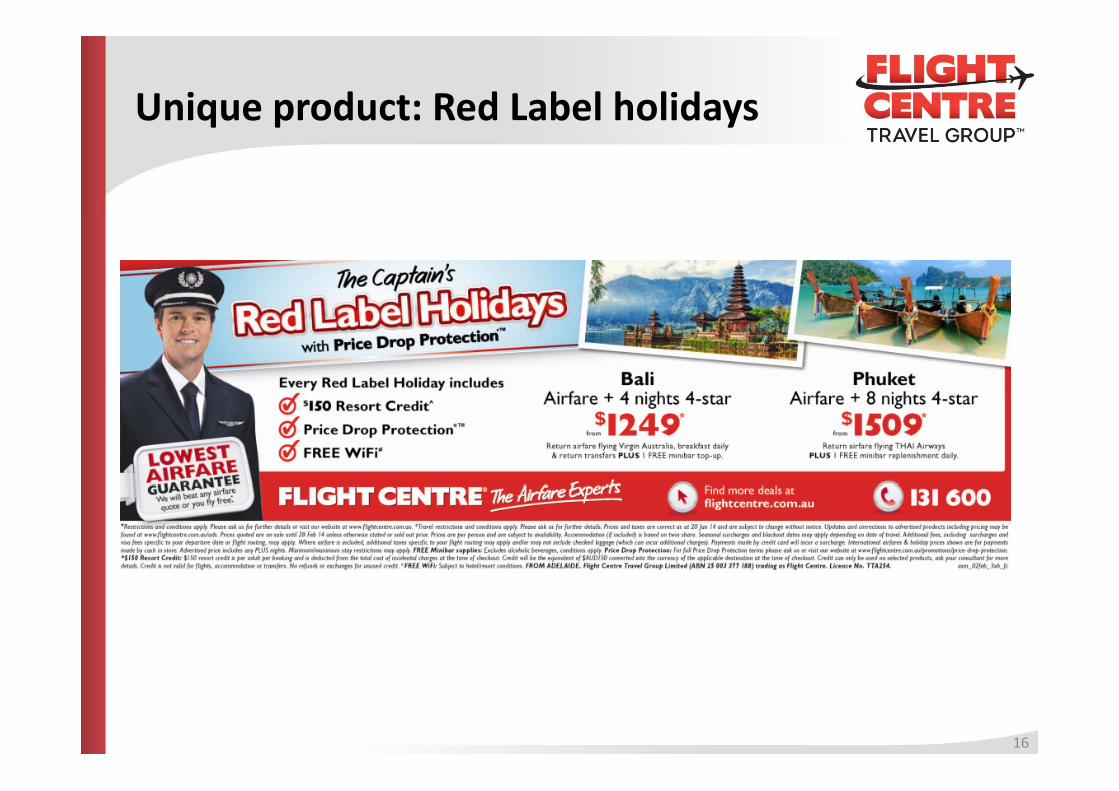
Unique product: Red Label holidaysq p y
16

Unique product: Pack & Relax holidaysq p y
17
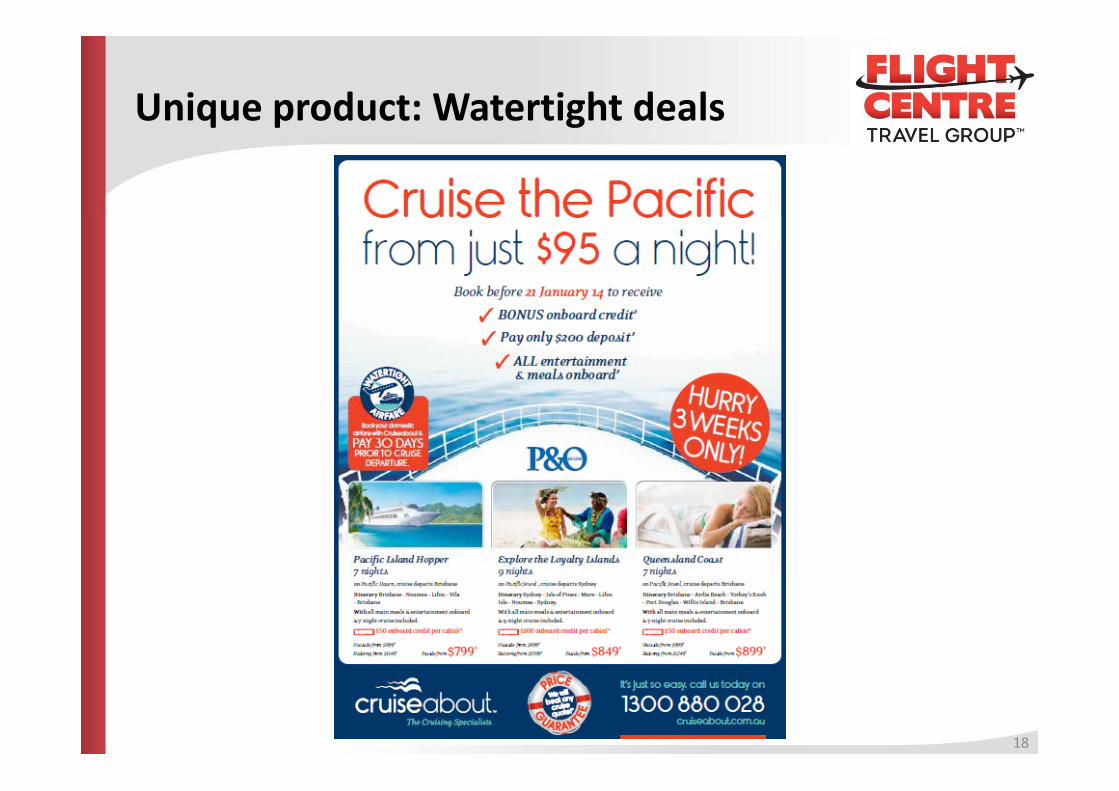
Unique product: Watertight dealsq p g
18
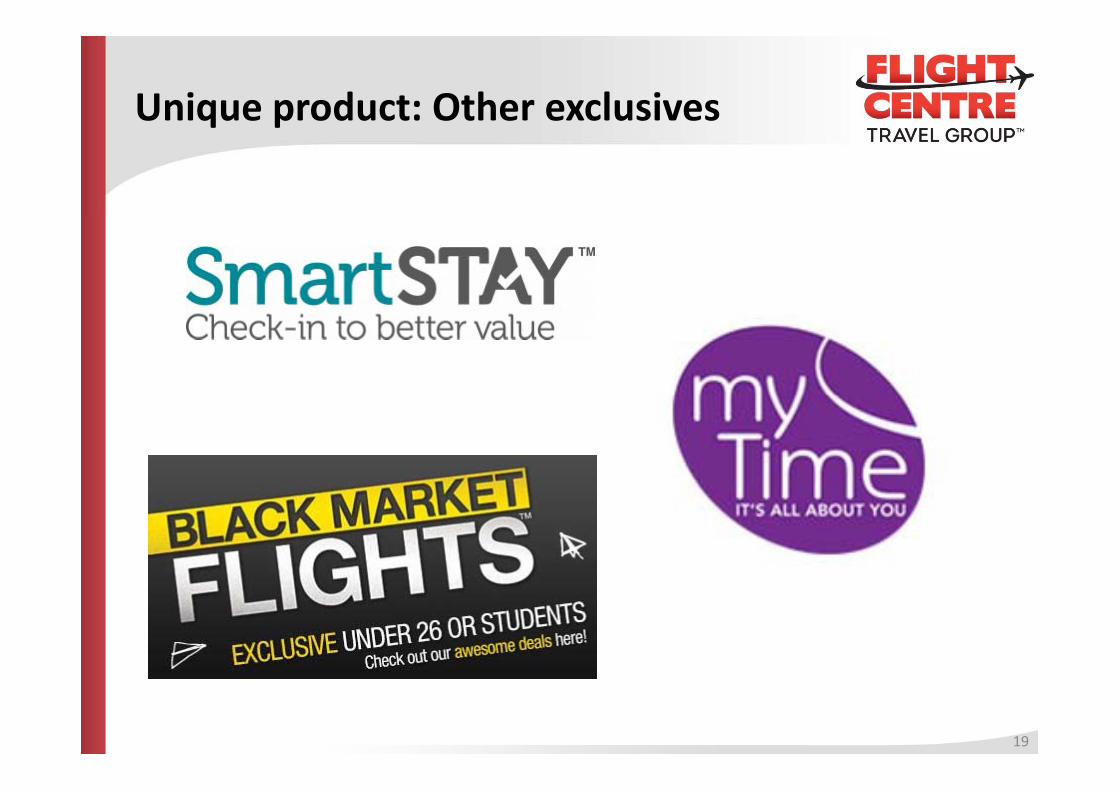
Unique product: Other exclusives q p
19
Mobile consultants: Queen St hyperstoreyp
20
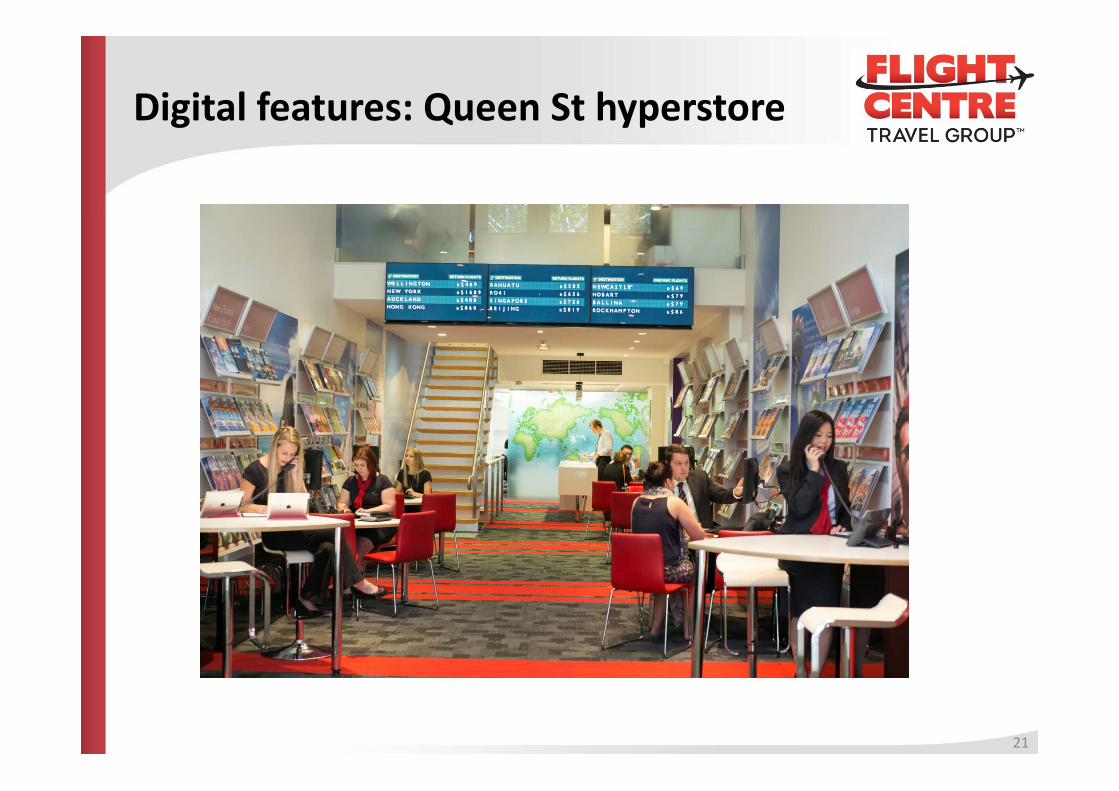
Digital features: Queen St hyperstoreg yp
21
Outlook: 2013/14 guidance/ g
l b l d f ll• Promising 1H results but too early to amend full year targets• Continuing to target underlying PBT between $370m and $385m• Targeted range represents 8‐12% growth on record 2012/13 PBTTargeted range represents 8 12% growth on record 2012/13 PBT• Guidance assumes stable trading conditions and excludes possible
goodwill adjustments (USA/India) or significant unforeseen items• Key global strategies in place
22
Outlook: Growth plansp
f k h l b ll d /• Aiming for 8‐10% network growth globally during 2013/14• Expansion opportunities for all businesses• Growth will primarily be organicGrowth will primarily be organic • Complemented by Escape Travel franchise growth – model reintroduced in
Australia during 1H – and possible acquisitions
23
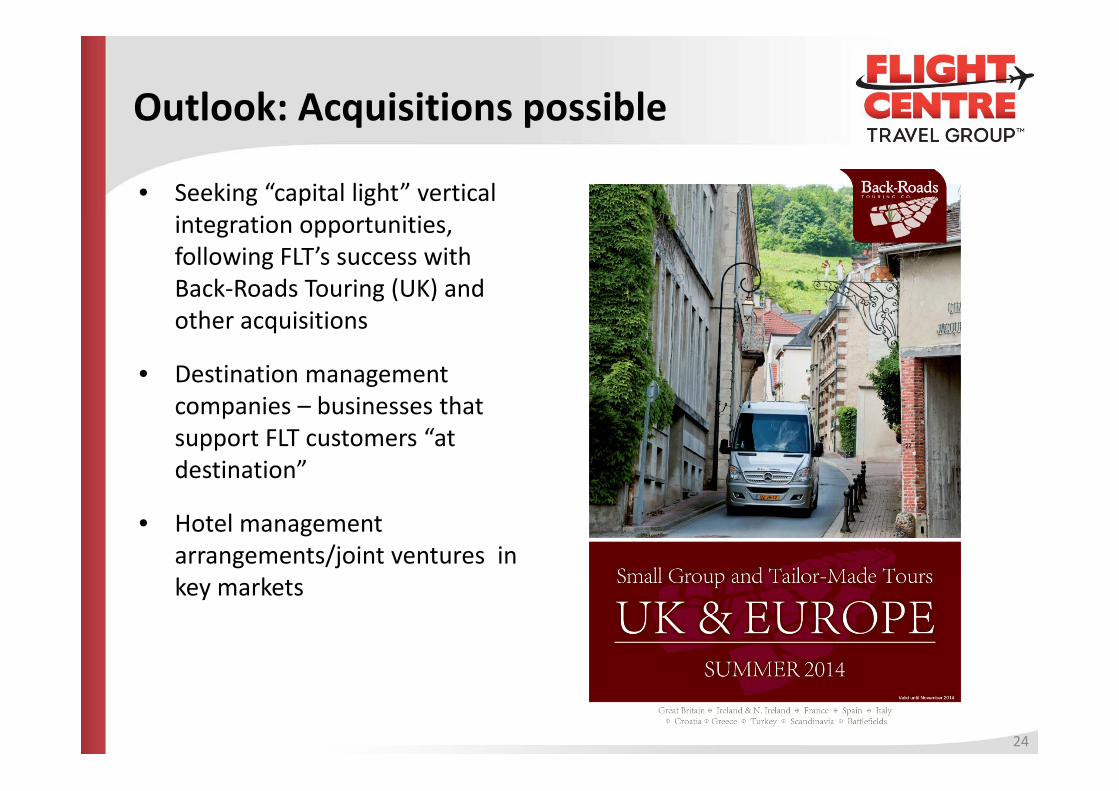
Outlook: Acquisitions possibleq p
• Seeking “capital light” vertical i i i iintegration opportunities, following FLT’s success with Back‐Roads Touring (UK) and other acquisitions
• Destination management companies – businesses that support FLT customers “at destination”
• Hotel management arrangements/joint ventures in key markets
24
Recent developments: Corporate growthp p g
l b f• Corporate travel brands accounted for one third of 1H TTV globally
• Does not include small corporate accounts that ptransact via FLT’s leisure brands – Flight Centre Business Travel is growing rapidly
• Continued investment in corporate travel• Continued investment in corporate travel platforms – new Traveller Tools, reporting systems and risk management services
• Consolidation of Online Booking Tools and Expense Management Solutions
• New global team of multi‐national BDMsNew global team of multi national BDMs starting to win accounts for FCm
• Continued FCm network development
25
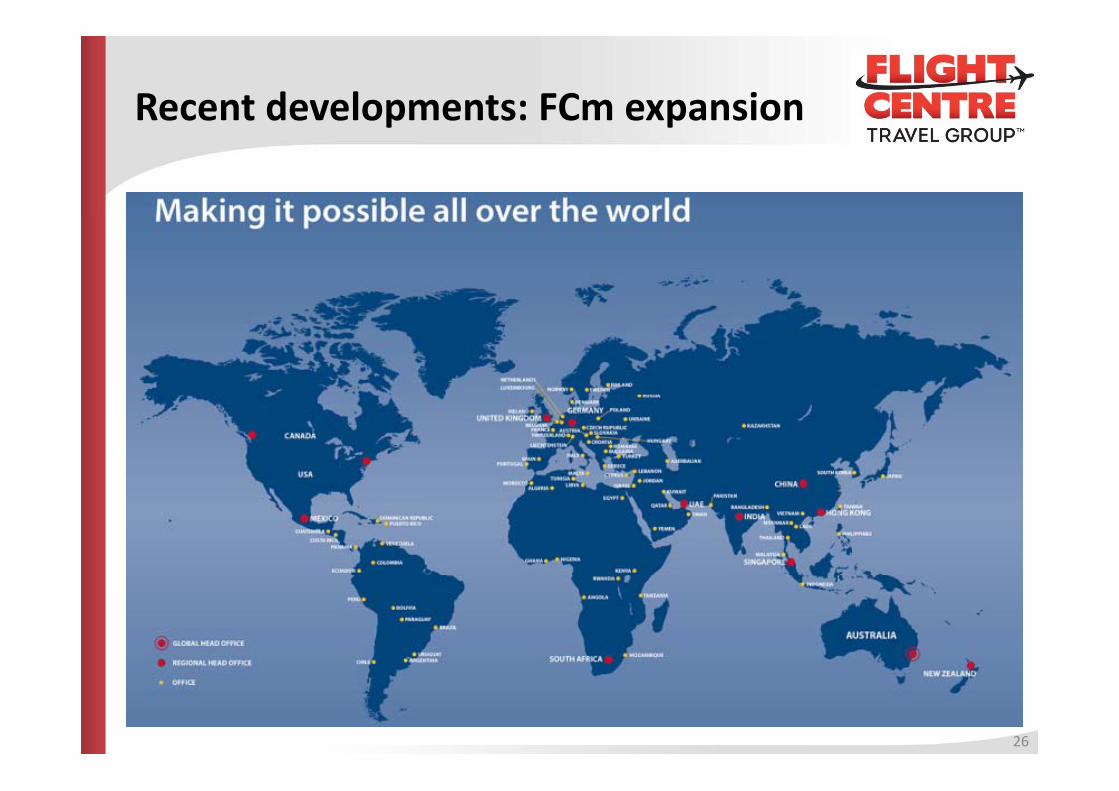
Recent developments: FCm expansionp p
26
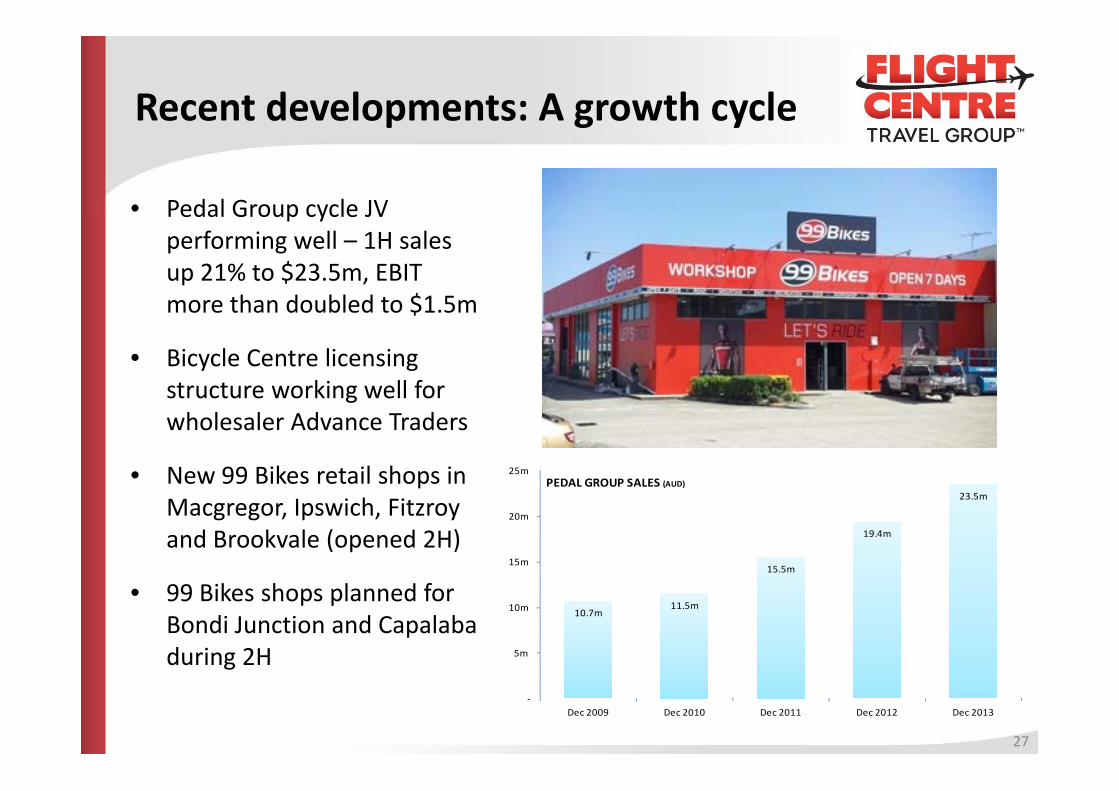
Recent developments: A growth cyclep g y
• Pedal Group cycle JVPedal Group cycle JV performing well – 1H sales up 21% to $23.5m, EBIT more than doubled to $1 5mmore than doubled to $1.5m
• Bicycle Centre licensing structure working well forstructure working well for wholesaler Advance Traders
• New 99 Bikes retail shops in 25m PEDAL GROUP SALES (AUD)p
Macgregor, Ipswich, Fitzroy and Brookvale (opened 2H)
15.5m
19.4m
23.5m
15m
20m
PEDAL GROUP SALES (AUD)
• 99 Bikes shops planned for Bondi Junction and Capalaba during 2H
10.7m 11.5m
5m
10m
during H
27
‐Dec 2009 Dec 2010 Dec 2011 Dec 2012 Dec 2013
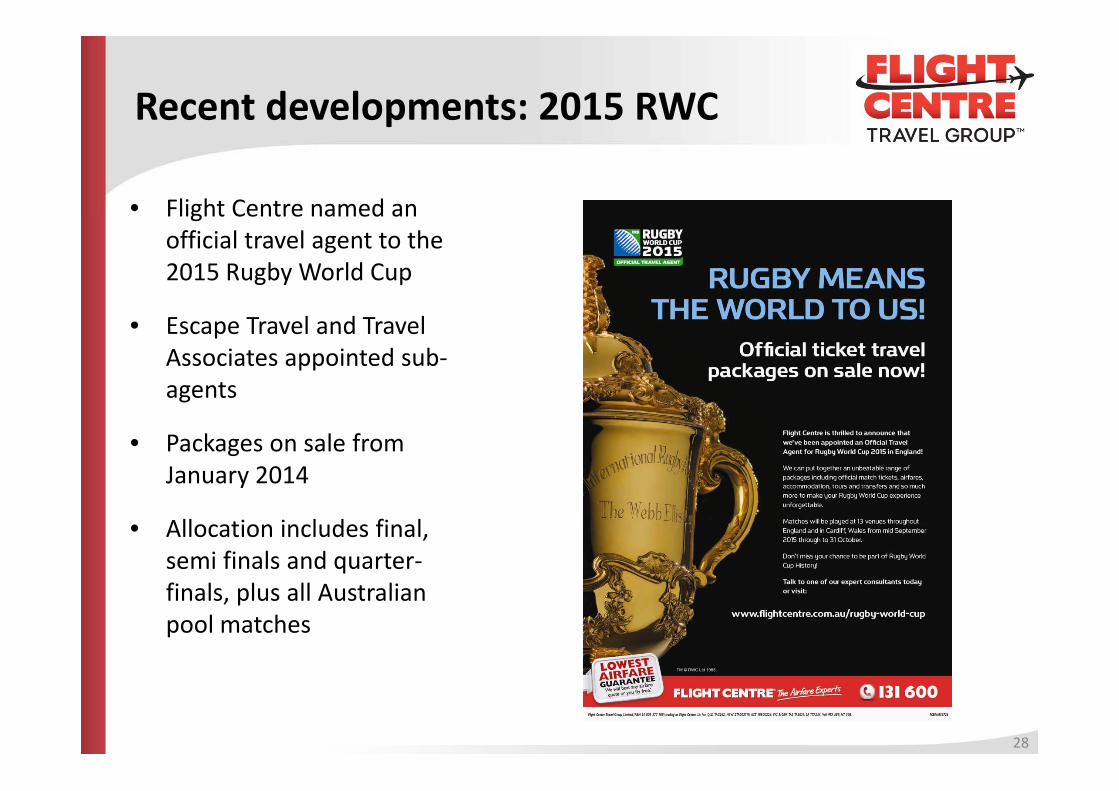
Recent developments: 2015 RWCp
• Flight Centre named anFlight Centre named an official travel agent to the 2015 Rugby World Cup
• Escape Travel and Travel Associates appointed sub‐agentsagents
• Packages on sale from January 2014y
• Allocation includes final, semi finals and quarter‐finals, plus all Australian pool matches
28

End of presentation: Questions?
29
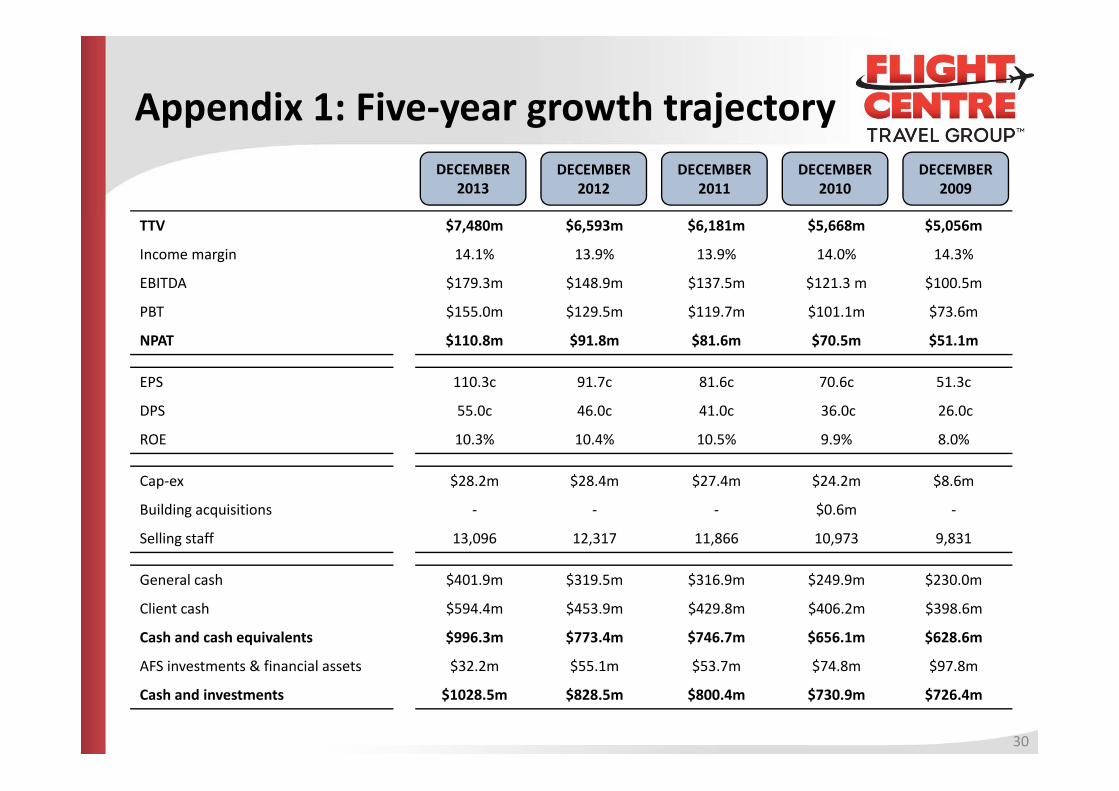
Appendix 1: Five‐year growth trajectorypp y g j yDECEMBER
2013DECEMBER
2012DECEMBER
2011DECEMBER
2010DECEMBER
2009
TTV $7,480m $6,593m $6,181m $5,668m $5,056m
Income margin 14.1% 13.9% 13.9% 14.0% 14.3%
EBITDA $179.3m $148.9m $137.5m $121.3 m $100.5m
$ $ $ $ $PBT $155.0m $129.5m $119.7m $101.1m $73.6m
NPAT $110.8m $91.8m $81.6m $70.5m $51.1m
EPS 110.3c 91.7c 81.6c 70.6c 51.3c
DPS 55.0c 46.0c 41.0c 36.0c 26.0c
ROE 10.3% 10.4% 10.5% 9.9% 8.0%
Cap‐ex $28.2m $28.4m $27.4m $24.2m $8.6mCap ex $28.2m $28.4m $27.4m $24.2m $8.6m
Building acquisitions ‐ ‐ ‐ $0.6m ‐
Selling staff 13,096 12,317 11,866 10,973 9,831
G l h $401 9 $319 5 $316 9 $249 9 $230 0General cash $401.9m $319.5m $316.9m $249.9m $230.0m
Client cash $594.4m $453.9m $429.8m $406.2m $398.6m
Cash and cash equivalents $996.3m $773.4m $746.7m $656.1m $628.6m
AFS investments & financial assets $32 2m $55 1m $53 7m $74 8m $97 8mAFS investments & financial assets $32.2m $55.1m $53.7m $74.8m $97.8m
Cash and investments $1028.5m $828.5m $800.4m $730.9m $726.4m
30
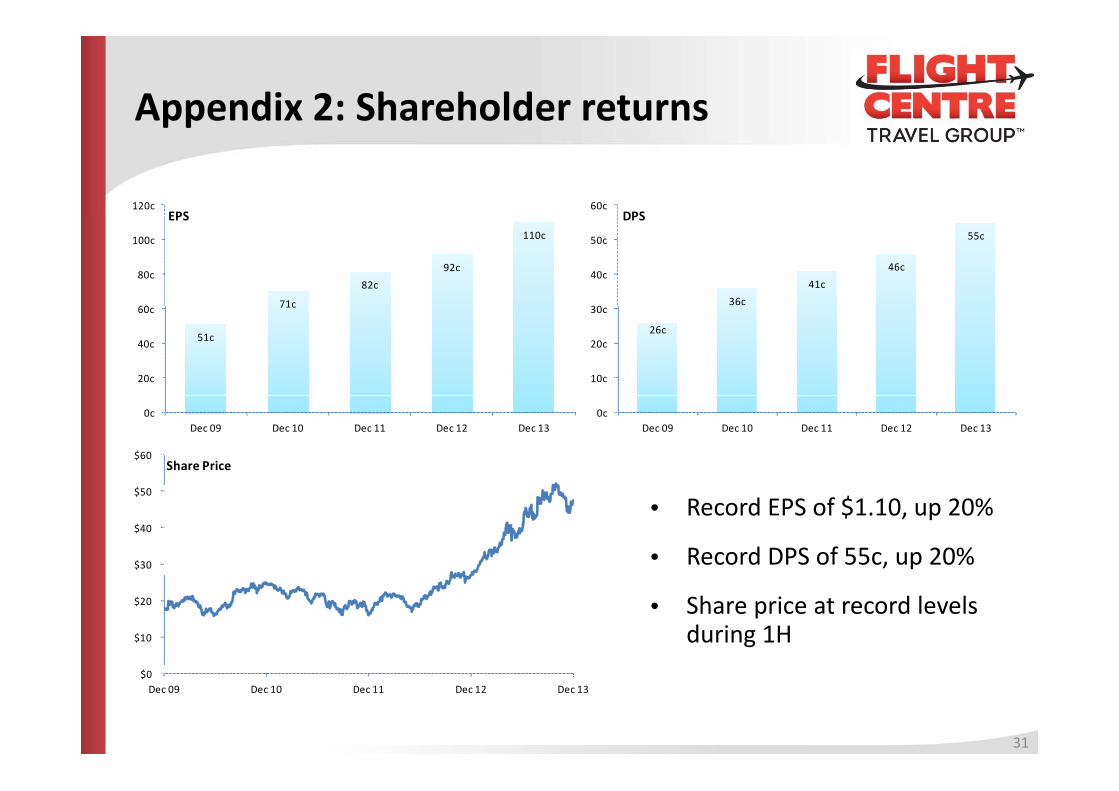
Appendix 2: Shareholder returnspp
120cEPS
60cDPS
71c
82c92c
110c
60
80c
100c
EPS
36c41c
46c
55c
30
40c
50c
DPS
51c
71c
20c
40c
60c
26c
10c
20c
30c
0cDec 09 Dec 10 Dec 11 Dec 12 Dec 13
0cDec 09 Dec 10 Dec 11 Dec 12 Dec 13
$60 Share Price
• Record EPS of $1.10, up 20%
• Record DPS of 55c, up 20%$30
$40
$50
• Share price at record levels during 1H$10
$20
$0 Dec 09 Dec 10 Dec 11 Dec 12 Dec 13
31
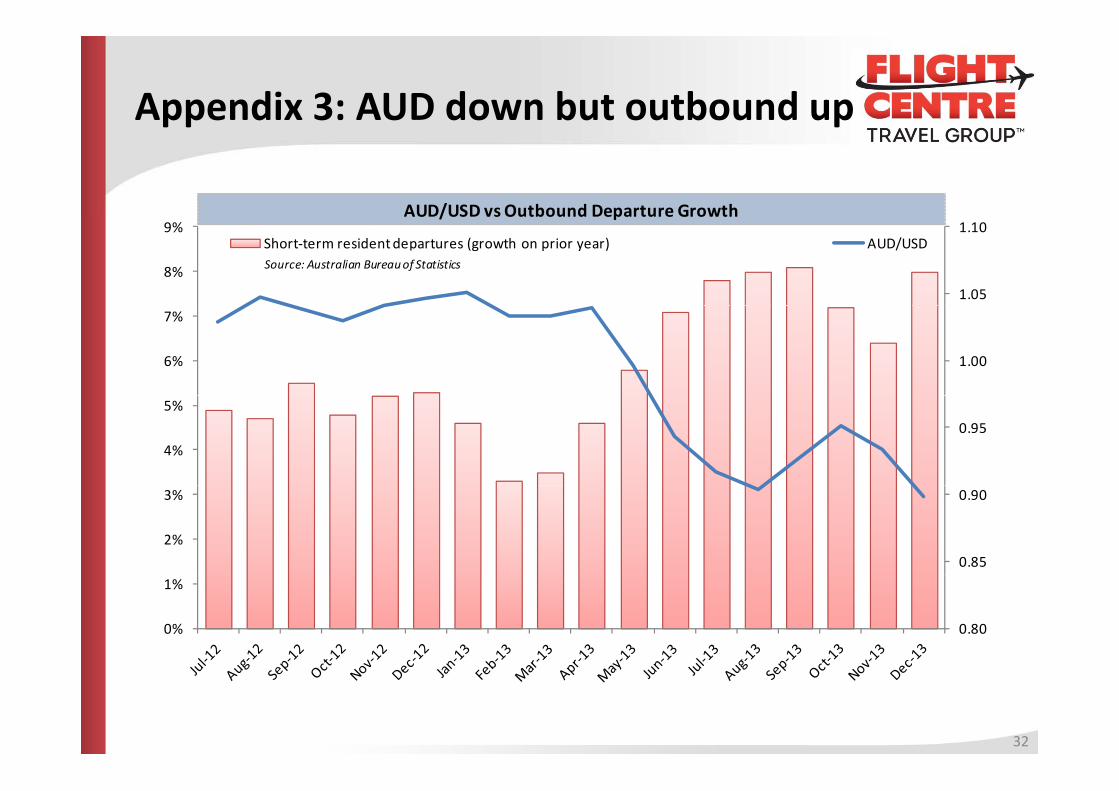
Appendix 3: AUD down but outbound uppp p
AUD/USD vsOutbound Departure Growth
1.05
1.10
8%
9%Short‐term resident departures (growth on prior year) xxxxxx AUD/USD
AUD/USD vs Outbound Departure Growth
Source: Australian Bureau of Statistics
1.006%
7%
0.954%
5%
0.85
0.90
2%
3%
0.800%
1%
32
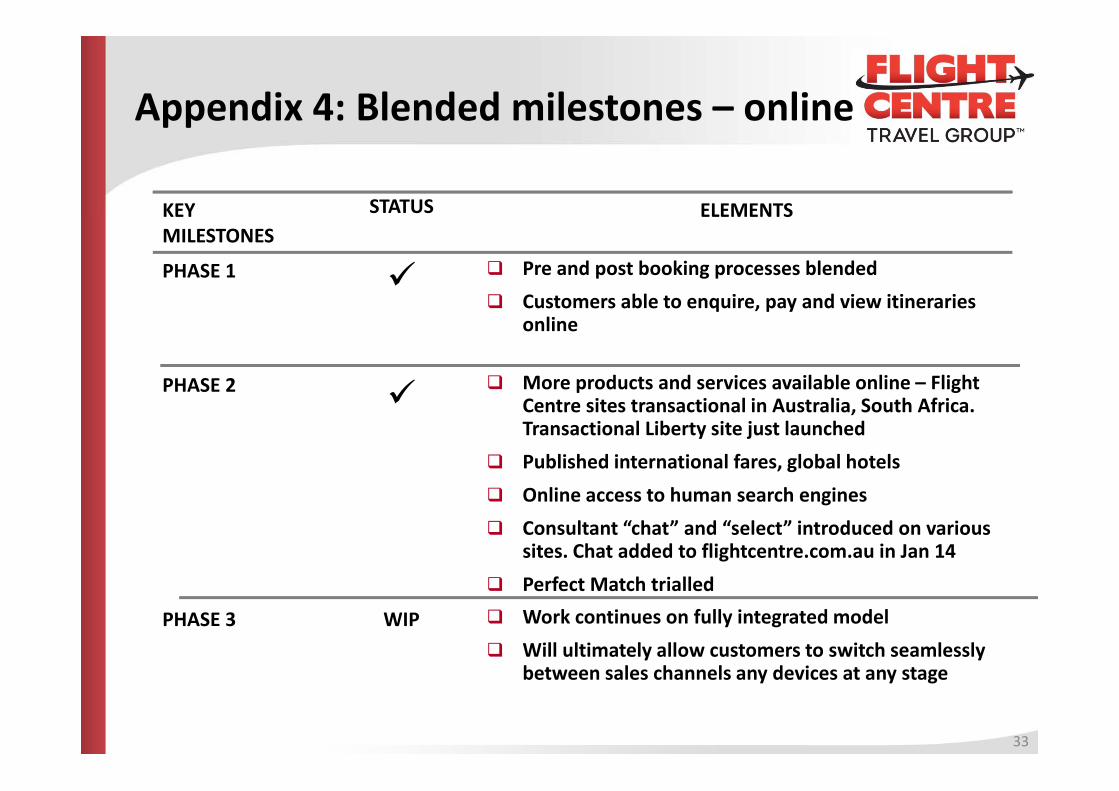
Appendix 4: Blended milestones – onlinepp
KEY STATUS ELEMENTSKEY MILESTONES
ELEMENTS
PHASE 1 Pre and post booking processes blended Customers able to enquire, pay and view itineraries Customers able to enquire, pay and view itineraries
online
PHASE 2 More products and services available online – Flight Centre sites transactional in Australia, South Africa. Transactional Liberty site just launched
Published international fares, global hotels Online access to human search engines Consultant “chat” and “select” introduced on various
sites. Chat added to flightcentre.com.au in Jan 14 Perfect Match trialled
PHASE 3 WIP Work continues on fully integrated model Will ultimately allow customers to switch seamlessly
33
between sales channels any devices at any stage
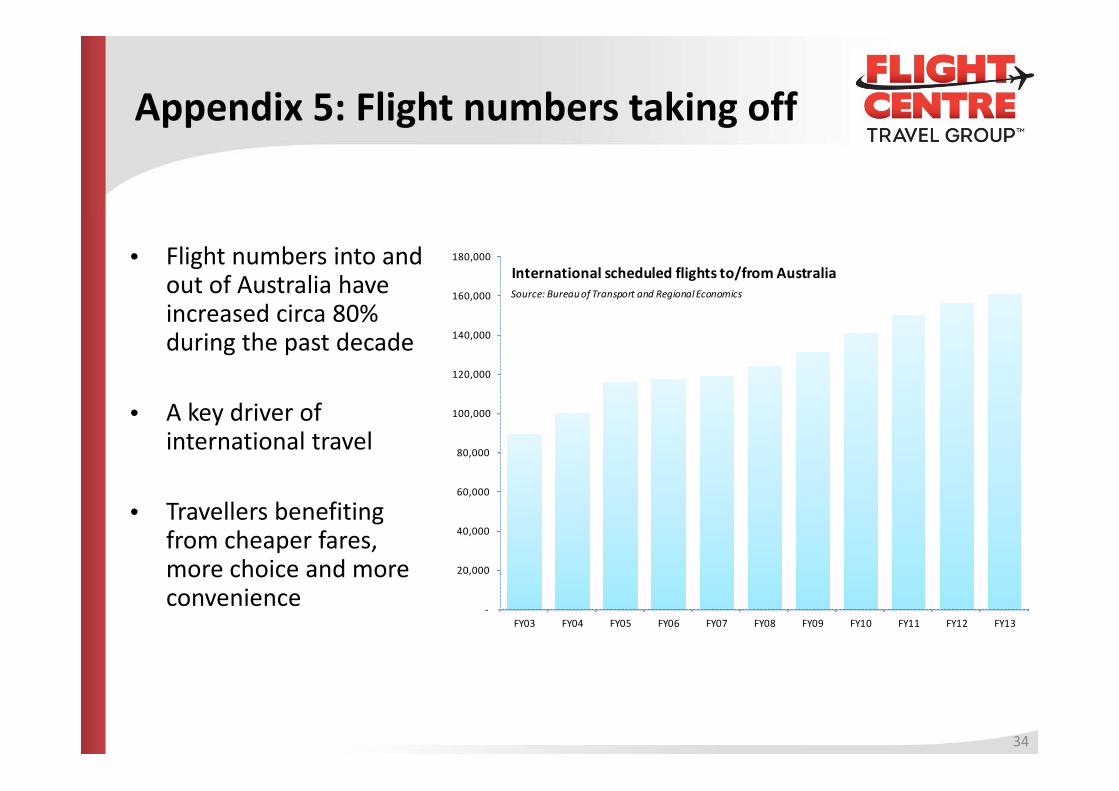
Appendix 5: Flight numbers taking offpp g g
• Flight numbers into and out of Australia have i d i 80%
160,000
180,000
International scheduled flights to/from AustraliaSource: Bureau of Transport and Regional Economics
increased circa 80% during the past decade
120,000
140,000
• A key driver of international travel 80,000
100,000
• Travellers benefiting from cheaper fares, more choice and more 20,000
40,000
60,000
more choice and more convenience
‐
,
FY03 FY04 FY05 FY06 FY07 FY08 FY09 FY10 FY11 FY12 FY13
34