Embed Size (px)
Citation preview
1
Sepura PLC
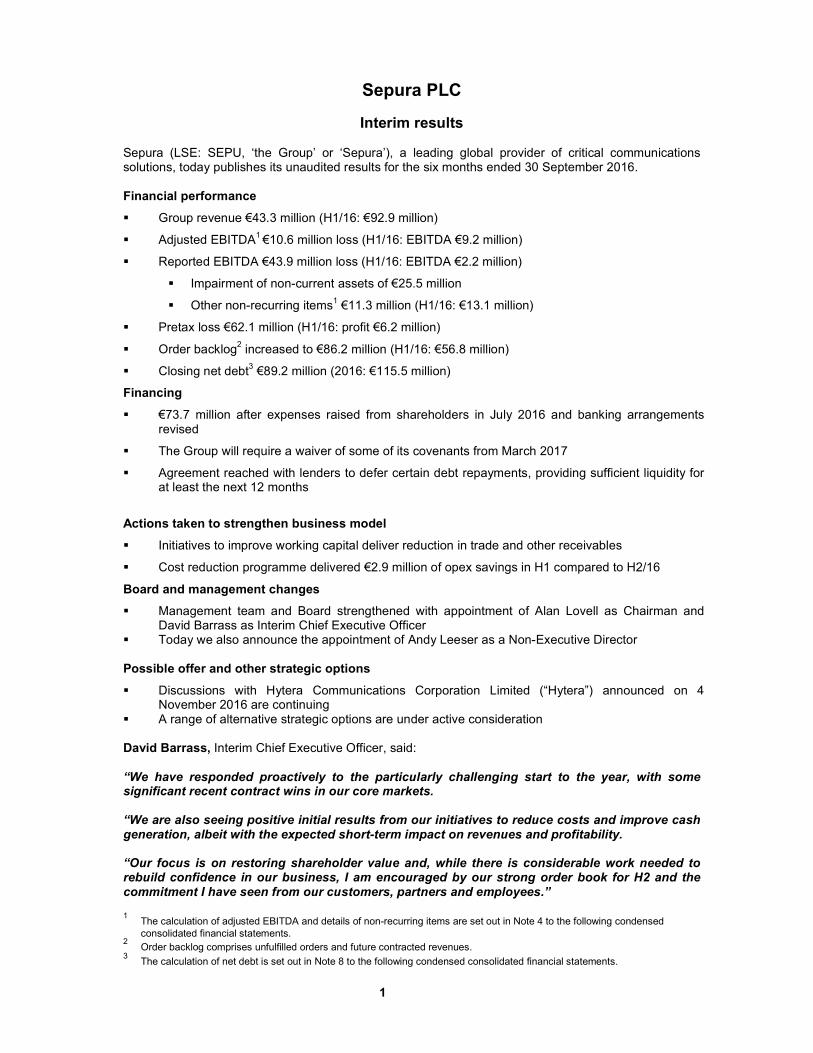
Interim results Sepura (LSE: SEPU, ‘the Group’ or ‘Sepura’), a leading global provider of critical communications solutions, today publishes its unaudited results for the six months ended 30 September 2016.
Financial performance
� Group revenue €43.3 million (H1/16: €92.9 million)
� Adjusted EBITDA1 €10.6 million loss (H1/16: EBITDA €9.2 million)
� Reported EBITDA €43.9 million loss (H1/16: EBITDA €2.2 million)
� Impairment of non-current assets of €25.5 million
� Other non-recurring items1 €11.3 million (H1/16: €13.1 million)
� Pretax loss €62.1 million (H1/16: profit €6.2 million)
� Order backlog2 increased to €86.2 million (H1/16: €56.8 million)
� Closing net debt3 €89.2 million (2016: €115.5 million)
Financing
� €73.7 million after expenses raised from shareholders in July 2016 and banking arrangements revised
� The Group will require a waiver of some of its covenants from March 2017
� Agreement reached with lenders to defer certain debt repayments, providing sufficient liquidity for at least the next 12 months
Actions taken to strengthen business model
� Initiatives to improve working capital deliver reduction in trade and other receivables
� Cost reduction programme delivered €2.9 million of opex savings in H1 compared to H2/16
Board and management changes
� Management team and Board strengthened with appointment of Alan Lovell as Chairman and David Barrass as Interim Chief Executive Officer
� Today we also announce the appointment of Andy Leeser as a Non-Executive Director Possible offer and other strategic options
� Discussions with Hytera Communications Corporation Limited (“Hytera”) announced on 4 November 2016 are continuing
� A range of alternative strategic options are under active consideration David Barrass, Interim Chief Executive Officer, said:
“We have responded proactively to the particularly challenging start to the year, with some significant recent contract wins in our core markets. “We are also seeing positive initial results from our initiatives to reduce costs and improve cash generation, albeit with the expected short-term impact on revenues and profitability. “Our focus is on restoring shareholder value and, while there is considerable work needed to rebuild confidence in our business, I am encouraged by our strong order book for H2 and the commitment I have seen from our customers, partners and employees.” 1 The calculation of adjusted EBITDA and details of non-recurring items are set out in Note 4 to the following condensed
consolidated financial statements. 2 Order backlog comprises unfulfilled orders and future contracted revenues.
3 The calculation of net debt is set out in Note 8 to the following condensed consolidated financial statements.
2
Cautionary statement and inside information This announcement contains certain forward-looking statements with respect to the operations, performance and financial condition of Sepura. By their nature, future events and circumstances can cause results and developments to differ from those anticipated. Nothing in this announcement should be construed as a profit forecast. No undertaking is given to update any forward-looking statement whether as a result of new information, future events or otherwise. The information contained within this announcement is deemed by the Company to constitute inside information as stipulated under the Market Abuse Regulations (EU) No.596/2014. Upon the publication of this announcement via a Regulatory Information Service, this inside information is now considered to be in the public domain. Further information: Sepura David Barrass, Interim Chief Executive Officer Richard Smith, Chief Financial Officer Peter Connor, Investor Relations
+44 1223 876000
Instinctif Partners Adrian Duffield/Chantal Woolcock
+44 20 7457 2020
Notes to editors Sepura is a global leader in the design, manufacture and supply of digital radios, infrastructure and applications for Professional Mobile Radio (“PMR”) users, providing specialist solutions for the public safety, transportation, oil and gas, mining, utilities, industrial and other commercial sectors. Founded in the UK in 2002, Sepura has expanded rapidly across the world and is now a market leader in over 30 countries, with a network of regional partners that sell, and provide local support for, its market-leading products. Headquartered in Cambridge, England and with approximately 700 employees.
3
Overview Trading during the first half of the financial year has been extremely challenging, with reported revenues of €43.3 million, compared to €92.9 million last year. Revenues were expected to be lower than last year following the completion of the substantial one off Saudi Arabian contract in FY16 (which had contributed €23.3 million of revenues in H1/16) and the changes to the Group’s business model announced on 27 June 2016. As announced on 14 September 2016, it became clear that order intake was lower than previously forecast, with a corresponding impact on revenues for both H1 and the full year. This was due to specific challenges facing the Group’s customers in core markets, including delayed refresh cycles and further uncertainty over the Emergency Services Network (“ESN”) in the UK, rather than a deterioration in the Group’s competitive position. These markets are expected to recover over the medium term and in turn support a Group margin recovery to more normal levels. However, the Board has targeted significant cost savings to improve profitability in the short-term while ensuring solid foundations for the Group’s future success. On 15 July 2016, the Group raised €73.7 million after expenses from shareholders. At the same time, the Group reached agreement with its principal lenders to revise the debt facilities put in place for the acquisition of Teltronic SAU. It also undertook a thorough review of the Group’s business model and started to implement changes to increase cash conservation. The three main changes to the business model were improving sales phasing, aligning manufacturing timescales with customer delivery schedules and reducing credit risk profile. While these initiatives will result in a one-off shift of revenue for the current financial year, the Group will benefit from working capital improvement and a better alignment of profitability to cash flows. The Board also undertook a review of its DMR strategy and decided to withdraw from the DMR market. As a result of this and the reduction in the forecast profitability of the Devices segment, the Group has recorded a non-cash €25.5 million impairment charge.
Outlook Trading and the rate of order closure have continued to be slower than expected. However, the strong order backlog at 30 September 2016, together with the pipeline of sales opportunities and the impact of cost reduction activities, is expected to result in improved profitability in H2. The Board now expects revenue for the current financial year to be in the range of €125 million - €135 million, which will have a significant impact on the Group’s results for the current financial year. Looking ahead, FY18 is expected to result in a stronger financial performance, driven by the availability of new products, a strong sales pipeline, further action on cost reduction and more favourable foreign exchange rates.
Possible offer and other strategic options Sepura remains in discussions with Hytera regarding a possible offer for the Group. Due diligence is underway, and a further announcement will be made in due course. There can be no certainty that an offer for the Group will be forthcoming. The latest outlook for the full year means that the Group will require a waiver of some of its covenants from March 2017. The lenders have agreed to defer certain debt repayments, enabling the Group to meet its forecast liquidity requirements for at least the next 12 months. In agreement with the lenders, the new management team is proactively exploring a range of other strategic options, including an accelerated turn-around plan, alternative funding arrangements and a possible sale of certain assets. The outcome for shareholders resulting from a number of those options is currently uncertain.
Board appointments
4
On 24 October 2016, Alan Lovell was appointed Chairman and David Barrass appointed as Interim Chief Executive Officer. Andy Leeser has been appointed as a Non-Executive Director with immediate effect. Andy specialises in turnaround and business recovery and has worked across a number of sectors. There are no other disclosures to be made pursuant to Listing Rule 9.6.13.
Business review
Refresh cycle Over 1.6 million Sepura Devices are in use in over 100 countries. In a number of key markets, especially Scandinavia, customers were expected to refresh their ageing fleets, which are 6-7 years old. It became clear in September that capital budgets were being reallocated to other priorities as robustness of the Group’s products was such that their operational lives were being extended beyond the expected 5-6 years. These customers have not selected alternative suppliers for their fleets and the Group is confident that Sepura devices will be purchased once refresh cycles commence. UK The UK market continues to face significant uncertainty as ESN, the proposed replacement for the UK national public safety TETRA network, faces further delays. The latest roll-out schedule indicates a delay of a further five months, with the first region due to join ESN now expected to go live in the spring of 2018. Several of the Group’s UK customers had been expected to commence purchasing ESN-ready devices later in the financial year, but TETRA and ESN device procurements have been deferred pending more precise information on the timing of transition to ESN. The Group continues to support its UK customers through repair and warranty services, which partially mitigate the impact of these delays on the Group’s results. Germany Sixteen thousand devices were delivered to German public safety customers, compared to 33,000 last year. The initial German TETRA deployment is nearing completion, with future tenders expected to be for lower volume contracts. Whilst the volume of new devices fell, sales of accessories required to support the installed base is increasing as expected. Latin America The Group has not received the delayed orders for Mexican end-users which had been expected to be placed under existing contracts in March. The Group is a subcontractor as part of large and complex installations and the timing of these orders continues to depend on progress with the wider project roll-out and civil works. The prime contractor has indicated that these purchase orders will be placed in the current financial year which would result in revenue being recognised at that point. Order backlog The order backlog at the end of the period increased by €11.2 million to €86.2 million (H1/16: €56.8 million; H2/16: €75.1 million). This includes the Devices order backlog increasing by €14.5 million to €18.1 million (H2/16: €3.6 million), including an order for 19,000 SC20s for a European public safety customer, the majority of which will be delivered in H2. In total €30.4 million of the order backlog is expected to convert to revenue during the remainder of FY17, with the remainder being recognised in future years.
5
Withdrawal from DMR On 27 June 2016 the Board announced that it had undertaken a review of its DMR strategy and concluded that it would not be possible to achieve further market penetration without significant additional investment. It therefore decided in June 2016 to withdraw from the DMR market. The Group is allocating the additional resources released by this action to opportunities which are more immediately revenue and cash generative within the TETRA market, such as the North American region and the transportation sector. As a result of this withdrawal and the reduction in the forecast profitability of the Devices segment, the Group has recorded impairments of €25.5 million against non-current assets in accordance with IAS36 “Impairment of Assets”. Capital structure and financing
On 15 July 2016, the Group raised €73.7 million after expenses from shareholders. At the same time, the Group reached agreement with its principal lenders to revise the debt facilities put in place for the acquisition of Teltronic SAU. The Board also announced a number of measures to improve working capital and enhance cash generation.
Financial review
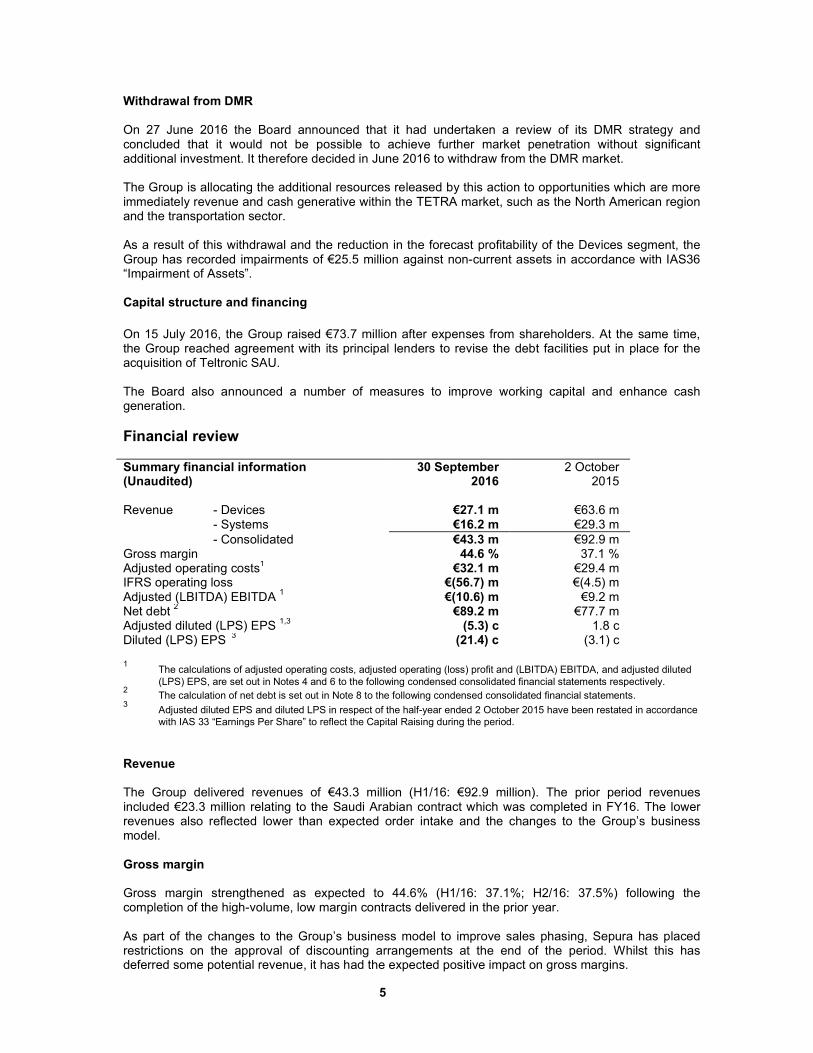
Summary financial information (Unaudited)
30 September 2016
2 October 2015
Revenue - Devices €27.1 m €63.6 m - Systems €16.2 m €29.3 m
- Consolidated €43.3 m €92.9 m Gross margin 44.6 % 37.1 % Adjusted operating costs
1 €32.1 m €29.4 m
IFRS operating loss €(56.7) m €(4.5) m Adjusted (LBITDA) EBITDA
1 €(10.6) m €9.2 m
Net debt 2 €89.2 m €77.7 m
Adjusted diluted (LPS) EPS 1,3 (5.3) c 1.8 c
Diluted (LPS) EPS 3 (21.4) c (3.1) c
1 The calculations of adjusted operating costs, adjusted operating (loss) profit and (LBITDA) EBITDA, and adjusted diluted
(LPS) EPS, are set out in Notes 4 and 6 to the following condensed consolidated financial statements respectively. 2 The calculation of net debt is set out in Note 8 to the following condensed consolidated financial statements.
3 Adjusted diluted EPS and diluted LPS in respect of the half-year ended 2 October 2015 have been restated in accordance
with IAS 33 “Earnings Per Share” to reflect the Capital Raising during the period.
Revenue The Group delivered revenues of €43.3 million (H1/16: €92.9 million). The prior period revenues included €23.3 million relating to the Saudi Arabian contract which was completed in FY16. The lower revenues also reflected lower than expected order intake and the changes to the Group’s business model. Gross margin Gross margin strengthened as expected to 44.6% (H1/16: 37.1%; H2/16: 37.5%) following the completion of the high-volume, low margin contracts delivered in the prior year. As part of the changes to the Group’s business model to improve sales phasing, Sepura has placed restrictions on the approval of discounting arrangements at the end of the period. Whilst this has deferred some potential revenue, it has had the expected positive impact on gross margins.
6
Operating costs Cost saving initiatives have resulted in adjusted operating costs (as calculated in Note 4) reducing by €2.9 million from €35.0 million in H2/16 to €32.1 million (H1/16: €29.4 million). Foreign exchange The Group continues to use forward contracts to sell Euros and buy Sterling to meet Sterling expenses that can be forecast with sufficient certainty as to timing and value to qualify for hedge accounting. This provides certainty as to the future Euro reporting value of these costs to the Group for the next 12 months. The average hedge rate for the period was €1.354 / £1, based on prevailing rates during the prior year, compared to €1.252 / £1 for the same period last year which were in turn based on prevailing rates 12 months previously. The hedges outstanding at the end of the period covered £19.4 million (H1/16: £23.5 million) of forecast Sterling cash flows at rates ranging from €1.170 – €1.372 / £1 (H1/16: €1.243 – €1.422 / £1), and with a weighted average rate of €1.274 / £1 (H1/16: €1.337 / £1) compared to the spot rate at the end of the period of €1.156 / £1 (H1/16: €1.348 / £1). The translation of the Group’s hedged Sterling cost base into Euros in FY18 will therefore result in lower reported Euro costs than those reported for the current year.
Operating profit The Group presents adjusted operating (loss) profit as a key performance measure in addition to the operating profit reported under IFRS. The Group considers that the exclusion of certain non-recurring or non-cash items provides an alternative measure of the underlying trading performance of the Group. The adjusted operating loss was €13.0 million (H1/16: profit €7.3 million), reflecting the considerable reduction in revenue which could not be mitigated by the substantial reduction in the cost base. The operating loss reported under IFRS was €56.7 million (H1/16: €4.5 million), reflecting the non-recurring costs set out below. Non-recurring costs The Group incurred €36.8 million net (H1/16: €13.1 million), before tax, of non-recurring mostly non cash costs, comprising:
� €25.5 million of impairments against non-current assets as a result of the withdrawal from the DMR market and the reduction in forecast profitability of the Devices segment in accordance with IAS36 “Impairment of Assets”;
� €8.3 million of costs associated with the Capital Raising and revised banking arrangements, including €1.2 million of unamortised arrangement fees from the original facility which have been charged to income in accordance with IAS 39 “Financial Instruments: Recognition and Measurement” and €1.3 million of arrangement fees in respect of the revised facilty;
� €3.6 million of redundancy and restructuring costs;
� €0.4 million credit release of contingent consideration following the determination of the final amount payable in respect of the acquisition of Fylde Micro Limited in 2014; and
� €0.2 million of revenue from DMR products The non-recurring costs in the prior period were incurred in connection with the acquisition of Teltronic and subsequent restructuring. Taxation The Group has continued to benefit from enhanced tax relief on qualifying research and development expenditure. Teltronic receives similar benefits on its research activities, which are reflected in deferred tax assets acquired with the business.
7
The income tax charge is based on management’s best estimate of the weighted average annual income tax rate expected for the full year, adjusted for a €3.6 million tax credit in respect of non-recurring costs and a €5.7 million impairment of deferred tax assets associated with carried forward losses following the withdrawal from DMR and the reduction in the forecast profitability of the Devices segment. Earnings per share Adjusted diluted loss per share, based on expensing development costs as they are incurred and excluding non-recurring costs, provisions against receivables in emerging markets, the IFRS 2 share option charge, associated National Insurance and the amortisation of acquired intangibles, was 5.3 € cents (H1/16 restated: profit per share of 1.8 € cents). The IFRS diluted loss per share was 21.4 € cents (H1/16 restated: loss per share 3.1 € cents), reflecting the costs associated with the fund raising and revised banking arrangements and the impairment of goodwill in the current period, and the acquisition of Teltronic and subsequent restructuring in the prior period. Dividends The Group is not declaring an interim dividend. Cash flow and financing Net debt at the end of the period was reduced by €26.3 million to €89.2 million from €115.5 million, primarily as a result of the fund raising which raised €73.7 million after expenses. €13 million of the proceeds were used to repay temporary facilities put in place and €21 million were used to repay other draw-downs under the Group’s Revolving Credit Facility, while the remainder has been used to finance the Group’s trading activities. Closing cash balances increased by €8.4 million to €10.6 million and the Group has sufficient liquidity for its forecast needs. As part of the fund raising the Board announced a number of measures to improve working capital and enhance cash generation. Cash collection from customers, including those in Brazil, improved and trade and other receivables reduced by €10.0 million. Inventories increased by €8.7 million due to the receipt at the end of the period of products required for orders being fulfilled in Q3; the corresponding liabilities had not been settled at the end of period. Trade and other payables decreased by €17.7 million following the settlement of creditor balances overdue at the end of the prior year. Significant non-operating cash flows related to:
� €3.5 million (H1/16: €7.7 million) spent on capitalised development costs;
� €1.8 million as the final payment due in respect of the acquisition of Fylde Micro;
� €1.0 million net (H1/16: €3.6 million) of other capital expenditure; and
� €4.0 million net (H1/16: €2.9 million) of interest and arrangement fees payable to the Group’s lenders.
Principal risks and uncertainties The principal risks and uncertainties facing the Group, in addition to those summarised in the “Possible offer and other strategic options” paragraph above, are as follows:
8
� The risk that alternative products and technologies are developed by the Group’s competitors, which threaten its future profitability.
� The risk that key customers delay issuing tenders, orders or payments, as a result of changes in political and economic conditions, with a consequential impact on the likelihood or timing of revenues and cash flows.
� The risk that macroeconomic pressures impact the credit risk of customers.
� The risk that strong competition may have an adverse impact on pricing and profitability.
� The risk that fluctuations in exchange rates, especially the Euro, give rise to revaluations of assets and liabilities which impact the future profitability of the Group.
� The risk that there is a breach of information security or integrity.
� The risk that the Group’s outsourced manufacturing partners are unable to supply sufficient critical components to meet end-user demand, or that there is a recall of such products due to poor quality products being supplied to the Group.
� The risk that management are unable to integrate acquired businesses effectively.
� The risk that the current uncertainty around the Group’s prospects impacts future contract wins.
9
CONDENSED CONSOLIDATED HALF-YEAR INCOME STATEMENT 30 September 2016
€’000 (Unaudited)
2 October 2015 €’000
(Unaudited, and restated in respect of EPS)
Before non- recurring
items
Non-recurring
items 1
After non- recurring
items
Before non- recurring
items
Non- recurring
items 1
After non-recurring
items
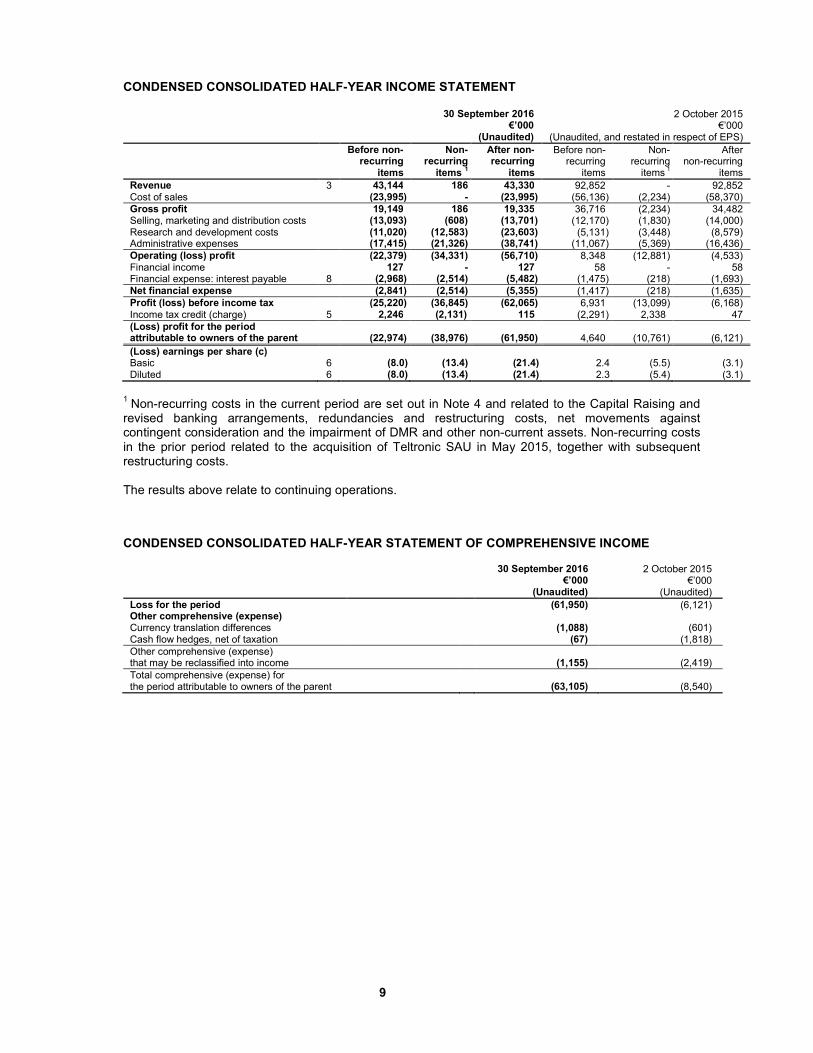
Revenue 3 43,144 186 43,330 92,852 - 92,852 Cost of sales (23,995) - (23,995) (56,136) (2,234) (58,370)
Gross profit 19,149 186 19,335 36,716 (2,234) 34,482 Selling, marketing and distribution costs (13,093) (608) (13,701) (12,170) (1,830) (14,000) Research and development costs (11,020) (12,583) (23,603) (5,131) (3,448) (8,579) Administrative expenses (17,415) (21,326) (38,741) (11,067) (5,369) (16,436)
Operating (loss) profit (22,379) (34,331) (56,710) 8,348 (12,881) (4,533) Financial income 127 - 127 58 - 58 Financial expense: interest payable 8 (2,968) (2,514) (5,482) (1,475) (218) (1,693)
Net financial expense (2,841) (2,514) (5,355) (1,417) (218) (1,635)
Profit (loss) before income tax (25,220) (36,845) (62,065) 6,931 (13,099) (6,168) Income tax credit (charge) 5 2,246 (2,131) 115 (2,291) 2,338 47
(Loss) profit for the period attributable to owners of the parent
(22,974)
(38,976)
(61,950)
4,640
(10,761)
(6,121)
(Loss) earnings per share (c) Basic 6 (8.0) (13.4) (21.4) 2.4 (5.5) (3.1) Diluted 6 (8.0) (13.4) (21.4) 2.3 (5.4) (3.1)
1 Non-recurring costs in the current period are set out in Note 4 and related to the Capital Raising and
revised banking arrangements, redundancies and restructuring costs, net movements against contingent consideration and the impairment of DMR and other non-current assets. Non-recurring costs in the prior period related to the acquisition of Teltronic SAU in May 2015, together with subsequent restructuring costs. The results above relate to continuing operations.
CONDENSED CONSOLIDATED HALF-YEAR STATEMENT OF COMPREHENSIVE INCOME
30 September 2016 €’000
(Unaudited)
2 October 2015 €’000
(Unaudited)
Loss for the period (61,950) (6,121) Other comprehensive (expense) Currency translation differences (1,088) (601) Cash flow hedges, net of taxation (67) (1,818)
Other comprehensive (expense) that may be reclassified into income
(1,155)
(2,419)
Total comprehensive (expense) for the period attributable to owners of the parent
(63,105)
(8,540)
10
CONDENSED CONSOLIDATED HALF-YEAR STATEMENT OF CHANGES IN EQUITY For the half-year ended 30 September 2016 (Unaudited) Share
capital €’000
Share premium
€’000
Other reserves
€’000
Retained earnings
€’000
Total €’000
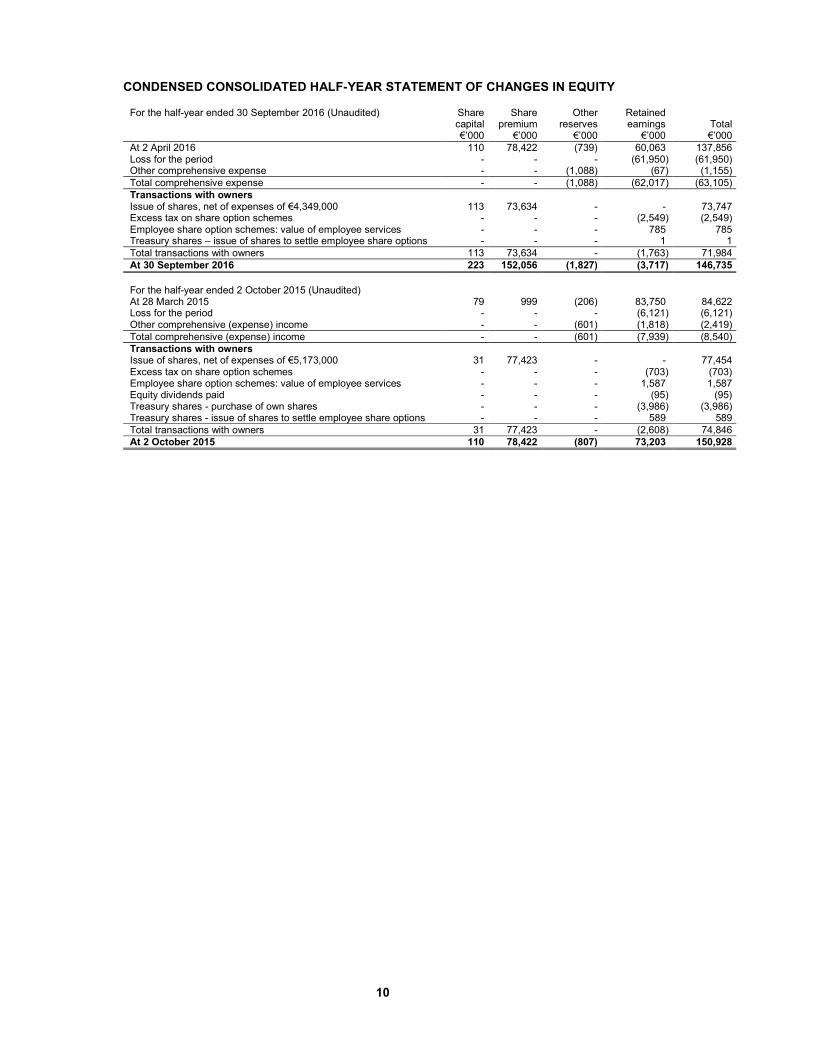
At 2 April 2016 110 78,422 (739) 60,063 137,856 Loss for the period - - - (61,950) (61,950) Other comprehensive expense - - (1,088) (67) (1,155)
Total comprehensive expense - - (1,088) (62,017) (63,105)
Transactions with owners Issue of shares, net of expenses of €4,349,000 113 73,634 - - 73,747 Excess tax on share option schemes - - - (2,549) (2,549) Employee share option schemes: value of employee services - - - 785 785 Treasury shares – issue of shares to settle employee share options - - - 1 1
Total transactions with owners 113 73,634 - (1,763) 71,984
At 30 September 2016 223 152,056 (1,827) (3,717) 146,735
For the half-year ended 2 October 2015 (Unaudited) At 28 March 2015 79 999 (206) 83,750 84,622 Loss for the period - - - (6,121) (6,121) Other comprehensive (expense) income - - (601) (1,818) (2,419)
Total comprehensive (expense) income - - (601) (7,939) (8,540)
Transactions with owners Issue of shares, net of expenses of €5,173,000 31 77,423 - - 77,454 Excess tax on share option schemes - - - (703) (703) Employee share option schemes: value of employee services - - - 1,587 1,587 Equity dividends paid - - - (95) (95) Treasury shares - purchase of own shares - - - (3,986) (3,986) Treasury shares - issue of shares to settle employee share options - - - 589 589
Total transactions with owners 31 77,423 - (2,608) 74,846
At 2 October 2015 110 78,422 (807) 73,203 150,928
11
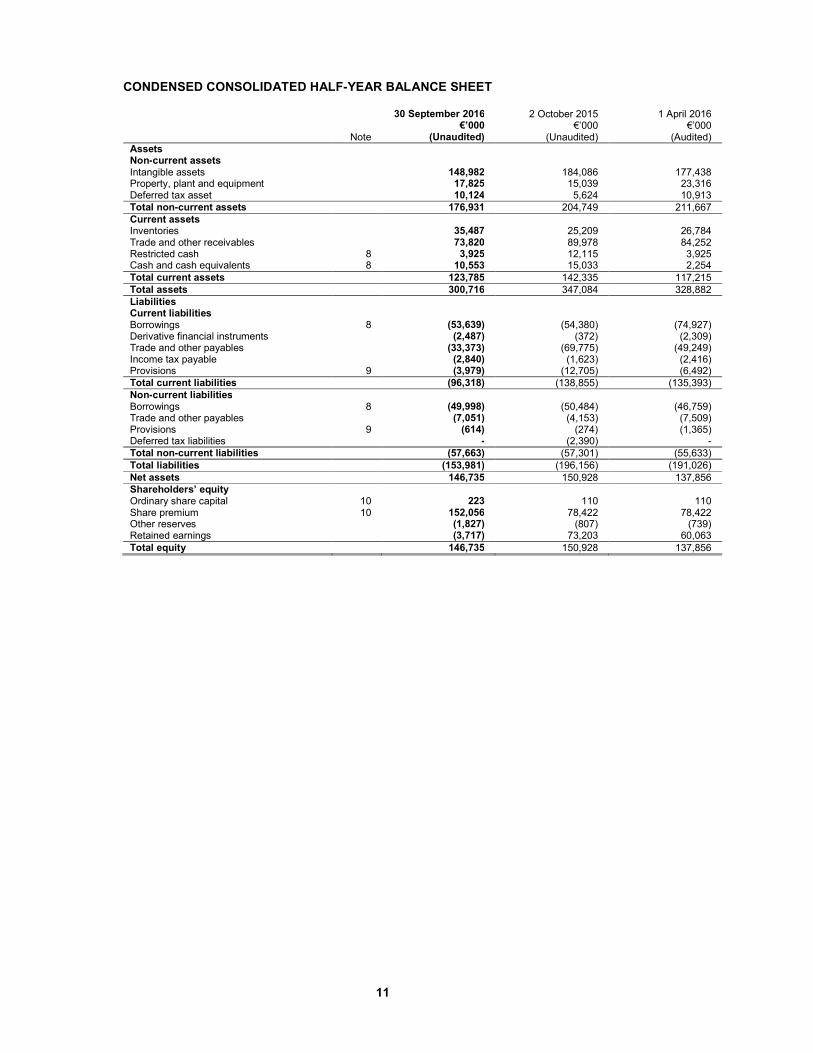
CONDENSED CONSOLIDATED HALF-YEAR BALANCE SHEET
Note
30 September 2016 €’000
(Unaudited)
2 October 2015 €’000
(Unaudited)
1 April 2016 €’000
(Audited)
Assets Non-current assets Intangible assets 148,982 184,086 177,438 Property, plant and equipment 17,825 15,039 23,316 Deferred tax asset 10,124 5,624 10,913
Total non-current assets 176,931 204,749 211,667
Current assets Inventories 35,487 25,209 26,784 Trade and other receivables 73,820 89,978 84,252 Restricted cash 8 3,925 12,115 3,925 Cash and cash equivalents 8 10,553 15,033 2,254
Total current assets 123,785 142,335 117,215
Total assets 300,716 347,084 328,882
Liabilities Current liabilities Borrowings 8 (53,639) (54,380) (74,927) Derivative financial instruments (2,487) (372) (2,309) Trade and other payables (33,373) (69,775) (49,249) Income tax payable (2,840) (1,623) (2,416) Provisions 9 (3,979) (12,705) (6,492)
Total current liabilities (96,318) (138,855) (135,393)
Non-current liabilities Borrowings 8 (49,998) (50,484) (46,759) Trade and other payables (7,051) (4,153) (7,509) Provisions 9 (614) (274) (1,365) Deferred tax liabilities - (2,390) -
Total non-current liabilities (57,663) (57,301) (55,633)
Total liabilities (153,981) (196,156) (191,026)
Net assets 146,735 150,928 137,856
Shareholders’ equity Ordinary share capital 10 223 110 110 Share premium 10 152,056 78,422 78,422 Other reserves (1,827) (807) (739) Retained earnings (3,717) 73,203 60,063
Total equity 146,735 150,928 137,856
12
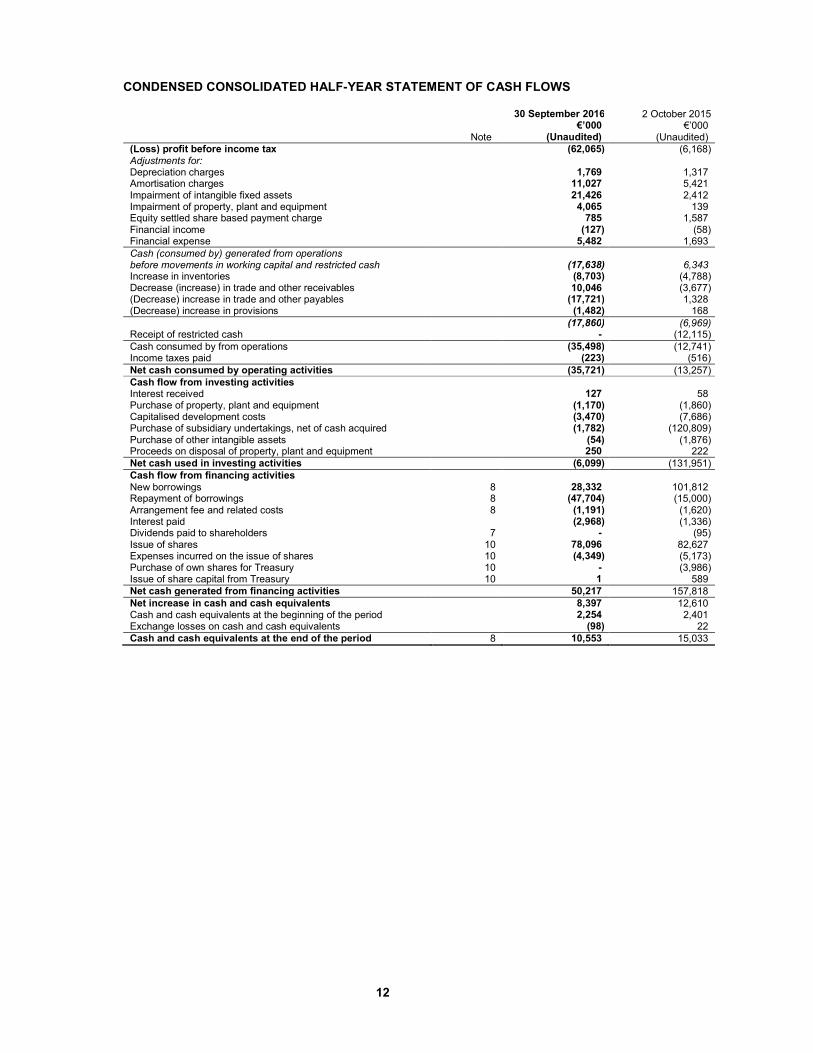
CONDENSED CONSOLIDATED HALF-YEAR STATEMENT OF CASH FLOWS
Note
30 September 2016 €’000
(Unaudited)
2 October 2015 €’000
(Unaudited)
(Loss) profit before income tax (62,065) (6,168) Adjustments for: Depreciation charges 1,769 1,317 Amortisation charges 11,027 5,421 Impairment of intangible fixed assets 21,426 2,412 Impairment of property, plant and equipment 4,065 139 Equity settled share based payment charge 785 1,587 Financial income (127) (58) Financial expense 5,482 1,693
Cash (consumed by) generated from operations before movements in working capital and restricted cash
(17,638)
6,343
Increase in inventories (8,703) (4,788) Decrease (increase) in trade and other receivables 10,046 (3,677) (Decrease) increase in trade and other payables (17,721) 1,328 (Decrease) increase in provisions (1,482) 168
(17,860) (6,969) Receipt of restricted cash - (12,115)
Cash consumed by from operations (35,498) (12,741) Income taxes paid (223) (516)
Net cash consumed by operating activities (35,721) (13,257)
Cash flow from investing activities Interest received 127 58 Purchase of property, plant and equipment (1,170) (1,860) Capitalised development costs (3,470) (7,686) Purchase of subsidiary undertakings, net of cash acquired (1,782) (120,809) Purchase of other intangible assets (54) (1,876) Proceeds on disposal of property, plant and equipment 250 222
Net cash used in investing activities (6,099) (131,951)
Cash flow from financing activities New borrowings 8 28,332 101,812 Repayment of borrowings 8 (47,704) (15,000) Arrangement fee and related costs 8 (1,191) (1,620) Interest paid (2,968) (1,336) Dividends paid to shareholders 7 - (95) Issue of shares 10 78,096 82,627 Expenses incurred on the issue of shares 10 (4,349) (5,173) Purchase of own shares for Treasury 10 - (3,986) Issue of share capital from Treasury 10 1 589
Net cash generated from financing activities 50,217 157,818
Net increase in cash and cash equivalents 8,397 12,610 Cash and cash equivalents at the beginning of the period 2,254 2,401 Exchange losses on cash and cash equivalents (98) 22
Cash and cash equivalents at the end of the period 8 10,553 15,033
13
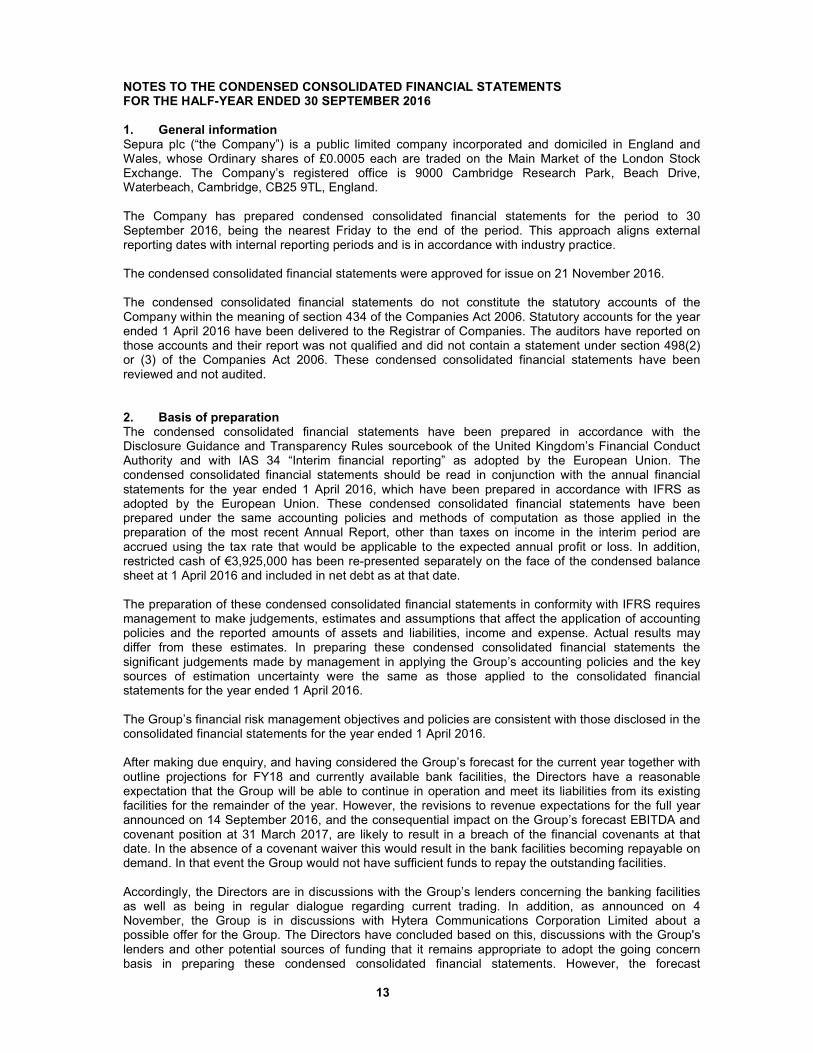
NOTES TO THE CONDENSED CONSOLIDATED FINANCIAL STATEMENTS FOR THE HALF-YEAR ENDED 30 SEPTEMBER 2016 1. General information Sepura plc (“the Company”) is a public limited company incorporated and domiciled in England and Wales, whose Ordinary shares of £0.0005 each are traded on the Main Market of the London Stock Exchange. The Company’s registered office is 9000 Cambridge Research Park, Beach Drive, Waterbeach, Cambridge, CB25 9TL, England. The Company has prepared condensed consolidated financial statements for the period to 30 September 2016, being the nearest Friday to the end of the period. This approach aligns external reporting dates with internal reporting periods and is in accordance with industry practice. The condensed consolidated financial statements were approved for issue on 21 November 2016. The condensed consolidated financial statements do not constitute the statutory accounts of the Company within the meaning of section 434 of the Companies Act 2006. Statutory accounts for the year ended 1 April 2016 have been delivered to the Registrar of Companies. The auditors have reported on those accounts and their report was not qualified and did not contain a statement under section 498(2) or (3) of the Companies Act 2006. These condensed consolidated financial statements have been reviewed and not audited. 2. Basis of preparation The condensed consolidated financial statements have been prepared in accordance with the Disclosure Guidance and Transparency Rules sourcebook of the United Kingdom’s Financial Conduct Authority and with IAS 34 “Interim financial reporting” as adopted by the European Union. The condensed consolidated financial statements should be read in conjunction with the annual financial statements for the year ended 1 April 2016, which have been prepared in accordance with IFRS as adopted by the European Union. These condensed consolidated financial statements have been prepared under the same accounting policies and methods of computation as those applied in the preparation of the most recent Annual Report, other than taxes on income in the interim period are accrued using the tax rate that would be applicable to the expected annual profit or loss. In addition, restricted cash of €3,925,000 has been re-presented separately on the face of the condensed balance sheet at 1 April 2016 and included in net debt as at that date. The preparation of these condensed consolidated financial statements in conformity with IFRS requires management to make judgements, estimates and assumptions that affect the application of accounting policies and the reported amounts of assets and liabilities, income and expense. Actual results may differ from these estimates. In preparing these condensed consolidated financial statements the significant judgements made by management in applying the Group’s accounting policies and the key sources of estimation uncertainty were the same as those applied to the consolidated financial statements for the year ended 1 April 2016. The Group’s financial risk management objectives and policies are consistent with those disclosed in the consolidated financial statements for the year ended 1 April 2016. After making due enquiry, and having considered the Group’s forecast for the current year together with outline projections for FY18 and currently available bank facilities, the Directors have a reasonable expectation that the Group will be able to continue in operation and meet its liabilities from its existing facilities for the remainder of the year. However, the revisions to revenue expectations for the full year announced on 14 September 2016, and the consequential impact on the Group’s forecast EBITDA and covenant position at 31 March 2017, are likely to result in a breach of the financial covenants at that date. In the absence of a covenant waiver this would result in the bank facilities becoming repayable on demand. In that event the Group would not have sufficient funds to repay the outstanding facilities. Accordingly, the Directors are in discussions with the Group’s lenders concerning the banking facilities as well as being in regular dialogue regarding current trading. In addition, as announced on 4 November, the Group is in discussions with Hytera Communications Corporation Limited about a possible offer for the Group. The Directors have concluded based on this, discussions with the Group's lenders and other potential sources of funding that it remains appropriate to adopt the going concern basis in preparing these condensed consolidated financial statements. However, the forecast
14
performance and its potential impact on covenants indicates the existence of a material uncertainty that may cast significant doubt on the Group's ability to continue as a going concern. This consolidated interim financial information does not include the adjustments that would result if the Group was unable to continue as a going concern.
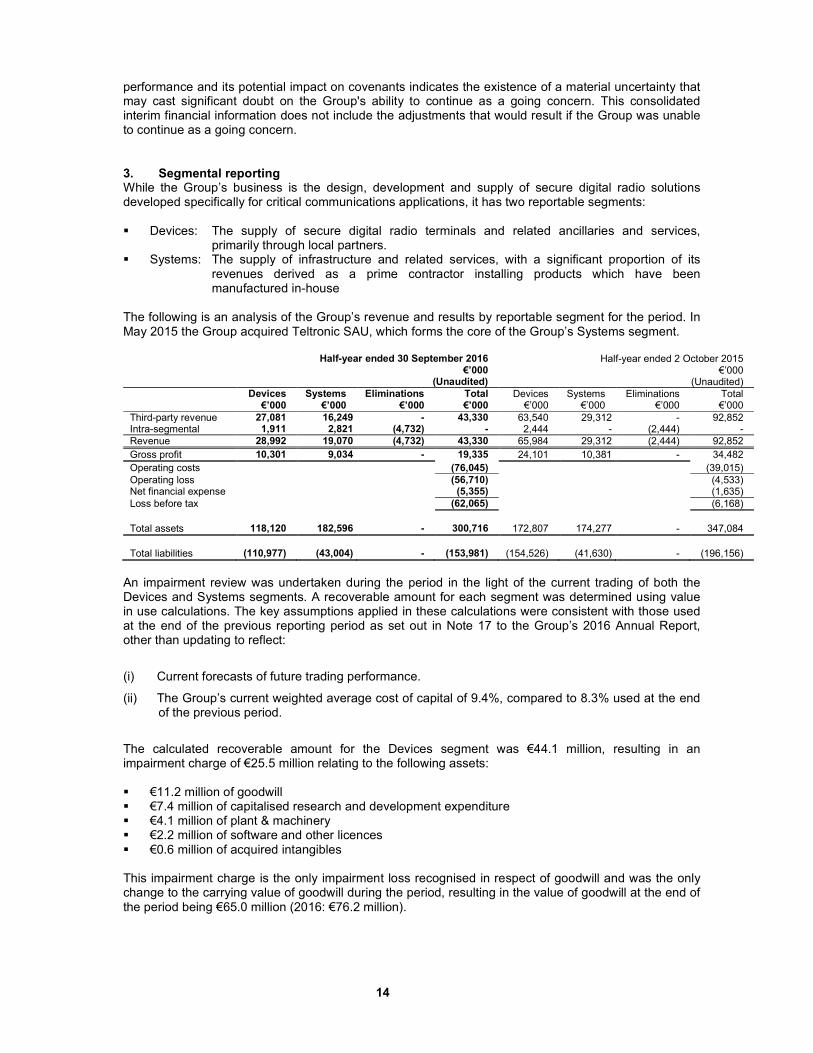
3. Segmental reporting While the Group’s business is the design, development and supply of secure digital radio solutions developed specifically for critical communications applications, it has two reportable segments: � Devices: The supply of secure digital radio terminals and related ancillaries and services,
primarily through local partners. � Systems: The supply of infrastructure and related services, with a significant proportion of its
revenues derived as a prime contractor installing products which have been manufactured in-house
The following is an analysis of the Group’s revenue and results by reportable segment for the period. In May 2015 the Group acquired Teltronic SAU, which forms the core of the Group’s Systems segment.
Half-year ended 30 September 2016 €’000
(Unaudited)
Half-year ended 2 October 2015 €’000
(Unaudited)
Devices €’000
Systems €’000
Eliminations €’000
Total €’000
Devices €’000
Systems €’000
Eliminations €’000
Total €’000
Third-party revenue 27,081 16,249 - 43,330 63,540 29,312 - 92,852 Intra-segmental 1,911 2,821 (4,732) - 2,444 - (2,444) -
Revenue 28,992 19,070 (4,732) 43,330 65,984 29,312 (2,444) 92,852
Gross profit 10,301 9,034 - 19,335 24,101 10,381 - 34,482
Operating costs (76,045) (39,015)
Operating loss (56,710) (4,533) Net financial expense (5,355) (1,635)
Loss before tax (62,065) (6,168)
Total assets 118,120 182,596 - 300,716 172,807 174,277 - 347,084
Total liabilities (110,977) (43,004) - (153,981) (154,526) (41,630) - (196,156)
An impairment review was undertaken during the period in the light of the current trading of both the Devices and Systems segments. A recoverable amount for each segment was determined using value in use calculations. The key assumptions applied in these calculations were consistent with those used at the end of the previous reporting period as set out in Note 17 to the Group’s 2016 Annual Report, other than updating to reflect:
(i) Current forecasts of future trading performance.
(ii) The Group’s current weighted average cost of capital of 9.4%, compared to 8.3% used at the end of the previous period.
The calculated recoverable amount for the Devices segment was €44.1 million, resulting in an impairment charge of €25.5 million relating to the following assets: � €11.2 million of goodwill � €7.4 million of capitalised research and development expenditure � €4.1 million of plant & machinery � €2.2 million of software and other licences � €0.6 million of acquired intangibles This impairment charge is the only impairment loss recognised in respect of goodwill and was the only change to the carrying value of goodwill during the period, resulting in the value of goodwill at the end of the period being €65.0 million (2016: €76.2 million).
15
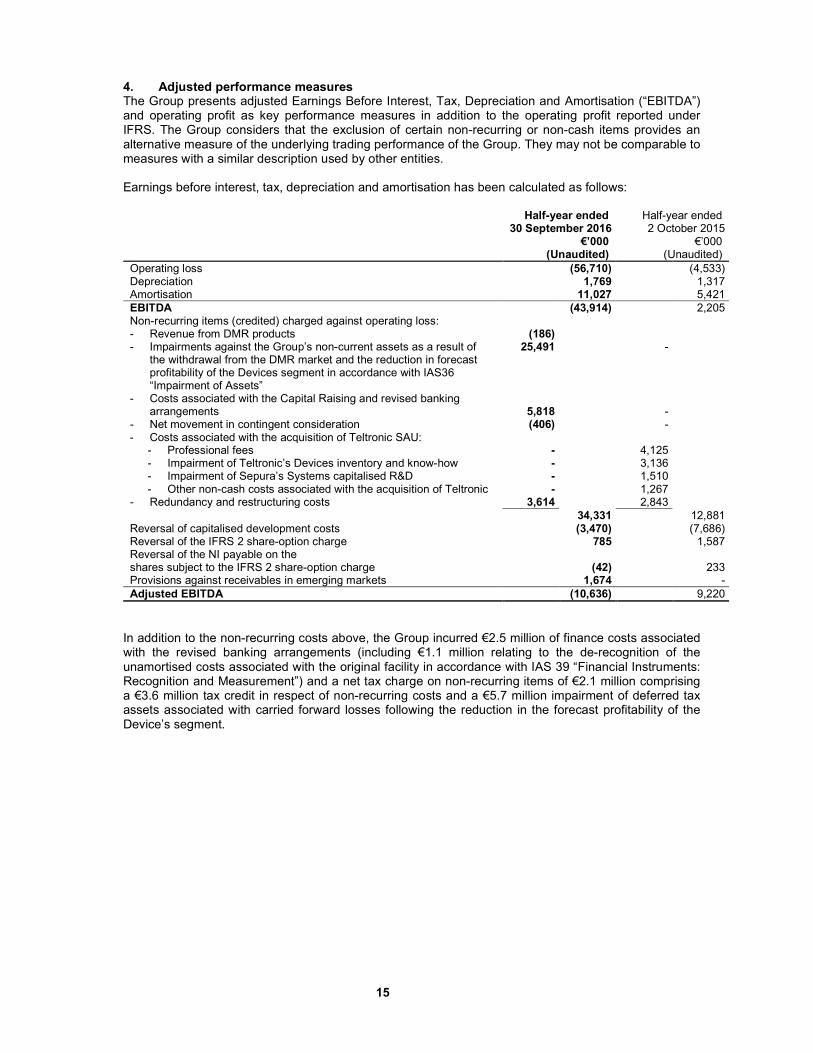
4. Adjusted performance measures The Group presents adjusted Earnings Before Interest, Tax, Depreciation and Amortisation (“EBITDA”) and operating profit as key performance measures in addition to the operating profit reported under IFRS. The Group considers that the exclusion of certain non-recurring or non-cash items provides an alternative measure of the underlying trading performance of the Group. They may not be comparable to measures with a similar description used by other entities. Earnings before interest, tax, depreciation and amortisation has been calculated as follows:
Half-year ended 30 September 2016
€’000 (Unaudited)
Half-year ended 2 October 2015
€’000 (Unaudited)
Operating loss (56,710) (4,533) Depreciation 1,769 1,317 Amortisation 11,027 5,421
EBITDA (43,914) 2,205 Non-recurring items (credited) charged against operating loss: - Revenue from DMR products (186) - Impairments against the Group’s non-current assets as a result of
the withdrawal from the DMR market and the reduction in forecast profitability of the Devices segment in accordance with IAS36 “Impairment of Assets”
25,491 -
- Costs associated with the Capital Raising and revised banking arrangements
5,818
-
- Net movement in contingent consideration (406) - - Costs associated with the acquisition of Teltronic SAU:
- Professional fees - 4,125 - Impairment of Teltronic’s Devices inventory and know-how - 3,136 - Impairment of Sepura’s Systems capitalised R&D - 1,510 - Other non-cash costs associated with the acquisition of Teltronic - 1,267
- Redundancy and restructuring costs 3,614 2,843
34,331 12,881 Reversal of capitalised development costs (3,470) (7,686) Reversal of the IFRS 2 share-option charge 785 1,587 Reversal of the NI payable on the shares subject to the IFRS 2 share-option charge
(42)
233
Provisions against receivables in emerging markets 1,674 -
Adjusted EBITDA (10,636) 9,220
In addition to the non-recurring costs above, the Group incurred €2.5 million of finance costs associated with the revised banking arrangements (including €1.1 million relating to the de-recognition of the unamortised costs associated with the original facility in accordance with IAS 39 “Financial Instruments: Recognition and Measurement”) and a net tax charge on non-recurring items of €2.1 million comprising a €3.6 million tax credit in respect of non-recurring costs and a €5.7 million impairment of deferred tax assets associated with carried forward losses following the reduction in the forecast profitability of the Device’s segment.
16
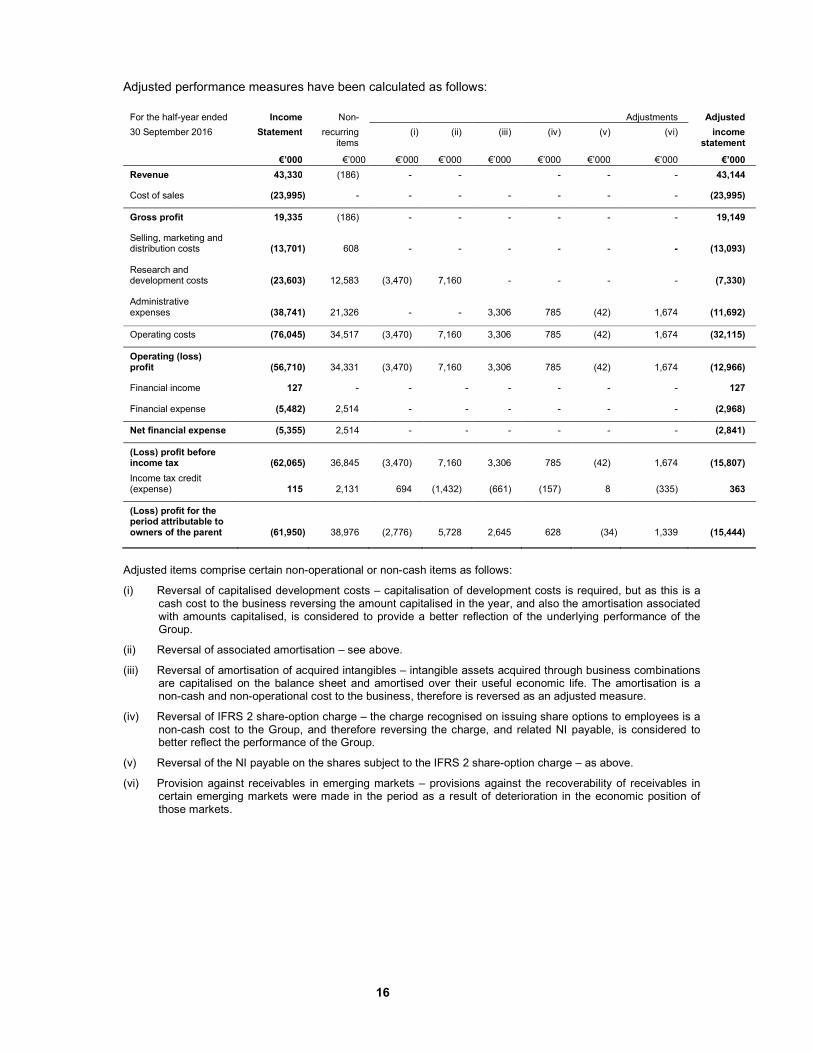
Adjusted performance measures have been calculated as follows:
For the half-year ended Income Non- Adjustments Adjusted
30 September 2016 Statement recurring items
(i) (ii) (iii) (iv) (v) (vi) income statement
€’000 €’000 €’000 €’000 €’000 €’000 €’000 €’000 €’000
Revenue 43,330 (186) - - - - - 43,144
Cost of sales (23,995) - - - - - - - (23,995)
Gross profit 19,335 (186) - - - - - - 19,149
Selling, marketing and distribution costs
(13,701)
608
-
-
-
-
-
-
(13,093)
Research and development costs
(23,603)
12,583
(3,470)
7,160
-
-
-
-
(7,330)
Administrative expenses
(38,741)
21,326
-
-
3,306
785
(42)
1,674
(11,692)
Operating costs (76,045) 34,517 (3,470) 7,160 3,306 785 (42) 1,674 (32,115)
Operating (loss) profit
(56,710)
34,331
(3,470)
7,160
3,306
785
(42)
1,674
(12,966)
Financial income 127 - - - - - - - 127
Financial expense (5,482) 2,514 - - - - - - (2,968)
Net financial expense (5,355) 2,514 - - - - - - (2,841)
(Loss) profit before income tax
(62,065)
36,845
(3,470)
7,160
3,306
785
(42)
1,674
(15,807)
Income tax credit (expense)
115
2,131
694
(1,432)
(661)
(157)
8
(335)
363
(Loss) profit for the period attributable to owners of the parent
(61,950)
38,976
(2,776)
5,728
2,645
628
(34)
1,339
(15,444)
Adjusted items comprise certain non-operational or non-cash items as follows:
(i) Reversal of capitalised development costs – capitalisation of development costs is required, but as this is a cash cost to the business reversing the amount capitalised in the year, and also the amortisation associated with amounts capitalised, is considered to provide a better reflection of the underlying performance of the Group.
(ii) Reversal of associated amortisation – see above.
(iii) Reversal of amortisation of acquired intangibles – intangible assets acquired through business combinations are capitalised on the balance sheet and amortised over their useful economic life. The amortisation is a non-cash and non-operational cost to the business, therefore is reversed as an adjusted measure.
(iv) Reversal of IFRS 2 share-option charge – the charge recognised on issuing share options to employees is a non-cash cost to the Group, and therefore reversing the charge, and related NI payable, is considered to better reflect the performance of the Group.
(v) Reversal of the NI payable on the shares subject to the IFRS 2 share-option charge – as above.
(vi) Provision against receivables in emerging markets – provisions against the recoverability of receivables in certain emerging markets were made in the period as a result of deterioration in the economic position of those markets.
17
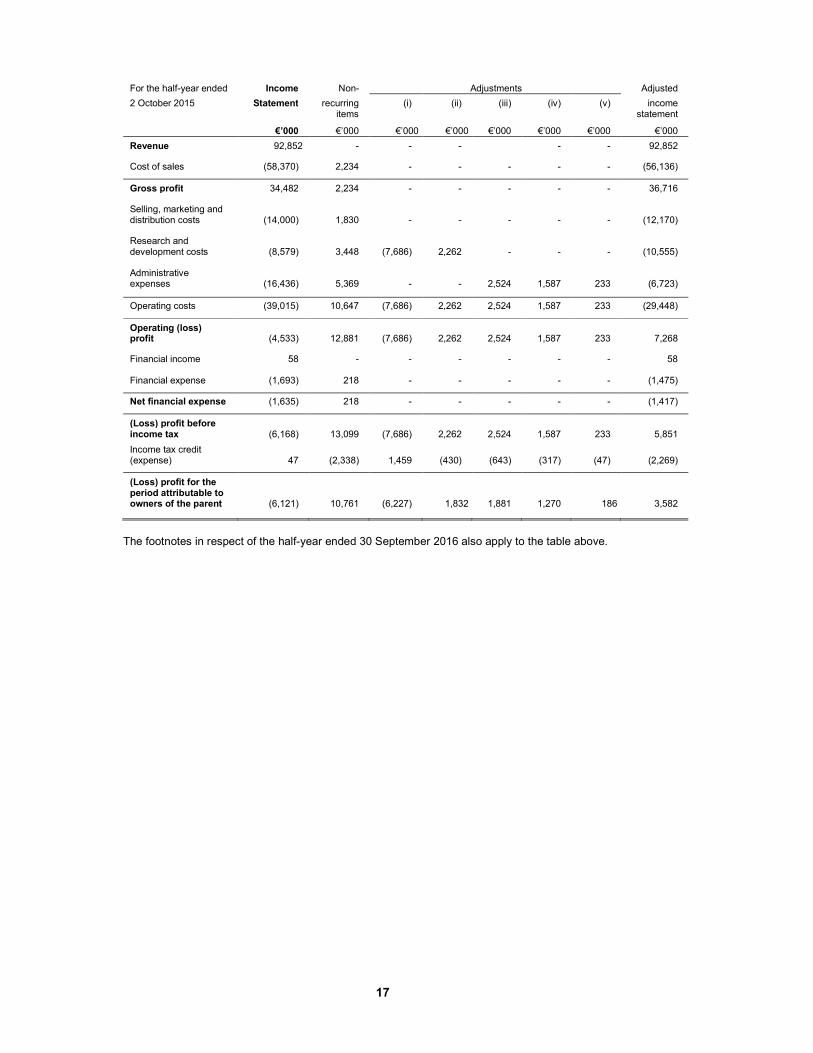
For the half-year ended Income Non- Adjustments Adjusted
2 October 2015 Statement recurring items
(i) (ii) (iii) (iv) (v) income statement
€’000 €’000 €’000 €’000 €’000 €’000 €’000 €’000
Revenue 92,852 - - - - - 92,852
Cost of sales (58,370) 2,234 - - - - - (56,136)
Gross profit 34,482 2,234 - - - - - 36,716
Selling, marketing and distribution costs
(14,000)
1,830
-
-
-
-
-
(12,170)
Research and development costs
(8,579)
3,448
(7,686)
2,262
-
-
-
(10,555)
Administrative expenses
(16,436)
5,369
-
-
2,524
1,587
233
(6,723)
Operating costs (39,015) 10,647 (7,686) 2,262 2,524 1,587 233 (29,448)
Operating (loss) profit
(4,533)
12,881
(7,686)
2,262
2,524
1,587
233
7,268
Financial income 58 - - - - - - 58
Financial expense (1,693) 218 - - - - - (1,475)
Net financial expense (1,635) 218 - - - - - (1,417)
(Loss) profit before income tax
(6,168)
13,099
(7,686)
2,262
2,524
1,587
233
5,851
Income tax credit (expense)
47
(2,338)
1,459
(430)
(643)
(317)
(47)
(2,269)
(Loss) profit for the period attributable to owners of the parent
(6,121)
10,761
(6,227)
1,832
1,881
1,270
186
3,582
The footnotes in respect of the half-year ended 30 September 2016 also apply to the table above.
18
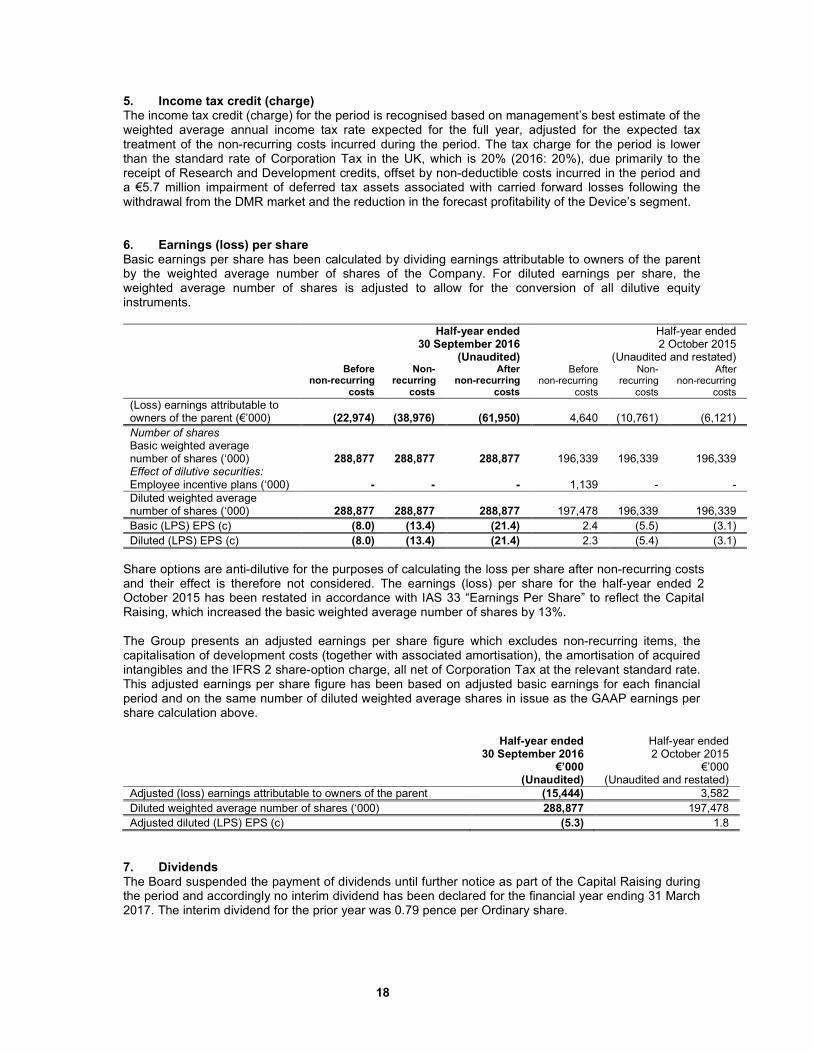
5. Income tax credit (charge) The income tax credit (charge) for the period is recognised based on management’s best estimate of the weighted average annual income tax rate expected for the full year, adjusted for the expected tax treatment of the non-recurring costs incurred during the period. The tax charge for the period is lower than the standard rate of Corporation Tax in the UK, which is 20% (2016: 20%), due primarily to the receipt of Research and Development credits, offset by non-deductible costs incurred in the period and a €5.7 million impairment of deferred tax assets associated with carried forward losses following the withdrawal from the DMR market and the reduction in the forecast profitability of the Device’s segment.
6. Earnings (loss) per share Basic earnings per share has been calculated by dividing earnings attributable to owners of the parent by the weighted average number of shares of the Company. For diluted earnings per share, the weighted average number of shares is adjusted to allow for the conversion of all dilutive equity instruments. Half-year ended
30 September 2016 (Unaudited)
Half-year ended 2 October 2015
(Unaudited and restated) Before
non-recurring costs
Non-recurring
costs
After non-recurring
costs
Before non-recurring
costs
Non- recurring
costs
After non-recurring
costs
(Loss) earnings attributable to owners of the parent (€’000)
(22,974)
(38,976)
(61,950)
4,640
(10,761)
(6,121)
Number of shares Basic weighted average number of shares (‘000)
288,877
288,877
288,877
196,339
196,339
196,339
Effect of dilutive securities: Employee incentive plans (‘000) - - - 1,139 - -
Diluted weighted average number of shares (‘000)
288,877
288,877
288,877
197,478
196,339
196,339
Basic (LPS) EPS (c) (8.0) (13.4) (21.4) 2.4 (5.5) (3.1)
Diluted (LPS) EPS (c) (8.0) (13.4) (21.4) 2.3 (5.4) (3.1)
Share options are anti-dilutive for the purposes of calculating the loss per share after non-recurring costs and their effect is therefore not considered. The earnings (loss) per share for the half-year ended 2 October 2015 has been restated in accordance with IAS 33 “Earnings Per Share” to reflect the Capital Raising, which increased the basic weighted average number of shares by 13%. The Group presents an adjusted earnings per share figure which excludes non-recurring items, the capitalisation of development costs (together with associated amortisation), the amortisation of acquired intangibles and the IFRS 2 share-option charge, all net of Corporation Tax at the relevant standard rate. This adjusted earnings per share figure has been based on adjusted basic earnings for each financial period and on the same number of diluted weighted average shares in issue as the GAAP earnings per share calculation above.
Half-year ended 30 September 2016
€’000 (Unaudited)
Half-year ended 2 October 2015
€’000 (Unaudited and restated)
Adjusted (loss) earnings attributable to owners of the parent (15,444) 3,582
Diluted weighted average number of shares (‘000) 288,877 197,478
Adjusted diluted (LPS) EPS (c) (5.3) 1.8
7. Dividends The Board suspended the payment of dividends until further notice as part of the Capital Raising during the period and accordingly no interim dividend has been declared for the financial year ending 31 March 2017. The interim dividend for the prior year was 0.79 pence per Ordinary share.
19
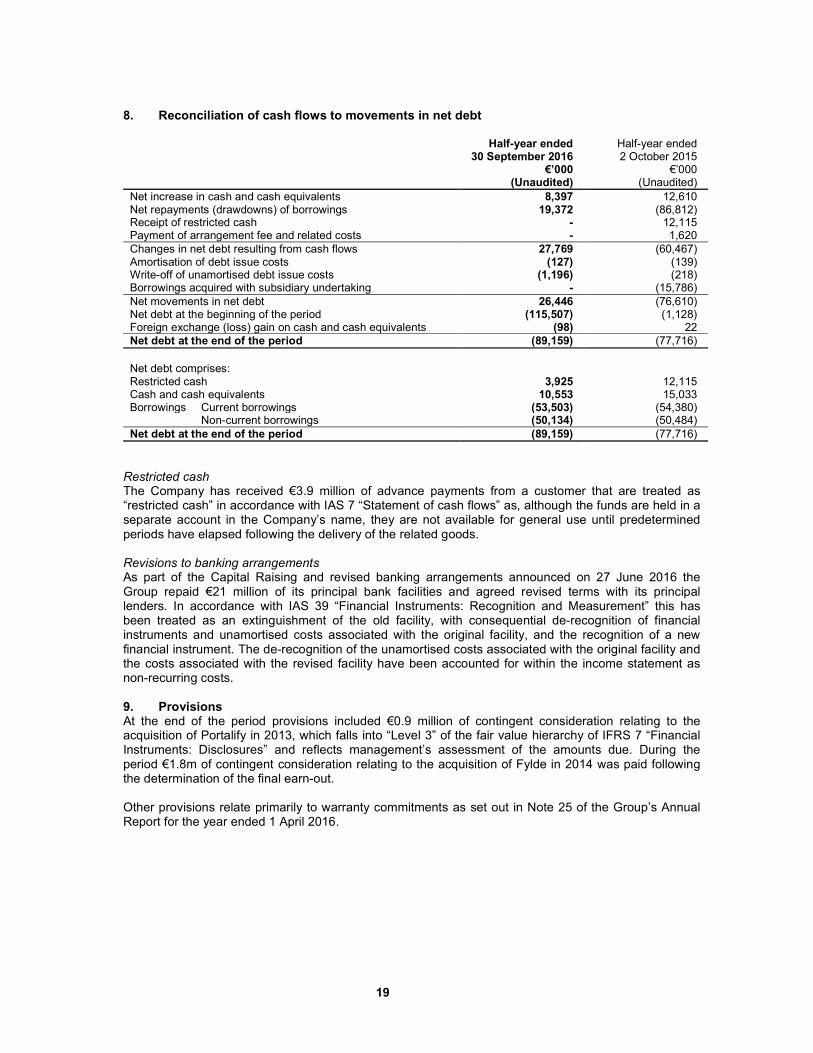
8. Reconciliation of cash flows to movements in net debt
Half-year ended 30 September 2016
€’000 (Unaudited)
Half-year ended 2 October 2015
€’000 (Unaudited)
Net increase in cash and cash equivalents 8,397 12,610 Net repayments (drawdowns) of borrowings 19,372 (86,812) Receipt of restricted cash - 12,115 Payment of arrangement fee and related costs - 1,620
Changes in net debt resulting from cash flows 27,769 (60,467) Amortisation of debt issue costs (127) (139) Write-off of unamortised debt issue costs (1,196) (218) Borrowings acquired with subsidiary undertaking - (15,786)
Net movements in net debt 26,446 (76,610) Net debt at the beginning of the period (115,507) (1,128) Foreign exchange (loss) gain on cash and cash equivalents (98) 22
Net debt at the end of the period (89,159) (77,716)
Net debt comprises: Restricted cash 3,925 12,115 Cash and cash equivalents 10,553 15,033 Borrowings Current borrowings (53,503) (54,380) Non-current borrowings (50,134) (50,484)
Net debt at the end of the period (89,159) (77,716)
Restricted cash The Company has received €3.9 million of advance payments from a customer that are treated as “restricted cash” in accordance with IAS 7 “Statement of cash flows” as, although the funds are held in a separate account in the Company’s name, they are not available for general use until predetermined periods have elapsed following the delivery of the related goods. Revisions to banking arrangements As part of the Capital Raising and revised banking arrangements announced on 27 June 2016 the Group repaid €21 million of its principal bank facilities and agreed revised terms with its principal lenders. In accordance with IAS 39 “Financial Instruments: Recognition and Measurement” this has been treated as an extinguishment of the old facility, with consequential de-recognition of financial instruments and unamortised costs associated with the original facility, and the recognition of a new financial instrument. The de-recognition of the unamortised costs associated with the original facility and the costs associated with the revised facility have been accounted for within the income statement as non-recurring costs. 9. Provisions At the end of the period provisions included €0.9 million of contingent consideration relating to the acquisition of Portalify in 2013, which falls into “Level 3” of the fair value hierarchy of IFRS 7 “Financial Instruments: Disclosures” and reflects management’s assessment of the amounts due. During the period €1.8m of contingent consideration relating to the acquisition of Fylde in 2014 was paid following the determination of the final earn-out. Other provisions relate primarily to warranty commitments as set out in Note 25 of the Group’s Annual Report for the year ended 1 April 2016.
20
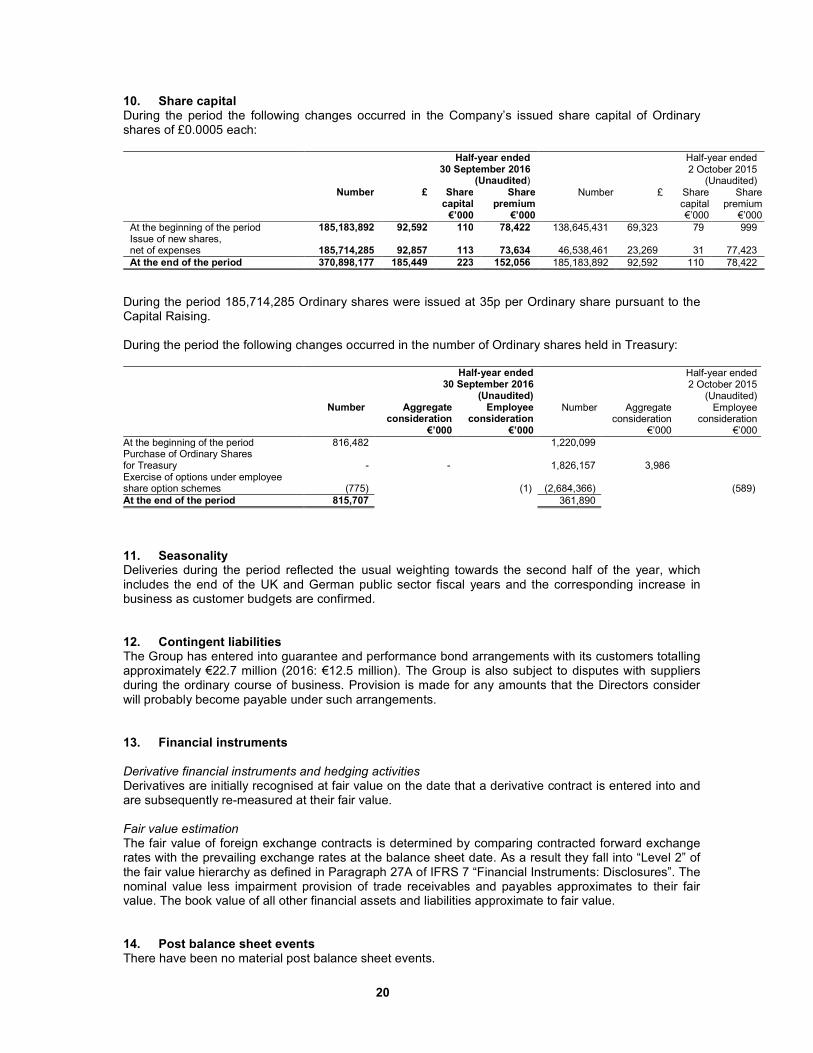
10. Share capital During the period the following changes occurred in the Company’s issued share capital of Ordinary shares of £0.0005 each: Half-year ended
30 September 2016 (Unaudited)
Half-year ended 2 October 2015
(Unaudited) Number £ Share
capital €’000
Share premium
€’000
Number £ Share capital €’000
Share premium
€’000
At the beginning of the period 185,183,892 92,592 110 78,422 138,645,431 69,323 79 999 Issue of new shares, net of expenses
185,714,285
92,857
113
73,634
46,538,461
23,269
31
77,423
At the end of the period 370,898,177 185,449 223 152,056 185,183,892 92,592 110 78,422
During the period 185,714,285 Ordinary shares were issued at 35p per Ordinary share pursuant to the Capital Raising. During the period the following changes occurred in the number of Ordinary shares held in Treasury: Half-year ended
30 September 2016 (Unaudited)
Half-year ended 2 October 2015
(Unaudited) Number Aggregate
consideration €’000
Employee consideration
€’000
Number Aggregate consideration
€’000
Employee consideration
€’000
At the beginning of the period 816,482 1,220,099 Purchase of Ordinary Shares for Treasury
-
-
1,826,157
3,986
Exercise of options under employee share option schemes
(775)
(1)
(2,684,366)
(589)
At the end of the period 815,707 361,890
11. Seasonality Deliveries during the period reflected the usual weighting towards the second half of the year, which includes the end of the UK and German public sector fiscal years and the corresponding increase in business as customer budgets are confirmed. 12. Contingent liabilities The Group has entered into guarantee and performance bond arrangements with its customers totalling approximately €22.7 million (2016: €12.5 million). The Group is also subject to disputes with suppliers during the ordinary course of business. Provision is made for any amounts that the Directors consider will probably become payable under such arrangements. 13. Financial instruments Derivative financial instruments and hedging activities Derivatives are initially recognised at fair value on the date that a derivative contract is entered into and are subsequently re-measured at their fair value. Fair value estimation The fair value of foreign exchange contracts is determined by comparing contracted forward exchange rates with the prevailing exchange rates at the balance sheet date. As a result they fall into “Level 2” of the fair value hierarchy as defined in Paragraph 27A of IFRS 7 “Financial Instruments: Disclosures”. The nominal value less impairment provision of trade receivables and payables approximates to their fair value. The book value of all other financial assets and liabilities approximate to fair value. 14. Post balance sheet events There have been no material post balance sheet events.
21
Statement of Directors’ responsibilities A copy of the condensed consolidated financial statements of the Group is placed on the Company’s website. The Directors are responsible for the maintenance and integrity of information on the Company’s website. Information published on the internet is accessible in many countries with different legal requirements. Legislation in the United Kingdom governing the preparation and dissemination of the financial statements may differ from legislation in other jurisdictions. The Directors confirm that to the best of their knowledge: � This condensed set of consolidated interim financial statements has been prepared in accordance
with IAS 34 as adopted by the European Union;
� The interim management report includes a fair review of the information required by: � DTR 4.2.7R of the Disclosure Guidance and Transparency Rules sourcebook of the United
Kingdom’s Financial Conduct Authority, being an indication of important events that have occurred during the first six months of the financial year and their impact on the condensed set of financial statements; and a description of the principal risks and uncertainties for the remainder of the financial year; and
� DTR 4.2.8R of the Disclosure Guidance and Transparency Rules sourcebook of the United Kingdom’s Financial Conduct Authority, being related party transactions that have taken place in the first six months of the current financial year and that have materially affected the financial position or performance of the entity during that period; and any material changes in the related party transactions described in the last Annual Report.
The Directors of the Group are listed in the Group’s Annual Report for the year ended 2 April 2016, with the exception of Russell King who retired from the Board on 24 October 2016 and Alan Lovell and David Barrass who were appointed to the Board on that date and Andy Leeser who was appointed on 21 November 2016. A list of the current directors is also maintained on the Sepura website: www.sepura.com. By order of the Board, Alan Lovell Chairman 21 November 2016
22
Independent review report to Sepura plc Report on the condensed consolidated interim financial statements Our conclusion We have reviewed Sepura plc's condensed consolidated half-year financial statements (the "interim financial statements") in the interim results of Sepura plc for the six month period ended 30 September 2016. Based on our review, nothing has come to our attention that causes us to believe that the interim financial statements are not prepared, in all material respects, in accordance with International Accounting Standard 34, “Interim Financial Reporting”, as adopted by the European Union and the Disclosure Guidance and Transparency Rules sourcebook of the United Kingdom’s Financial Conduct Authority. Going concern emphasis of matter – material uncertainty In forming our conclusion on the interim financial statements, which is not modified, we have considered the adequacy of the disclosure made in Note 2 to the interim financial statements concerning the Group’s ability to continue as a going concern. The interim financial statements have been prepared on a going concern basis although as described in Note 2 the validity of this depends on the ability of the Group to meet its debt covenants at March 2017, satisfactorily negotiate with its lenders to avoid the withdrawal of the Group's borrowing facilities in the next 12 months from the date of this report or complete the sale of the Group. These matters as explained further in Note 2 to the interim financial statements, indicate the existence of a material uncertainty which may cast significant doubt about the Group’s ability to continue as a going concern. The interim financial statements do not include the adjustments that would result if the Group was unable to continue as a going concern. What we have reviewed The interim financial statements comprise: � the condensed consolidated half-year balance sheet as at 30 September 2016;
� the condensed consolidated half-year income statement and condensed consolidated half-year statement of comprehensive income for the period then ended;
� the condensed consolidated half-year statement of cash flows for the period then ended;
� the condensed consolidated half-year statement of changes in equity for the period then ended; and
� the explanatory notes to the interim financial statements. The interim financial statements included in the interim results have been prepared in accordance with International Accounting Standard 34, ‘Interim Financial Reporting’, as adopted by the European Union and the Disclosure Guidance and Transparency Rules sourcebook of the United Kingdom’s Financial Conduct Authority. As disclosed in Note 1 to the interim financial statements, the financial reporting framework that has been applied in the preparation of the full annual financial statements of the Group is applicable law and International Financial Reporting Standards (IFRSs) as adopted by the European Union. Responsibilities for the interim financial statements and the review Our responsibilities and those of the Directors The interim results, including the interim financial statements, are the responsibility of, and have been approved by, the directors. The directors are responsible for preparing the interim results in accordance with the Disclosure Guidance and Transparency Rules sourcebook of the United Kingdom’s Financial Conduct Authority. Our responsibility is to express to the Company a conclusion on the interim financial statements in the interim results based on our review. This report, including the conclusion, has been prepared for and only for the Company for the purpose of complying with the Disclosure Guidance and Transparency Rules sourcebook of the United Kingdom’s Financial Conduct Authority and for no other purpose. We do not, in giving this conclusion, accept or assume responsibility for any other purpose or to any other person to whom this report is shown or into whose hands it may come save where expressly agreed by our prior consent in writing.
23
What a review of interim financial statements involves We conducted our review in accordance with International Standard on Review Engagements (UK and Ireland) 2410, ‘Review of Interim Financial Information Performed by the Independent Auditor of the Entity’ issued by the Auditing Practices Board for use in the United Kingdom. A review of interim financial information consists of making enquiries, primarily of persons responsible for financial and accounting matters, and applying analytical and other review procedures. A review is substantially less in scope than an audit conducted in accordance with International Standards on Auditing (UK and Ireland) and, consequently, does not enable us to obtain assurance that we would become aware of all significant matters that might be identified in an audit. Accordingly, we do not express an audit opinion. We have read the other information contained in the interim results and considered whether it contains any apparent misstatements or material inconsistencies with the information in the interim financial statements. PricewaterhouseCoopers LLP Chartered Accountants Cambridge 21 November 2016
a) The maintenance and integrity of the Sepura plc website is the responsibility of the directors; the
work carried out by the auditors does not involve consideration of these matters and, accordingly,
the auditors accept no responsibility for any changes that may have occurred to the interim
financial statements since they were initially presented on the website.
b) Legislation in the United Kingdom governing the preparation and dissemination of financial
statements may differ from legislation in other jurisdictions.