Embed Size (px)
Citation preview
2019年5⽉10⽇ソフトバンクグループ株式会社
2019年3⽉期決算投資家向け説明会
v.2.1
This material was prepared based on information available and views held at the time it was made. Statements in this material that are not historical facts, including, without limitation, plans, forecasts and strategies are “forward-lookingstatements”.
Forward-looking statements are by their nature subject to various risks and uncertainties, including, without limitation, a decline in general economic conditions, general market conditions, technological developments, changes in customerdemand for products and services, increased competition, risks associated with international operations, and other important factors, each of which may cause actual results and future developments to differ materially from thoseexpressed or implied in any forward-looking statement.
With the passage of time, information in this material (including, without limitation, forward-looking statements) could be superseded or cease to be accurate. SoftBank Group Corp. disclaims any obligation or responsibility to update,revise or supplement any forward-looking statement or other information in any material or generally to any extent. Use of or reliance on the information in this material is at your own risk. Information contained herein regarding companiesother than SoftBank Group Corp. and other companies of the SoftBank Group is quoted from public sources and others. SoftBank Group Corp. has neither verified nor is responsible for the accuracy of such information.
Any statements made herein regarding Sprint Corporation (“Sprint”) are made by SoftBank solely in its capacity as an investor in Sprint. None of such statements are made on behalf of or attributable to Sprint. Any information containedherein regarding Sprint is subject to any and all subsequent disclosures made by Sprint on its own behalf. Neither Sprint nor SoftBank undertakes any obligation to update the information contained herein in connection with anysubsequent disclosures made by Sprint, or to reflect any other subsequent circumstances or events. Nothing contained herein may be construed as an obligation on the part of Sprint to provide disclosures or guidance on its own behalf.
DISCLAIMER
This confidential presentation (this “Presentation”) is furnished to you for informational purposes solely to provide a summary of SoftBank Group Corp.’s (together with its subsidiaries, “SBG”) financial results, including with respect to the SoftBank VisionFund L.P. (together with, as the context may require, any parallel fund, feeder fund, co-investment vehicle or alternative investment vehicle, the “Vision Fund”) and SB Delta Fund (Jersey) L.P. (together with, as the context may require, any parallel fund, feederfund, co-investment vehicle or alternative investment vehicle, the “Delta Fund”, and together with the Vision Fund, the “Funds”). The Presentation is not complete, is not intended to be relied upon as the basis for any investment decisions and is not an offer tosell or a solicitation of an offer to buy limited partnership or comparable limited liability equity interests in the Funds or any other investment vehicle. The contents of the Presentation are not to be construed as legal, business or tax advice, and each recipientshould consult its own attorney, business advisor and tax advisor as to legal, business and tax advice.
The Presentation speaks as of the date hereof or as otherwise indicated herein. SBG and its respective affiliates, members, partners, stockholders, managers, directors, officers, employees and agents do not have any obligation to update any part of thisPresentation. By accepting this Presentation, the recipient agrees that it will, and will cause its officers, directors, partners, members, shareholders, employees advisors or other similar representatives or agents (“Permitted Representatives”), to use the informationherein only for informational purposes and for no other purpose and will not, and will cause its Permitted Representatives not to, divulge any such information to any other party. None of the Funds, SBG or their respective affiliates makes any representation orwarranty, express or implied, as to the accuracy or completeness of the Presentation and nothing contained herein should be relied upon as a promise or representation as to past or future performance of the Funds or any other company or entity referenced in thisPresentation.
References to any specific investments of the Funds are presented to illustrate the manager of the Funds’ (the “Manager” or “SBIA”) investment process and operating philosophy only and should not be construed as a recommendation of any particularinvestment or security. The investment performance of individual investments in the Funds may vary and the performance of the selected transactions is not necessarily indicative of the performance of all of the applicable prior investments. The specificinvestments identified and described herein do not represent all of the investments made by the Manager, and no assumption should be made that investments identified and discussed herein were or will be profitable.
Certain information contained herein constitutes “forward-looking statements,” which can be identified by the use of terms such as “may”, “will”, “should”, “expect”, “project”, “estimate”, “intend”, “continue”, “target” or “believe” (or the negatives thereof) orother variations thereon or comparable terminology. In particular, this Presentation contains certain information regarding SBG’s expected organization, operations and activities in the future. This information has been set out for illustrative purposes only, anddoes not constitute forecasts. This Presentation has been prepared based on SBG’s current view in relation to future events and various assumptions, including assumptions with respect to events that have not occurred, any of which may prove incorrect. Whilethis Presentation is based on assumptions that SBG believes are reasonable under the circumstances, they are subject to uncertainties, changes (including changes in economic, operational, political, legal, tax and other circumstances) and other risks, including, butnot limited to, broad trends in business and finance, tax and other legislation affecting SBG, all of which are unknowable and beyond SBG’s control and any of which may cause SBG’s organization, operations or activities to be materially different from thosedescribed in this Presentation. Nothing contained in this Presentation may be relied upon as a guarantee, promise or forecast or a representation as to the future.
Vision Fund and Delta Fund performance herein is based on realized and unrealized valuations of portfolio investments. Valuations of unrealized investments are based on assumptions and factors (including, for example, as of the date of the valuation, averagemultiples of comparable companies, and other considerations) that the Manager believes are reasonable under the circumstances relating to each particular investment. However, there can be no assurance that unrealized investments will be realized at thevaluations indicated herein or used to calculate the returns contained herein, and transaction costs connected with such realizations remain unknown and, therefore, are not factored into such calculations. Estimates of unrealized value are subject to numerousvariables that change over time. The actual realized returns on the Funds’ unrealized investments will depend on, among other factors, future operating results, the value of the assets and market conditions at the time of disposition, any related transaction costsand the timing and manner of sale, all of which may differ from the assumptions and circumstances on which the Manager’s valuations are based.
As used throughout, and unless otherwise indicated, “Gross” Equity IRR means the internal rate of return of the interests in the equity trance of the Fund (the “Class A Equity Interests”) before taking into account expenses, management fees, performance feesand Preferred Equity Coupon payments. It is based on a limited partners’ Equity cash outflows (capital contributions) and inflows (distributions), as directly related to investments and net of investment-related financing, as well as the residual value attributable toClass A Equity Interests assuming the disposition of investment-related assets and settlement of investment-related liabilities at the valuations as of January 31, 2019. Each of Gross Equity IRR and Gross Multiples includes the effect of leverage and does not takeinto account deductions of management fees, carried interest, Vision Fund expenses or other expenses, and accrued Preferred Equity Coupon. Net IRR for individual investments cannot be calculated without making arbitrary assumptions regarding the allocationof fees and expenses, which could be significant, and cumulative return does not take into account the impact of fees and expenses.
Past performance is not necessarily indicative of future results. The performance of the Funds may be materially lower than the performance information presented herein. There can be no assurance that the Funds will achieve comparable results as thosepresented herein or that investors in the Funds will not lose any or all of their invested capital.
Certain information presented herein may be based, in part, on information from third parties believed to be reliable and/or assumptions that later prove to be invalid or incorrect. SBG disclaims any obligation to update this information to reflect subsequentdevelopments, reflect a change in assumptions used to prepare this material or for information that later proves to be incorrect.
EACH RECIPIENT ACKNOWLEDGES AND AGREES THAT IT IS RECEIVING THIS PRESENTATION ONLY FOR THE PURPOSES STATED ABOVE AND SUBJECT TO THE UNITED STATES SECURITIES LAWS PROHIBITING ANYPERSON WHO HAS RECEIVED MATERIAL, NON-PUBLIC INFORMATION FROM PURCHASING OR SELLING SECURITIES OF THE APPLICABLE ISSUER OR FROM COMMUNICATING SUCH INFORMATION TO ANY OTHERPERSON UNDER CIRCUMSTANCES IN WHICH IT IS REASONABLY FORESEEABLE THAT SUCH PERSON IS LIKELY TO PURCHASE OR SELL SUCH SECURITIES.
IMPORTANT INFORMATION as it relates to SoftBank Vision Fund and SB Delta Fund
2
3
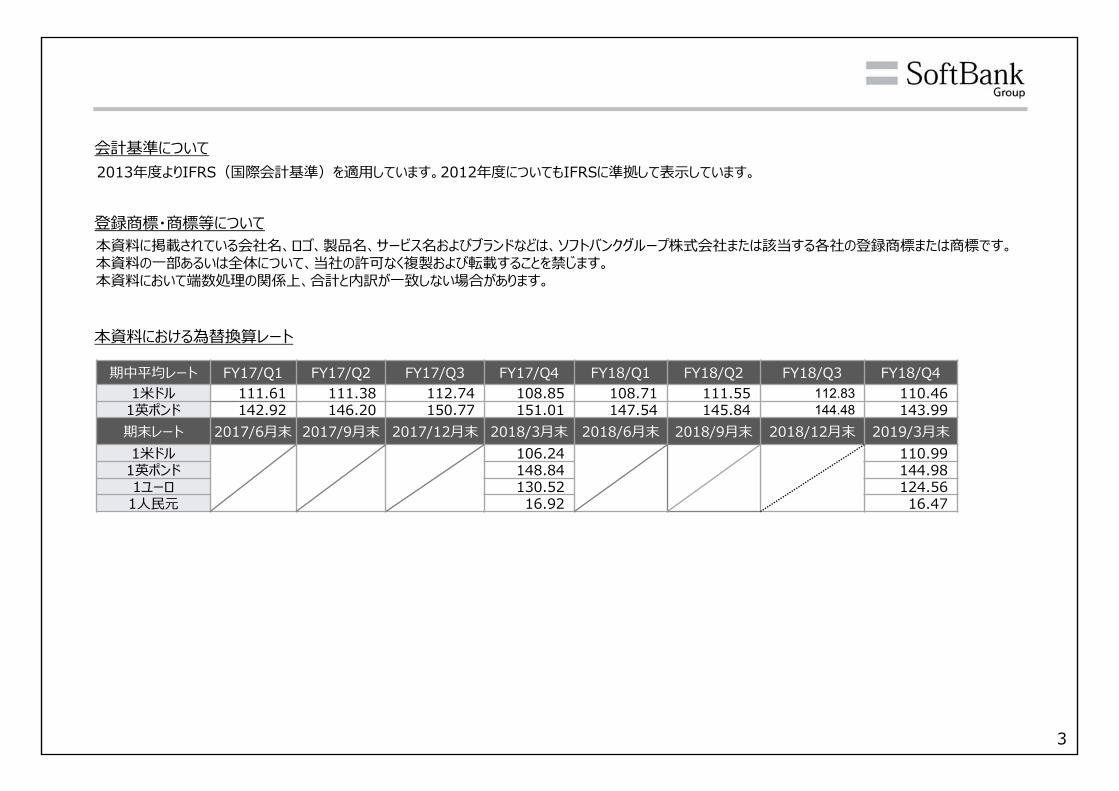
登録商標・商標等について本資料に掲載されている会社名、ロゴ、製品名、サービス名およびブランドなどは、ソフトバンクグループ株式会社または該当する各社の登録商標または商標です。本資料の⼀部あるいは全体について、当社の許可なく複製および転載することを禁じます。本資料において端数処理の関係上、合計と内訳が⼀致しない場合があります。
会計基準について2013年度よりIFRS(国際会計基準)を適⽤しています。2012年度についてもIFRSに準拠して表⽰しています。
本資料における為替換算レート
期中平均レート FY17/Q1 FY17/Q2 FY17/Q3 FY17/Q4 FY18/Q1 FY18/Q2 FY18/Q3 FY18/Q41⽶ドル 111.61 111.38 112.74 108.85 108.71 111.55 112.83 110.46
1英ポンド 142.92 146.20 150.77 151.01 147.54 145.84 144.48 143.99 期末レート 2017/6⽉末 2017/9⽉末 2017/12⽉末 2018/3⽉末 2018/6⽉末 2018/9⽉末 2018/12⽉末 2019/3⽉末1⽶ドル 106.24 110.99
1英ポンド 148.84 144.98 1ユーロ 130.52 124.56 1⼈⺠元 16.92 16.47
4
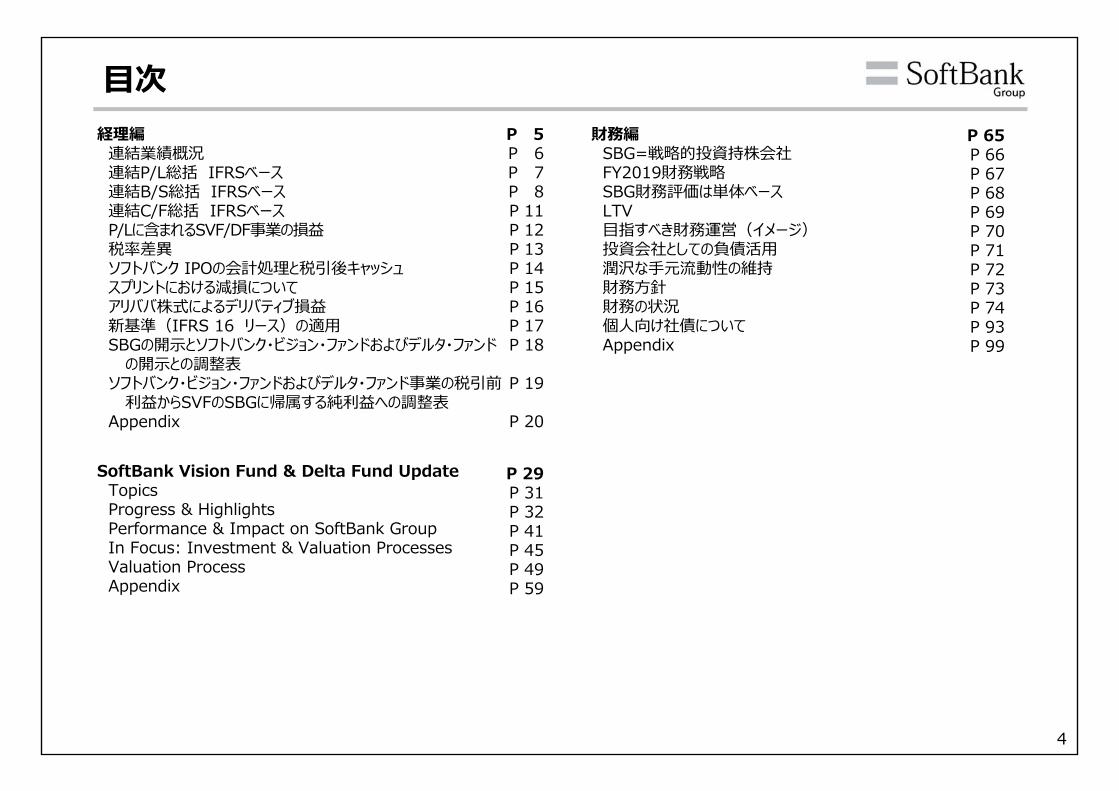
⽬次経理編
連結業績概況連結P/L総括 IFRSベース連結B/S総括 IFRSベース連結C/F総括 IFRSベースP/Lに含まれるSVF/DF事業の損益税率差異ソフトバンク IPOの会計処理と税引後キャッシュスプリントにおける減損についてアリババ株式によるデリバティブ損益新基準(IFRS 16 リース)の適⽤SBGの開⽰とソフトバンク・ビジョン・ファンドおよびデルタ・ファンド
の開⽰との調整表ソフトバンク・ビジョン・ファンドおよびデルタ・ファンド事業の税引前
利益からSVFのSBGに帰属する純利益への調整表Appendix
P 5P 6P 7 P 8P 11 P 12P 13 P 14 P 15P 16P 17P 18
P 19
P 20
SoftBank Vision Fund & Delta Fund UpdateTopicsProgress & HighlightsPerformance & Impact on SoftBank GroupIn Focus: Investment & Valuation ProcessesValuation ProcessAppendix
P 65P 66P 67P 68P 69P 70P 71 P 72 P 73P 74 P 93 P 99
P 29P 31P 32P 41P 45P 49P 59
財務編SBG=戦略的投資持株会社FY2019財務戦略SBG財務評価は単体ベースLTV⽬指すべき財務運営(イメージ)投資会社としての負債活⽤潤沢な⼿元流動性の維持財務⽅針財務の状況個⼈向け社債についてAppendix

5
経理編
6
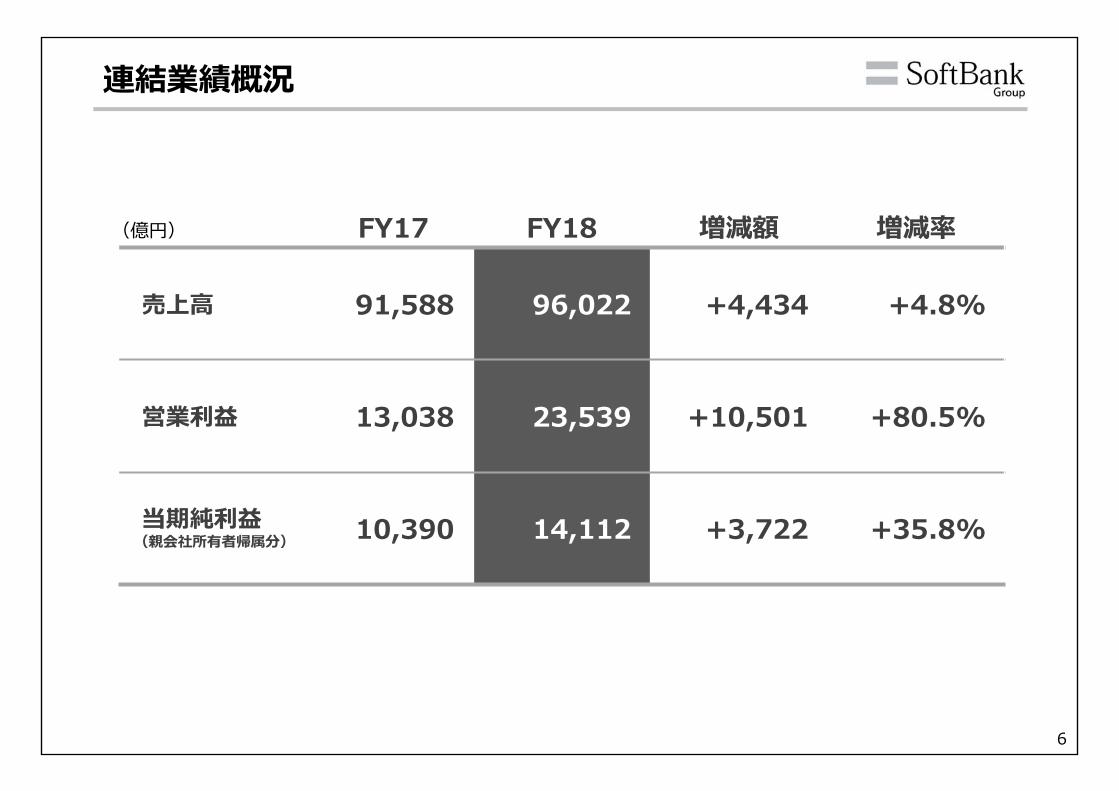
連結業績概況
FY17 FY18 増減額 増減率
売上⾼ 91,588 96,022 +4,434 +4.8%
営業利益 13,038 23,539 +10,501 +80.5%
当期純利益(親会社所有者帰属分) 10,390 14,112 +3,722 +35.8%
(億円)
7
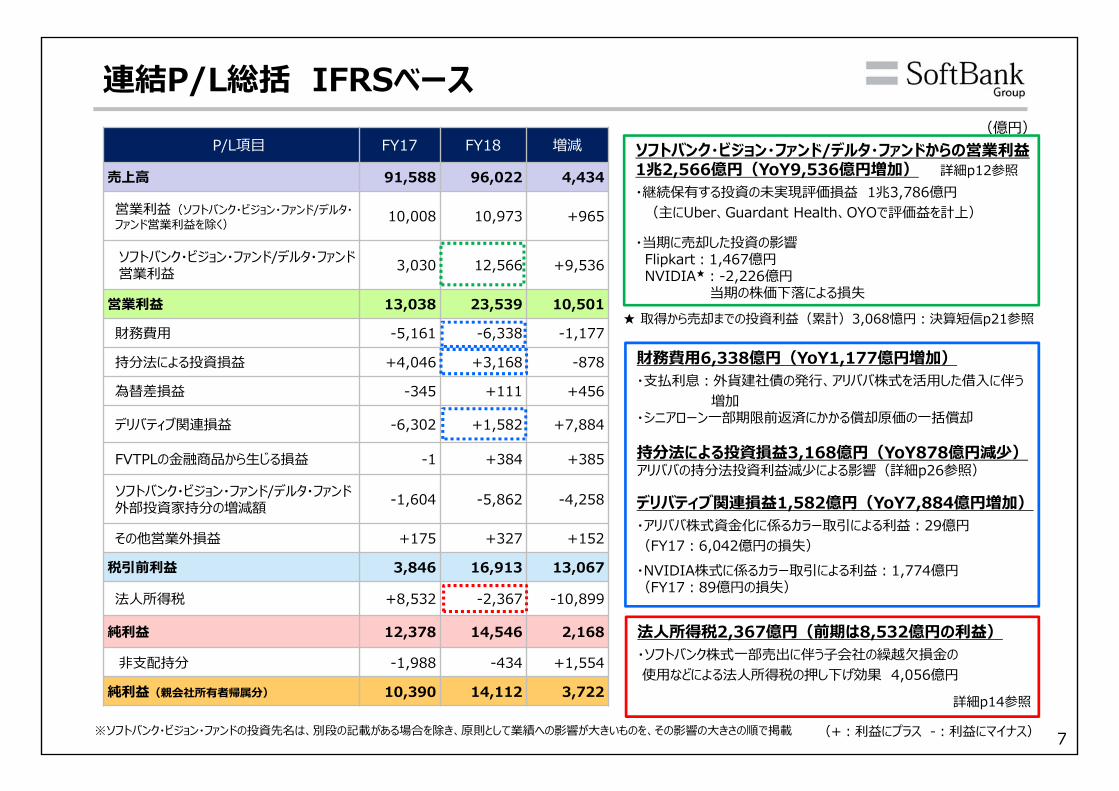
連結P/L総括 IFRSベースP/L項⽬ FY17 FY18 増減
売上⾼ 91,588 96,022 4,434
営業利益(ソフトバンク・ビジョン・ファンド/デルタ・ファンド営業利益を除く) 10,008 10,973 +965
ソフトバンク・ビジョン・ファンド/デルタ・ファンド営業利益 3,030 12,566 +9,536
営業利益 13,038 23,539 10,501
財務費⽤ -5,161 -6,338 -1,177
持分法による投資損益 +4,046 +3,168 -878
為替差損益 -345 +111 +456
デリバティブ関連損益 -6,302 +1,582 +7,884
FVTPLの⾦融商品から⽣じる損益 -1 +384 +385
ソフトバンク・ビジョン・ファンド/デルタ・ファンド外部投資家持分の増減額 -1,604 -5,862 -4,258
その他営業外損益 +175 +327 +152
税引前利益 3,846 16,913 13,067
法⼈所得税 +8,532 -2,367 -10,899
純利益 12,378 14,546 2,168
⾮⽀配持分 -1,988 -434 +1,554
純利益(親会社所有者帰属分) 10,390 14,112 3,722
(億円)
※ソフトバンク・ビジョン・ファンドの投資先名は、別段の記載がある場合を除き、原則として業績への影響が⼤きいものを、その影響の⼤きさの順で掲載
ソフトバンク・ビジョン・ファンド/デルタ・ファンドからの営業利益1兆2,566億円(YoY9,536億円増加) 詳細p12参照・継続保有する投資の未実現評価損益 1兆3,786億円(主にUber、Guardant Health、OYOで評価益を計上)
・当期に売却した投資の影響Flipkart︓1,467億円NVIDIA★︓-2,226億円
当期の株価下落による損失
財務費⽤6,338億円(YoY1,177億円増加)・⽀払利息︓外貨建社債の発⾏、アリババ株式を活⽤した借⼊に伴う
増加・シニアローン⼀部期限前返済にかかる償却原価の⼀括償却
持分法による投資損益3,168億円(YoY878億円減少)アリババの持分法投資利益減少による影響(詳細p26参照)
デリバティブ関連損益1,582億円(YoY7,884億円増加)・アリババ株式資⾦化に係るカラー取引による利益︓29億円(FY17︓6,042億円の損失)・NVIDIA株式に係るカラー取引による利益︓1,774億円(FY17︓89億円の損失)
★ 取得から売却までの投資利益(累計)3,068憶円︓決算短信p21参照
法⼈所得税2,367億円(前期は8,532億円の利益)・ソフトバンク株式⼀部売出に伴う⼦会社の繰越⽋損⾦の使⽤などによる法⼈所得税の押し下げ効果 4,056億円
詳細p14参照
(+︓利益にプラス -︓利益にマイナス)

8
B/S項⽬ 主な科⽬ 2018/
3⽉末2019/3⽉末 増減
流動資産
68,749 77,580 +8,831
現⾦及び現⾦同等物 33,347 38,585 +5,238
その他の流動資産 3,444 7,666 +4,222
売却⽬的保有に分類された資産 - 2,242 +2,242
⾮流動資産
243,056 283,385 +40,329
有形固定資産 38,568 40,707 +2,139
のれん 43,026 43,215 +189
無形資産 67,846 68,922 +1,076
契約獲得コスト - 3,841 +3,841
持分法で会計処理されている投資 23,286 26,410 +3,124
FVTPLで会計処理されているソフトバンク・ビジョン・ファンド/デルタ・ファンドからの投資
28,278 71,156 +42,878
投資有価証券 26,601 9,246 -17,355
その他の⾦融資産 6,764 11,859 +5,095
繰延税⾦資産 6,475 5,869 -606
資産合計 311,805 360,965 +49,160
連結B/S総括 IFRSベース -1(億円)
ソフトバンクグループジャパンからの配当に係る源泉税還付⾒込額の計上(2019年7⽉還付予定)
2019年6⽉に決済予定のアリババ株を持分法投資から振替(決済予定株式の持分法上の簿価)
(参考)(p.16参照)2019年6⽉決済額︓66億⽶ドル引渡し時の上限@USD90.11 × 引渡し予定株数73百万株
ソフトバンク・ビジョン・ファンド/デルタ・ファンドからの投資7兆1,156億円(YoY+4兆2,878億円)・新規投資の増加 339億⽶ドルうち、当社からの売却による取得 198億⽶ドル
・公正価値上昇による投資の増加(Uber、Guardant Health、OYO他)・エグジットによる投資の減少(Flipkart、NVIDIA)
主にWeWorkに対する株式転換権付貸付⾦および同社株の取得に係る前払⾦による増加
アリババ持分法投資利益の計上、Arm China関連会社化
1
1
9
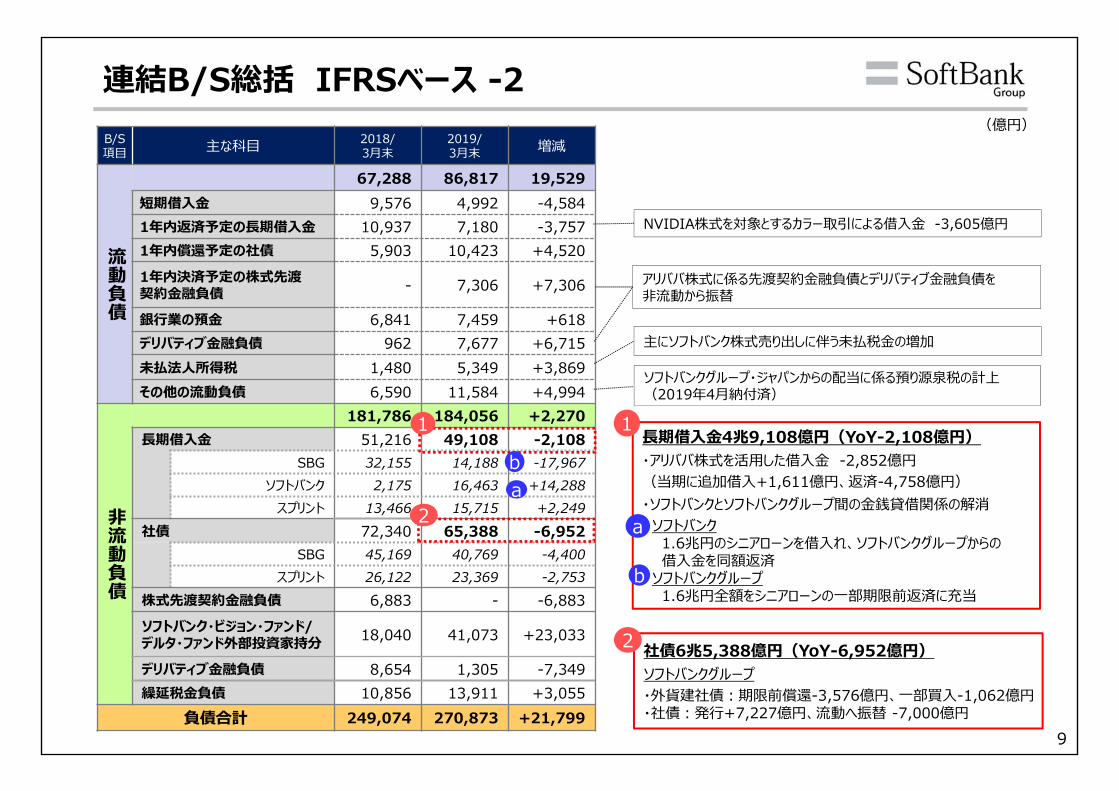
B/S項⽬ 主な科⽬ 2018/
3⽉末2019/3⽉末 増減
流動負債
67,288 86,817 19,529短期借⼊⾦ 9,576 4,992 -4,5841年内返済予定の⻑期借⼊⾦ 10,937 7,180 -3,7571年内償還予定の社債 5,903 10,423 +4,5201年内決済予定の株式先渡契約⾦融負債 - 7,306 +7,306
銀⾏業の預⾦ 6,841 7,459 +618デリバティブ⾦融負債 962 7,677 +6,715未払法⼈所得税 1,480 5,349 +3,869その他の流動負債 6,590 11,584 +4,994
⾮流動負債
181,786 184,056 +2,270⻑期借⼊⾦ 51,216 49,108 -2,108
SBG 32,155 14,188 -17,967ソフトバンク 2,175 16,463 +14,288
スプリント 13,466 15,715 +2,249社債 72,340 65,388 -6,952
SBG 45,169 40,769 -4,400スプリント 26,122 23,369 -2,753
株式先渡契約⾦融負債 6,883 - -6,883ソフトバンク・ビジョン・ファンド/デルタ・ファンド外部投資家持分 18,040 41,073 +23,033
デリバティブ⾦融負債 8,654 1,305 -7,349繰延税⾦負債 10,856 13,911 +3,055
負債合計 249,074 270,873 +21,799
連結B/S総括 IFRSベース -2(億円)
アリババ株式に係る先渡契約⾦融負債とデリバティブ⾦融負債を⾮流動から振替
主にソフトバンク株式売り出しに伴う未払税⾦の増加
⻑期借⼊⾦4兆9,108億円(YoY-2,108億円)・アリババ株式を活⽤した借⼊⾦ -2,852億円(当期に追加借⼊+1,611億円、返済-4,758億円)・ソフトバンクとソフトバンクグループ間の⾦銭貸借関係の解消ソフトバンク1.6兆円のシニアローンを借⼊れ、ソフトバンクグループからの借⼊⾦を同額返済
ソフトバンクグループ1.6兆円全額をシニアローンの⼀部期限前返済に充当
ソフトバンクグループ・ジャパンからの配当に係る預り源泉税の計上(2019年4⽉納付済)
2
1 1
NVIDIA株式を対象とするカラー取引による借⼊⾦ -3,605億円
a
a
b
b
社債6兆5,388億円(YoY-6,952億円)ソフトバンクグループ・外貨建社債︓期限前償還-3,576億円、⼀部買⼊-1,062億円・社債︓発⾏+7,227億円、流動へ振替 -7,000億円
2
10
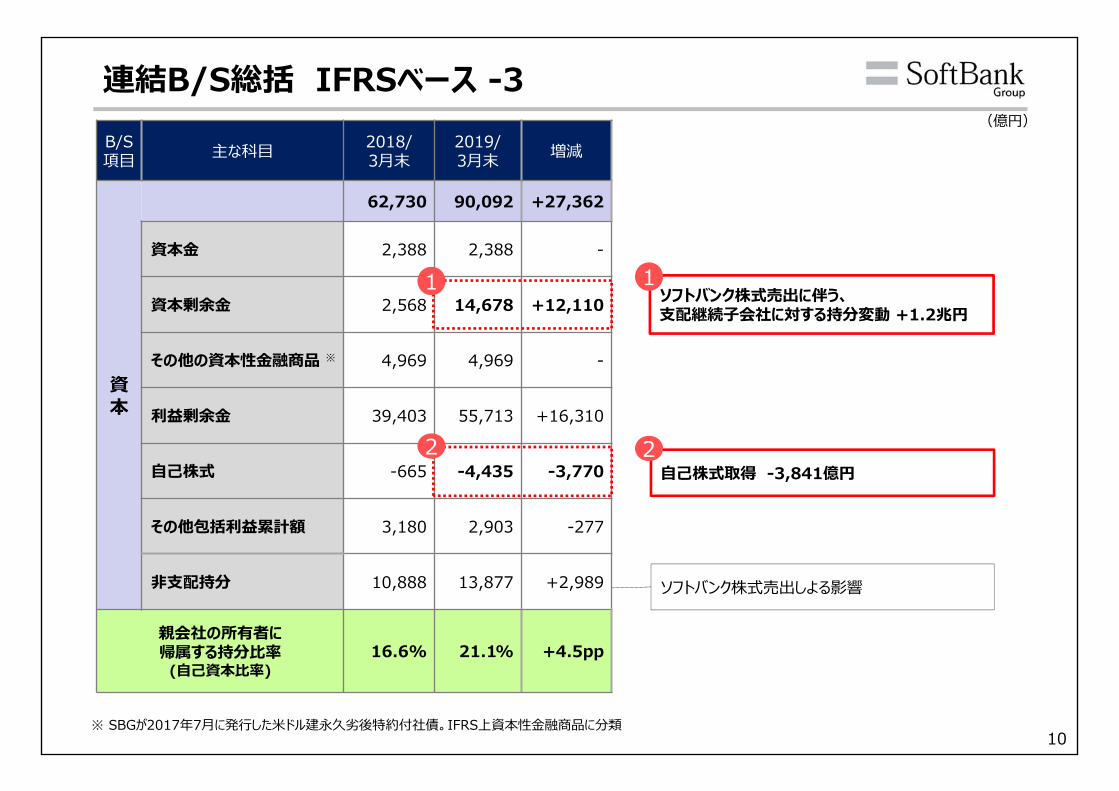
B/S項⽬ 主な科⽬ 2018/
3⽉末2019/3⽉末 増減
資本
62,730 90,092 +27,362
資本⾦ 2,388 2,388 -
資本剰余⾦ 2,568 14,678 +12,110
その他の資本性⾦融商品 ※ 4,969 4,969 -
利益剰余⾦ 39,403 55,713 +16,310
⾃⼰株式 -665 -4,435 -3,770
その他包括利益累計額 3,180 2,903 -277
⾮⽀配持分 10,888 13,877 +2,989
親会社の所有者に帰属する持分⽐率
(⾃⼰資本⽐率)16.6% 21.1% +4.5pp
連結B/S総括 IFRSベース -3(億円)
※ SBGが2017年7⽉に発⾏した⽶ドル建永久劣後特約付社債。IFRS上資本性⾦融商品に分類
ソフトバンク株式売出に伴う、⽀配継続⼦会社に対する持分変動 +1.2兆円
⾃⼰株式取得 -3,841億円
ソフトバンク株式売出しよる影響
1
2 2
1
11
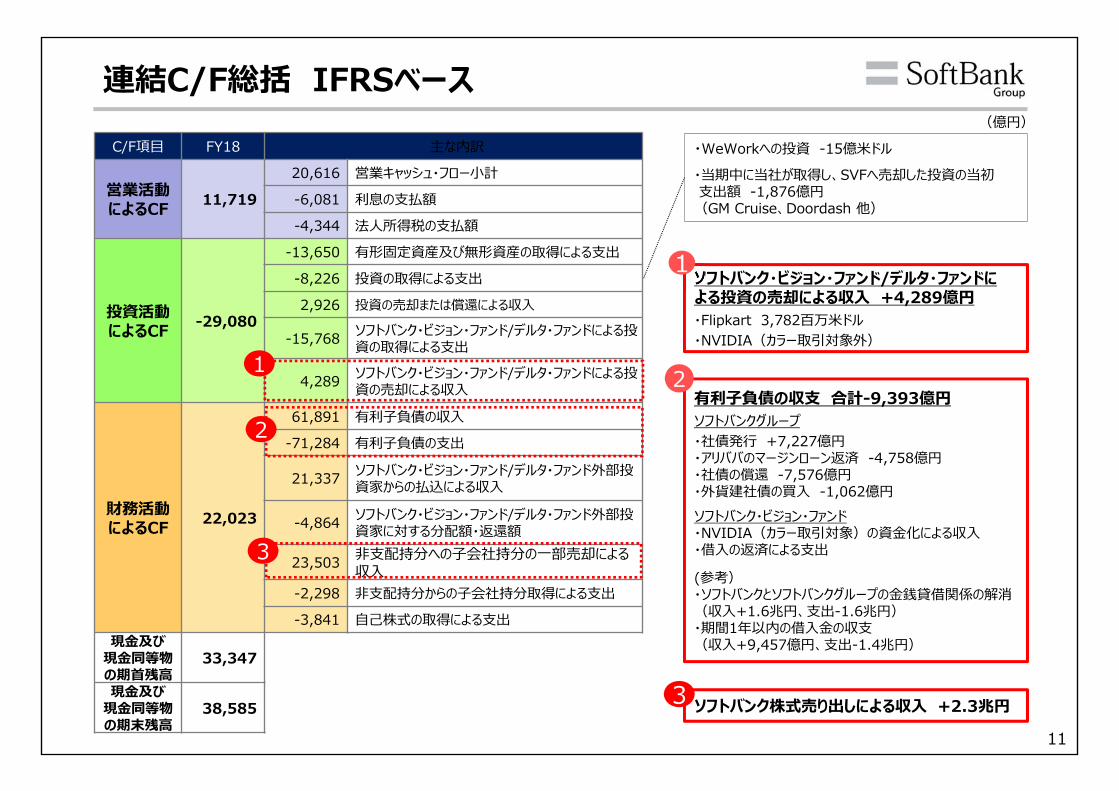
連結C/F総括 IFRSベース(億円)
C/F項⽬ FY18 主な内訳
営業活動によるCF 11,719
20,616 営業キャッシュ・フロー⼩計
-6,081 利息の⽀払額
-4,344 法⼈所得税の⽀払額
投資活動によるCF -29,080
-13,650 有形固定資産及び無形資産の取得による⽀出
-8,226 投資の取得による⽀出
2,926 投資の売却または償還による収⼊
-15,768 ソフトバンク・ビジョン・ファンド/デルタ・ファンドによる投資の取得による⽀出
4,289 ソフトバンク・ビジョン・ファンド/デルタ・ファンドによる投資の売却による収⼊
財務活動によるCF 22,023
61,891 有利⼦負債の収⼊
-71,284 有利⼦負債の⽀出
21,337 ソフトバンク・ビジョン・ファンド/デルタ・ファンド外部投資家からの払込による収⼊
-4,864 ソフトバンク・ビジョン・ファンド/デルタ・ファンド外部投資家に対する分配額・返還額
23,503 ⾮⽀配持分への⼦会社持分の⼀部売却による収⼊
-2,298 ⾮⽀配持分からの⼦会社持分取得による⽀出
-3,841 ⾃⼰株式の取得による⽀出現⾦及び
現⾦同等物の期⾸残⾼
33,347
現⾦及び現⾦同等物の期末残⾼
38,585
・WeWorkへの投資 -15億⽶ドル・当期中に当社が取得し、SVFへ売却した投資の当初⽀出額 -1,876億円
(GM Cruise、Doordash 他)
ソフトバンク・ビジョン・ファンド/デルタ・ファンドによる投資の売却による収⼊ +4,289億円・Flipkart 3,782百万⽶ドル・NVIDIA(カラー取引対象外)
有利⼦負債の収⽀ 合計-9,393億円ソフトバンクグループ・社債発⾏ +7,227億円・アリババのマージンローン返済 -4,758億円・社債の償還 -7,576億円・外貨建社債の買⼊ -1,062億円ソフトバンク・ビジョン・ファンド・NVIDIA(カラー取引対象)の資⾦化による収⼊・借⼊の返済による⽀出
(参考)・ソフトバンクとソフトバンクグループの⾦銭貸借関係の解消(収⼊+1.6兆円、⽀出-1.6兆円)・期間1年以内の借⼊⾦の収⽀(収⼊+9,457億円、⽀出-1.4兆円)
ソフトバンク株式売り出しによる収⼊ +2.3兆円
2
3
3
1
2
12
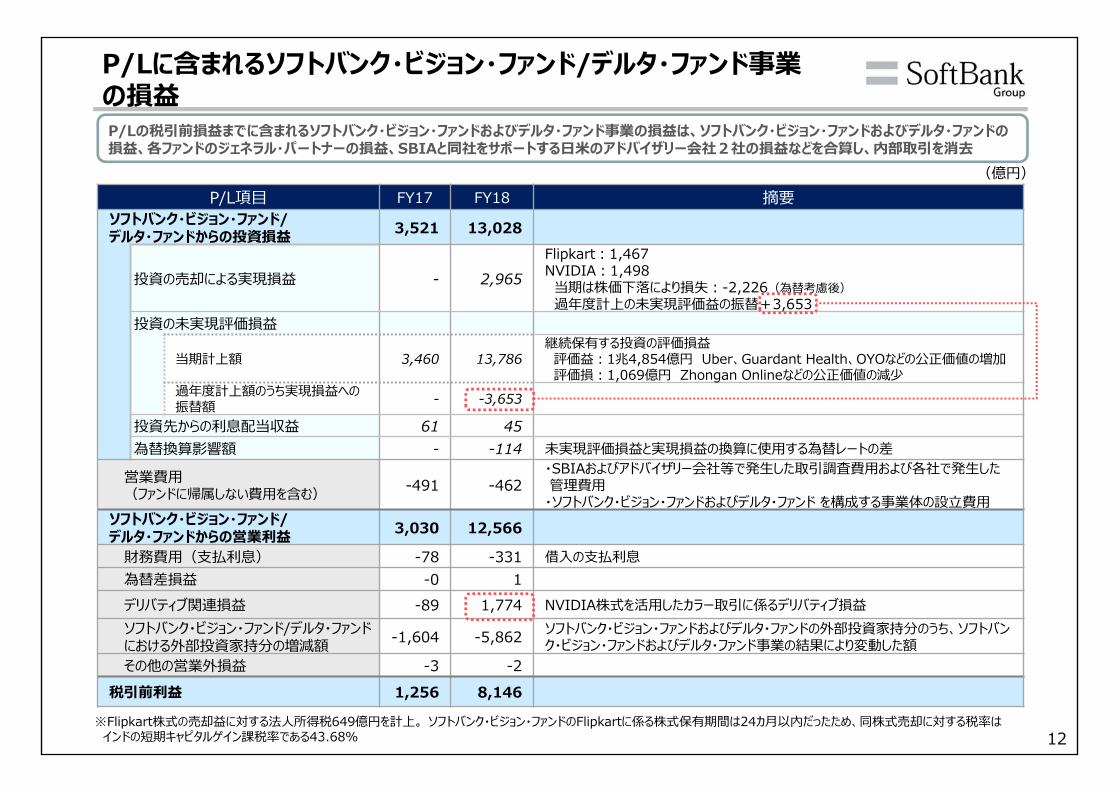
P/L項⽬ FY17 FY18 摘要ソフトバンク・ビジョン・ファンド/デルタ・ファンドからの投資損益 3,521 13,028
投資の売却による実現損益 - 2,965Flipkart︓1,467NVIDIA︓1,498当期は株価下落により損失︓-2,226(為替考慮後)過年度計上の未実現評価益の振替+3,653
投資の未実現評価損益
当期計上額 3,460 13,786継続保有する投資の評価損益評価益︓1兆4,854億円 Uber、Guardant Health、OYOなどの公正価値の増加評価損︓1,069億円 Zhongan Onlineなどの公正価値の減少
過年度計上額のうち実現損益への振替額 - -3,653
投資先からの利息配当収益 61 45為替換算影響額 - -114 未実現評価損益と実現損益の換算に使⽤する為替レートの差
営業費⽤(ファンドに帰属しない費⽤を含む) -491 -462
・SBIAおよびアドバイザリー会社等で発⽣した取引調査費⽤および各社で発⽣した管理費⽤
・ソフトバンク・ビジョン・ファンドおよびデルタ・ファンド を構成する事業体の設⽴費⽤ソフトバンク・ビジョン・ファンド/デルタ・ファンドからの営業利益 3,030 12,566
財務費⽤(⽀払利息) -78 -331 借⼊の⽀払利息為替差損益 -0 1デリバティブ関連損益 -89 1,774 NVIDIA株式を活⽤したカラー取引に係るデリバティブ損益ソフトバンク・ビジョン・ファンド/デルタ・ファンドにおける外部投資家持分の増減額 -1,604 -5,862 ソフトバンク・ビジョン・ファンドおよびデルタ・ファンドの外部投資家持分のうち、ソフトバン
ク・ビジョン・ファンドおよびデルタ・ファンド事業の結果により変動した額その他の営業外損益 -3 -2
税引前利益 1,256 8,146
(億円)
P/Lの税引前損益までに含まれるソフトバンク・ビジョン・ファンドおよびデルタ・ファンド事業の損益は、ソフトバンク・ビジョン・ファンドおよびデルタ・ファンドの損益、各ファンドのジェネラル・パートナーの損益、SBIAと同社をサポートする⽇⽶のアドバイザリー会社2社の損益などを合算し、内部取引を消去
P/Lに含まれるソフトバンク・ビジョン・ファンド/デルタ・ファンド事業の損益
※Flipkart株式の売却益に対する法⼈所得税649億円を計上。 ソフトバンク・ビジョン・ファンドのFlipkartに係る株式保有期間は24カ⽉以内だったため、同株式売却に対する税率はインドの短期キャピタルゲイン課税率である43.68%
13
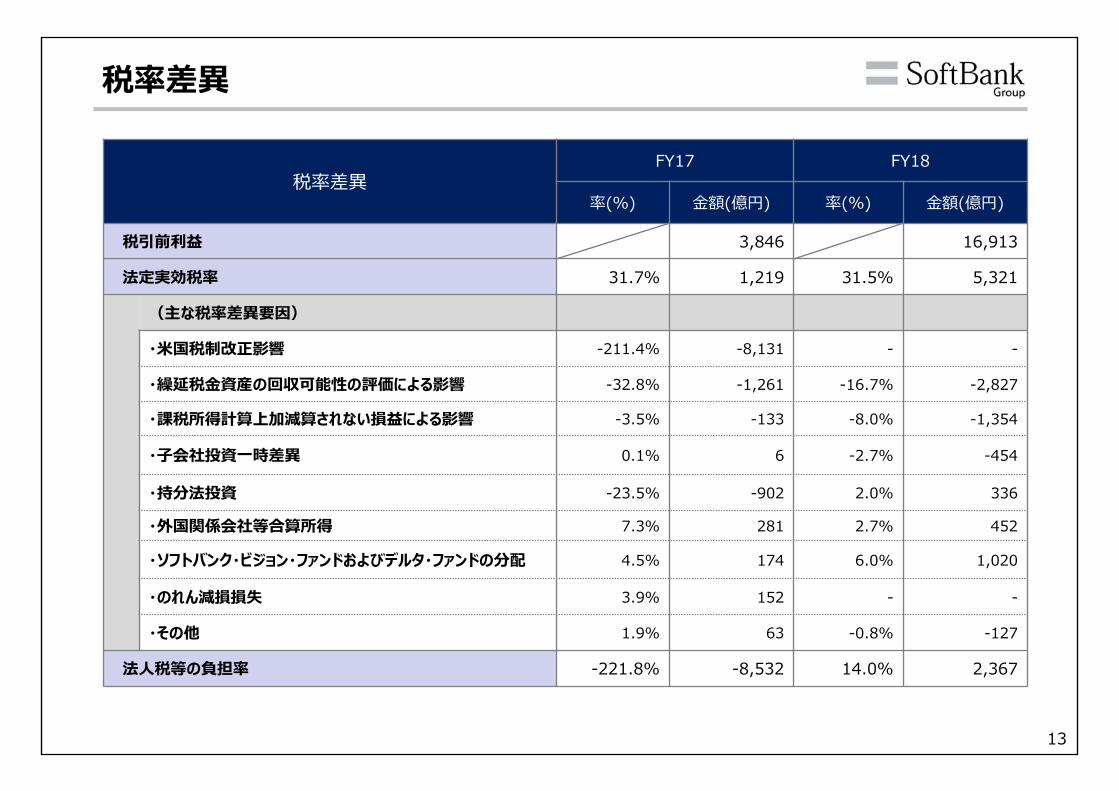
税率差異FY17 FY18
率(%) ⾦額(億円) 率(%) ⾦額(億円)
税引前利益 3,846 16,913
法定実効税率 31.7% 1,219 31.5% 5,321
(主な税率差異要因)
・⽶国税制改正影響 -211.4% -8,131 - -
・繰延税⾦資産の回収可能性の評価による影響 -32.8% -1,261 -16.7% -2,827
・課税所得計算上加減算されない損益による影響 -3.5% -133 -8.0% -1,354
・⼦会社投資⼀時差異 0.1% 6 -2.7% -454
・持分法投資 -23.5% -902 2.0% 336
・外国関係会社等合算所得 7.3% 281 2.7% 452
・ソフトバンク・ビジョン・ファンドおよびデルタ・ファンドの分配 4.5% 174 6.0% 1,020
・のれん減損損失 3.9% 152 - -
・その他 1.9% 63 -0.8% -127
法⼈税等の負担率 -221.8% -8,532 14.0% 2,367
税率差異
14
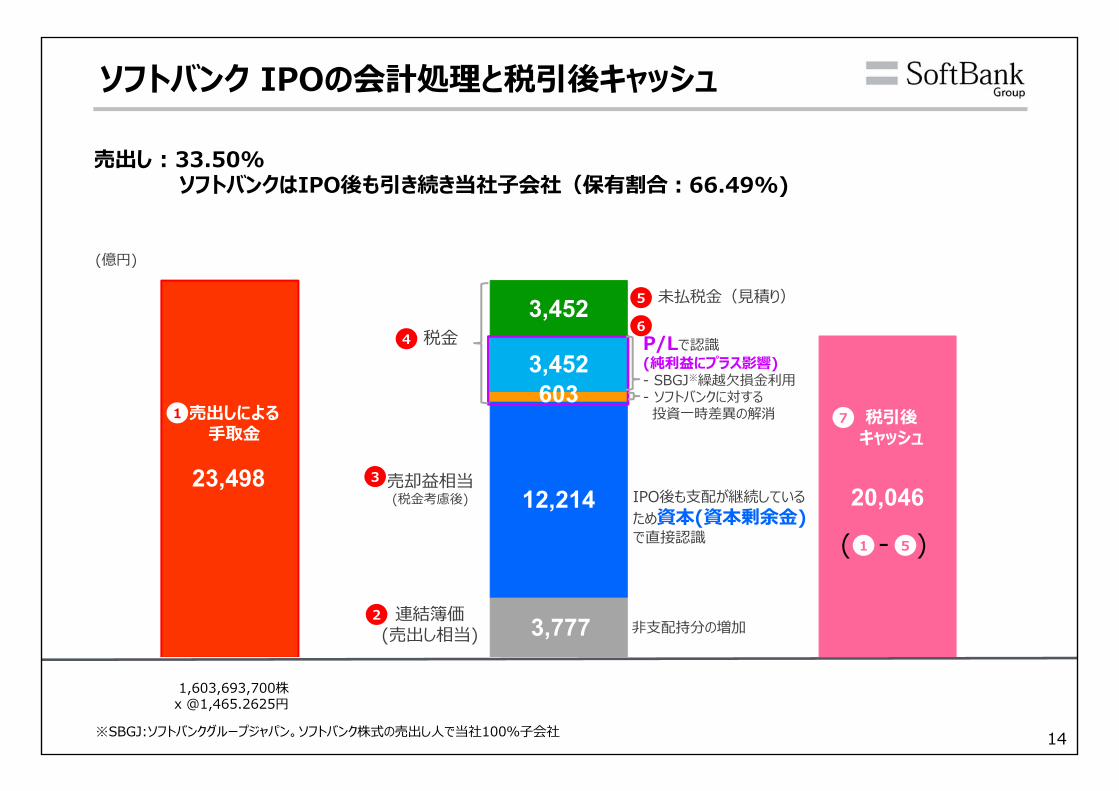
23,498
3,777
20,046 12,214
603 3,452
3,452
(億円)
1
2
4
3
5
売出し : 33.50% ソフトバンクはIPO後も引き続き当社⼦会社(保有割合︓66.49%)
ソフトバンク IPOの会計処理と税引後キャッシュ
売出しによる⼿取⾦
連結簿価(売出し相当) ⾮⽀配持分の増加
税⾦
売却益相当(税⾦考慮後) IPO後も⽀配が継続している
ため資本(資本剰余⾦)で直接認識
未払税⾦(⾒積り)
7 税引後キャッシュ
( - )1 5
1,603,693,700株x @1,465.2625円
6
※SBGJ:ソフトバンクグループジャパン。ソフトバンク株式の売出し⼈で当社100%⼦会社
P/Lで認識(純利益にプラス影響)- SBGJ※繰越⽋損⾦利⽤- ソフトバンクに対する投資⼀時差異の解消
15
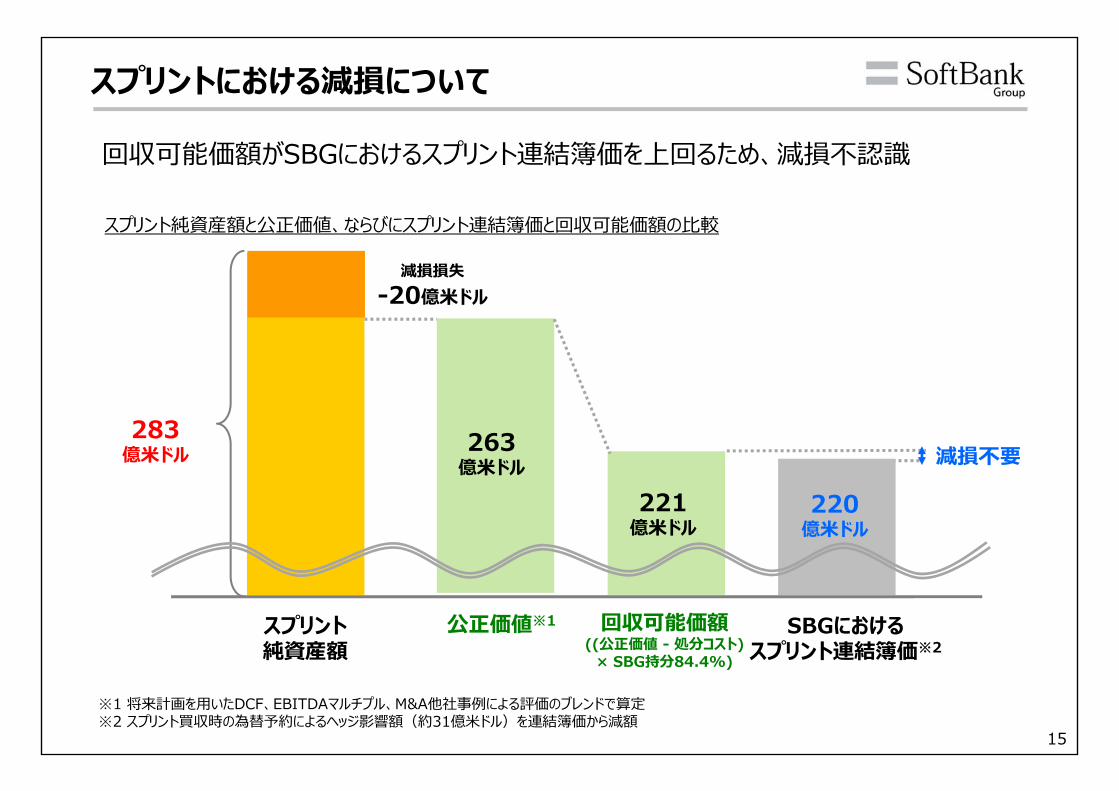
スプリントにおける減損について
スプリント純資産額
283億⽶ドル
SBGにおけるスプリント連結簿価※2
220億⽶ドル
回収可能価額がSBGにおけるスプリント連結簿価を上回るため、減損不認識
公正価値※1
263億⽶ドル 減損不要
221億⽶ドル
※1 将来計画を⽤いたDCF、EBITDAマルチプル、M&A他社事例による評価のブレンドで算定※2 スプリント買収時の為替予約によるヘッジ影響額(約31億⽶ドル)を連結簿価から減額
スプリント純資産額と公正価値、ならびにスプリント連結簿価と回収可能価額の⽐較
回収可能価額((公正価値 - 処分コスト)
× SBG持分84.4%)
減損損失-20億⽶ドル
16
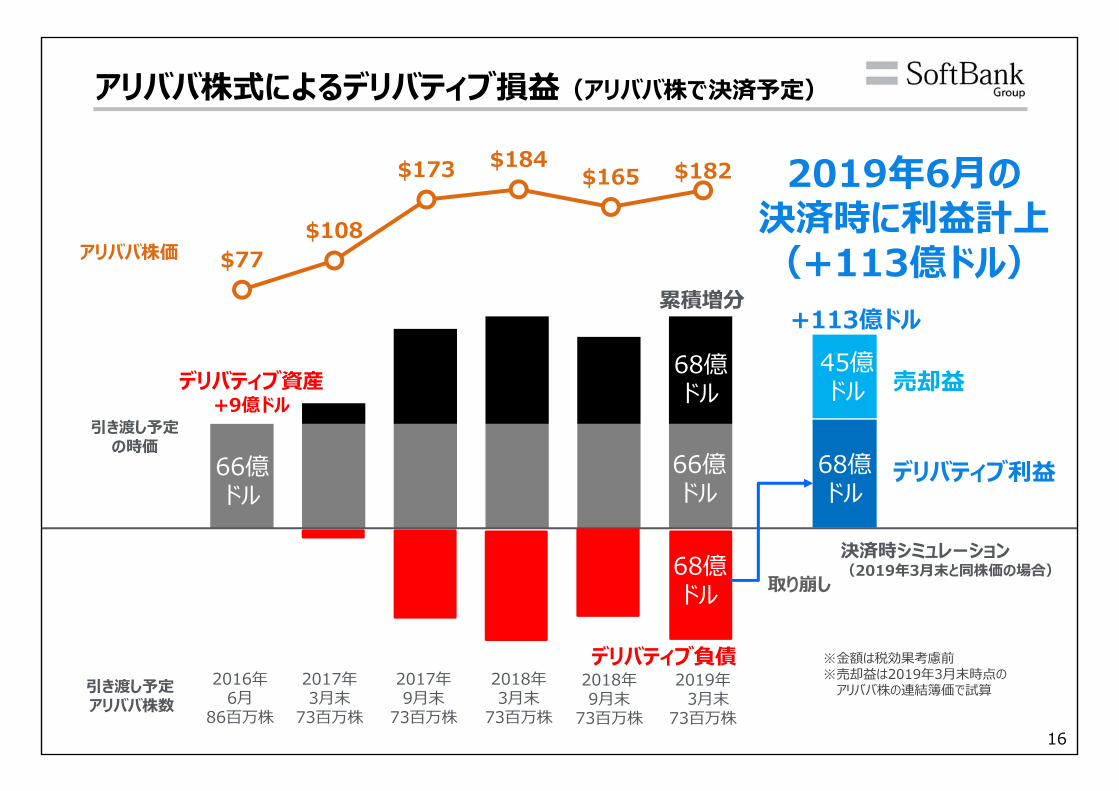
アリババ株式によるデリバティブ損益(アリババ株で決済予定)
$77 $108
$173 $184 $165 $182
アリババ株価
引き渡し予定の時価
66億ドル
累積増分
引き渡し予定アリババ株数
2016年6⽉
86百万株
2017年3⽉末
73百万株
2017年9⽉末
73百万株
2018年3⽉末
73百万株
デリバティブ資産+9億ドル
+113億ドル
デリバティブ利益
取り崩し決済時シミュレーション(2019年3⽉末と同株価の場合)
2019年6⽉の決済時に利益計上(+113億ドル)
45億ドル 売却益
68億ドル
デリバティブ負債 ※⾦額は税効果考慮前※売却益は2019年3⽉末時点の
アリババ株の連結簿価で試算2018年9⽉末
73百万株
2019年3⽉末
73百万株
68億ドル
66億ドル
68億ドル
17
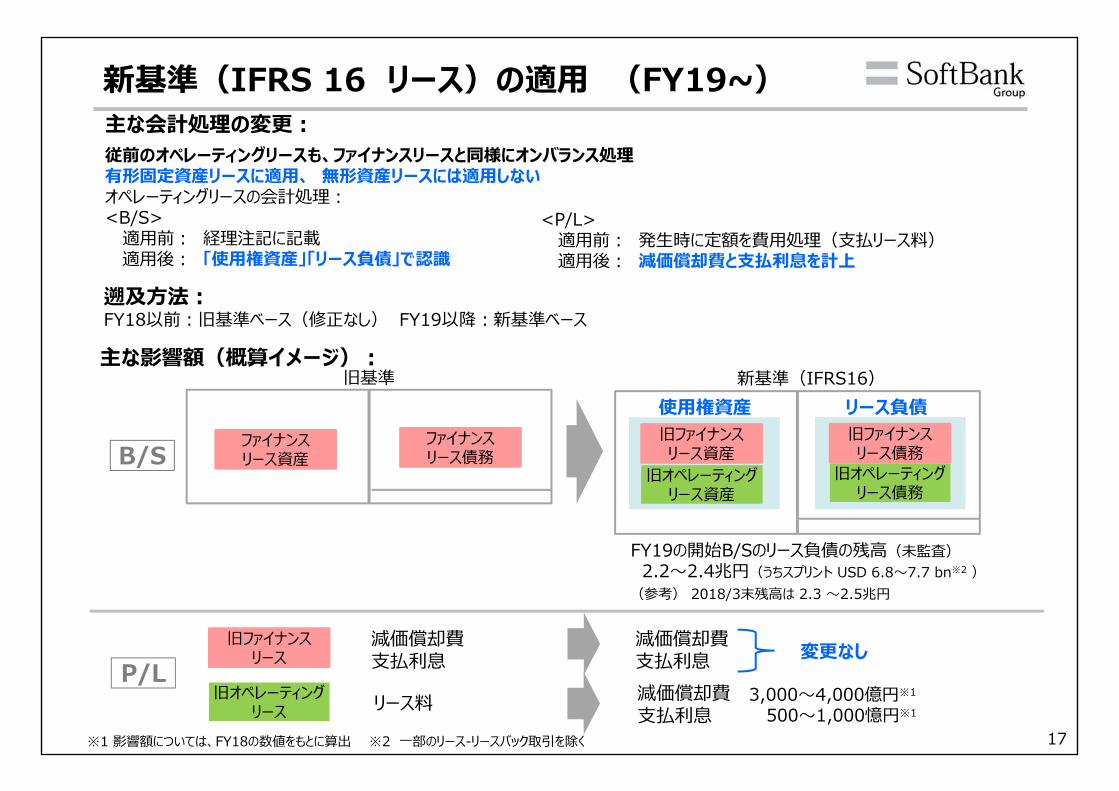
新基準(IFRS 16 リース)の適⽤ (FY19~)
遡及⽅法︓FY18以前︓旧基準ベース(修正なし) FY19以降︓新基準ベース
主な影響額(概算イメージ)︓
ファイナンスリース資産
旧基準 新基準(IFRS16)
減価償却費⽀払利息
リース料
減価償却費⽀払利息減価償却費⽀払利息
使⽤権資産
FY19の開始B/Sのリース負債の残⾼(未監査)2.2〜2.4兆円(うちスプリント USD 6.8〜7.7 bn※2 )
変更なし
B/Sファイナンスリース債務
旧オペレーティングリース資産
リース負債
旧オペレーティングリース債務
旧ファイナンスリース
旧オペレーティングリース
P/L
主な会計処理の変更︓従前のオペレーティングリースも、ファイナンスリースと同様にオンバランス処理有形固定資産リースに適⽤、 無形資産リースには適⽤しないオペレーティングリースの会計処理︓<B/S>
適⽤前︓ 経理注記に記載適⽤後︓ 「使⽤権資産」「リース負債」で認識
<P/L>適⽤前︓ 発⽣時に定額を費⽤処理(⽀払リース料)適⽤後︓ 減価償却費と⽀払利息を計上
旧ファイナンスリース資産
旧ファイナンスリース債務
3,000〜4,000億円※1
500〜1,000憶円※1
※1 影響額については、FY18の数値をもとに算出 ※2 ⼀部のリース-リースバック取引を除く
(参考) 2018/3末残⾼は 2.3 〜2.5兆円
18
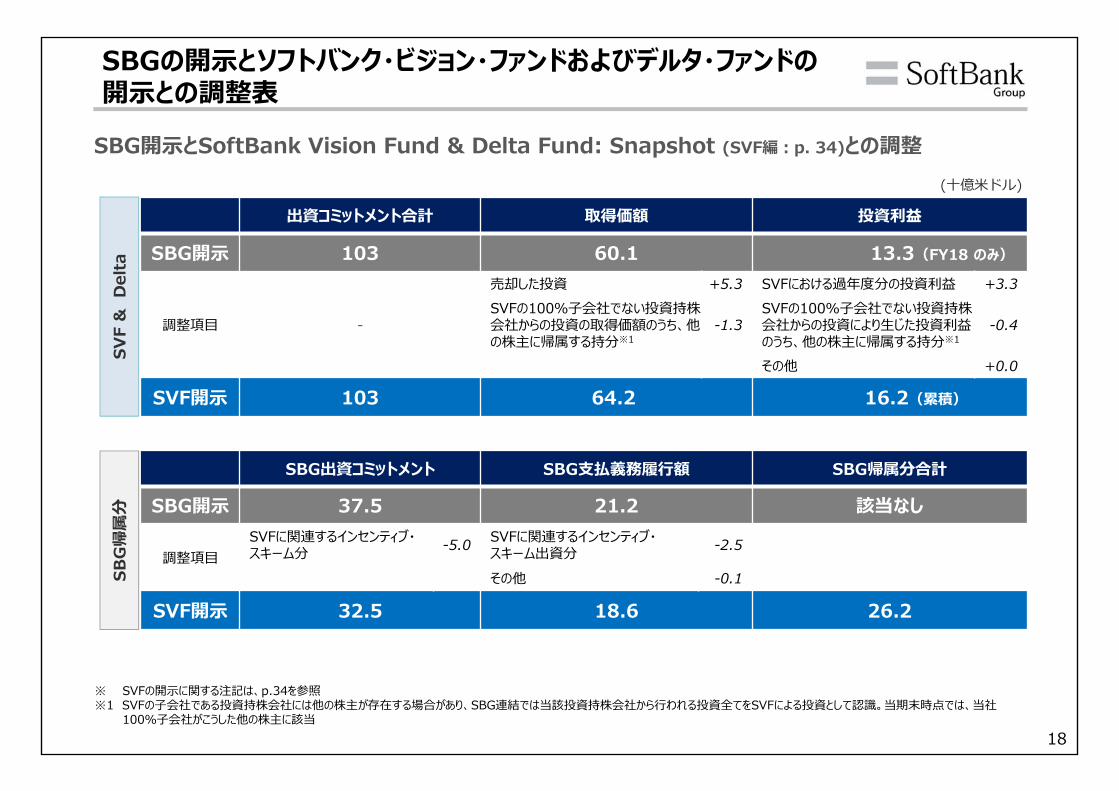
SBGの開⽰とソフトバンク・ビジョン・ファンドおよびデルタ・ファンドの開⽰との調整表
出資コミットメント合計 取得価額 投資利益
SBG開⽰ 103 60.1 13.3(FY18 のみ)
-
売却した投資 +5.3 SVFにおける過年度分の投資利益 +3.3
調整項⽬SVFの100%⼦会社でない投資持株会社からの投資の取得価額のうち、他の株主に帰属する持分※1
-1.3SVFの100%⼦会社でない投資持株会社からの投資により⽣じた投資利益のうち、他の株主に帰属する持分※1
-0.4
その他 +0.0
SVF開⽰ 103 64.2 16.2(累積)
SBG出資コミットメント SBG⽀払義務履⾏額 SBG帰属分合計
SBG開⽰ 37.5 21.2 該当なし
調整項⽬SVFに関連するインセンティブ・スキーム分 -5.0 SVFに関連するインセンティブ・
スキーム出資分 -2.5
その他 -0.1
SVF開⽰ 32.5 18.6 26.2
(⼗億⽶ドル)
SVF
&D
elta
SBG
帰属
分SBG開⽰とSoftBank Vision Fund & Delta Fund: Snapshot (SVF編︓p. 34)との調整
※ SVFの開⽰に関する注記は、p.34を参照※1 SVFの⼦会社である投資持株会社には他の株主が存在する場合があり、SBG連結では当該投資持株会社から⾏われる投資全てをSVFによる投資として認識。当期末時点では、当社
100%⼦会社がこうした他の株主に該当
19
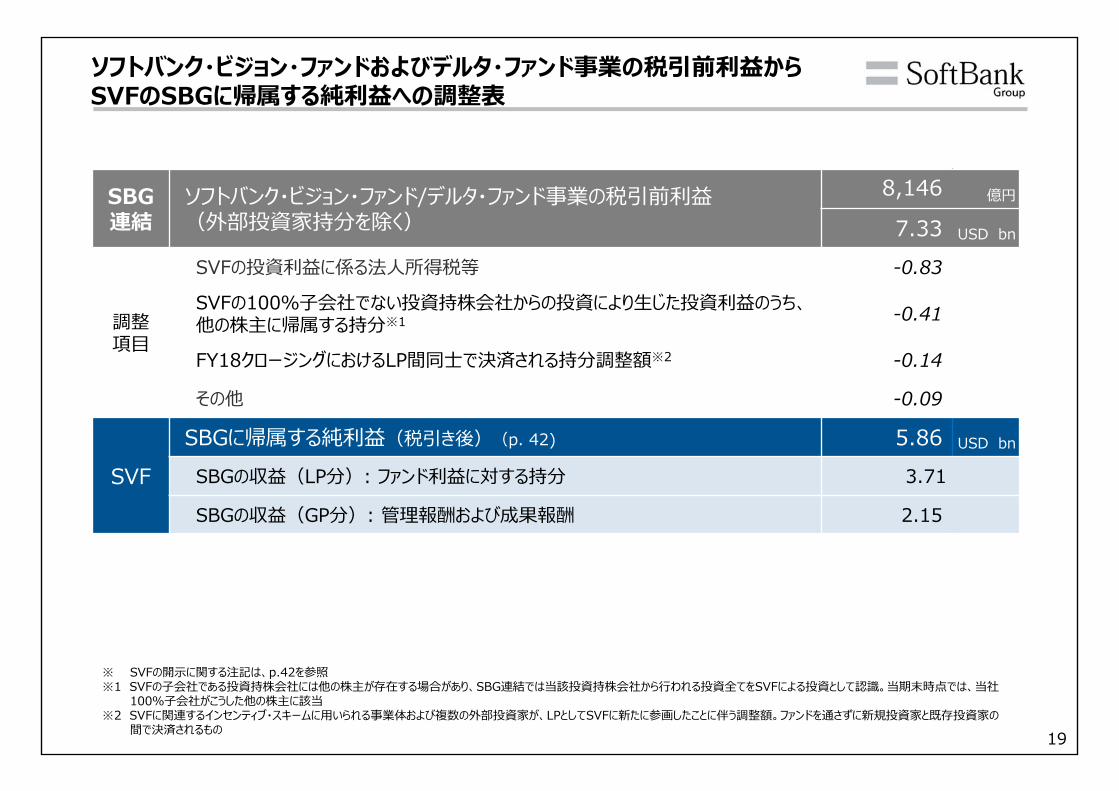
ソフトバンク・ビジョン・ファンドおよびデルタ・ファンド事業の税引前利益からSVFのSBGに帰属する純利益への調整表
※ SVFの開⽰に関する注記は、p.42を参照※1 SVFの⼦会社である投資持株会社には他の株主が存在する場合があり、SBG連結では当該投資持株会社から⾏われる投資全てをSVFによる投資として認識。当期末時点では、当社
100%⼦会社がこうした他の株主に該当※2 SVFに関連するインセンティブ・スキームに⽤いられる事業体および複数の外部投資家が、LPとしてSVFに新たに参画したことに伴う調整額。ファンドを通さずに新規投資家と既存投資家の
間で決済されるもの
SBG連結
ソフトバンク・ビジョン・ファンド/デルタ・ファンド事業の税引前利益(外部投資家持分を除く)
8,146 億円
7.33 USD bn
調整項⽬
SVFの投資利益に係る法⼈所得税等 -0.83
SVFの100%⼦会社でない投資持株会社からの投資により⽣じた投資利益のうち、他の株主に帰属する持分※1 -0.41
FY18クロージングにおけるLP間同⼠で決済される持分調整額※2 -0.14
その他 -0.09
SVFSBGに帰属する純利益(税引き後)(p. 42) 5.86 USD bn
SBGの収益(LP分): ファンド利益に対する持分 3.71
SBGの収益(GP分): 管理報酬および成果報酬 2.15
20
Appendix
21
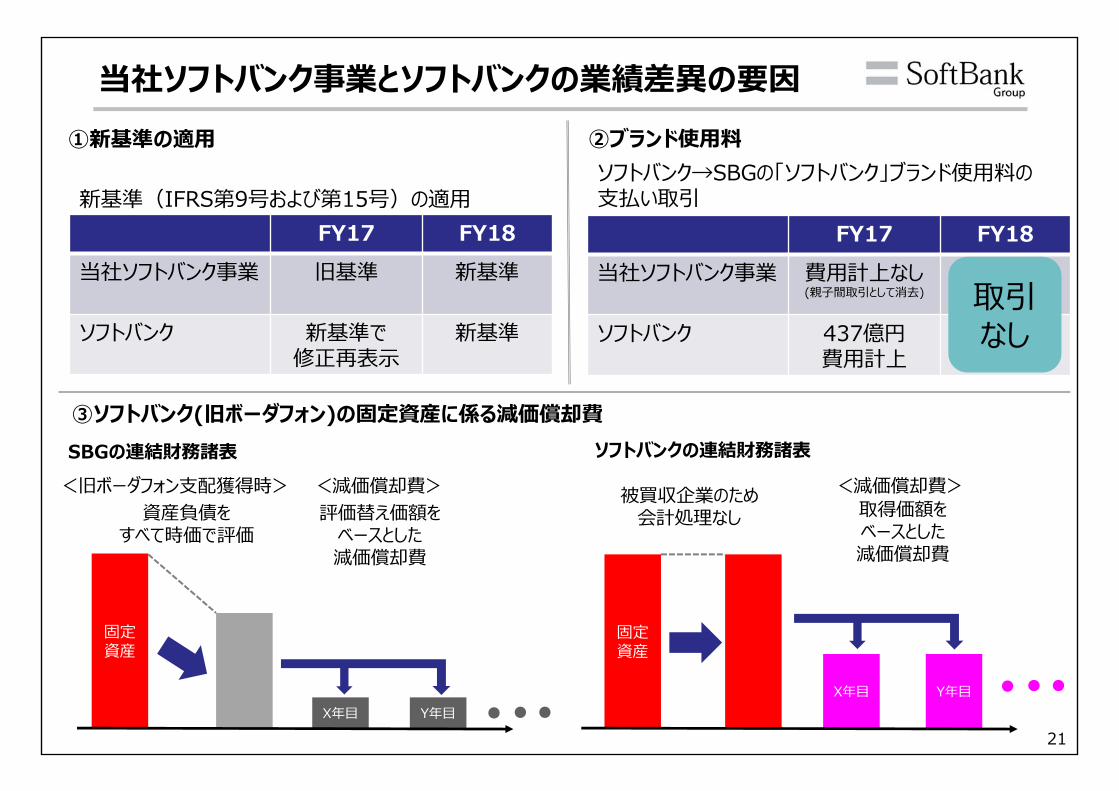
当社ソフトバンク事業とソフトバンクの業績差異の要因①新基準の適⽤ ②ブランド使⽤料
③ソフトバンク(旧ボーダフォン)の固定資産に係る減価償却費
FY17 FY18当社ソフトバンク事業 旧基準 新基準
ソフトバンク 新基準で修正再表⽰
新基準
新基準(IFRS第9号および第15号)の適⽤FY17 FY18
当社ソフトバンク事業 費⽤計上なし(親⼦間取引として消去)
ソフトバンク 437億円費⽤計上
取引なし
ソフトバンク→SBGの「ソフトバンク」ブランド使⽤料の⽀払い取引
固定資産
固定資産
SBGの連結財務諸表 ソフトバンクの連結財務諸表
<旧ボーダフォン⽀配獲得時>資産負債を
すべて時価で評価
被買収企業のため会計処理なし
X年⽬ Y年⽬X年⽬ Y年⽬
<減価償却費><減価償却費>評価替え価額を
ベースとした減価償却費
取得価額をベースとした減価償却費
22
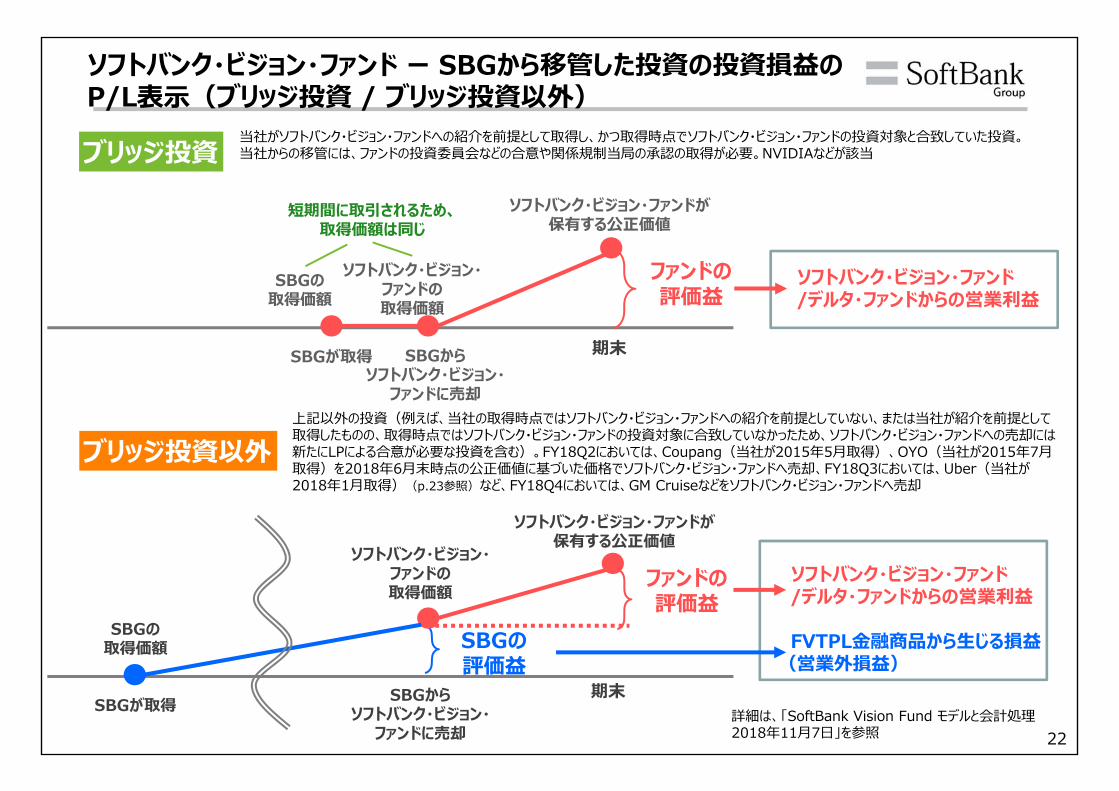
ソフトバンク・ビジョン・ファンド ー SBGから移管した投資の投資損益のP/L表⽰(ブリッジ投資 / ブリッジ投資以外)
上記以外の投資(例えば、当社の取得時点ではソフトバンク・ビジョン・ファンドへの紹介を前提としていない、または当社が紹介を前提として取得したものの、取得時点ではソフトバンク・ビジョン・ファンドの投資対象に合致していなかったため、ソフトバンク・ビジョン・ファンドへの売却には新たにLPによる合意が必要な投資を含む)。FY18Q2においては、Coupang(当社が2015年5⽉取得)、OYO(当社が2015年7⽉取得)を2018年6⽉末時点の公正価値に基づいた価格でソフトバンク・ビジョン・ファンドへ売却、FY18Q3においては、Uber(当社が2018年1⽉取得)(p.23参照)など、FY18Q4においては、GM Cruiseなどをソフトバンク・ビジョン・ファンドへ売却
SBGの取得価額
SBGが取得 SBGからソフトバンク・ビジョン・
ファンドに売却
ソフトバンク・ビジョン・ファンドが保有する公正価値
ブリッジ投資
ブリッジ投資以外
ソフトバンク・ビジョン・ファンドの取得価額
期末
ファンドの評価益
SBGの取得価額
SBGが取得 SBGからソフトバンク・ビジョン・
ファンドに売却
ソフトバンク・ビジョン・ファンドが保有する公正価値
ソフトバンク・ビジョン・ファンドの取得価額
期末
ファンドの評価益
SBGの評価益
短期間に取引されるため、取得価額は同じ
当社がソフトバンク・ビジョン・ファンドへの紹介を前提として取得し、かつ取得時点でソフトバンク・ビジョン・ファンドの投資対象と合致していた投資。当社からの移管には、ファンドの投資委員会などの合意や関係規制当局の承認の取得が必要。NVIDIAなどが該当
ソフトバンク・ビジョン・ファンド/デルタ・ファンドからの営業利益
FVTPL⾦融商品から⽣じる損益(営業外損益)
ソフトバンク・ビジョン・ファンド/デルタ・ファンドからの営業利益
詳細は、「SoftBank Vision Fund モデルと会計処理2018年11⽉7⽇」を参照
23
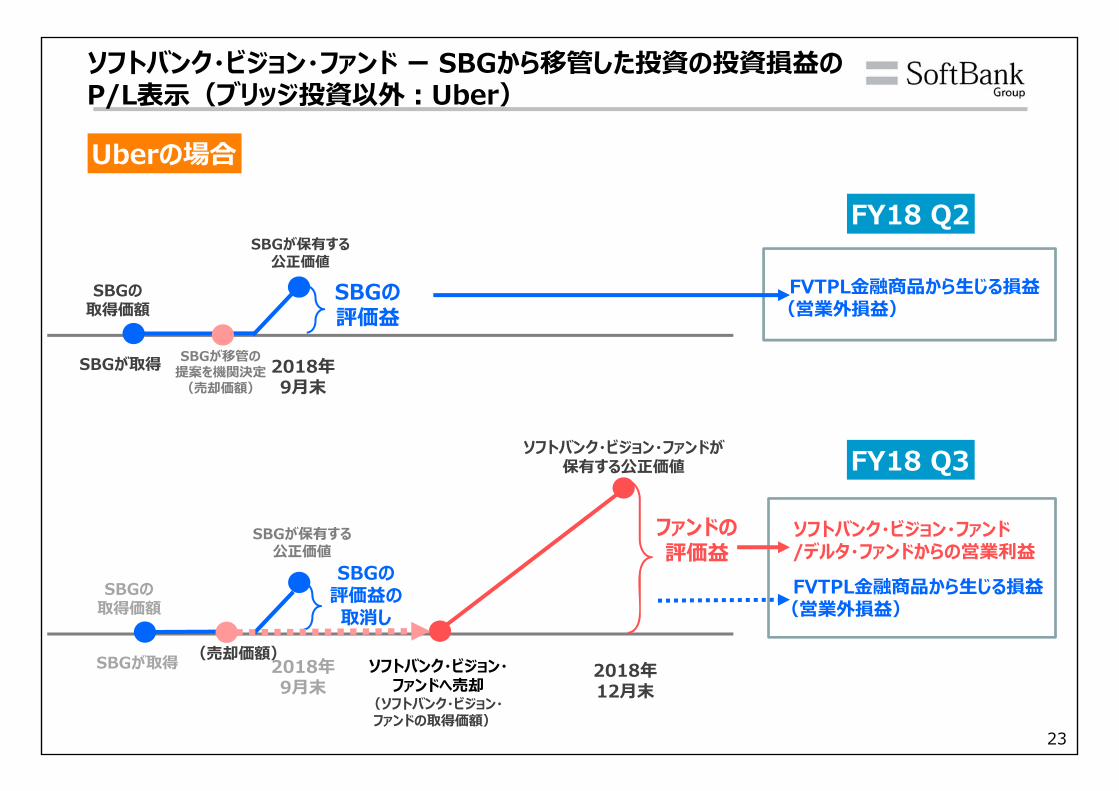
ソフトバンク・ビジョン・ファンド ー SBGから移管した投資の投資損益のP/L表⽰(ブリッジ投資以外︓Uber)
SBGの取得価額
SBGが取得
SBGが保有する公正価値
SBGの評価益
SBGの取得価額
SBGが取得
ソフトバンク・ビジョン・ファンドが保有する公正価値
(ソフトバンク・ビジョン・ファンドの取得価額)
2018年12⽉末
ファンドの評価益
ソフトバンク・ビジョン・ファンド/デルタ・ファンドからの営業利益
FVTPL⾦融商品から⽣じる損益(営業外損益)
FVTPL⾦融商品から⽣じる損益(営業外損益)
2018年9⽉末
SBGが保有する公正価値
SBGの評価益の取消し
2018年9⽉末
SBGが移管の提案を機関決定(売却価額)
(売却価額)ソフトバンク・ビジョン・
ファンドへ売却
Uberの場合
FY18 Q2
FY18 Q3
24
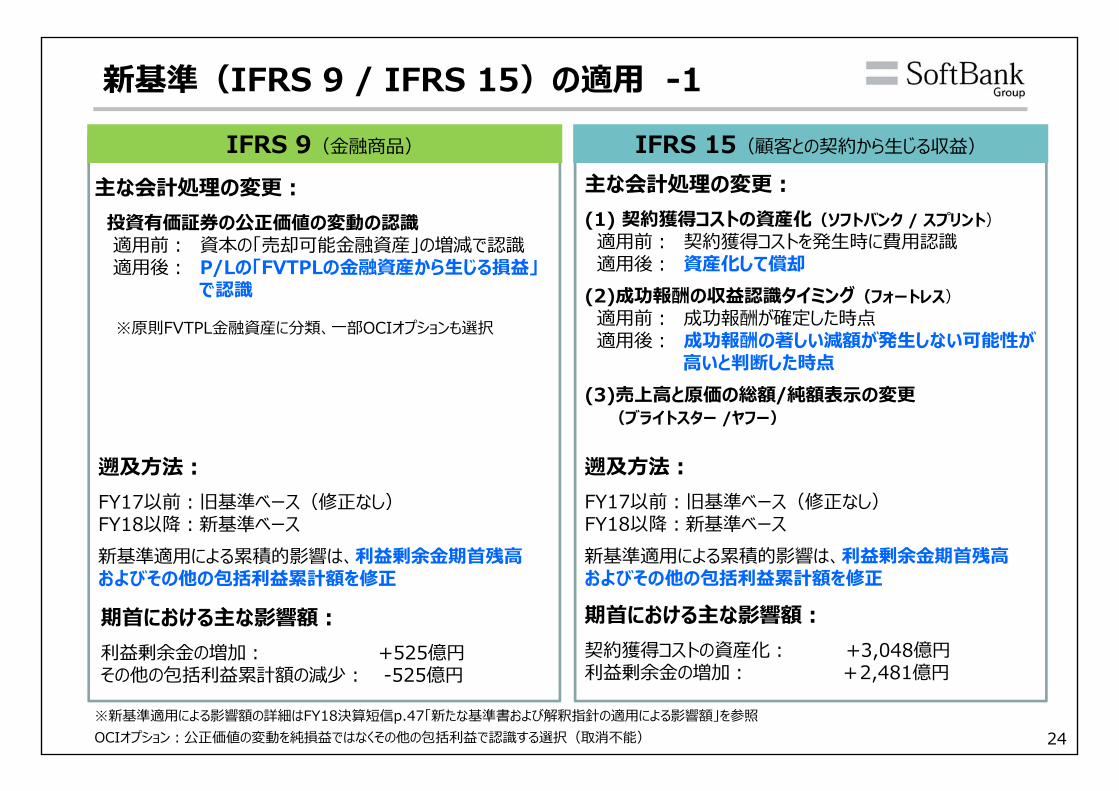
新基準(IFRS 9 / IFRS 15)の適⽤ -1
主な会計処理の変更︓(1) 契約獲得コストの資産化(ソフトバンク / スプリント)適⽤前︓ 契約獲得コストを発⽣時に費⽤認識適⽤後︓ 資産化して償却
(2)成功報酬の収益認識タイミング(フォートレス)適⽤前︓ 成功報酬が確定した時点適⽤後︓ 成功報酬の著しい減額が発⽣しない可能性が
⾼いと判断した時点(3)売上⾼と原価の総額/純額表⽰の変更
(ブライトスター /ヤフー)
遡及⽅法︓FY17以前︓旧基準ベース(修正なし)FY18以降︓新基準ベース新基準適⽤による累積的影響は、利益剰余⾦期⾸残⾼およびその他の包括利益累計額を修正
期⾸における主な影響額︓契約獲得コストの資産化︓ +3,048億円利益剰余⾦の増加︓ +2,481億円
IFRS 9(⾦融商品) IFRS 15(顧客との契約から⽣じる収益)
主な会計処理の変更︓投資有価証券の公正価値の変動の認識適⽤前︓ 資本の「売却可能⾦融資産」の増減で認識適⽤後︓ P/Lの「FVTPLの⾦融資産から⽣じる損益」
で認識
※原則FVTPL⾦融資産に分類、⼀部OCIオプションも選択
遡及⽅法︓FY17以前︓旧基準ベース(修正なし)FY18以降︓新基準ベース新基準適⽤による累積的影響は、利益剰余⾦期⾸残⾼およびその他の包括利益累計額を修正
期⾸における主な影響額︓利益剰余⾦の増加︓ +525億円その他の包括利益累計額の減少︓ -525億円
OCIオプション︓公正価値の変動を純損益ではなくその他の包括利益で認識する選択(取消不能)※新基準適⽤による影響額の詳細はFY18決算短信p.47「新たな基準書および解釈指針の適⽤による影響額」を参照
25
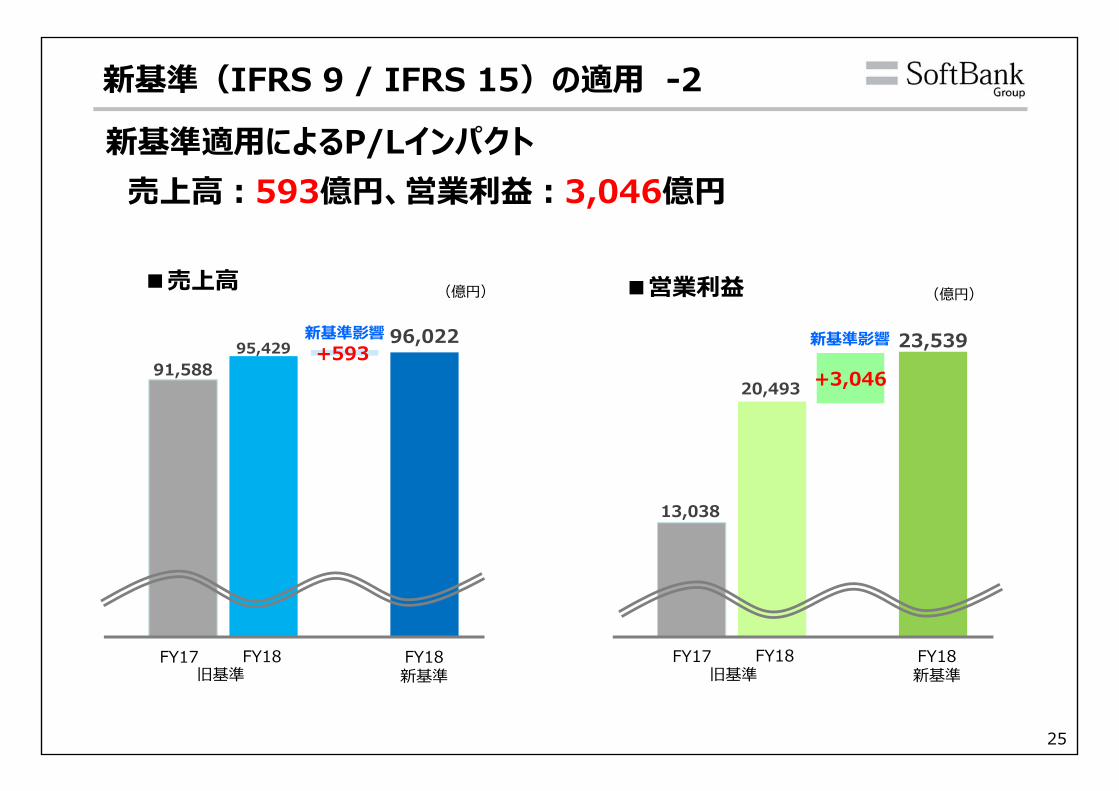
新基準適⽤によるP/Lインパクト売上⾼︓593億円、営業利益︓3,046億円
(億円)(億円)
新基準(IFRS 9 / IFRS 15)の適⽤ -2
91,588 95,429 96,022
13,038
20,493
23,539
+3,046
FY17 FY18 FY18新基準
新基準影響 新基準影響
■売上⾼ ■営業利益
旧基準FY17 FY18 FY18
新基準旧基準
+593
26
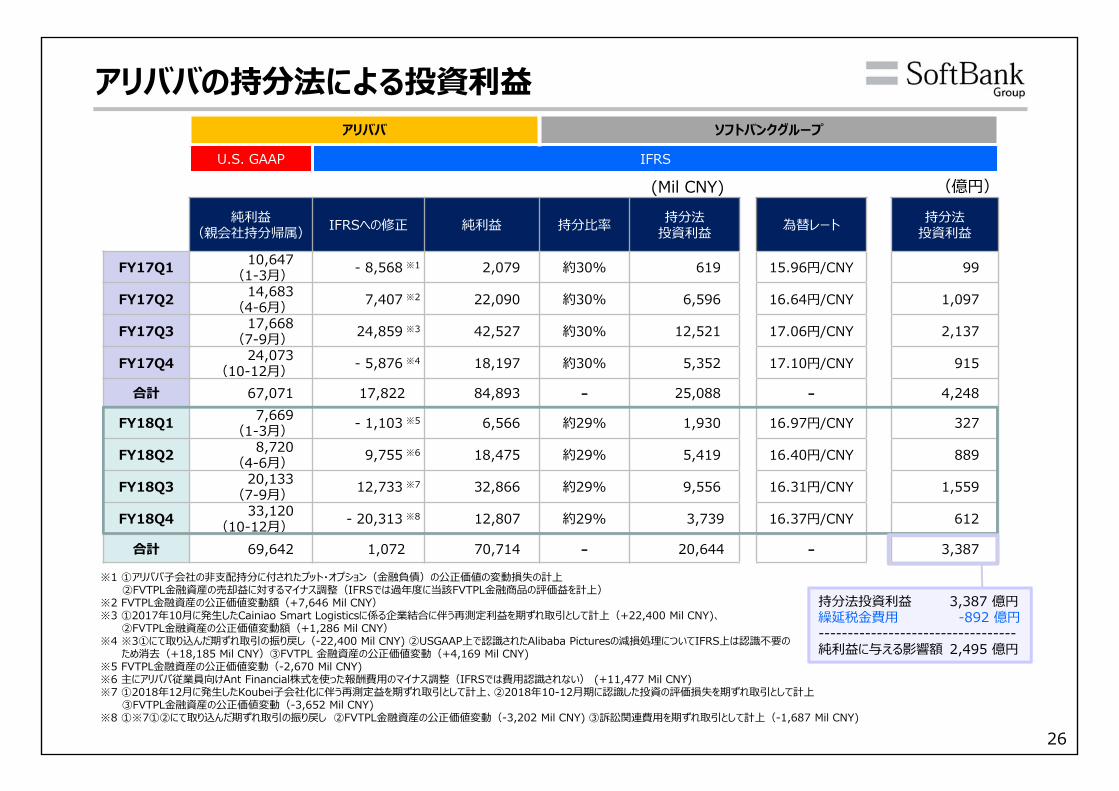
アリババの持分法による投資利益アリババ ソフトバンクグループ
U.S. GAAP IFRS
純利益(親会社持分帰属) IFRSへの修正 純利益 持分⽐率 持分法
投資利益 為替レート 持分法投資利益
FY17Q1 10,647(1-3⽉) - 8,568 ※1 2,079 約30% 619 15.96円/CNY 99
FY17Q2 14,683(4-6⽉) 7,407 ※2 22,090 約30% 6,596 16.64円/CNY 1,097
FY17Q3 17,668(7-9⽉) 24,859 ※3 42,527 約30% 12,521 17.06円/CNY 2,137
FY17Q4 24,073(10-12⽉) - 5,876 ※4 18,197 約30% 5,352 17.10円/CNY 915
合計 67,071 17,822 84,893 - 25,088 - 4,248
FY18Q1 7,669(1-3⽉) - 1,103 ※5 6,566 約29% 1,930 16.97円/CNY 327
FY18Q2 8,720(4-6⽉) 9,755 ※6 18,475 約29% 5,419 16.40円/CNY 889
FY18Q3 20,133(7-9⽉) 12,733 ※7 32,866 約29% 9,556 16.31円/CNY 1,559
FY18Q4 33,120(10-12⽉) - 20,313 ※8 12,807 約29% 3,739 16.37円/CNY 612
合計 69,642 1,072 70,714 - 20,644 - 3,387
(Mil CNY) (億円)
持分法投資利益 3,387 億円繰延税⾦費⽤ -892 億円----------------------------------純利益に与える影響額 2,495 億円
※1 ①アリババ⼦会社の⾮⽀配持分に付されたプット・オプション(⾦融負債)の公正価値の変動損失の計上②FVTPL⾦融資産の売却益に対するマイナス調整(IFRSでは過年度に当該FVTPL⾦融商品の評価益を計上)
※2 FVTPL⾦融資産の公正価値変動額(+7,646 Mil CNY)※3 ①2017年10⽉に発⽣したCainiao Smart Logisticsに係る企業結合に伴う再測定利益を期ずれ取引として計上(+22,400 Mil CNY)、
②FVTPL⾦融資産の公正価値変動額(+1,286 Mil CNY)※4 ※3①にて取り込んだ期ずれ取引の振り戻し(-22,400 Mil CNY) ②USGAAP上で認識されたAlibaba Picturesの減損処理についてIFRS上は認識不要の
ため消去(+18,185 Mil CNY)③FVTPL ⾦融資産の公正価値変動(+4,169 Mil CNY)※5 FVTPL⾦融資産の公正価値変動(-2,670 Mil CNY)※6 主にアリババ従業員向けAnt Financial株式を使った報酬費⽤のマイナス調整(IFRSでは費⽤認識されない) (+11,477 Mil CNY)※7 ①2018年12⽉に発⽣したKoubei⼦会社化に伴う再測定益を期ずれ取引として計上、②2018年10-12⽉期に認識した投資の評価損失を期ずれ取引として計上
③FVTPL⾦融資産の公正価値変動(-3,652 Mil CNY)※8 ①※7①②にて取り込んだ期ずれ取引の振り戻し ②FVTPL⾦融資産の公正価値変動(-3,202 Mil CNY) ③訴訟関連費⽤を期ずれ取引として計上(-1,687 Mil CNY)

27
(億円)
のれん・無形資産の内訳
B/S項⽬ 主な内訳 2018/
3⽉末2019/3⽉末
増減摘要
償却費 為替変動 その他
のれん
43,026 43,215
アーム 28,514 27,775 - -739 -
ソフトバンク 9,075 9,075 - - -
スプリント 3,128 3,268 - +140 -
主な無形資産
FCCライセンス(⾮償却) 39,606 41,551
スプリント 39,606 41,551 - +1,771 +174 「その他」の増加は、主に他のキャリアとの周波数交換(⾮資⾦取引)に伴い取得したFCCライセンス
テクノロジー 5,216 4,719主な内訳 アーム 5,190 4,619 -438 -133 - 定額法 償却年数︓8-20年
顧客基盤 3,324 2,490
主な内訳
スプリント 1,168 593 -626 +51 - ⽉次級数法償却年数︓ポストペイド︓8年
アーム 1,406 1,250 -120 -36 - 定額法 償却年数︓13年
商標権 6,649 6,939 耐⽤年数を確定できる商標権を除く主な内訳 スプリント 6,306 6,587 - +282 -
マネジメント契約 1,153 947
フォートレス 1,153 947 -258 +52 - 定額法 償却年数︓1.5-10年
※のれん︓当社が⽀配獲得時に認識したのれんの⾦額。⽀配獲得後の当該⼦会社によるM&Aの結果認識したのれんは含まない
ソフトバンク・ビジョン・ファンド/ デルタ・ファンド事業編
28
SoftBank Vision Fund & Delta Fund Update
Navneet Govil Managing Partner & Chief Financial Officer, SoftBank Investment Advisers
May 10, 2019
29
IMPORTANT INFORMATION
This presentation (this “Presentation”) is furnished to you on a confidential basis for informational purposes in connection with your limited partnership interests in SoftBank Vision Fund L.P. and SB Delta Fund(Jersey) L.P. (together with, as the context may require, any parallel fund, feeder fund, co-investment vehicle or alternative investment vehicle, the “Funds”) and is not, and may not be relied on in any manner as,legal, tax, investment, accounting or other advice or as an offer to sell or a solicitation of an offer to buy limited partnership or comparable limited liability equity interests in the Fund. . This Presentation is notintended to be relied upon as the basis for any investment decision, and is not, and should not be assumed to be, complete. The contents of this presentation are not to be construed as legal, business or tax advice.
None of the Funds, the manager of the Funds (the “Manager” or “SBIA”), SoftBank Group Corp. (together with its affiliates, “SoftBank”) or their respective affiliates makes any representation or warranty, express orimplied, as to the accuracy or completeness of the information contained herein and nothing contained herein should be relied upon as a promise or representation as to past or future performance of the Funds orany other entity referenced in this Presentation.
Recipients of this Presentation should make their own investigations and evaluations of the information contained in this Presentation and should note that such information may change materially. Recipientacknowledges and agrees that it is a sophisticated investor with such knowledge and experience in financial and business matters as to be capable of evaluating the merits and risks of the opportunities describedherein. Recipient agrees that it shall independently and without reliance upon SoftBank, the Manager or any of their related persons and based on such documents and information as it has deemed appropriate andon consultations with its own legal, tax, regulatory, accounting, investment and financial advisors, make its own appraisal of, and investigation into the business, operations, property, financial and other conditions,creditworthiness, likelihood of success, merits and consequences of the opportunities described herein. Recipient acknowledges and agrees that none of the Funds, the Manager, any affiliate of the foregoing orany related person shall have any duty or responsibility to provide the recipient with any information regarding the business, operations, property, financial and other condition and creditworthiness of thecompanies discussed herein or any of its affiliates which may come into the possession of any of them.
References to any specific investments of the Funds are presented to illustrate the Manager’s investment process and operating philosophy only and should not be construed as a recommendation of anyparticular investment or security. The investment performance of individual investments in the Funds may vary and the performance of the selected transactions is not necessarily indicative of the performance ofall of the applicable prior investments. The specific investments identified and described herein do not represent all of the investments made by the Manager, and no assumption should be made that investmentsidentified and discussed herein were or will be profitable.
Statements contained in this Presentation (including those relating to current and future market conditions and trends in respect thereof) that are not historical facts are based on current expectations, estimates,projections, opinions and/or beliefs of the Manager. Such statements involve known and unknown risks, uncertainties and other factors, and undue reliance should not be placed thereon. In addition, norepresentation or warranty is made with respect to the reasonableness of any estimates, forecasts, illustrations, prospects or returns, which should be regarded as illustrative only, or that any profits will berealized. Certain information contained herein constitutes “forward-looking statements,” which can be identified by the use of terms such as “may”, “will”, “should”, “expect”, “project”, “estimate”, “intend”,“continue”, “target” or “believe” (or the negatives thereof) or other variations thereon or comparable terminology. Due to various risks and uncertainties, actual events or results or actual performance of the Funds(or any other entity referred to herein) may differ materially from those reflected or contemplated in such forward-looking statements. As a result, investors should not rely on such forward-looking statements inmaking their investment decisions. No representation or warranty is made as to future performance or such forward-looking statements. None of the information contained herein has been filed with the U.S.Securities and Exchange Commission, any securities administrator under any securities laws of any U.S. or non-U.S. jurisdiction or any other U.S. or non-U.S. governmental or self-regulatory authority. No suchgovernmental or self-regulatory authority will pass on the merits of the offering of interests in the Funds or the adequacy of the information contained herein. Any representation to the contrary is unlawful.
Past performance is not necessarily indicative of future results. Investors may lose investment capital. There can be no assurance that the Funds will achieve comparable results or the Funds will be able toimplement their investment strategy or achieve their investment objectives.
Information throughout this Presentation is based on unrealized valuations of portfolio investments. Valuations of unrealized investments are based on assumptions and factors (including, for example, as of thedate of the valuation, average multiples of comparable companies, and other considerations) that the Manager believes are reasonable under the circumstances relating to each particular investment. However,there can be no assurance that unrealized investments will be realized at the valuations indicated herein or used to calculate the returns contained herein, and transaction costs connected with such realizationsremain unknown and, therefore, are not factored into such calculations. Estimates of unrealized value are subject to numerous variables that change over time. The actual realized returns on a Fund’s unrealizedinvestments will depend on, among other factors, future operating results, the value of the assets and market conditions at the time of disposition, any related transaction costs and the timing and manner of sale,all of which may differ from the assumptions and circumstances on which the Manager’s valuations are based. Unless otherwise indicated herein, all valuations presented herein are current as of December 31,2018. The actual realized return on these unrealized investments may differ materially from the performance information indicated herein. No assumption should be made that investments identified and discussedherein were or will be profitable, or that investments made in the future will be comparable in quality or performance to the investments described therein. The actual return realized by any investor in the Fundsmay differ materially from those reflected or contemplated in the data presented in this Presentation.
To the extent presented herein, information relating to industry sectors and sizes has been determined by the Manager based on internal research and data. Although the Manager believes that suchdeterminations are reasonable, they are inherently subjective in nature. Other market participants may make different determinations relating to sector characterization and size based on the same underlyingdata. Certain information contained in this Presentation has been obtained from published and non-published sources prepared by other parties, which in certain cases have not been updated through the datehereof. While such information is believed to be reliable for the purposes of this Presentation, none of the Funds, the Manager, SoftBank, or their respective affiliates assumes any responsibility for the accuracy orcompleteness of such information and such information has not been independently verified. Except where otherwise indicated herein, the information provided in this Presentation is based on matters as theyexist as of the date of preparation of this Presentation and not as of any future date, and will not be updated or otherwise revised to reflect information that subsequently becomes available, or circumstancesexisting or changes occurring after the date hereof. In this Presentation, references to “$” or “US$” shall be to the lawful currency of the United States.
No assumption should be made that investments identified and discussed herein were or will be profitable, or that investments made in the future will be comparable in quality or performance to the investmentsdescribed therein. The actual return realized by any investor in the Funds may differ materially from those reflected or contemplated in the data presented in this Presentation.
EACH RECIPIENT ACKNOWLEDGES AND AGREES THAT IT IS RECEIVING THIS PRESENTATION ONLY FOR THE PURPOSES STATED ABOVE AND SUBJECT TO ALL APPLICABLE CONFIDENTIALITYOBLIGATIONS AS WELL AS THE UNITED STATES SECURITIES LAWS PROHIBITING ANY PERSON WHO HAS RECEIVED MATERIAL, NON-PUBLIC INFORMATION FROM PURCHASING OR SELLING SECURITIESOF THE APPLICABLE ISSUER OR FROM COMMUNICATING SUCH INFORMATION TO ANY OTHER PERSON UNDER CIRCUMSTANCES IN WHICH IT IS REASONABLY FORESEEABLE THAT SUCH PERSON ISLIKELY TO PURCHASE OR SELL SUCH SECURITIES.
30
Topics
1. Progress & Highlights
2. Performance & Impact on SoftBank Group
3. In Focus: Investment & Valuation Processes
31

Progress & Highlights
32
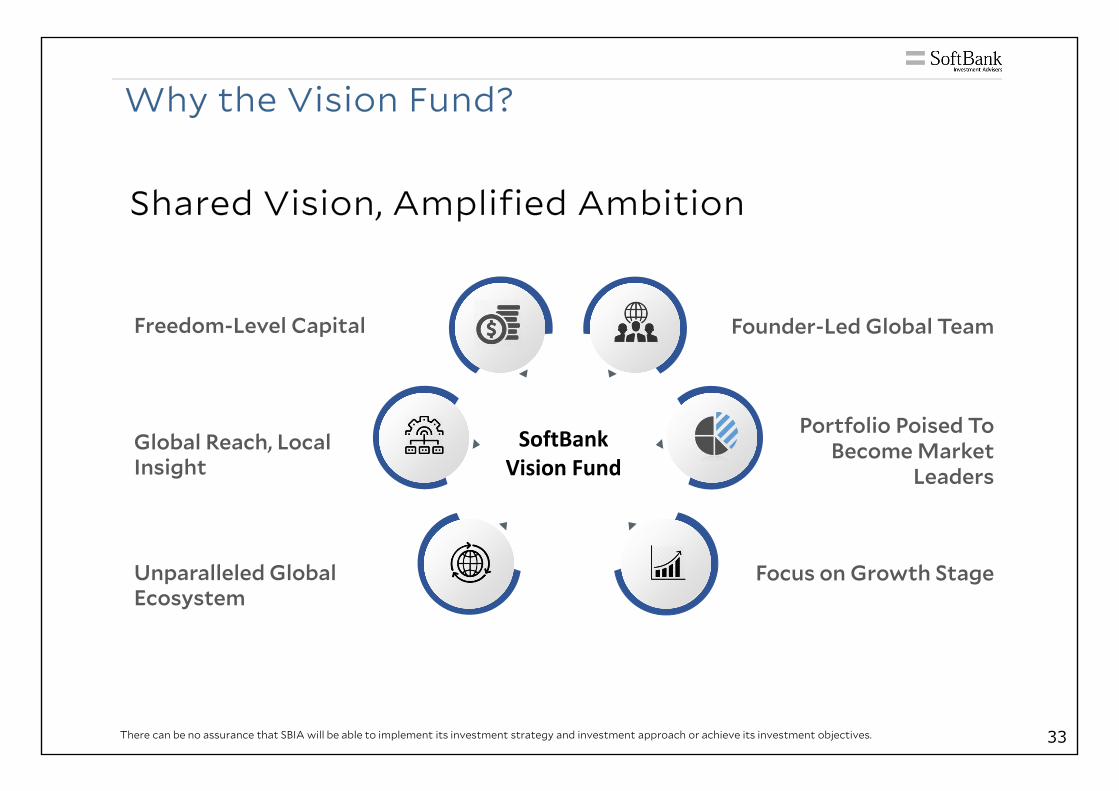
Why the Vision Fund?
Shared Vision, Amplified Ambition
Freedom-Level Capital Founder-Led Global Team
Global Reach, Local Insight
Portfolio Poised To Become Market
Leaders
Unparalleled Global Ecosystem
Focus on Growth Stage
SoftBank Vision Fund
There can be no assurance that SBIA will be able to implement its investment strategy and investment approach or achieve its investment objectives. 33
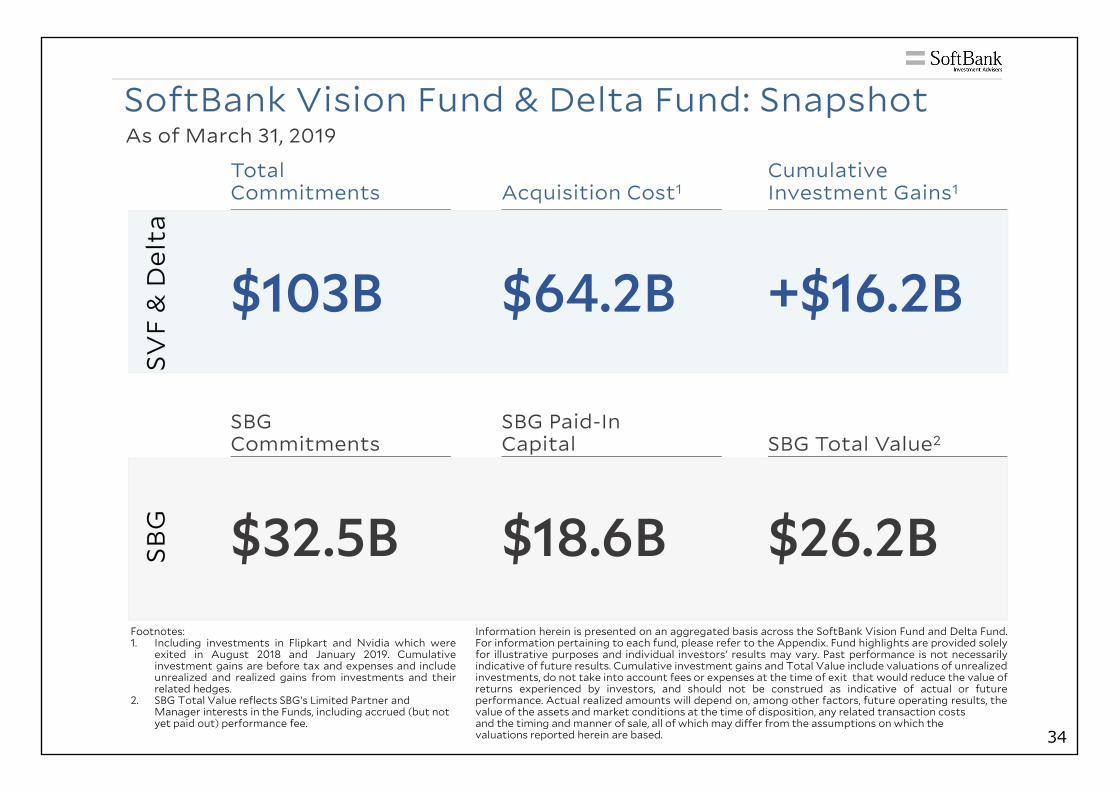
Information herein is presented on an aggregated basis across the SoftBank Vision Fund and Delta Fund.For information pertaining to each fund, please refer to the Appendix. Fund highlights are provided solelyfor illustrative purposes and individual investors' results may vary. Past performance is not necessarilyindicative of future results. Cumulative investment gains and Total Value include valuations of unrealizedinvestments, do not take into account fees or expenses at the time of exit that would reduce the value ofreturns experienced by investors, and should not be construed as indicative of actual or futureperformance. Actual realized amounts will depend on, among other factors, future operating results, thevalue of the assets and market conditions at the time of disposition, any related transaction costsand the timing and manner of sale, all of which may differ from the assumptions on which thevaluations reported herein are based.
SoftBank Vision Fund & Delta Fund: SnapshotAs of March 31, 2019
SVF
& D
elta
SBG
Total Commitments Acquisition Cost1
Cumulative Investment Gains1
SBG Commitments
SBG Paid-In Capital SBG Total Value2
$103B $64.2B +$16.2B
$32.5B $18.6B $26.2BFootnotes:1. Including investments in Flipkart and Nvidia which were
exited in August 2018 and January 2019. Cumulativeinvestment gains are before tax and expenses and includeunrealized and realized gains from investments and theirrelated hedges.
2. SBG Total Value reflects SBG’s Limited Partner and Manager interests in the Funds, including accrued (but not yet paid out) performance fee.
34
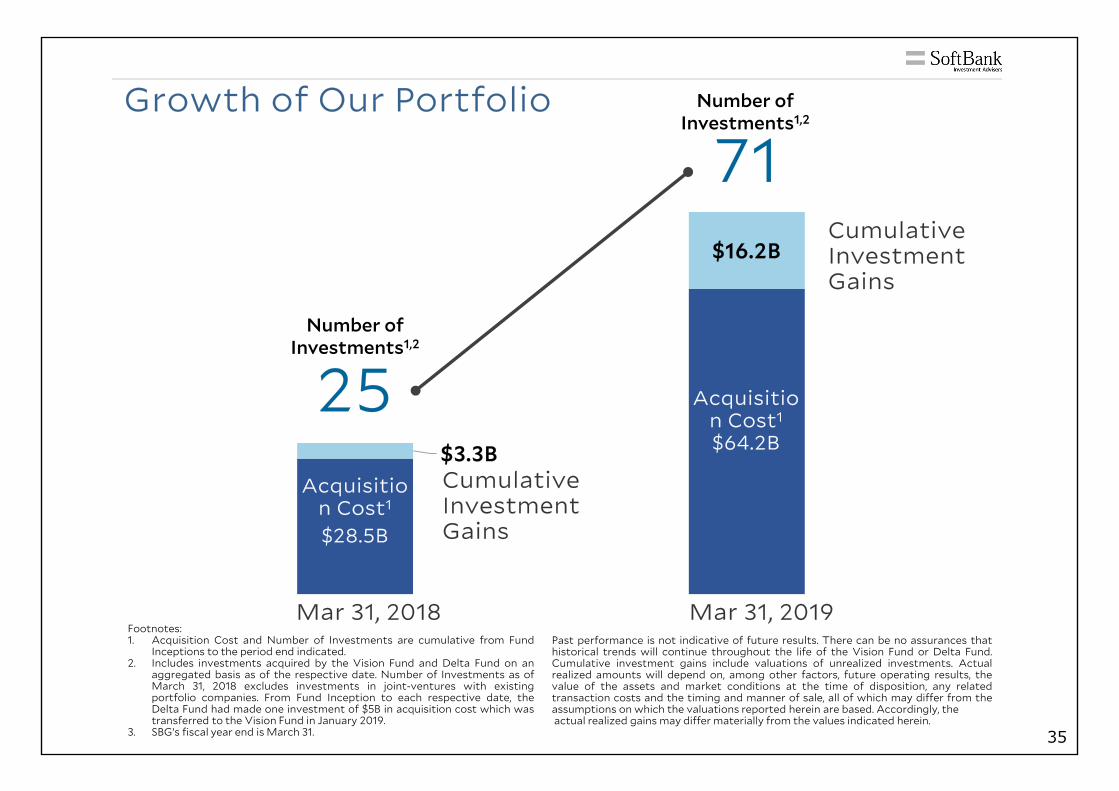
$28.5B
Acquisition Cost1
$64.2B$3.3B
$16.2B
Cumulative Investment Gains
CumulativeInvestment Gains
Growth of Our Portfolio
Footnotes:1. Acquisition Cost and Number of Investments are cumulative from Fund
Inceptions to the period end indicated.2. Includes investments acquired by the Vision Fund and Delta Fund on an
aggregated basis as of the respective date. Number of Investments as ofMarch 31, 2018 excludes investments in joint-ventures with existingportfolio companies. From Fund Inception to each respective date, theDelta Fund had made one investment of $5B in acquisition cost which wastransferred to the Vision Fund in January 2019.
3. SBG’s fiscal year end is March 31.
71
Number of Investments1,2
25
Past performance is not indicative of future results. There can be no assurances thathistorical trends will continue throughout the life of the Vision Fund or Delta Fund.Cumulative investment gains include valuations of unrealized investments. Actualrealized amounts will depend on, among other factors, future operating results, thevalue of the assets and market conditions at the time of disposition, any relatedtransaction costs and the timing and manner of sale, all of which may differ from theassumptions on which the valuations reported herein are based. Accordingly, theactual realized gains may differ materially from the values indicated herein.
Mar 31, 2018 Mar 31, 2019
Number of Investments1,2
Acquisition Cost1
35
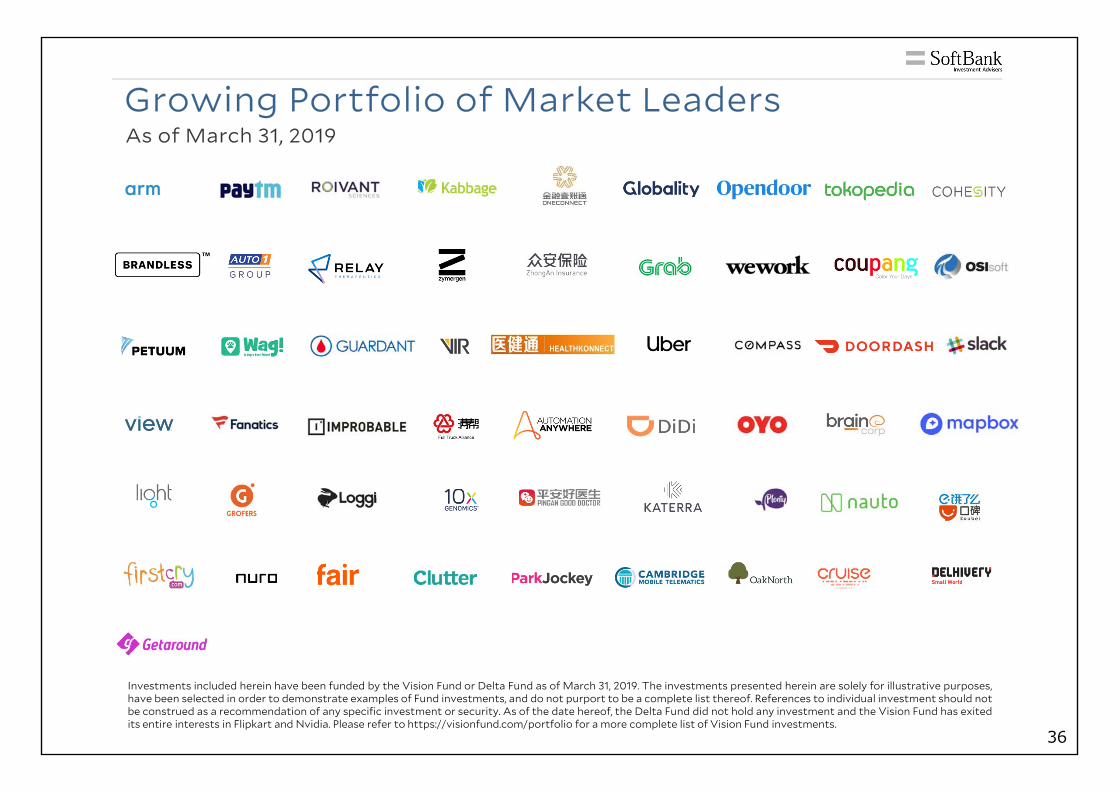
Growing Portfolio of Market LeadersAs of March 31, 2019
Investments included herein have been funded by the Vision Fund or Delta Fund as of March 31, 2019. The investments presented herein are solely for illustrative purposes,have been selected in order to demonstrate examples of Fund investments, and do not purport to be a complete list thereof. References to individual investment should notbe construed as a recommendation of any specific investment or security. As of the date hereof, the Delta Fund did not hold any investment and the Vision Fund has exitedits entire interests in Flipkart and Nvidia. Please refer to https://visionfund.com/portfolio for a more complete list of Vision Fund investments.
36
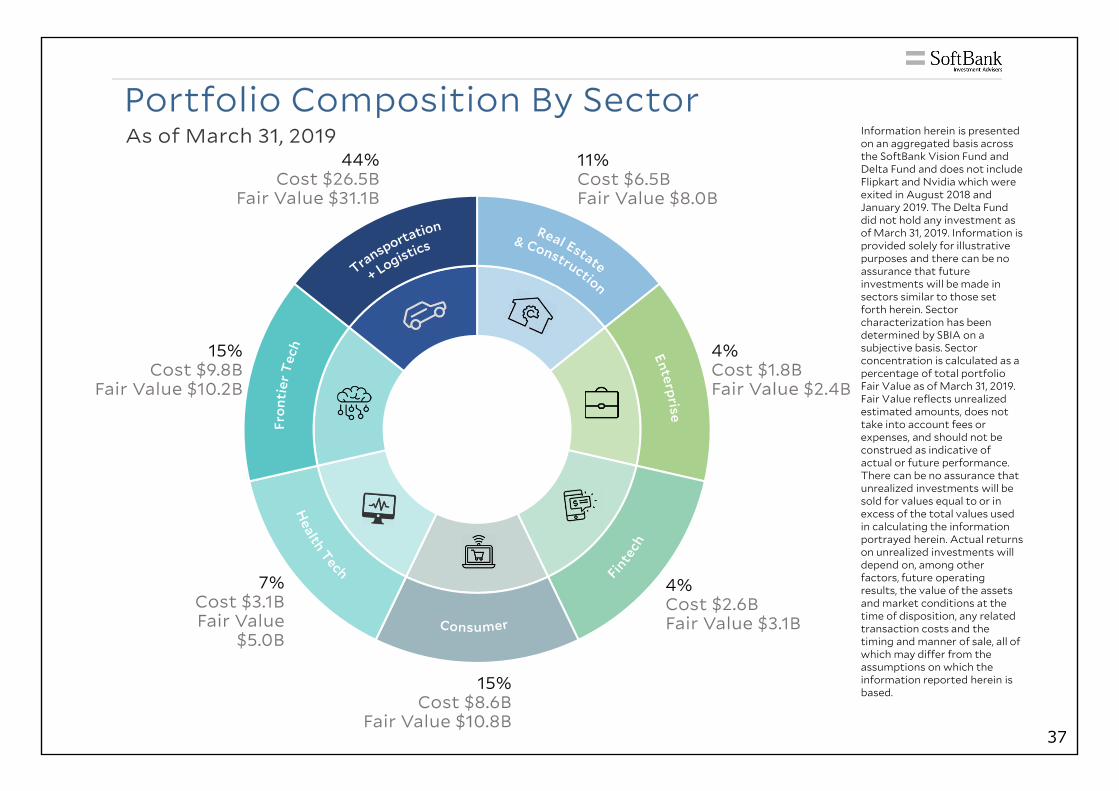
4%Cost $2.6BFair Value $3.1B
4%Cost $1.8BFair Value $2.4B
Portfolio Composition By SectorInformation herein is presented on an aggregated basis across the SoftBank Vision Fund and Delta Fund and does not include Flipkart and Nvidia which were exited in August 2018 and January 2019. The Delta Fund did not hold any investment as of March 31, 2019. Information is provided solely for illustrative purposes and there can be no assurance that future investments will be made in sectors similar to those set forth herein. Sector characterization has been determined by SBIA on a subjective basis. Sector concentration is calculated as a percentage of total portfolio Fair Value as of March 31, 2019. Fair Value reflects unrealized estimated amounts, does not take into account fees or expenses, and should not be construed as indicative of actual or future performance. There can be no assurance that unrealized investments will be sold for values equal to or in excess of the total values used in calculating the information portrayed herein. Actual returns on unrealized investments will depend on, among other factors, future operating results, the value of the assets and market conditions at the time of disposition, any related transaction costs and the timing and manner of sale, all of which may differ from the assumptions on which the information reported herein is based.
As of March 31, 201944%
Cost $26.5BFair Value $31.1B
11%Cost $6.5BFair Value $8.0B
7%Cost $3.1BFair Value
$5.0B
15%Cost $8.6B
Fair Value $10.8B
15%Cost $9.8B
Fair Value $10.2B
37
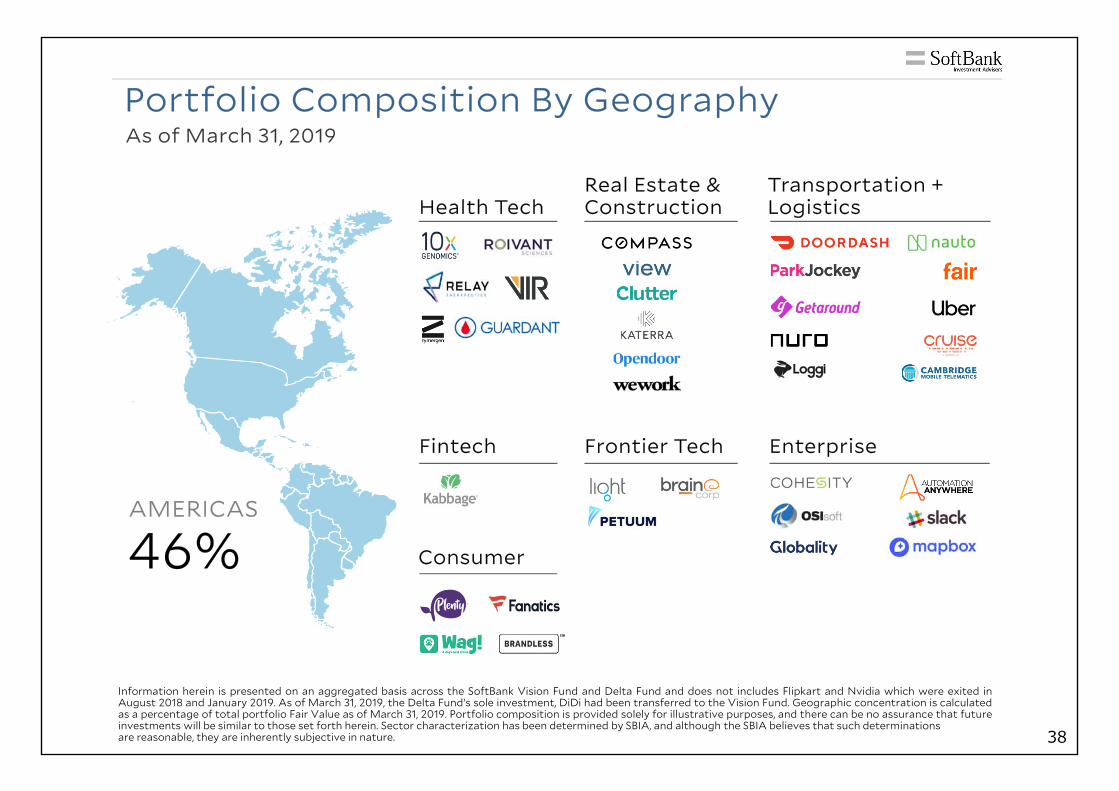
Portfolio Composition By GeographyAs of March 31, 2019
Information herein is presented on an aggregated basis across the SoftBank Vision Fund and Delta Fund and does not includes Flipkart and Nvidia which were exited inAugust 2018 and January 2019. As of March 31, 2019, the Delta Fund’s sole investment, DiDi had been transferred to the Vision Fund. Geographic concentration is calculatedas a percentage of total portfolio Fair Value as of March 31, 2019. Portfolio composition is provided solely for illustrative purposes, and there can be no assurance that futureinvestments will be similar to those set forth herein. Sector characterization has been determined by SBIA, and although the SBIA believes that such determinationsare reasonable, they are inherently subjective in nature.
AMERICAS
46%
Real Estate & Construction
Fintech Frontier Tech
Consumer
Health Tech
Enterprise
Transportation + Logistics
38
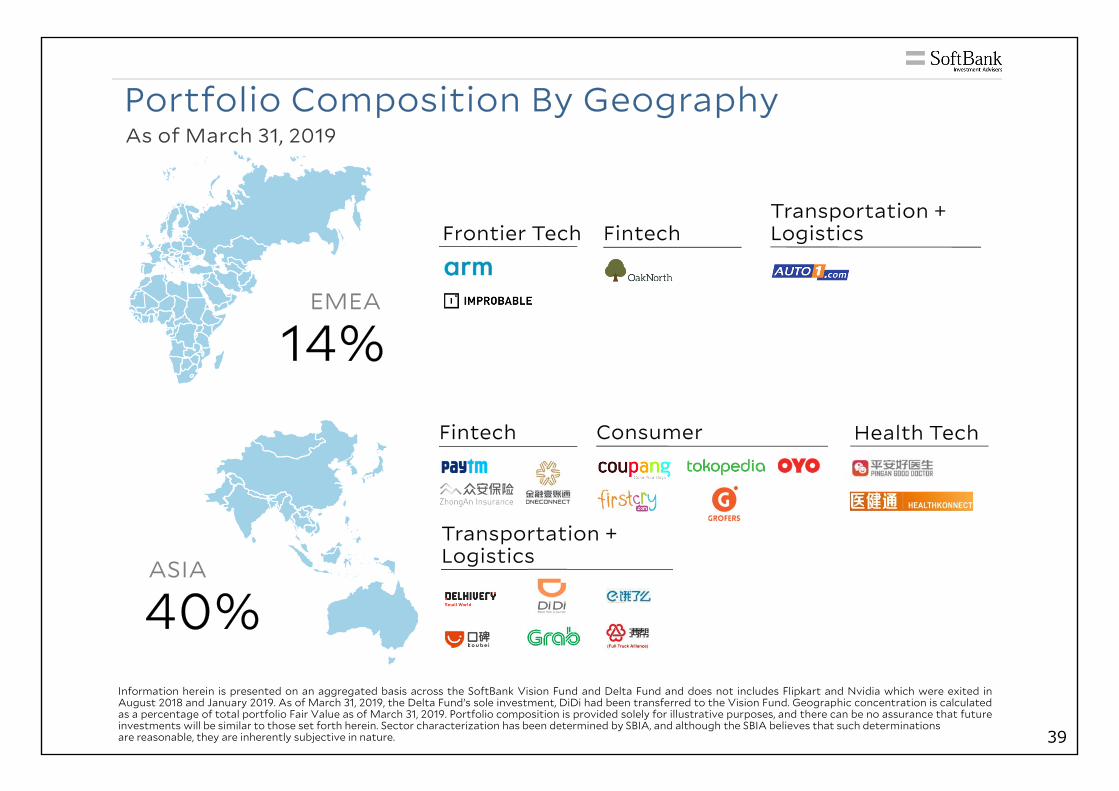
Portfolio Composition By GeographyAs of March 31, 2019
EMEA
14%
ASIA
40%
Frontier Tech FintechTransportation + Logistics
Information herein is presented on an aggregated basis across the SoftBank Vision Fund and Delta Fund and does not includes Flipkart and Nvidia which were exited inAugust 2018 and January 2019. As of March 31, 2019, the Delta Fund’s sole investment, DiDi had been transferred to the Vision Fund. Geographic concentration is calculatedas a percentage of total portfolio Fair Value as of March 31, 2019. Portfolio composition is provided solely for illustrative purposes, and there can be no assurance that futureinvestments will be similar to those set forth herein. Sector characterization has been determined by SBIA, and although the SBIA believes that such determinationsare reasonable, they are inherently subjective in nature.
ConsumerFintech
Transportation + Logistics
Health Tech
39
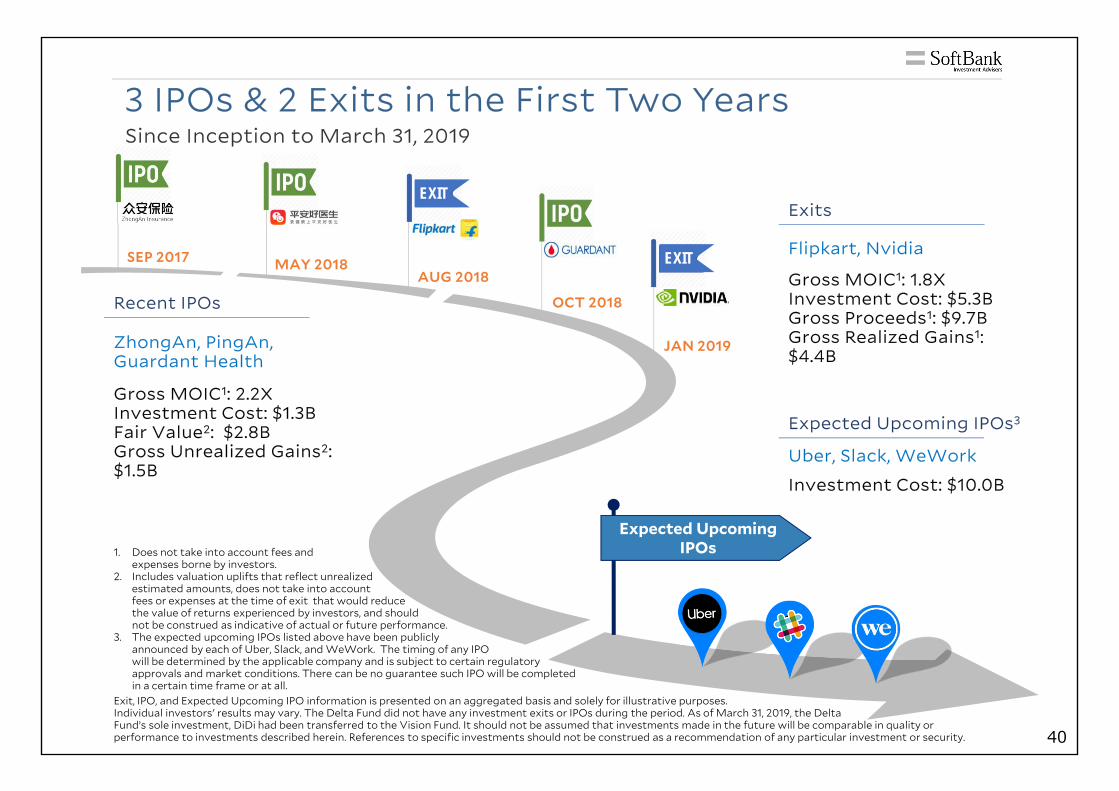
3 IPOs & 2 Exits in the First Two Years
Gross MOIC1: 2.2XInvestment Cost: $1.3BFair Value2: $2.8BGross Unrealized Gains2: $1.5B
ZhongAn, PingAn, Guardant Health
Recent IPOsGross MOIC1: 1.8XInvestment Cost: $5.3BGross Proceeds1: $9.7BGross Realized Gains1: $4.4B
Flipkart, Nvidia
Exits
SEP 2017 MAY 2018AUG 2018
OCT 2018
JAN 2019
Expected Upcoming IPOs
Uber, Slack, WeWork
Expected Upcoming IPOs3
Investment Cost: $10.0B
EXIT
EXIT
Since Inception to March 31, 2019
1. Does not take into account fees and expenses borne by investors.
2. Includes valuation uplifts that reflect unrealized estimated amounts, does not take into account fees or expenses at the time of exit that would reduce the value of returns experienced by investors, and should not be construed as indicative of actual or future performance.
3. The expected upcoming IPOs listed above have been publiclyannounced by each of Uber, Slack, and WeWork. The timing of any IPO will be determined by the applicable company and is subject to certain regulatory approvals and market conditions. There can be no guarantee such IPO will be completed in a certain time frame or at all.
Exit, IPO, and Expected Upcoming IPO information is presented on an aggregated basis and solely for illustrative purposes. Individual investors' results may vary. The Delta Fund did not have any investment exits or IPOs during the period. As of March 31, 2019, the Delta Fund’s sole investment, DiDi had been transferred to the Vision Fund. It should not be assumed that investments made in the future will be comparable in quality or performance to investments described herein. References to specific investments should not be construed as a recommendation of any particular investment or security. 40
Performance & Impact on SoftBank Group
41
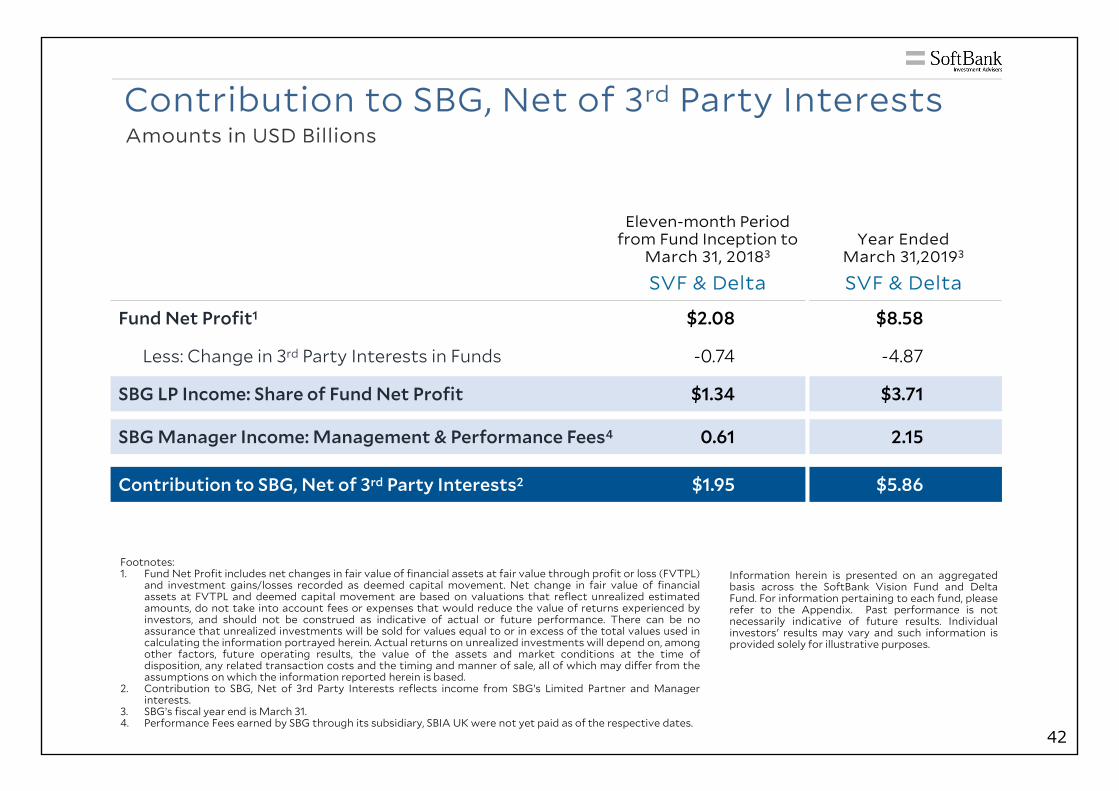
Contribution to SBG, Net of 3rd Party InterestsAmounts in USD Billions
Eleven-month Period from Fund Inception to
March 31, 20183Year Ended
March 31,20193
SVF & Delta SVF & Delta
Fund Net Profit1 $2.08 $8.58
Less: Change in 3rd Party Interests in Funds -0.74 -4.87
SBG LP Income: Share of Fund Net Profit $1.34 $3.71
SBG Manager Income: Management & Performance Fees4 0.61 2.15
Contribution to SBG, Net of 3rd Party Interests2 $1.95 $5.86
Footnotes:1. Fund Net Profit includes net changes in fair value of financial assets at fair value through profit or loss (FVTPL)
and investment gains/losses recorded as deemed capital movement. Net change in fair value of financialassets at FVTPL and deemed capital movement are based on valuations that reflect unrealized estimatedamounts, do not take into account fees or expenses that would reduce the value of returns experienced byinvestors, and should not be construed as indicative of actual or future performance. There can be noassurance that unrealized investments will be sold for values equal to or in excess of the total values used incalculating the information portrayed herein. Actual returns on unrealized investments will depend on, amongother factors, future operating results, the value of the assets and market conditions at the time ofdisposition, any related transaction costs and the timing and manner of sale, all of which may differ from theassumptions on which the information reported herein is based.
2. Contribution to SBG, Net of 3rd Party Interests reflects income from SBG’s Limited Partner and Managerinterests.
3. SBG’s fiscal year end is March 31.4. Performance Fees earned by SBG through its subsidiary, SBIA UK were not yet paid as of the respective dates.
Information herein is presented on an aggregatedbasis across the SoftBank Vision Fund and DeltaFund. For information pertaining to each fund, pleaserefer to the Appendix. Past performance is notnecessarily indicative of future results. Individualinvestors' results may vary and such information isprovided solely for illustrative purposes.
42
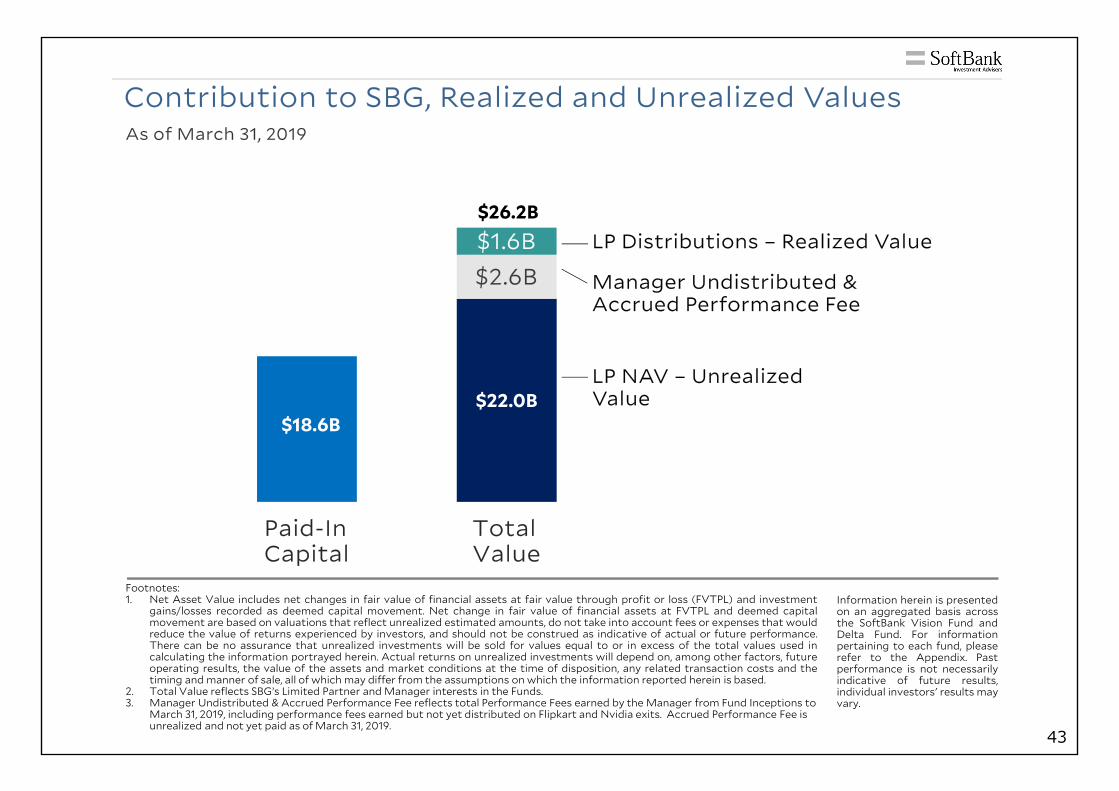
Contribution to SBG, Realized and Unrealized Values
$18.6B$22.0B
$2.6B$1.6B
Paid-InCapital
TotalValue
$26.2B
Manager Undistributed & Accrued Performance Fee
LP Distributions – Realized Value
LP NAV – Unrealized Value
Footnotes:1. Net Asset Value includes net changes in fair value of financial assets at fair value through profit or loss (FVTPL) and investment
gains/losses recorded as deemed capital movement. Net change in fair value of financial assets at FVTPL and deemed capitalmovement are based on valuations that reflect unrealized estimated amounts, do not take into account fees or expenses that wouldreduce the value of returns experienced by investors, and should not be construed as indicative of actual or future performance.There can be no assurance that unrealized investments will be sold for values equal to or in excess of the total values used incalculating the information portrayed herein. Actual returns on unrealized investments will depend on, among other factors, futureoperating results, the value of the assets and market conditions at the time of disposition, any related transaction costs and thetiming and manner of sale, all of which may differ from the assumptions on which the information reported herein is based.
2. Total Value reflects SBG’s Limited Partner and Manager interests in the Funds.3. Manager Undistributed & Accrued Performance Fee reflects total Performance Fees earned by the Manager from Fund Inceptions to
March 31, 2019, including performance fees earned but not yet distributed on Flipkart and Nvidia exits. Accrued Performance Fee is unrealized and not yet paid as of March 31, 2019.
Information herein is presentedon an aggregated basis acrossthe SoftBank Vision Fund andDelta Fund. For informationpertaining to each fund, pleaserefer to the Appendix. Pastperformance is not necessarilyindicative of future results,individual investors' results mayvary.
As of March 31, 2019
43
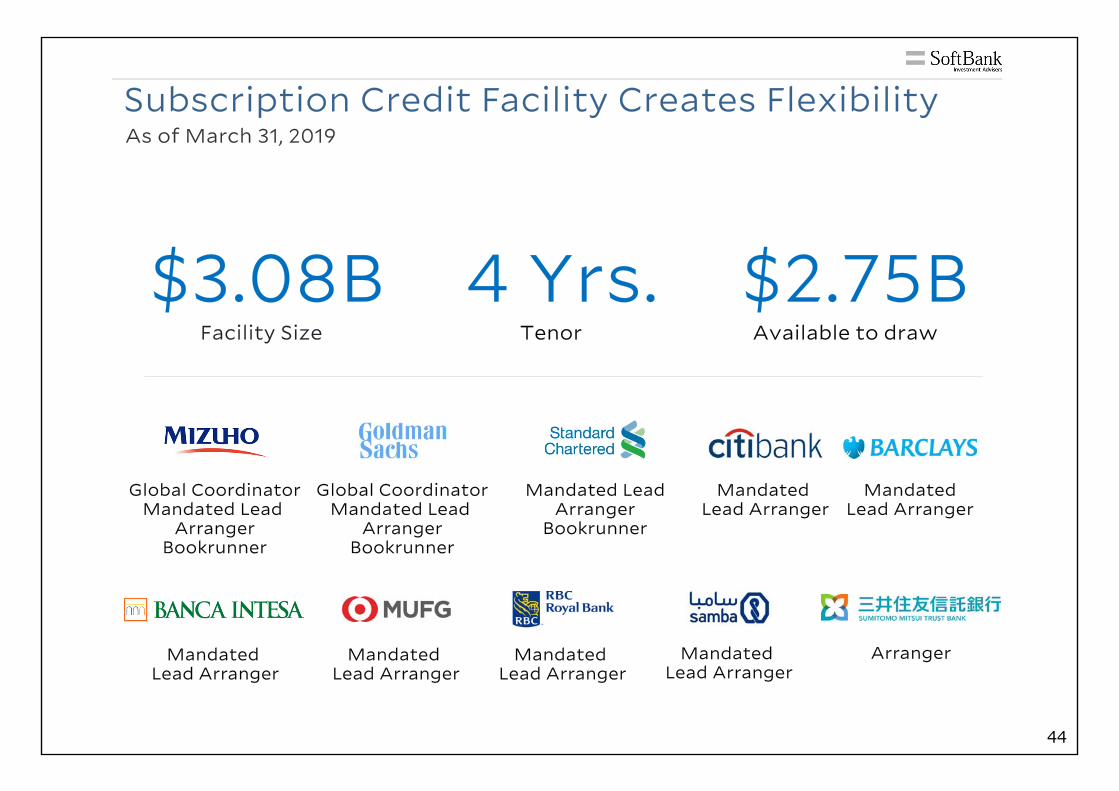
Tenor Available to draw
Mandated Lead Arranger
Mandated Lead Arranger
Mandated Lead Arranger
Mandated Lead Arranger
Mandated Lead Arranger
Mandated Lead Arranger
Mandated Lead Arranger
Bookrunner
Global CoordinatorMandated Lead
ArrangerBookrunner
Subscription Credit Facility Creates FlexibilityAs of March 31, 2019
Facility Size
$2.75B4 Yrs.$3.08B
Arranger
Global CoordinatorMandated Lead
ArrangerBookrunner
44
In Focus: Investment & Valuation Processes
45
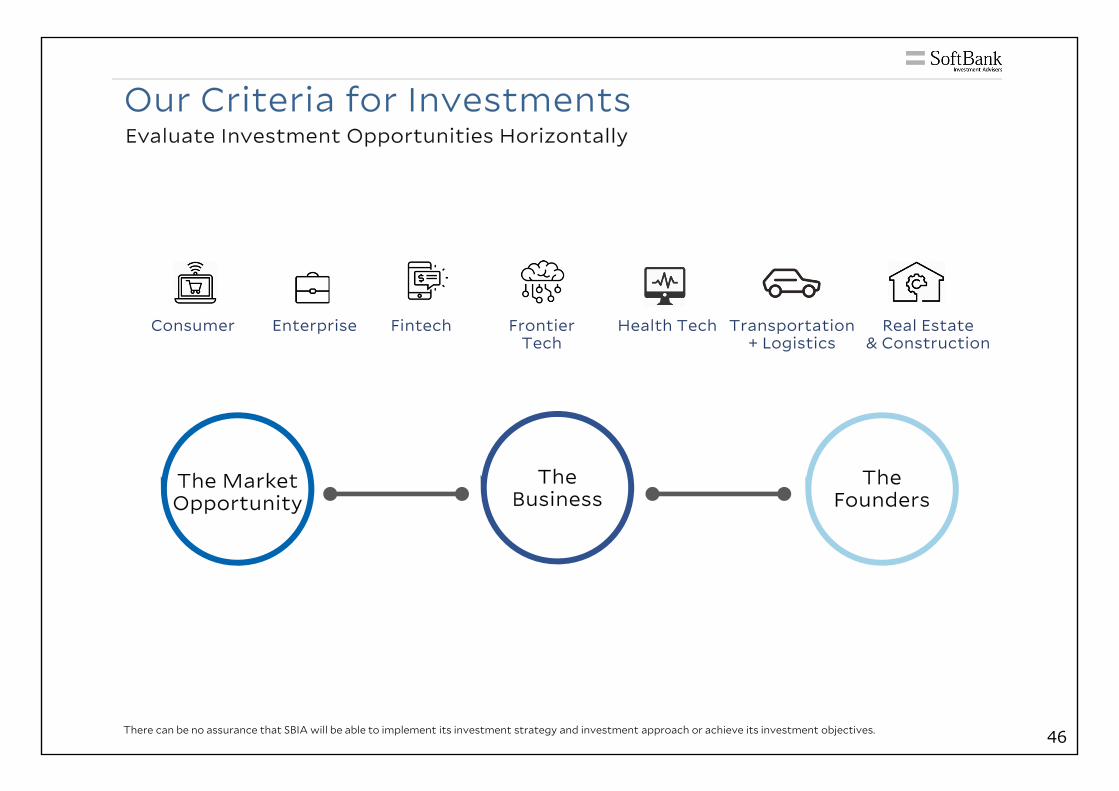
There can be no assurance that SBIA will be able to implement its investment strategy and investment approach or achieve its investment objectives.
Our Criteria for Investments
The Market Opportunity
The Business
The Founders
Frontier Tech
Consumer Health Tech Real Estate & Construction
Transportation+ Logistics
FintechEnterprise
Evaluate Investment Opportunities Horizontally
46
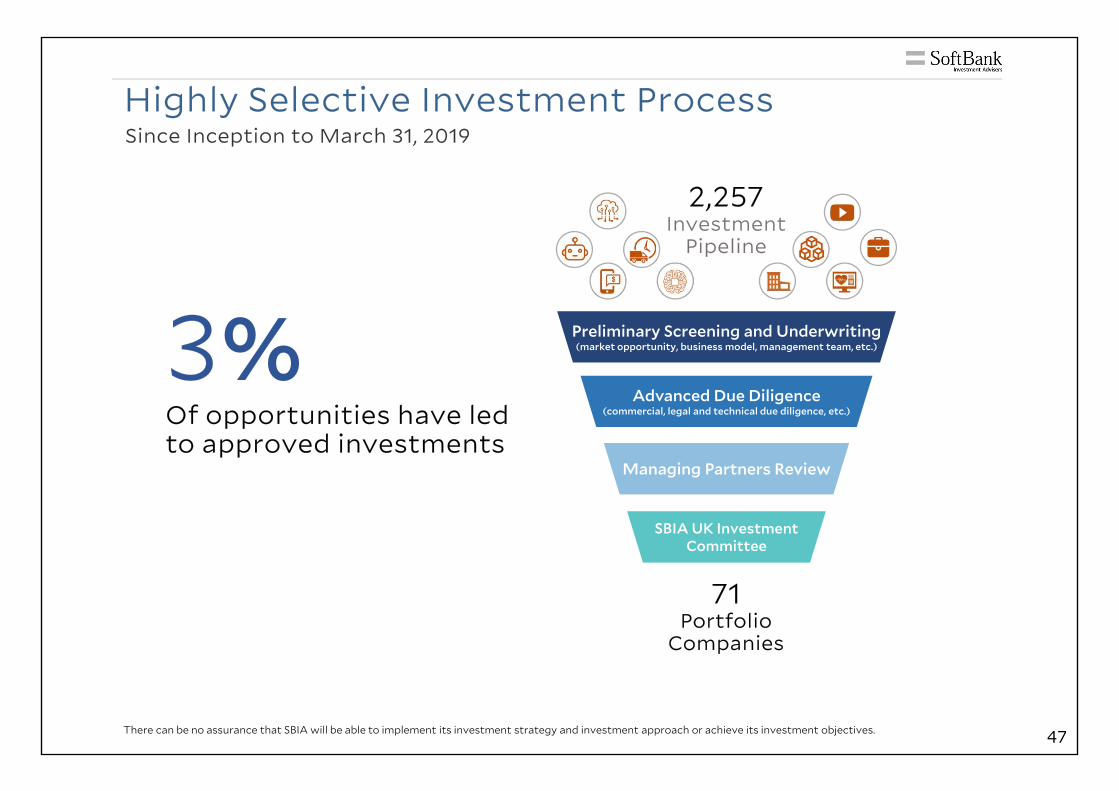
There can be no assurance that SBIA will be able to implement its investment strategy and investment approach or achieve its investment objectives.
Highly Selective Investment Process
Preliminary Screening and Underwriting(market opportunity, business model, management team, etc.)
Advanced Due Diligence(commercial, legal and technical due diligence, etc.)
Managing Partners Review
SBIA UK Investment Committee
2,257Investment
Pipeline
71Portfolio
Companies
3%Of opportunities have led to approved investments
Since Inception to March 31, 2019
47
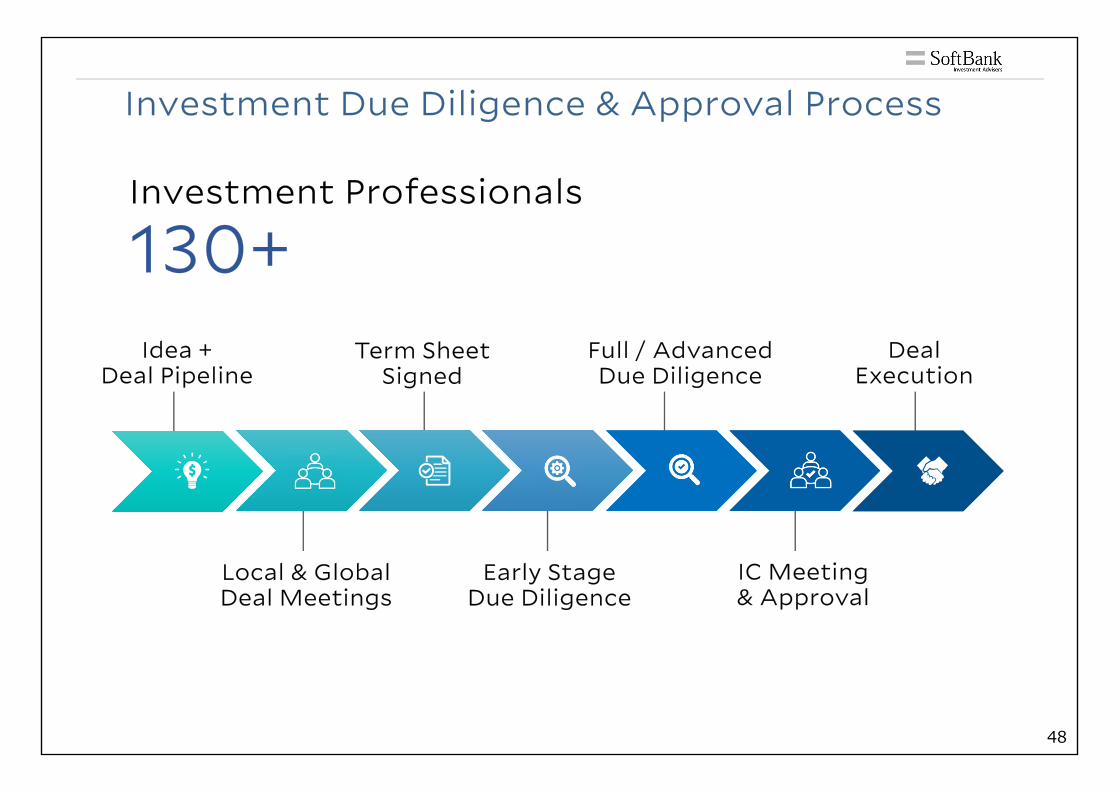
Investment Due Diligence & Approval Process
Investment Professionals
130+Idea +
Deal PipelineTerm Sheet
SignedFull / AdvancedDue Diligence
Local & GlobalDeal Meetings
Early StageDue Diligence
IC Meeting & Approval
Deal Execution
48
Valuation Process
49
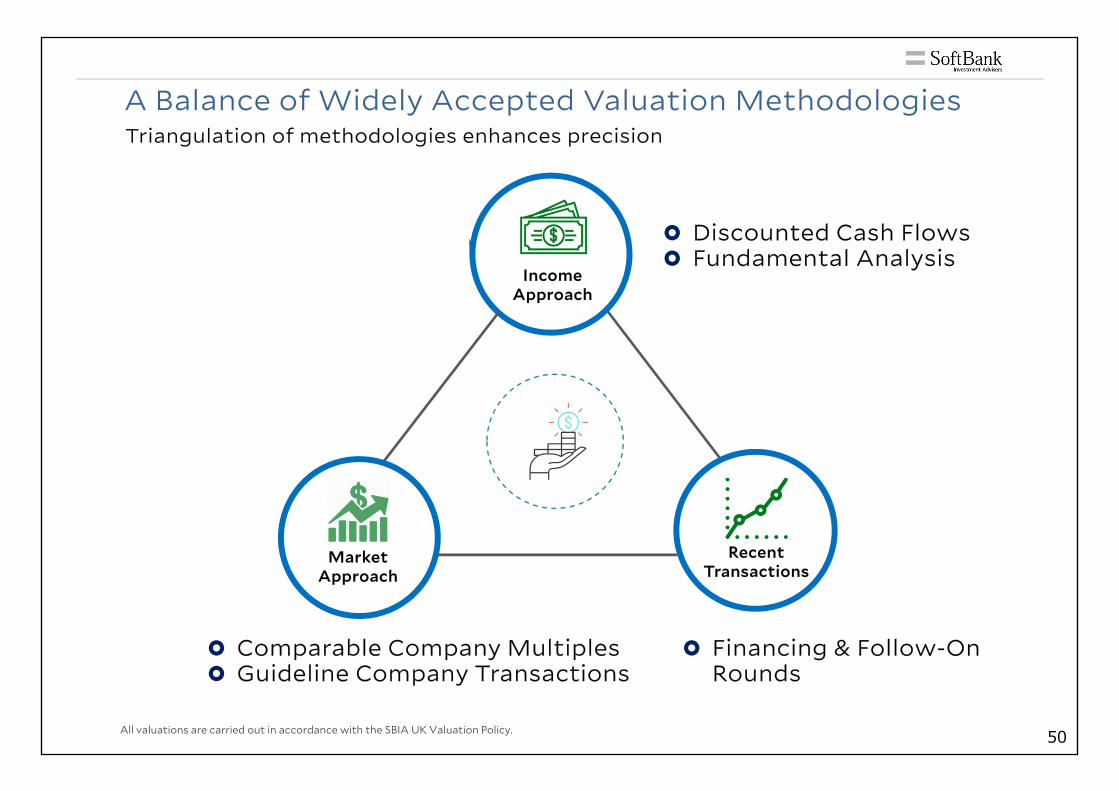
A Balance of Widely Accepted Valuation Methodologies
Income Approach
Discounted Cash Flows Fundamental Analysis
Market Approach
Comparable Company Multiples Guideline Company Transactions
Financing & Follow-On Rounds
RecentTransactions
Triangulation of methodologies enhances precision
All valuations are carried out in accordance with the SBIA UK Valuation Policy. 50
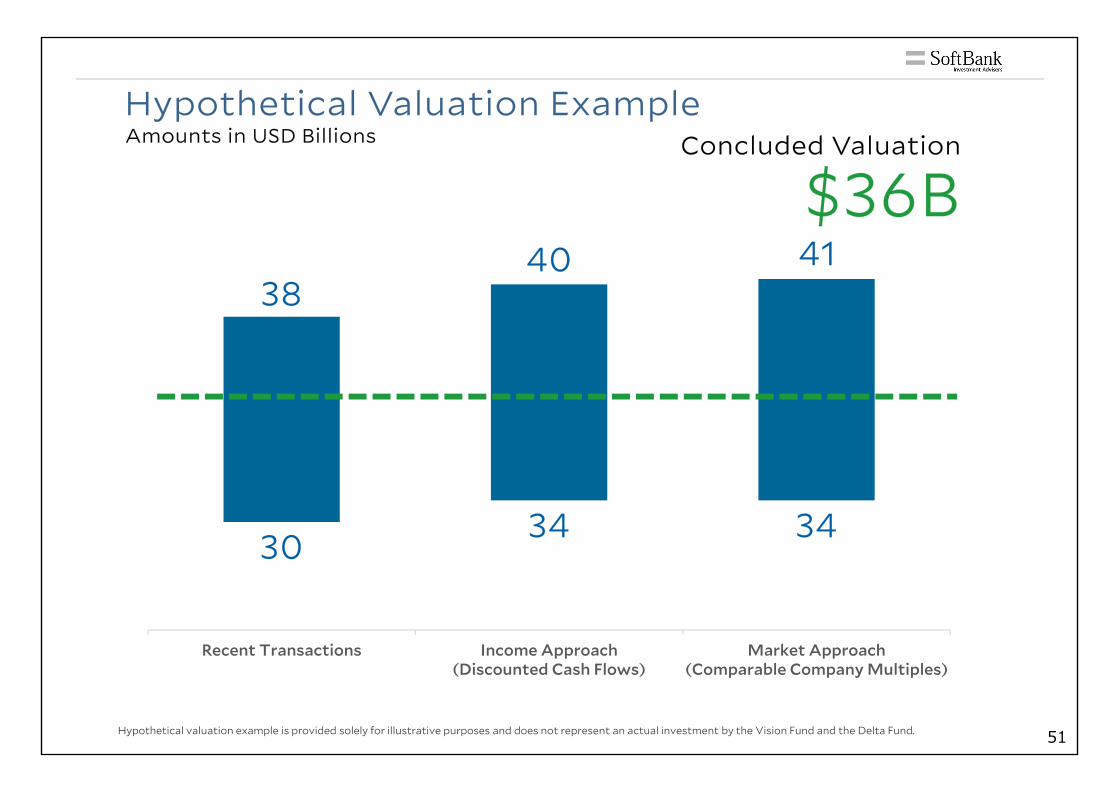
Amounts in USD Billions
30 34 34
Recent Transactions Income Approach(Discounted Cash Flows)
Market Approach(Comparable Company Multiples)
3840 41
Concluded Valuation
$36BHypothetical Valuation Example
Hypothetical valuation example is provided solely for illustrative purposes and does not represent an actual investment by the Vision Fund and the Delta Fund. 51
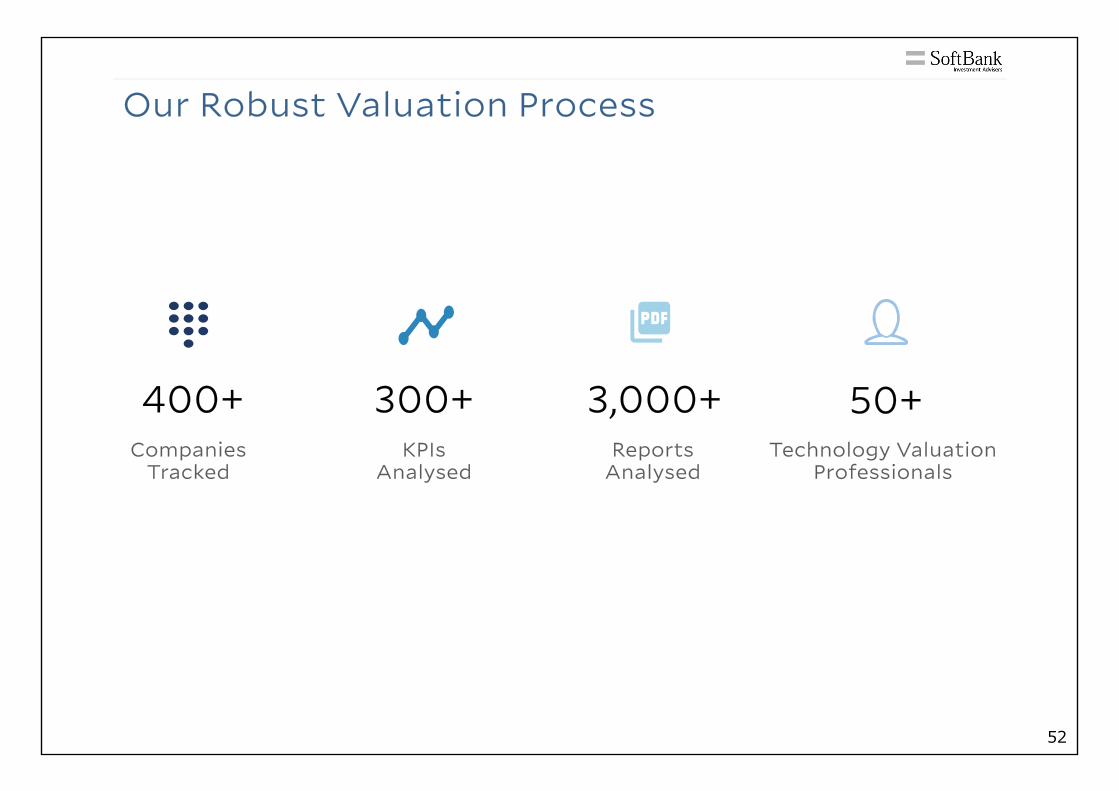
400+ 300+ 3,000+ 50+Companies
TrackedKPIs
AnalysedReports
AnalysedTechnology Valuation
Professionals
Our Robust Valuation Process
52
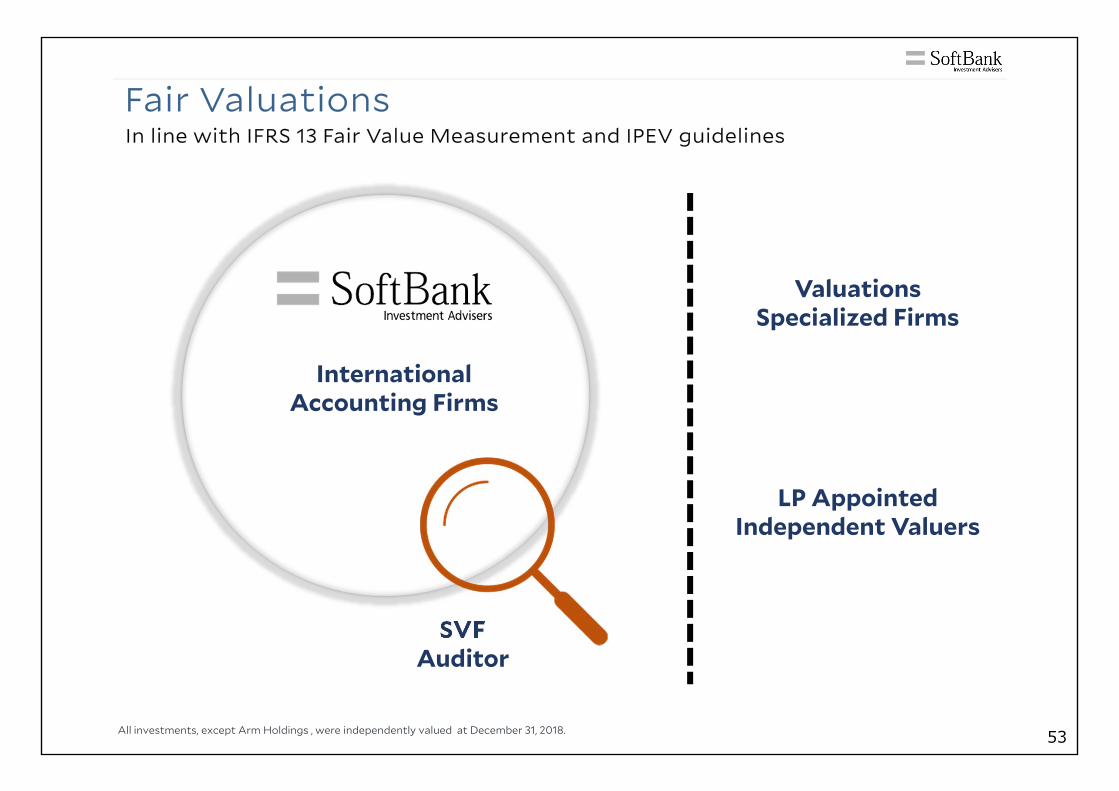
SVFAuditor
InternationalAccounting Firms
LP Appointed Independent Valuers
Fair ValuationsIn line with IFRS 13 Fair Value Measurement and IPEV guidelines
All investments, except Arm Holdings , were independently valued at December 31, 2018.
ValuationsSpecialized Firms
53
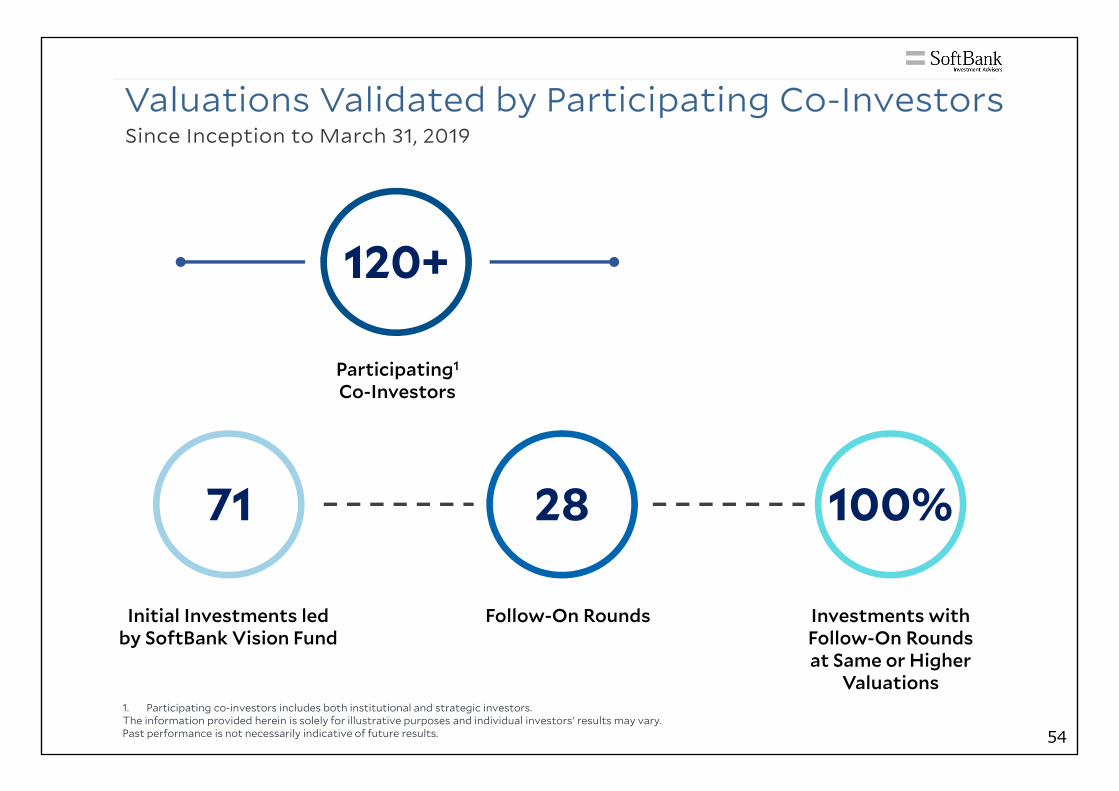
Valuations Validated by Participating Co-InvestorsSince Inception to March 31, 2019
Participating1
Co-Investors
1. Participating co-investors includes both institutional and strategic investors.The information provided herein is solely for illustrative purposes and individual investors' results may vary. Past performance is not necessarily indicative of future results.
Initial Investments led by SoftBank Vision Fund
Investments with Follow-On Rounds at Same or Higher
Valuations
71
Follow-On Rounds
28 100%
120+
54
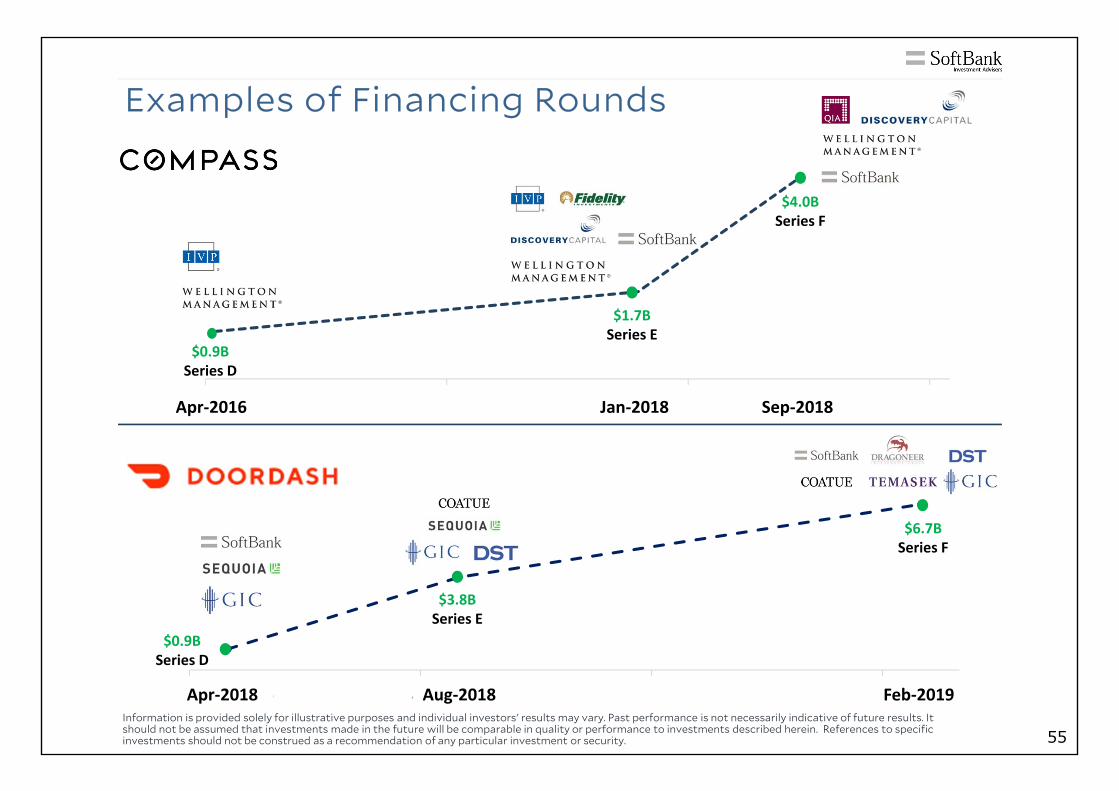
Examples of Financing Rounds
Apr-2016 Apr-2017 Apr-2018 Apr-2019
$0.9BSeries D
$1.7BSeries E
$4.0BSeries F
Information is provided solely for illustrative purposes and individual investors' results may vary. Past performance is not necessarily indicative of future results. It should not be assumed that investments made in the future will be comparable in quality or performance to investments described herein. References to specific investments should not be construed as a recommendation of any particular investment or security.
Jun-2018 Sep-2018 Dec-2018 Mar-2019
$0.9BSeries D
$3.8BSeries E
$6.7BSeries F
Apr‐2018 Aug‐2018 Feb‐2019
Apr‐2016 Jan‐2018 Sep‐2018
55
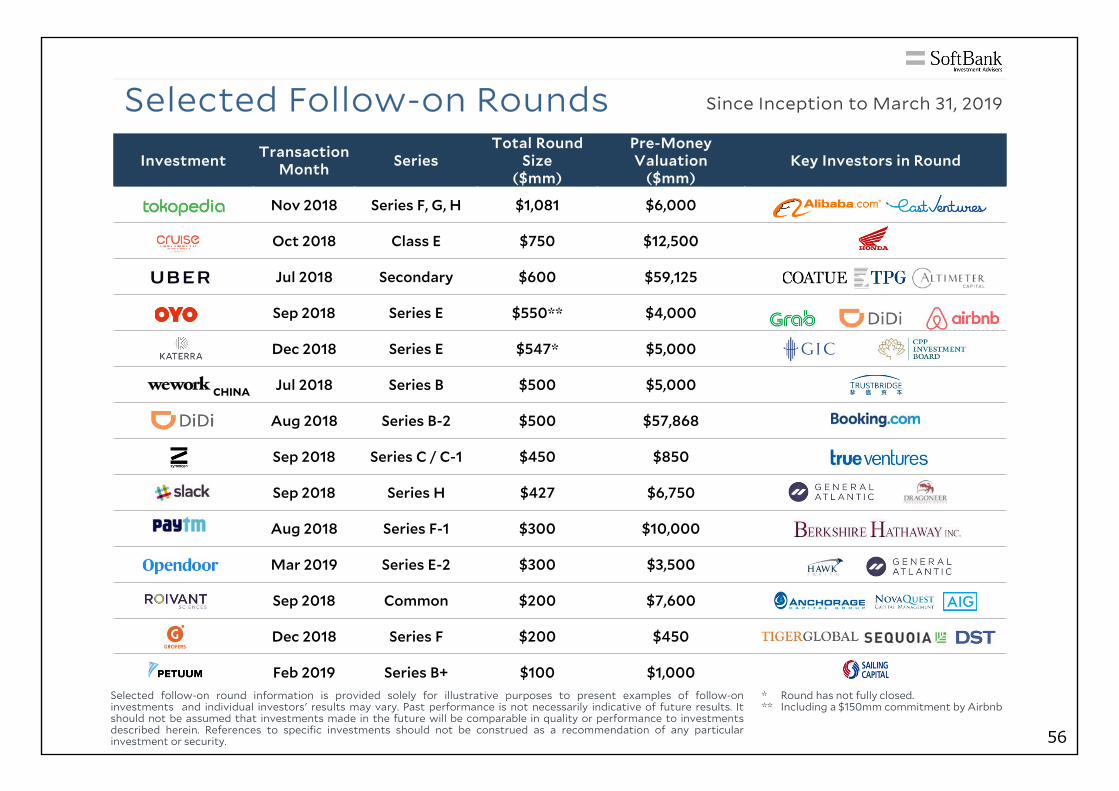
Investment Transaction Month Series
Total Round Size
($mm)
Pre-Money Valuation
($mm)Key Investors in Round
Nov 2018 Series F, G, H $1,081 $6,000
Oct 2018 Class E $750 $12,500
Jul 2018 Secondary $600 $59,125
Sep 2018 Series E $550** $4,000
Dec 2018 Series E $547* $5,000
Jul 2018 Series B $500 $5,000
Aug 2018 Series B-2 $500 $57,868
Sep 2018 Series C / C-1 $450 $850
Sep 2018 Series H $427 $6,750
Aug 2018 Series F-1 $300 $10,000
Mar 2019 Series E-2 $300 $3,500
Sep 2018 Common $200 $7,600
Dec 2018 Series F $200 $450
Feb 2019 Series B+ $100 $1,000
Selected Follow-on Rounds
* Round has not fully closed.** Including a $150mm commitment by Airbnb
Since Inception to March 31, 2019
CHINA
Selected follow-on round information is provided solely for illustrative purposes to present examples of follow-oninvestments and individual investors' results may vary. Past performance is not necessarily indicative of future results. Itshould not be assumed that investments made in the future will be comparable in quality or performance to investmentsdescribed herein. References to specific investments should not be construed as a recommendation of any particularinvestment or security. 56
Wrap-Up
1. Progress & Highlights
2. Performance & Impact on SoftBank Group
3. In Focus: Investment & Valuation Processes
57
Thank You
58
Appendix
59
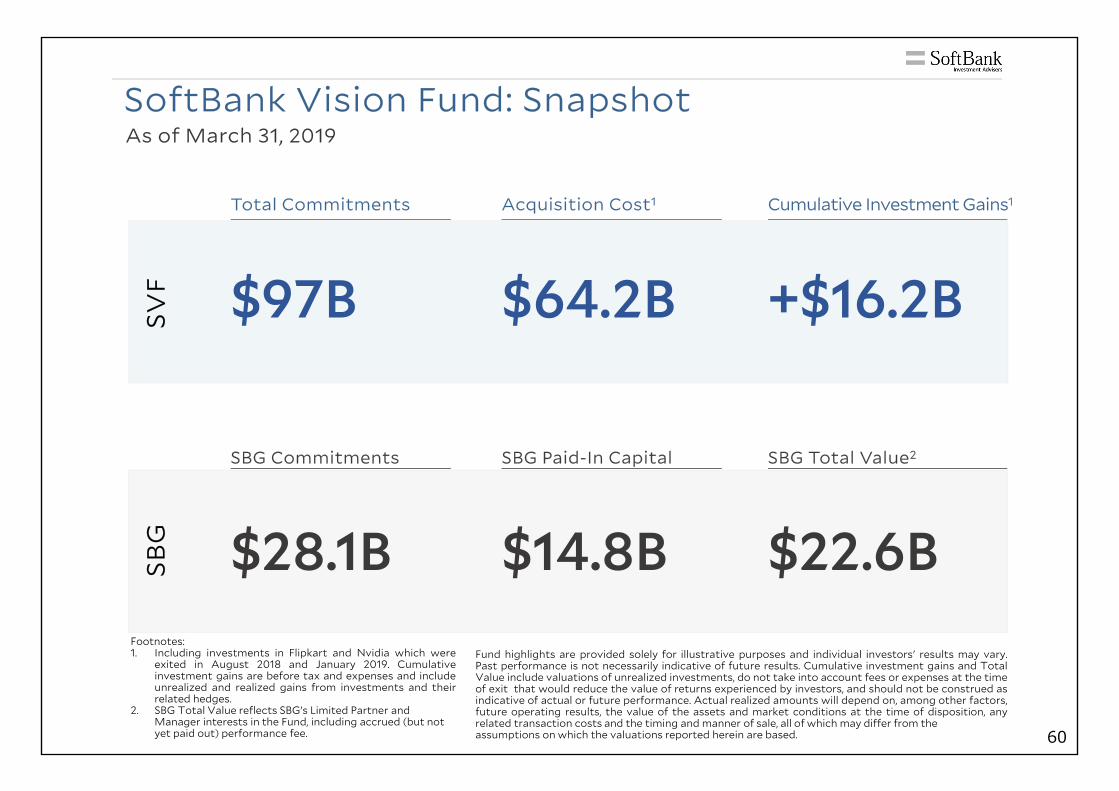
SoftBank Vision Fund: SnapshotAs of March 31, 2019
SVF
SBG
Total Commitments Acquisition Cost1 Cumulative Investment Gains1
SBG Commitments SBG Paid-In Capital SBG Total Value2
$97B $64.2B +$16.2B
$28.1B $14.8B $22.6BFootnotes:1. Including investments in Flipkart and Nvidia which were
exited in August 2018 and January 2019. Cumulativeinvestment gains are before tax and expenses and includeunrealized and realized gains from investments and theirrelated hedges.
2. SBG Total Value reflects SBG’s Limited Partner and Manager interests in the Fund, including accrued (but not yet paid out) performance fee.
Fund highlights are provided solely for illustrative purposes and individual investors' results may vary.Past performance is not necessarily indicative of future results. Cumulative investment gains and TotalValue include valuations of unrealized investments, do not take into account fees or expenses at the timeof exit that would reduce the value of returns experienced by investors, and should not be construed asindicative of actual or future performance. Actual realized amounts will depend on, among other factors,future operating results, the value of the assets and market conditions at the time of disposition, anyrelated transaction costs and the timing and manner of sale, all of which may differ from theassumptions on which the valuations reported herein are based. 60
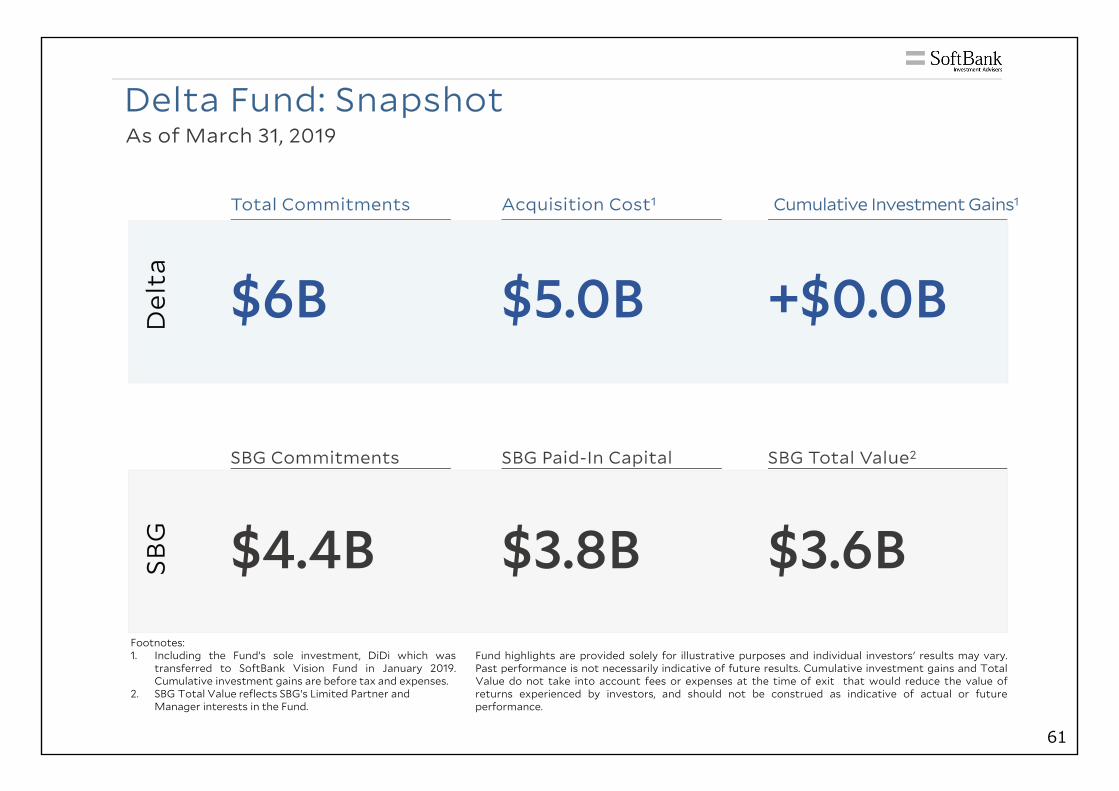
Delta Fund: SnapshotAs of March 31, 2019
Del
taSB
G
Total Commitments Acquisition Cost1 Cumulative Investment Gains1
SBG Commitments SBG Paid-In Capital SBG Total Value2
$6B $5.0B +$0.0B
$4.4B $3.8B $3.6BFootnotes:1. Including the Fund’s sole investment, DiDi which was
transferred to SoftBank Vision Fund in January 2019.Cumulative investment gains are before tax and expenses.
2. SBG Total Value reflects SBG’s Limited Partner and Manager interests in the Fund.
Fund highlights are provided solely for illustrative purposes and individual investors' results may vary.Past performance is not necessarily indicative of future results. Cumulative investment gains and TotalValue do not take into account fees or expenses at the time of exit that would reduce the value ofreturns experienced by investors, and should not be construed as indicative of actual or futureperformance.
61
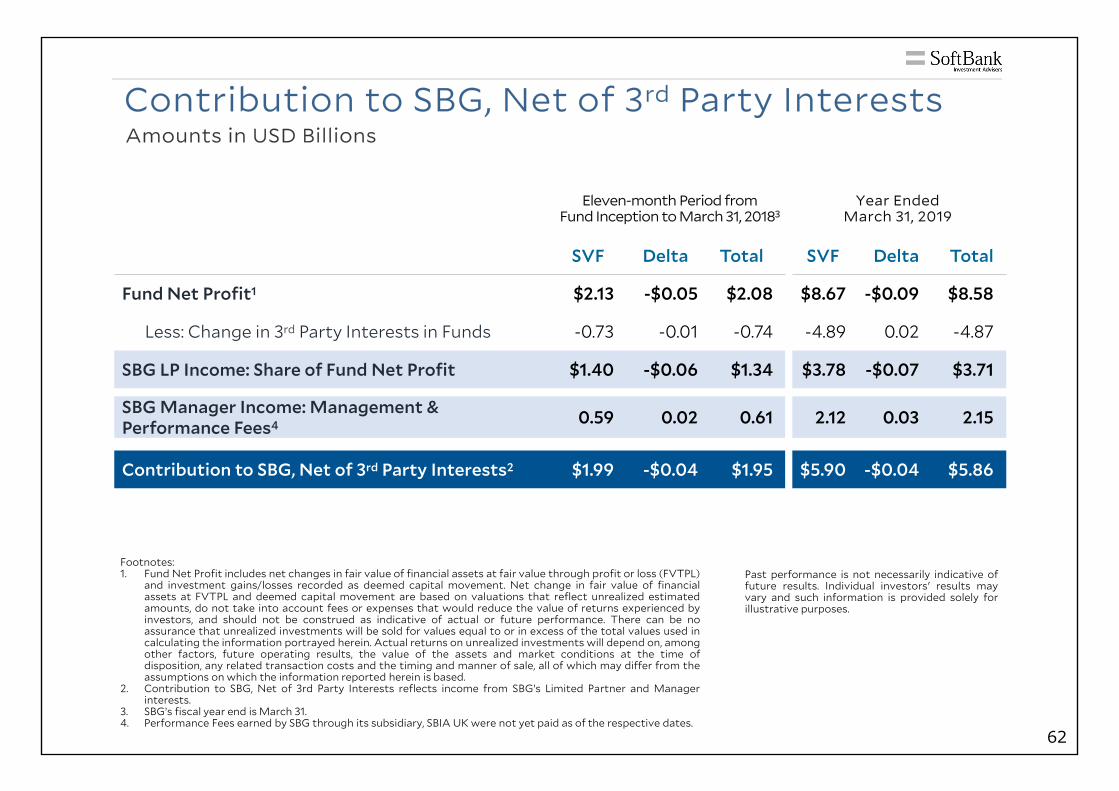
Contribution to SBG, Net of 3rd Party InterestsAmounts in USD Billions
Past performance is not necessarily indicative offuture results. Individual investors' results mayvary and such information is provided solely forillustrative purposes.
Eleven-month Period from Fund Inception to March 31, 20183
Year Ended March 31, 2019
SVF Delta Total SVF Delta Total
Fund Net Profit1 $2.13 -$0.05 $2.08 $8.67 -$0.09 $8.58
Less: Change in 3rd Party Interests in Funds -0.73 -0.01 -0.74 -4.89 0.02 -4.87
SBG LP Income: Share of Fund Net Profit $1.40 -$0.06 $1.34 $3.78 -$0.07 $3.71
SBG Manager Income: Management & Performance Fees4 0.59 0.02 0.61 2.12 0.03 2.15
Contribution to SBG, Net of 3rd Party Interests2 $1.99 -$0.04 $1.95 $5.90 -$0.04 $5.86
Footnotes:1. Fund Net Profit includes net changes in fair value of financial assets at fair value through profit or loss (FVTPL)
and investment gains/losses recorded as deemed capital movement. Net change in fair value of financialassets at FVTPL and deemed capital movement are based on valuations that reflect unrealized estimatedamounts, do not take into account fees or expenses that would reduce the value of returns experienced byinvestors, and should not be construed as indicative of actual or future performance. There can be noassurance that unrealized investments will be sold for values equal to or in excess of the total values used incalculating the information portrayed herein. Actual returns on unrealized investments will depend on, amongother factors, future operating results, the value of the assets and market conditions at the time ofdisposition, any related transaction costs and the timing and manner of sale, all of which may differ from theassumptions on which the information reported herein is based.
2. Contribution to SBG, Net of 3rd Party Interests reflects income from SBG’s Limited Partner and Managerinterests.
3. SBG’s fiscal year end is March 31.4. Performance Fees earned by SBG through its subsidiary, SBIA UK were not yet paid as of the respective dates.
62
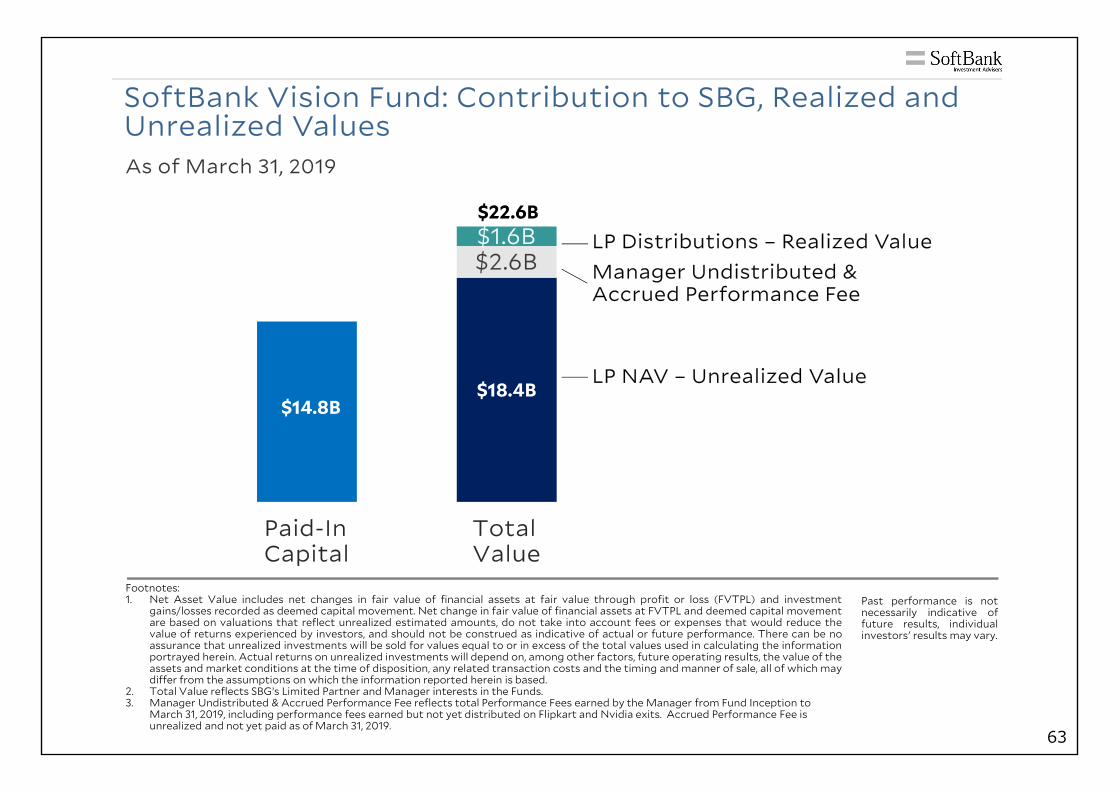
SoftBank Vision Fund: Contribution to SBG, Realized and Unrealized Values
$14.8B$18.4B
$2.6B$1.6B
Paid-InCapital
TotalValue
$22.6B
Manager Undistributed & Accrued Performance Fee
LP Distributions – Realized Value
LP NAV – Unrealized Value
Past performance is notnecessarily indicative offuture results, individualinvestors' results may vary.
As of March 31, 2019
Footnotes:1. Net Asset Value includes net changes in fair value of financial assets at fair value through profit or loss (FVTPL) and investment
gains/losses recorded as deemed capital movement. Net change in fair value of financial assets at FVTPL and deemed capital movementare based on valuations that reflect unrealized estimated amounts, do not take into account fees or expenses that would reduce thevalue of returns experienced by investors, and should not be construed as indicative of actual or future performance. There can be noassurance that unrealized investments will be sold for values equal to or in excess of the total values used in calculating the informationportrayed herein. Actual returns on unrealized investments will depend on, among other factors, future operating results, the value of theassets and market conditions at the time of disposition, any related transaction costs and the timing and manner of sale, all of which maydiffer from the assumptions on which the information reported herein is based.
2. Total Value reflects SBG’s Limited Partner and Manager interests in the Funds.3. Manager Undistributed & Accrued Performance Fee reflects total Performance Fees earned by the Manager from Fund Inception to
March 31, 2019, including performance fees earned but not yet distributed on Flipkart and Nvidia exits. Accrued Performance Fee is unrealized and not yet paid as of March 31, 2019.
63
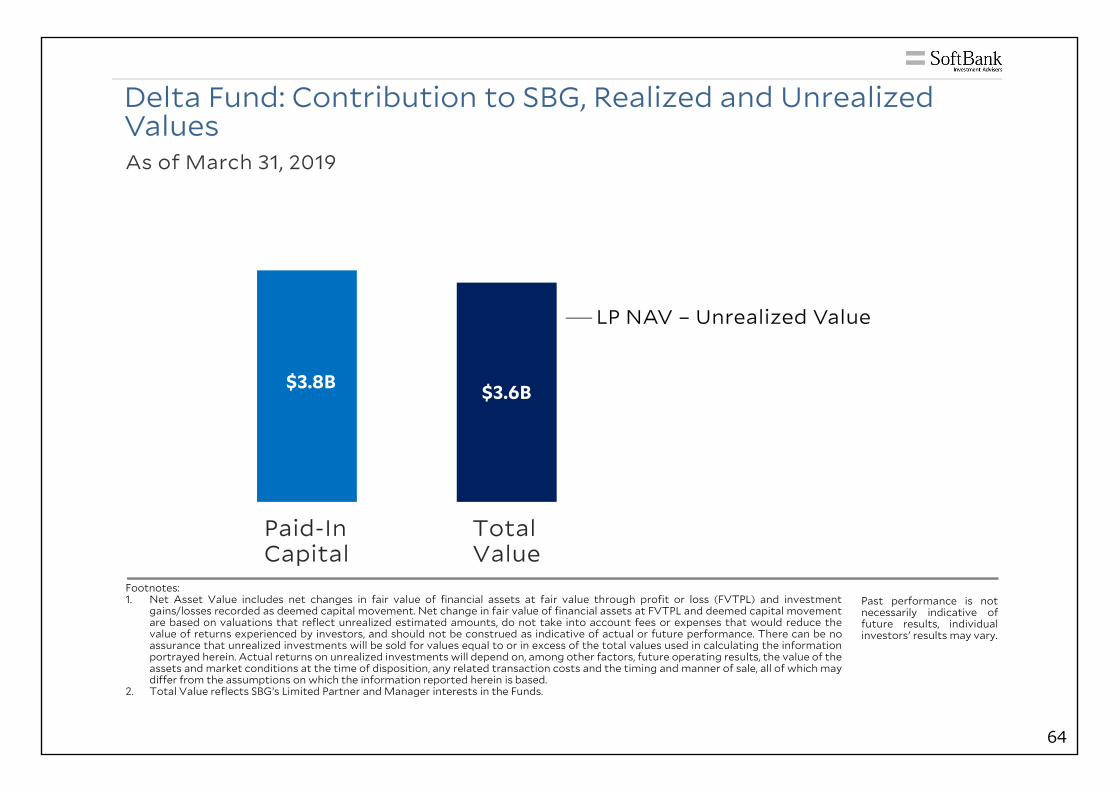
Delta Fund: Contribution to SBG, Realized and Unrealized Values
$3.8B $3.6B
Paid-InCapital
TotalValue
LP NAV – Unrealized Value
Past performance is notnecessarily indicative offuture results, individualinvestors' results may vary.
Footnotes:1. Net Asset Value includes net changes in fair value of financial assets at fair value through profit or loss (FVTPL) and investment
gains/losses recorded as deemed capital movement. Net change in fair value of financial assets at FVTPL and deemed capital movementare based on valuations that reflect unrealized estimated amounts, do not take into account fees or expenses that would reduce thevalue of returns experienced by investors, and should not be construed as indicative of actual or future performance. There can be noassurance that unrealized investments will be sold for values equal to or in excess of the total values used in calculating the informationportrayed herein. Actual returns on unrealized investments will depend on, among other factors, future operating results, the value of theassets and market conditions at the time of disposition, any related transaction costs and the timing and manner of sale, all of which maydiffer from the assumptions on which the information reported herein is based.
2. Total Value reflects SBG’s Limited Partner and Manager interests in the Funds.
As of March 31, 2019
64

財務編
本財務編では、ソフトバンク㈱の略称としてSBKKを、ソフトバンク・ビジョン・ファンドの略称としてSVFをそれぞれ使⽤します
65
66
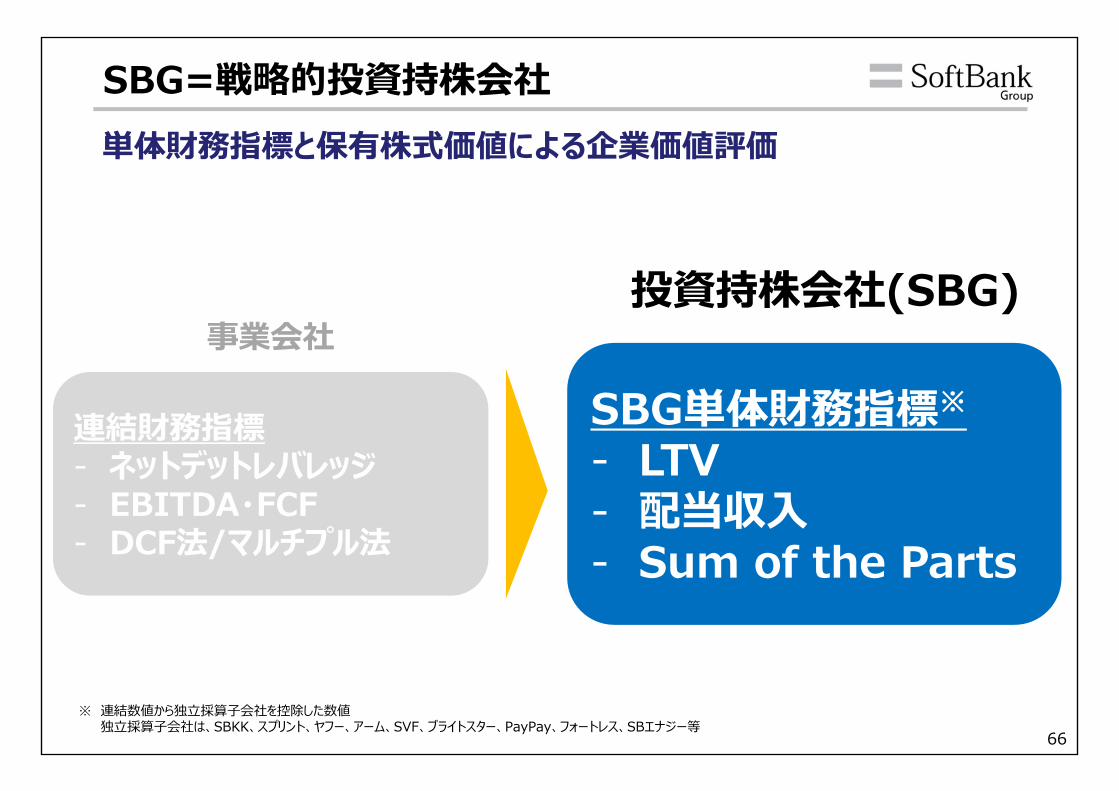
単体財務指標と保有株式価値による企業価値評価
SBG=戦略的投資持株会社
連結財務指標- ネットデットレバレッジ- EBITDA・FCF- DCF法/マルチプル法
SBG単体財務指標※
- LTV- 配当収⼊- Sum of the Parts
投資持株会社(SBG)事業会社
※ 連結数値から独⽴採算⼦会社を控除した数値独⽴採算⼦会社は、SBKK、スプリント、ヤフー、アーム、SVF、ブライトスター、PayPay、フォートレス、SBエナジー等
67
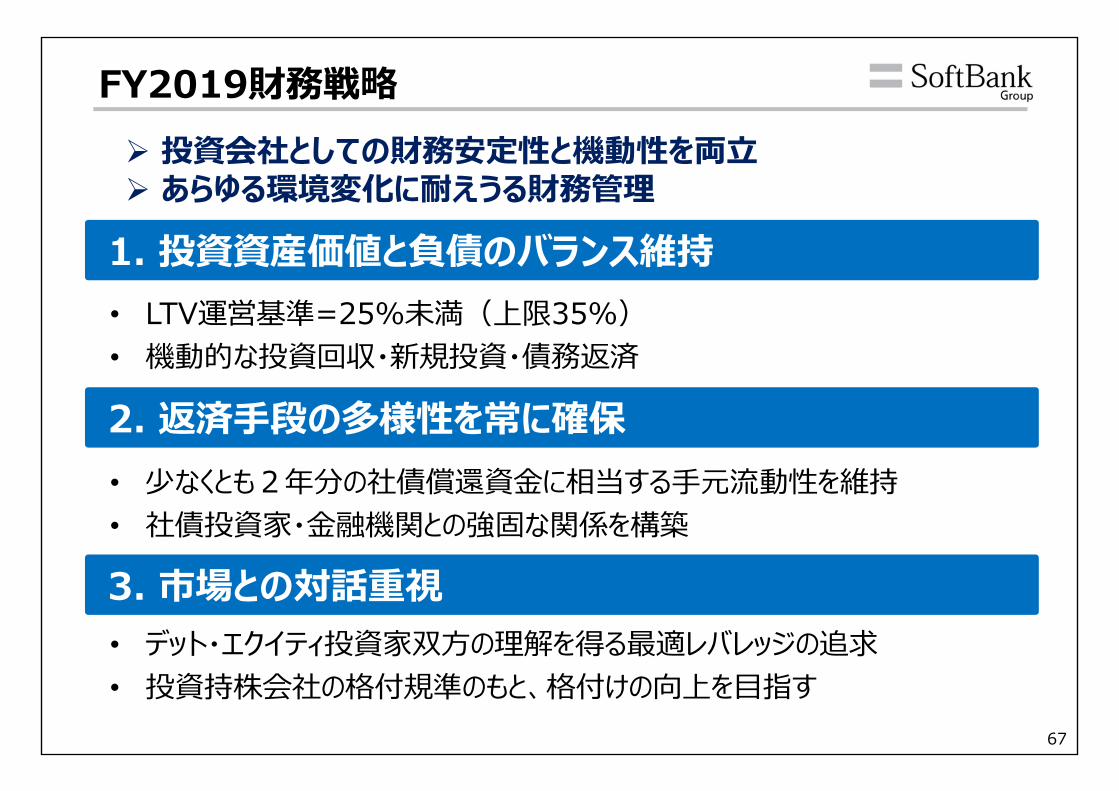
投資会社としての財務安定性と機動性を両⽴ あらゆる環境変化に耐えうる財務管理
FY2019財務戦略
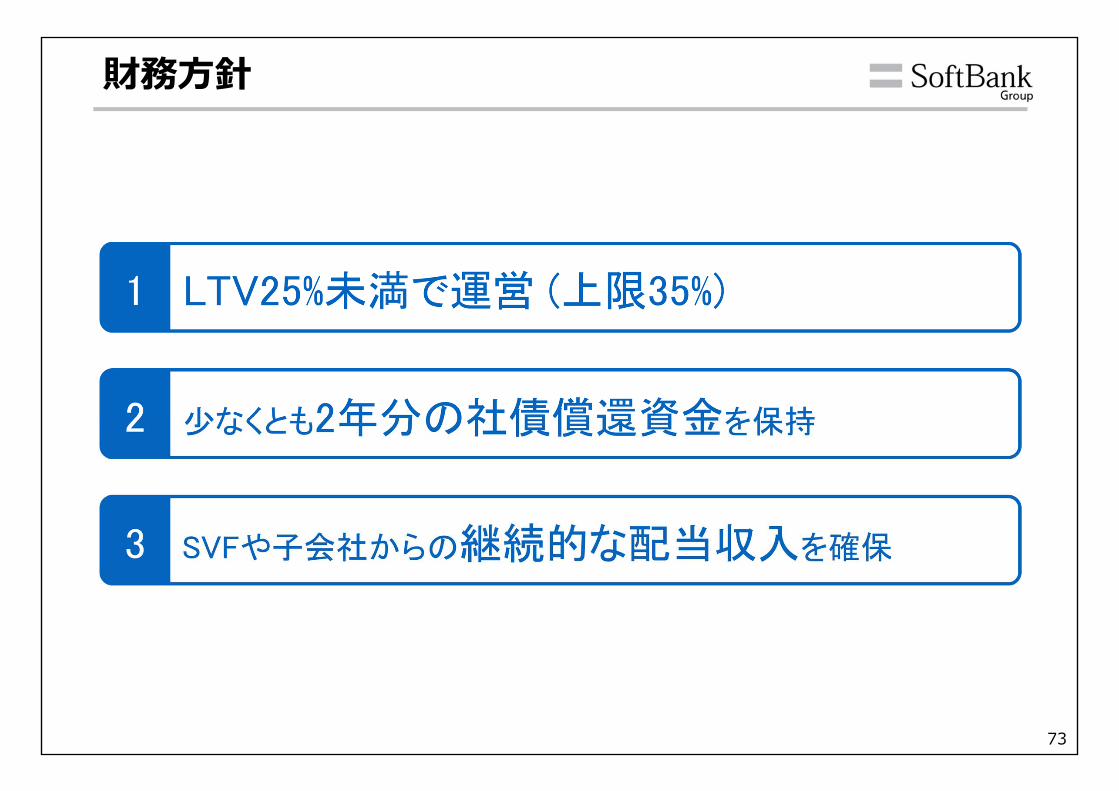
1. 投資資産価値と負債のバランス維持
2. 返済⼿段の多様性を常に確保
• LTV運営基準=25%未満(上限35%)• 機動的な投資回収・新規投資・債務返済
• 少なくとも2年分の社債償還資⾦に相当する⼿元流動性を維持• 社債投資家・⾦融機関との強固な関係を構築
3. 市場との対話重視• デット・エクイティ投資家双⽅の理解を得る最適レバレッジの追求• 投資持株会社の格付規準のもと、格付けの向上を⽬指す
68
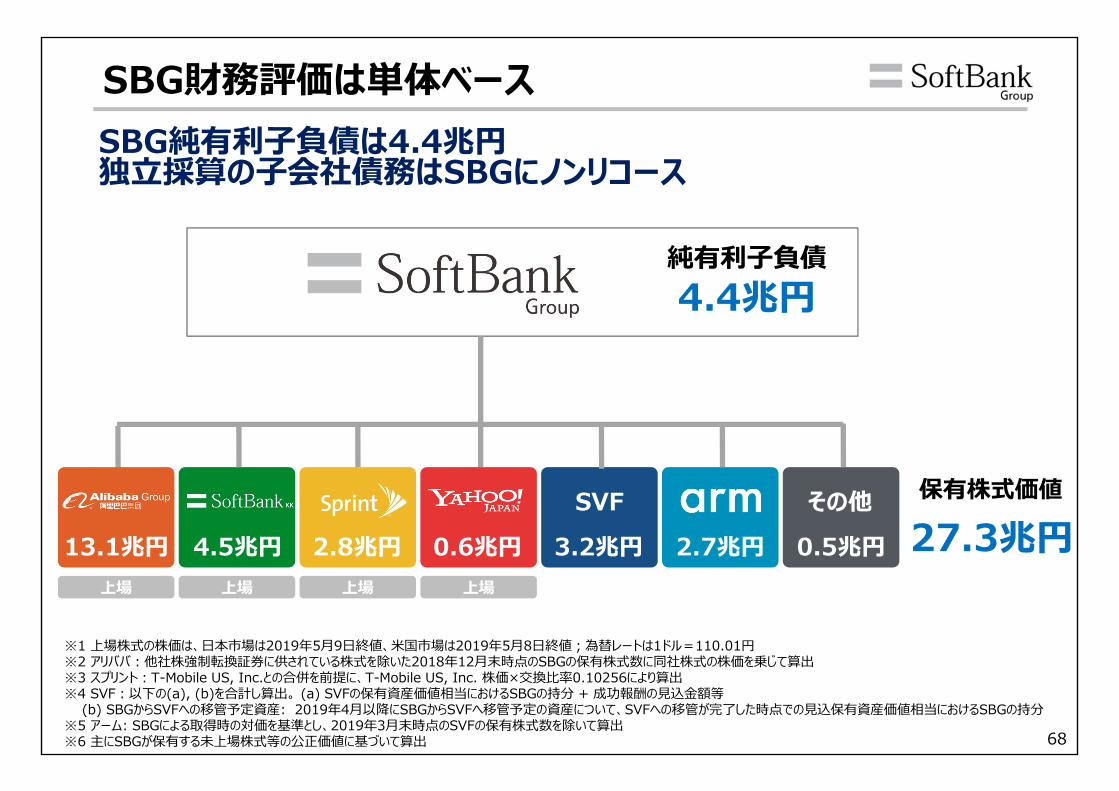
SBG財務評価は単体ベース
27.3兆円保有株式価値
※1 上場株式の株価は、⽇本市場は2019年5⽉9⽇終値、⽶国市場は2019年5⽉8⽇終値︔為替レートは1ドル=110.01円※2 アリババ︓他社株強制転換証券に供されている株式を除いた2018年12⽉末時点のSBGの保有株式数に同社株式の株価を乗じて算出※3 スプリント︓T-Mobile US, Inc.との合併を前提に、T-Mobile US, Inc. 株価×交換⽐率0.10256により算出※4 SVF︓以下の(a), (b)を合計し算出。 (a) SVFの保有資産価値相当におけるSBGの持分 + 成功報酬の⾒込⾦額等
(b) SBGからSVFへの移管予定資産: 2019年4⽉以降にSBGからSVFへ移管予定の資産について、SVFへの移管が完了した時点での⾒込保有資産価値相当におけるSBGの持分※5 アーム: SBGによる取得時の対価を基準とし、2019年3⽉末時点のSVFの保有株式数を除いて算出※6 主にSBGが保有する未上場株式等の公正価値に基づいて算出
SVF その他4.5兆円 2.8兆円 2.7兆円13.1兆円 3.2兆円 0.5兆円
SBG純有利⼦負債は4.4兆円独⽴採算の⼦会社債務はSBGにノンリコース
上場
純有利⼦負債4.4兆円
上場 上場
0.6兆円上場
69
(8.0) (8.0)
LTV
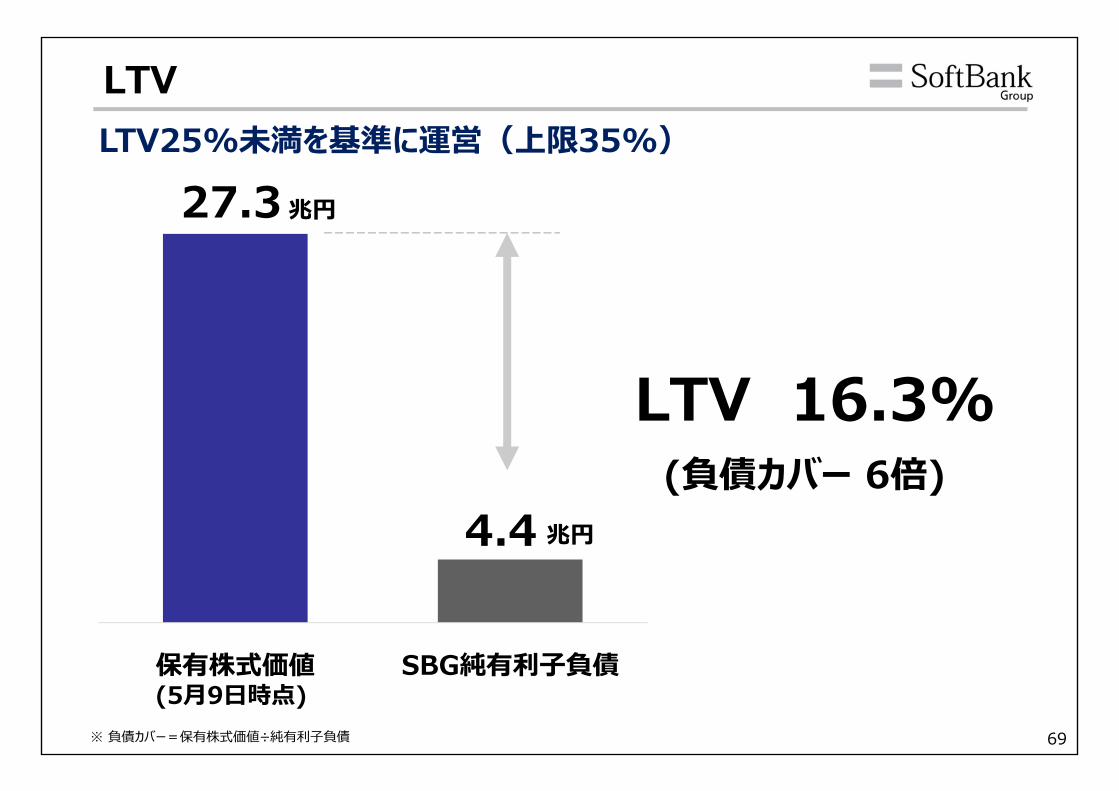
27.3
4.4
保有株式価値 SBG純有利⼦負債(5⽉9⽇時点)
LTV 16.3%
兆円
兆円
(負債カバー 6倍)
※ 負債カバー=保有株式価値÷純有利⼦負債
LTV25%未満を基準に運営(上限35%)
70
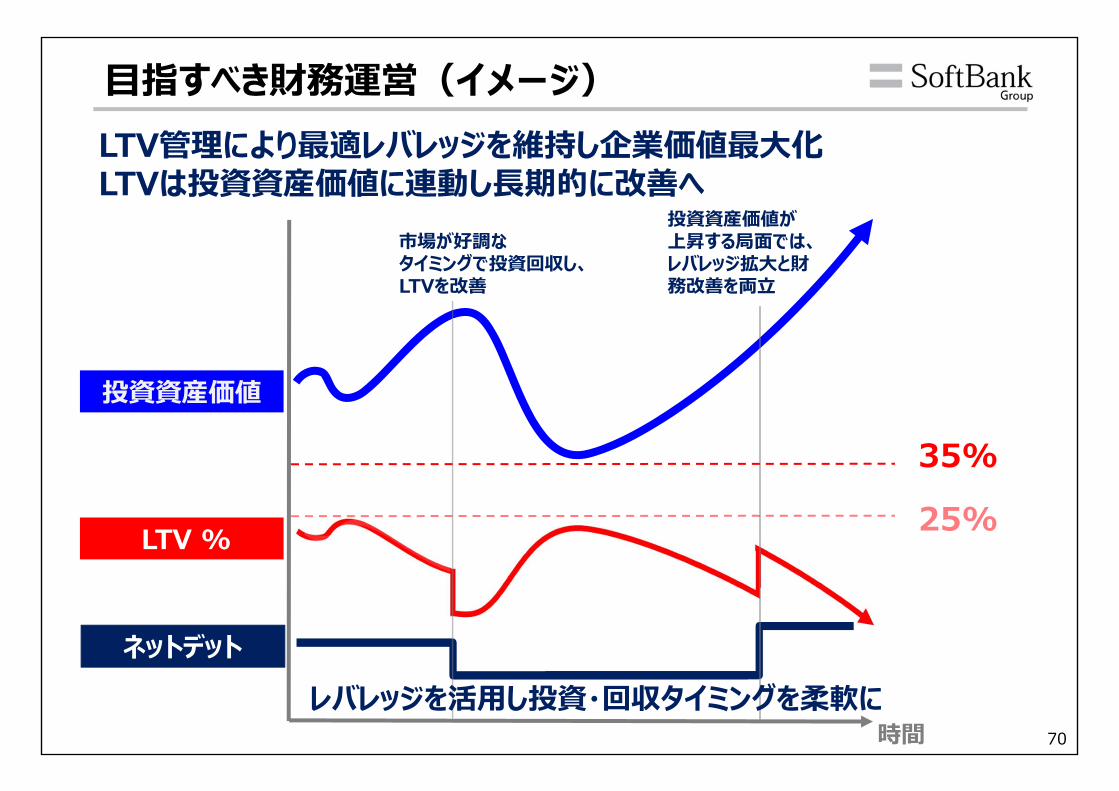
投資資産価値
時間
⽬指すべき財務運営(イメージ)LTV管理により最適レバレッジを維持し企業価値最⼤化LTVは投資資産価値に連動し⻑期的に改善へ
25%
ネットデット
LTV %
市場が好調なタイミングで投資回収し、LTVを改善
投資資産価値が上昇する局⾯では、レバレッジ拡⼤と財務改善を両⽴
レバレッジを活⽤し投資・回収タイミングを柔軟に
35%

71
投資会社としての負債活⽤
投資・回収タイミング 機動的な新規投資・回収の実⾏
投資機会 投資機会を最⼤限に活⽤
資本効率 低利のデット調達による⾼い資本効率
デットを活⽤した機動的な投資戦略により、企業価値を最⼤化
SBGの資⾦調達基盤の優位性維持
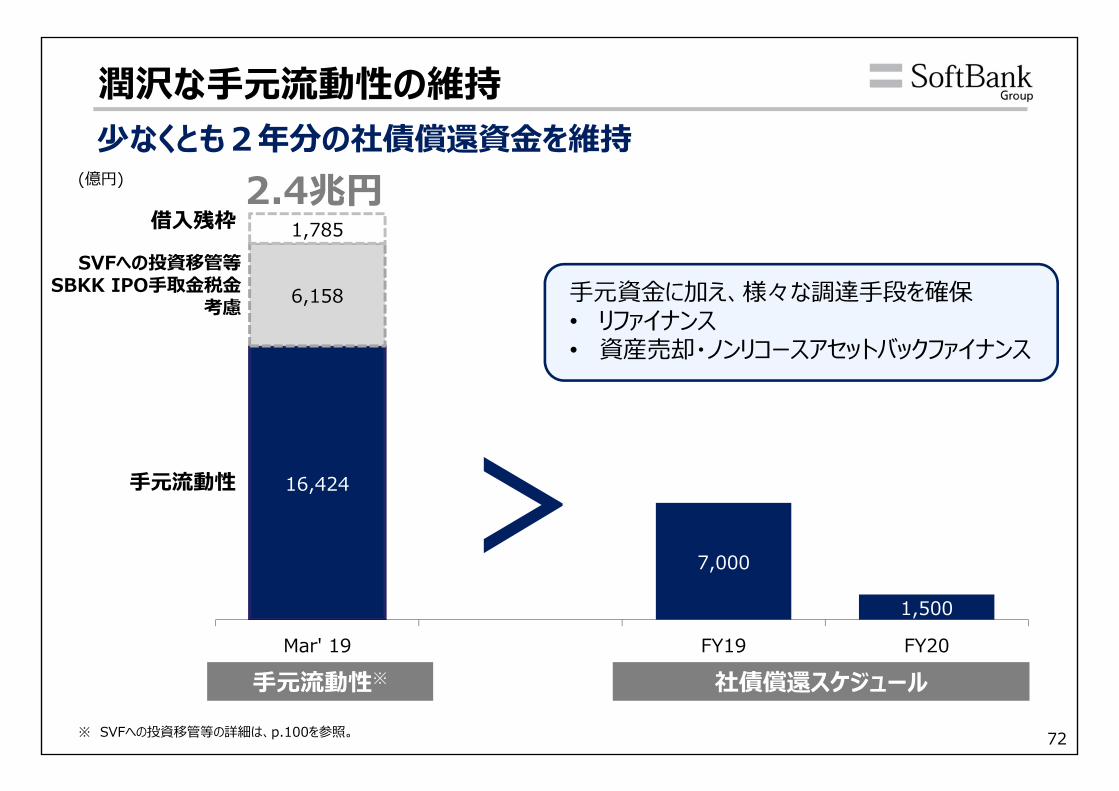
72
潤沢な⼿元流動性の維持少なくとも2年分の社債償還資⾦を維持
16,424
7,000
1,500
6,158
1,785
Mar' 19 FY19 FY20
(億円) 2.4兆円
>⼿元流動性※ 社債償還スケジュール
⼿元流動性
SVFへの投資移管等SBKK IPO⼿取⾦税⾦
考慮
借⼊残枠
※ SVFへの投資移管等の詳細は、p.100を参照。
⼿元資⾦に加え、様々な調達⼿段を確保• リファイナンス• 資産売却・ノンリコースアセットバックファイナンス
73
財務⽅針
74
(8.0) (8.0)財務の状況
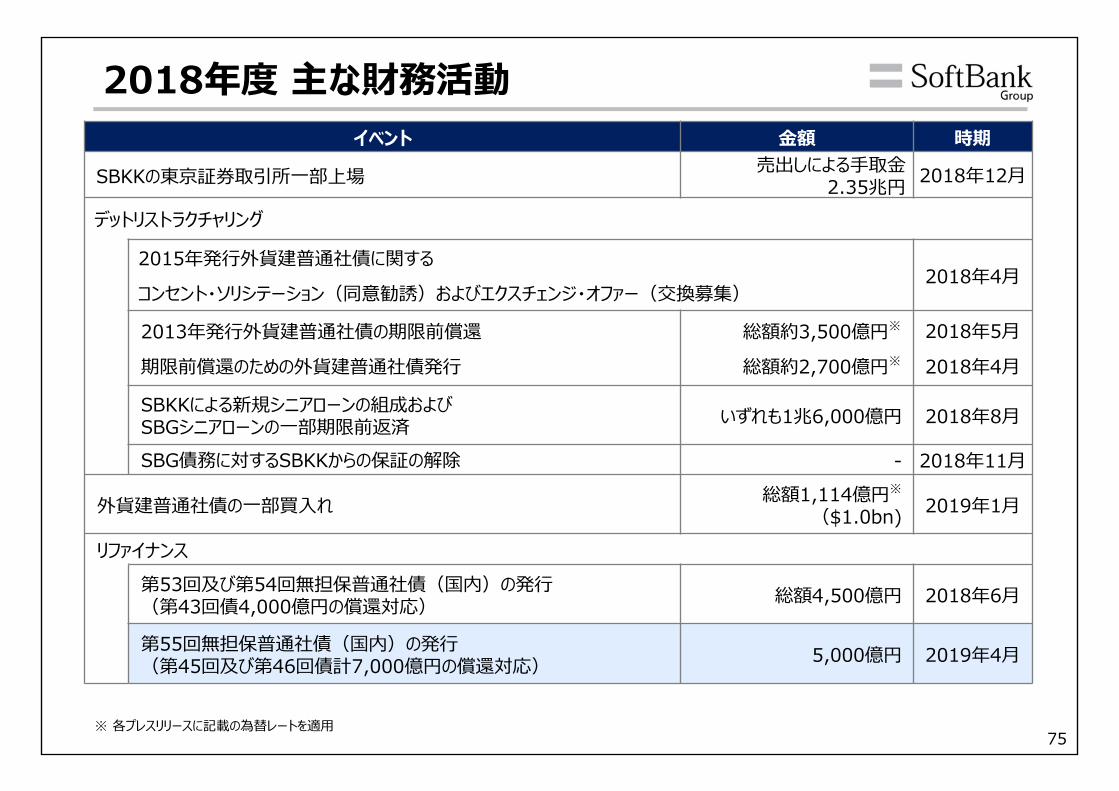
75※ 各プレスリリースに記載の為替レートを適⽤
2018年度 主な財務活動イベント ⾦額 時期
SBKKの東京証券取引所⼀部上場 売出しによる⼿取⾦2.35兆円 2018年12⽉
デットリストラクチャリング
2015年発⾏外貨建普通社債に関する
コンセント・ソリシテーション(同意勧誘)およびエクスチェンジ・オファー(交換募集)2018年4⽉
2013年発⾏外貨建普通社債の期限前償還
期限前償還のための外貨建普通社債発⾏
総額約3,500億円※
総額約2,700億円※
2018年5⽉
2018年4⽉
SBKKによる新規シニアローンの組成およびSBGシニアローンの⼀部期限前返済 いずれも1兆6,000億円 2018年8⽉
SBG債務に対するSBKKからの保証の解除 - 2018年11⽉
外貨建普通社債の⼀部買⼊れ 総額1,114億円※
($1.0bn) 2019年1⽉
リファイナンス第53回及び第54回無担保普通社債(国内)の発⾏(第43回債4,000億円の償還対応) 総額4,500億円 2018年6⽉
第55回無担保普通社債(国内)の発⾏(第45回及び第46回債計7,000億円の償還対応) 5,000億円 2019年4⽉
76
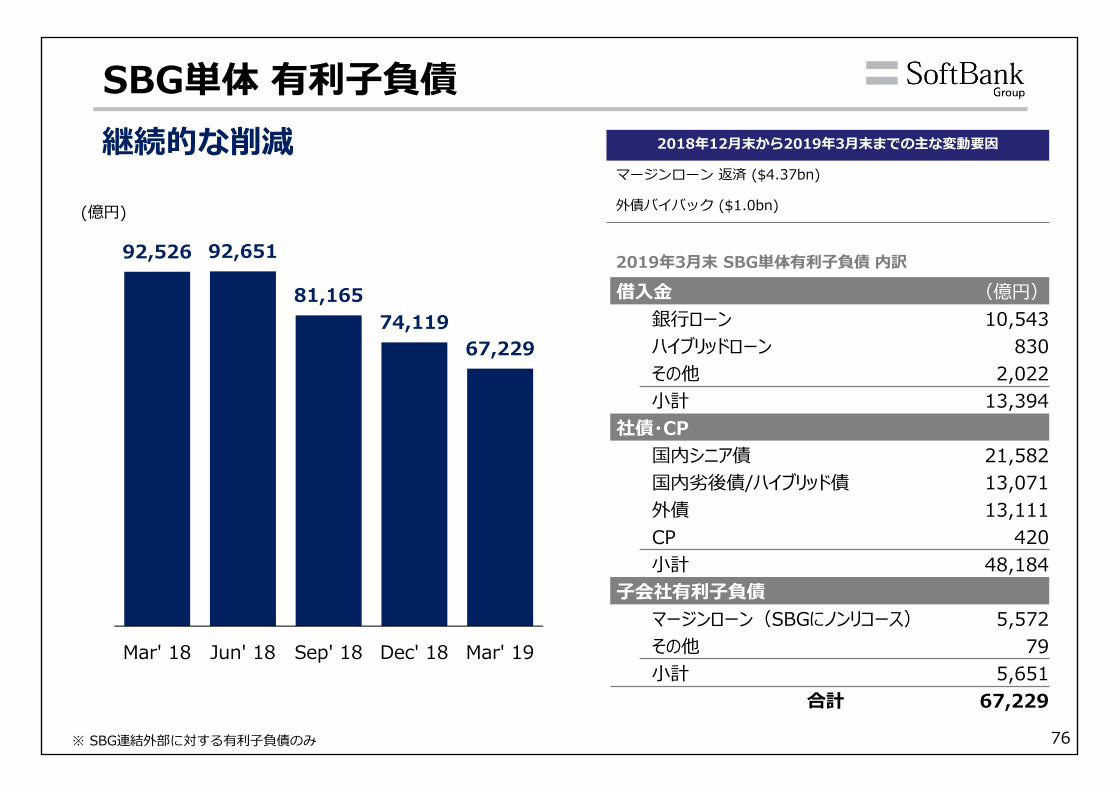
SBG単体 有利⼦負債
(億円)
※ SBG連結外部に対する有利⼦負債のみ
継続的な削減 2018年12⽉末から2019年3⽉末までの主な変動要因
マージンローン 返済 ($4.37bn)
外債バイバック ($1.0bn)
92,526 92,651
81,16574,119
67,229
Mar' 18 Jun' 18 Sep' 18 Dec' 18 Mar' 19
借⼊⾦ (億円)銀⾏ローン 10,543ハイブリッドローン 830その他 2,022⼩計 13,394
社債・CP国内シニア債 21,582国内劣後債/ハイブリッド債 13,071外債 13,111CP 420⼩計 48,184
⼦会社有利⼦負債マージンローン(SBGにノンリコース) 5,572その他 79⼩計 5,651
合計 67,229
2019年3⽉末 SBG単体有利⼦負債 内訳
77
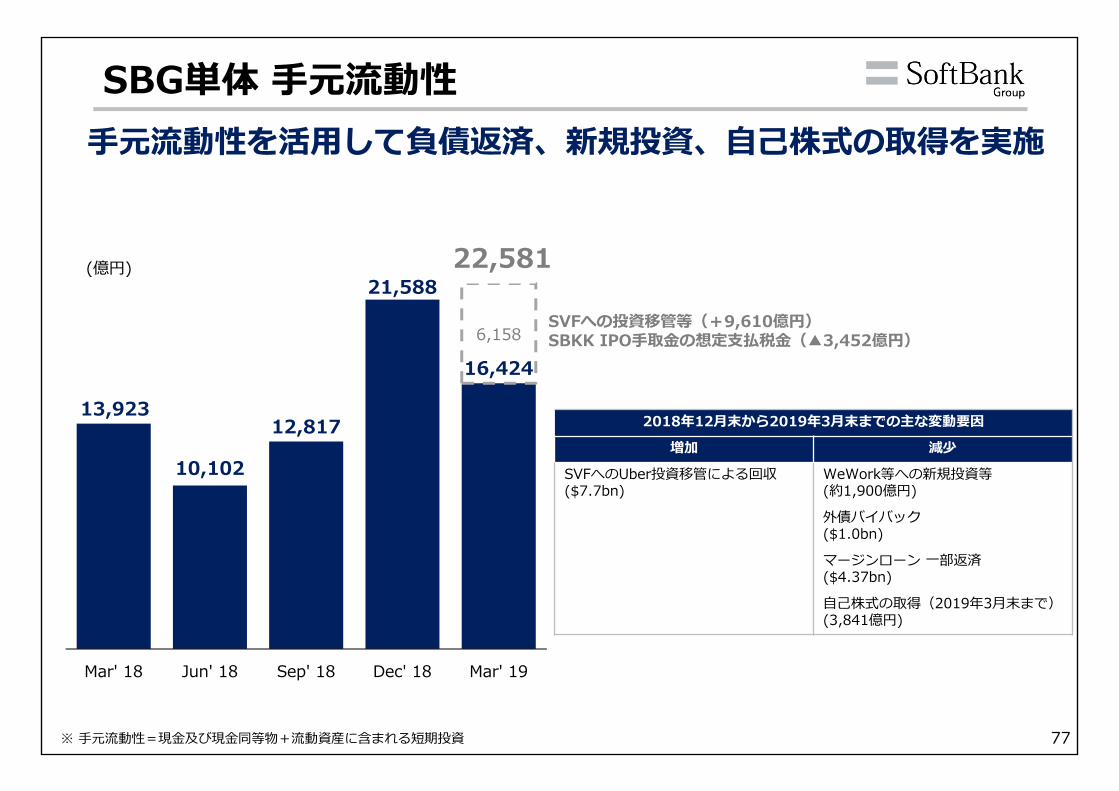
SBG単体 ⼿元流動性⼿元流動性を活⽤して負債返済、新規投資、⾃⼰株式の取得を実施
※ ⼿元流動性=現⾦及び現⾦同等物+流動資産に含まれる短期投資
(億円)
SVFへの投資移管等(+9,610億円)SBKK IPO⼿取⾦の想定⽀払税⾦(▲3,452億円)
2018年12⽉末から2019年3⽉末までの主な変動要因
増加 減少
SVFへのUber投資移管による回収($7.7bn)
WeWork等への新規投資等(約1,900億円)
外債バイバック($1.0bn)
マージンローン ⼀部返済($4.37bn)
⾃⼰株式の取得(2019年3⽉末まで)(3,841億円)
13,923
10,102
12,817
21,588
16,4246,158
22,581
Mar' 18 Jun' 18 Sep' 18 Dec' 18 Mar' 19
78
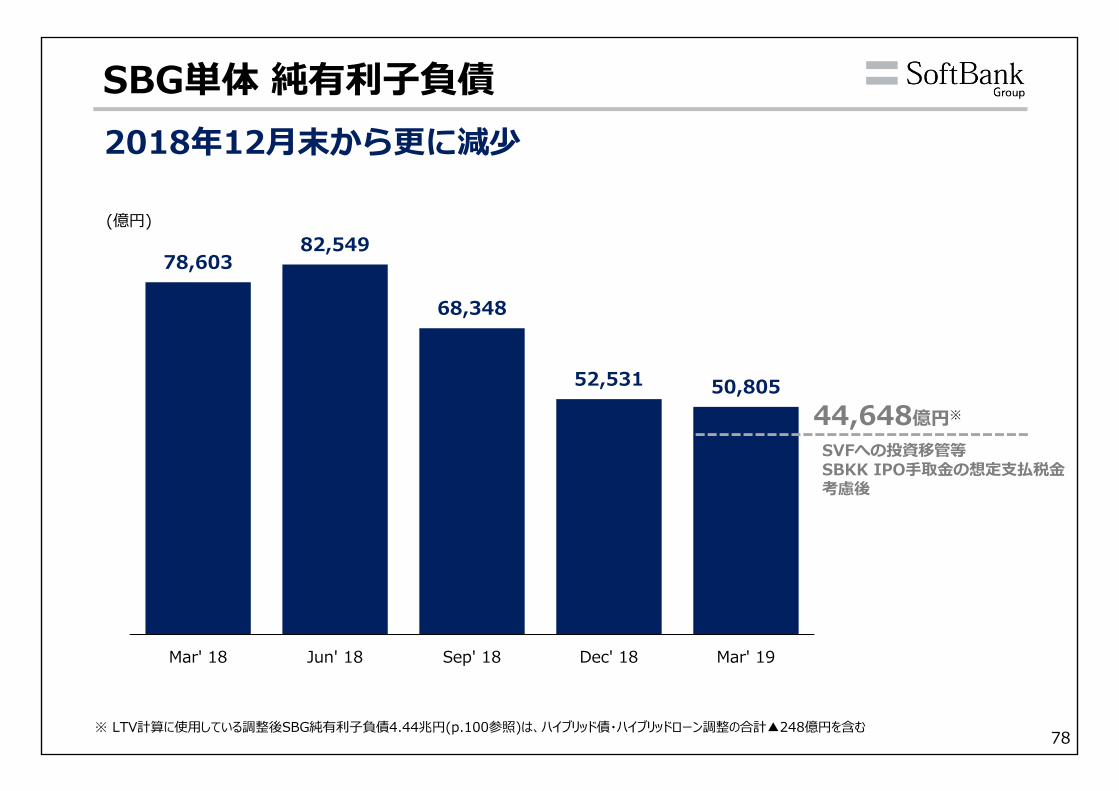
SBG単体 純有利⼦負債
(億円)
2018年12⽉末から更に減少
78,60382,549
68,348
52,531 50,805
Mar' 18 Jun' 18 Sep' 18 Dec' 18 Mar' 19
44,648億円※
SVFへの投資移管等SBKK IPO⼿取⾦の想定⽀払税⾦考慮後
※ LTV計算に使⽤している調整後SBG純有利⼦負債4.44兆円(p.100参照)は、ハイブリッド債・ハイブリッドローン調整の合計▲248億円を含む
79
7,000
1,500
3,700 4,700 4,500
8,500
4,556
154 1,310
1,648 1,331
4,241 2,305 2,065
909
3,052
1,942
7,000
1,500
13,056
5,010
9,554
5,831
4,241
300
4,247
2,065 909
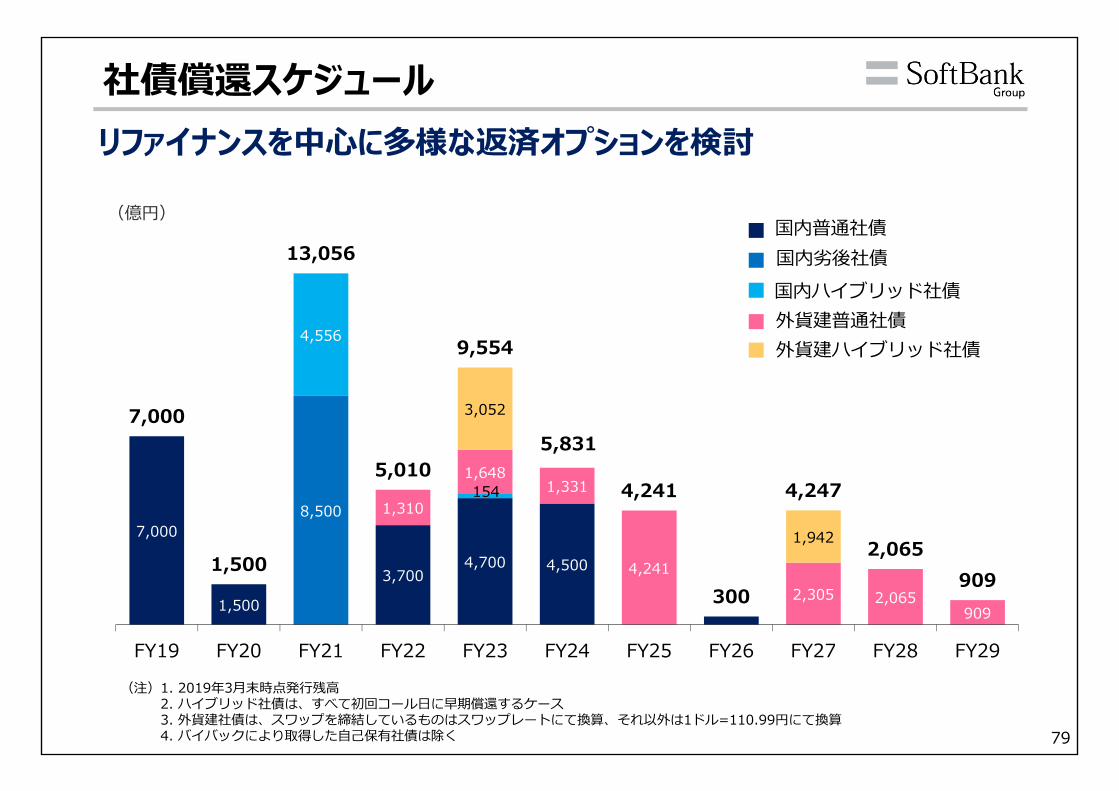
FY19 FY20 FY21 FY22 FY23 FY24 FY25 FY26 FY27 FY28 FY29
(注)1. 2019年3⽉末時点発⾏残⾼2. ハイブリッド社債は、すべて初回コール⽇に早期償還するケース3. 外貨建社債は、スワップを締結しているものはスワップレートにて換算、それ以外は1ドル=110.99円にて換算4. バイバックにより取得した⾃⼰保有社債は除く
社債償還スケジュール
(億円)国内普通社債
外貨建普通社債
国内劣後社債国内ハイブリッド社債
外貨建ハイブリッド社債
リファイナンスを中⼼に多様な返済オプションを検討
80
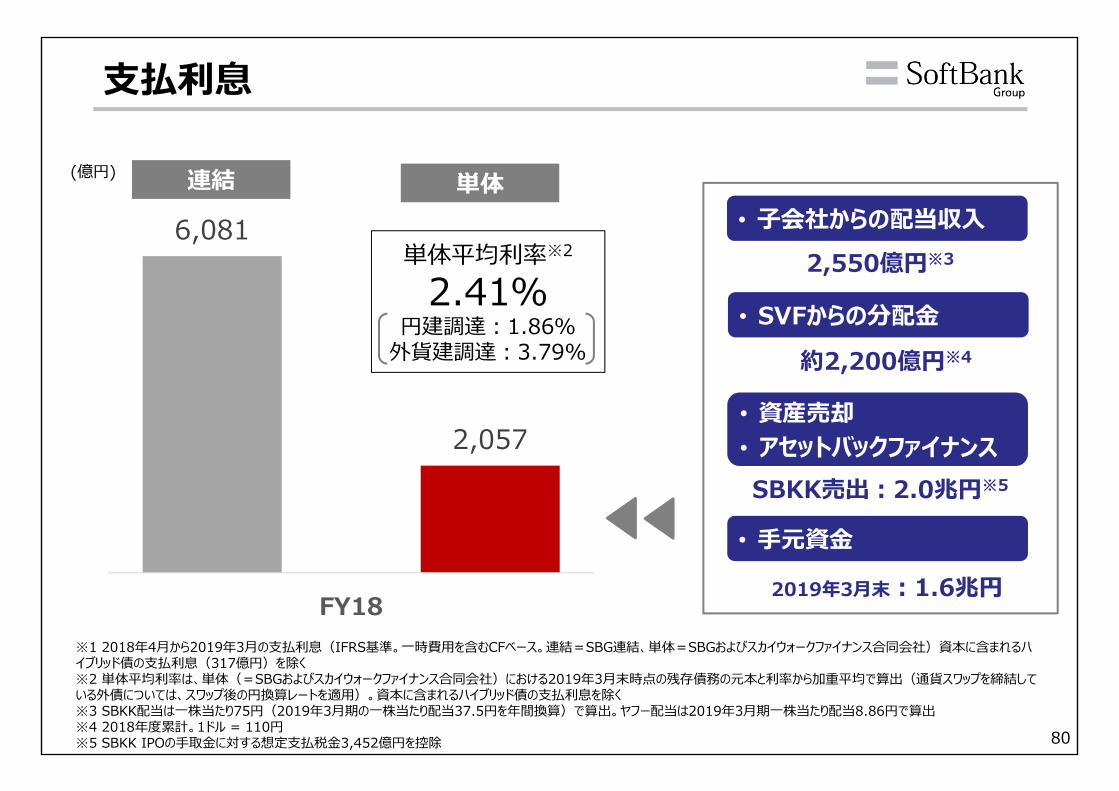
⽀払利息
※1 2018年4⽉から2019年3⽉の⽀払利息(IFRS基準。⼀時費⽤を含むCFベース。連結=SBG連結、単体=SBGおよびスカイウォークファイナンス合同会社)資本に含まれるハイブリッド債の⽀払利息(317億円)を除く※2 単体平均利率は、単体(=SBGおよびスカイウォークファイナンス合同会社)における2019年3⽉末時点の残存債務の元本と利率から加重平均で算出(通貨スワップを締結している外債については、スワップ後の円換算レートを適⽤)。資本に含まれるハイブリッド債の⽀払利息を除く※3 SBKK配当は⼀株当たり75円(2019年3⽉期の⼀株当たり配当37.5円を年間換算)で算出。ヤフー配当は2019年3⽉期⼀株当たり配当8.86円で算出※4 2018年度累計。1ドル = 110円※5 SBKK IPOの⼿取⾦に対する想定⽀払税⾦3,452億円を控除
(億円) 連結 単体
単体平均利率※2
2.41%円建調達︓1.86%
外貨建調達︓3.79%
• 資産売却• アセットバックファイナンス
2,550億円※3
約2,200億円※4
SBKK売出︓2.0兆円※5
• ⼿元資⾦
2019年3⽉末︓1.6兆円
• SVFからの分配⾦
• ⼦会社からの配当収⼊6,081
2,057
FY18
81
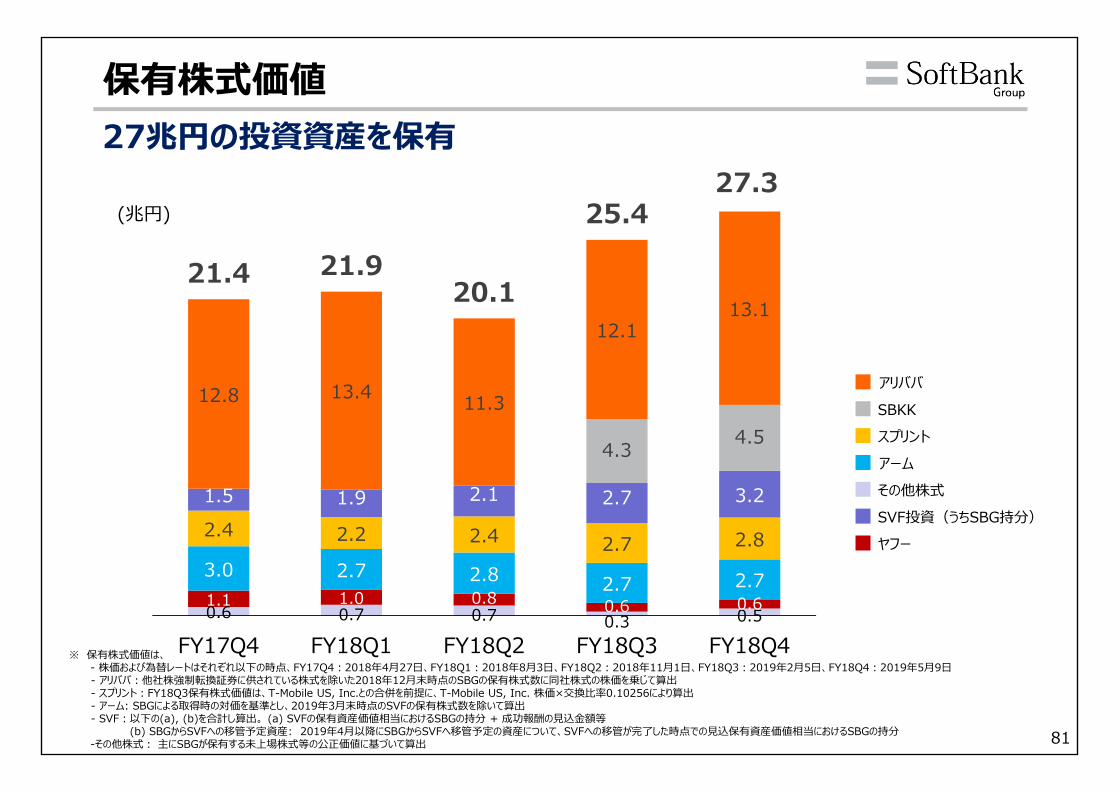
保有株式価値
0.6 0.7 0.7 0.3 0.51.1 1.0 0.8 0.6 0.6
3.0 2.7 2.8 2.7 2.7
2.4 2.2 2.4 2.7 2.8
1.5 1.9 2.1 2.7 3.2
4.3 4.5
12.8 13.4 11.3
12.113.1
21.4 21.920.1
25.427.3
FY17Q4 FY18Q1 FY18Q2 FY18Q3 FY18Q4
スプリント
アリババ
ヤフー
アーム
SVF投資(うちSBG持分)その他株式
(兆円)
※ 保有株式価値は、- 株価および為替レートはそれぞれ以下の時点、FY17Q4︓2018年4⽉27⽇、FY18Q1︓2018年8⽉3⽇、FY18Q2︓2018年11⽉1⽇、FY18Q3︓2019年2⽉5⽇、FY18Q4︓2019年5⽉9⽇- アリババ︓他社株強制転換証券に供されている株式を除いた2018年12⽉末時点のSBGの保有株式数に同社株式の株価を乗じて算出- スプリント︓FY18Q3保有株式価値は、T-Mobile US, Inc.との合併を前提に、T-Mobile US, Inc. 株価×交換⽐率0.10256により算出- アーム: SBGによる取得時の対価を基準とし、2019年3⽉末時点のSVFの保有株式数を除いて算出- SVF︓以下の(a), (b)を合計し算出。 (a) SVFの保有資産価値相当におけるSBGの持分 + 成功報酬の⾒込⾦額等
(b) SBGからSVFへの移管予定資産: 2019年4⽉以降にSBGからSVFへ移管予定の資産について、SVFへの移管が完了した時点での⾒込保有資産価値相当におけるSBGの持分-その他株式︓ 主にSBGが保有する未上場株式等の公正価値に基づいて算出
27兆円の投資資産を保有
SBKK
82
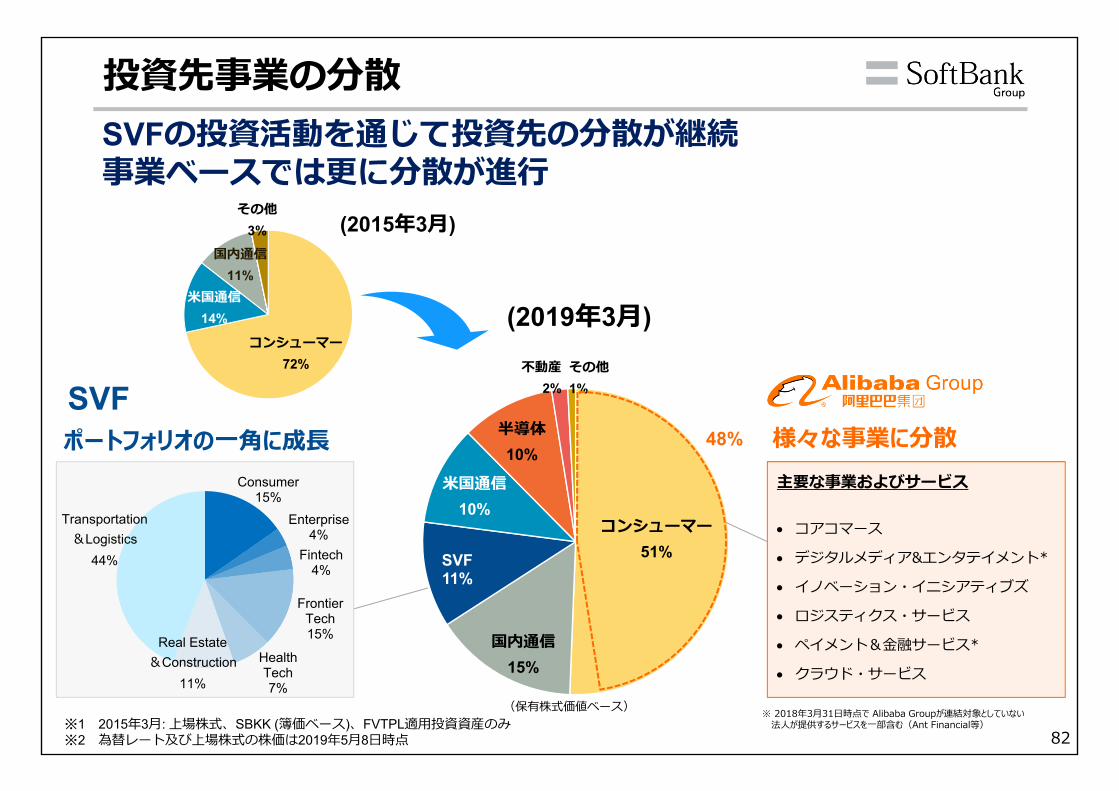
コンシューマー51%
国内通信15%
SVF11%
⽶国通信10%
半導体10%
不動産2%
その他1%
投資先事業の分散SVFの投資活動を通じて投資先の分散が継続事業ベースでは更に分散が進⾏
※1 2015年3⽉: 上場株式、SBKK (簿価ベース)、FVTPL適⽤投資資産のみ※2 為替レート及び上場株式の株価は2019年5⽉8⽇時点
コンシューマー72%
⽶国通信14%
国内通信11%
その他3% (2015年3⽉)
(2019年3⽉)
主要な事業およびサービス
コアコマース
デジタルメディア&エンタテイメント*
イノベーション・イニシアティブズ
ロジスティクス・サービス
ペイメント&⾦融サービス*
クラウド・サービス
※ 2018年3⽉31⽇時点で Alibaba Groupが連結対象としていない法⼈が提供するサービスを⼀部含む(Ant Financial等)
48%
Consumer15%
Enterprise4%
Fintech4%
Frontier Tech15%
Health Tech7%
Real Estate&Construction
11%
Transportation&Logistics
44%
様々な事業に分散ポートフォリオの⼀⾓に成⻑SVF
(保有株式価値ベース)
83
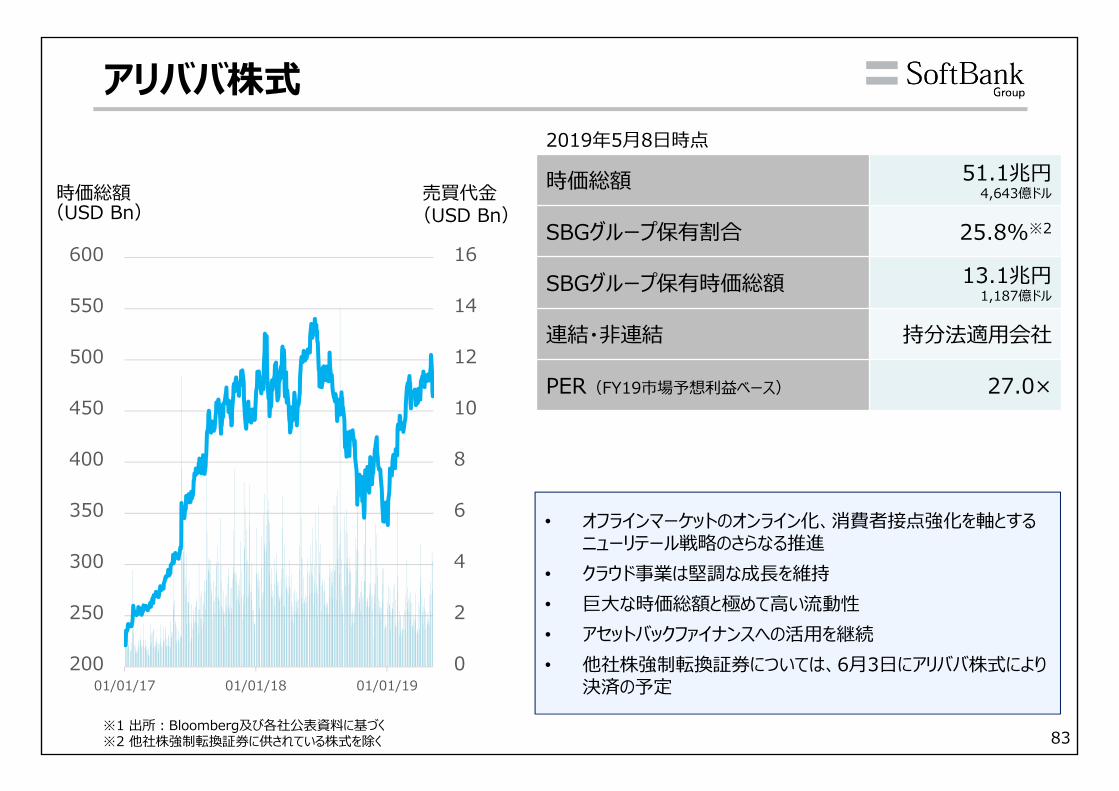
アリババ株式
時価総額 51.1兆円4,643億ドル
SBGグループ保有割合 25.8%※2
SBGグループ保有時価総額 13.1兆円1,187億ドル
連結・⾮連結 持分法適⽤会社
PER(FY19市場予想利益ベース) 27.0×
時価総額(USD Bn) (USD Bn)
売買代⾦
※1 出所︓Bloomberg及び各社公表資料に基づく※2 他社株強制転換証券に供されている株式を除く
2019年5⽉8⽇時点
• オフラインマーケットのオンライン化、消費者接点強化を軸とするニューリテール戦略のさらなる推進
• クラウド事業は堅調な成⻑を維持• 巨⼤な時価総額と極めて⾼い流動性• アセットバックファイナンスへの活⽤を継続• 他社株強制転換証券については、6⽉3⽇にアリババ株式により
決済の予定0
2
4
6
8
10
12
14
16
200
250
300
350
400
450
500
550
600
01/01/17 01/01/18 01/01/19
84
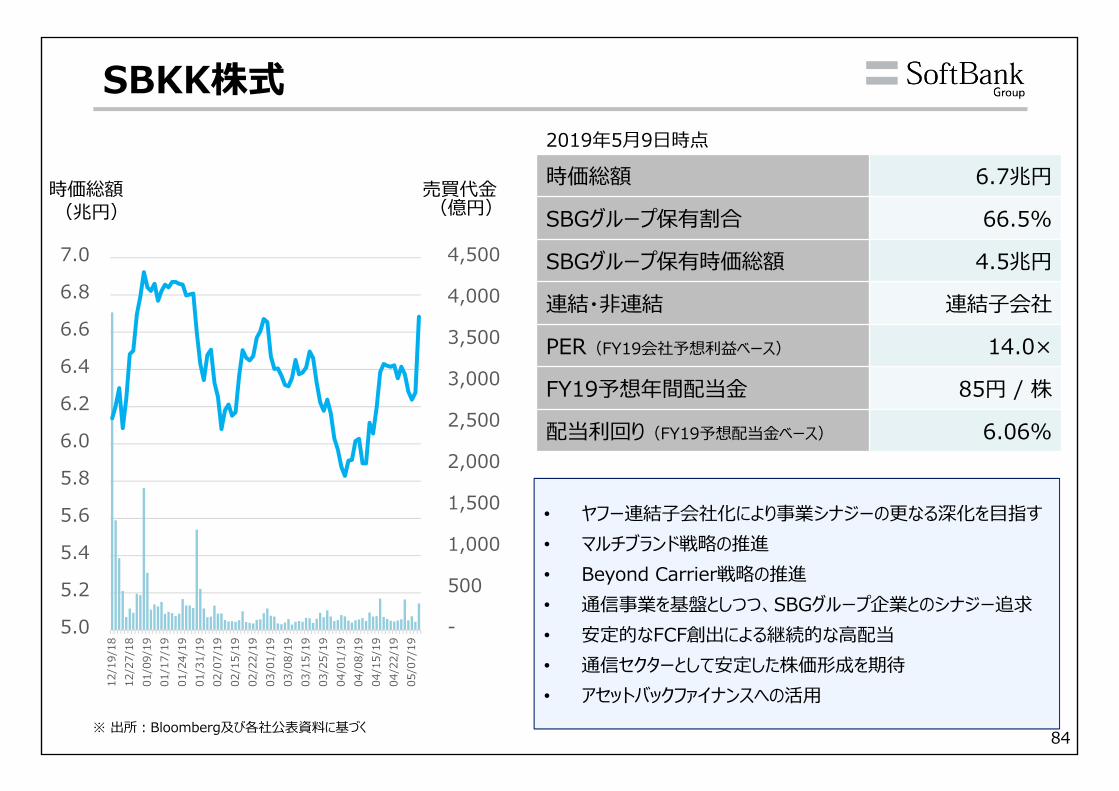
時価総額 6.7兆円
SBGグループ保有割合 66.5%
SBGグループ保有時価総額 4.5兆円
連結・⾮連結 連結⼦会社
PER(FY19会社予想利益ベース) 14.0×
FY19予想年間配当⾦ 85円 / 株
配当利回り(FY19予想配当⾦ベース) 6.06%
2019年5⽉9⽇時点
※ 出所︓Bloomberg及び各社公表資料に基づく
SBKK株式
時価総額(兆円) (億円)
売買代⾦
-
500
1,000
1,500
2,000
2,500
3,000
3,500
4,000
4,500
5.0
5.2
5.4
5.6
5.8
6.0
6.2
6.4
6.6
6.8
7.0
12/1
9/18
12/2
7/18
01/0
9/19
01/1
7/19
01/2
4/19
01/3
1/19
02/0
7/19
02/1
5/19
02/2
2/19
03/0
1/19
03/0
8/19
03/1
5/19
03/2
5/19
04/0
1/19
04/0
8/19
04/1
5/19
04/2
2/19
05/0
7/19
• ヤフー連結⼦会社化により事業シナジーの更なる深化を⽬指す• マルチブランド戦略の推進• Beyond Carrier戦略の推進• 通信事業を基盤としつつ、SBGグループ企業とのシナジー追求• 安定的なFCF創出による継続的な⾼配当• 通信セクターとして安定した株価形成を期待• アセットバックファイナンスへの活⽤

85
ヤフー株式
時価総額 1.7兆円
SBGグループ保有割合※2 48.2%
SBGグループ保有時価総額※2 0.8兆円
連結・⾮連結 連結⼦会社
PER(FY19市場予想利益ベース) 20.3×
2019年5⽉9⽇時点
時価総額(兆円) (億円)
売買代⾦
• 下記3分野で国内No.1を⽬指す①eコマース物販取扱⾼②インターネット広告売上③モバイル決済取扱⾼
• SBKKとの事業シナジーによる成⻑の加速
※1 出所︓Bloomberg及び各社公表資料に基づく※2 SBKK保有分を含む
-
100
200
300
400
500
600
700
1.0
1.5
2.0
2.5
3.0
3.5
01/01/17 01/01/18 01/01/19
86
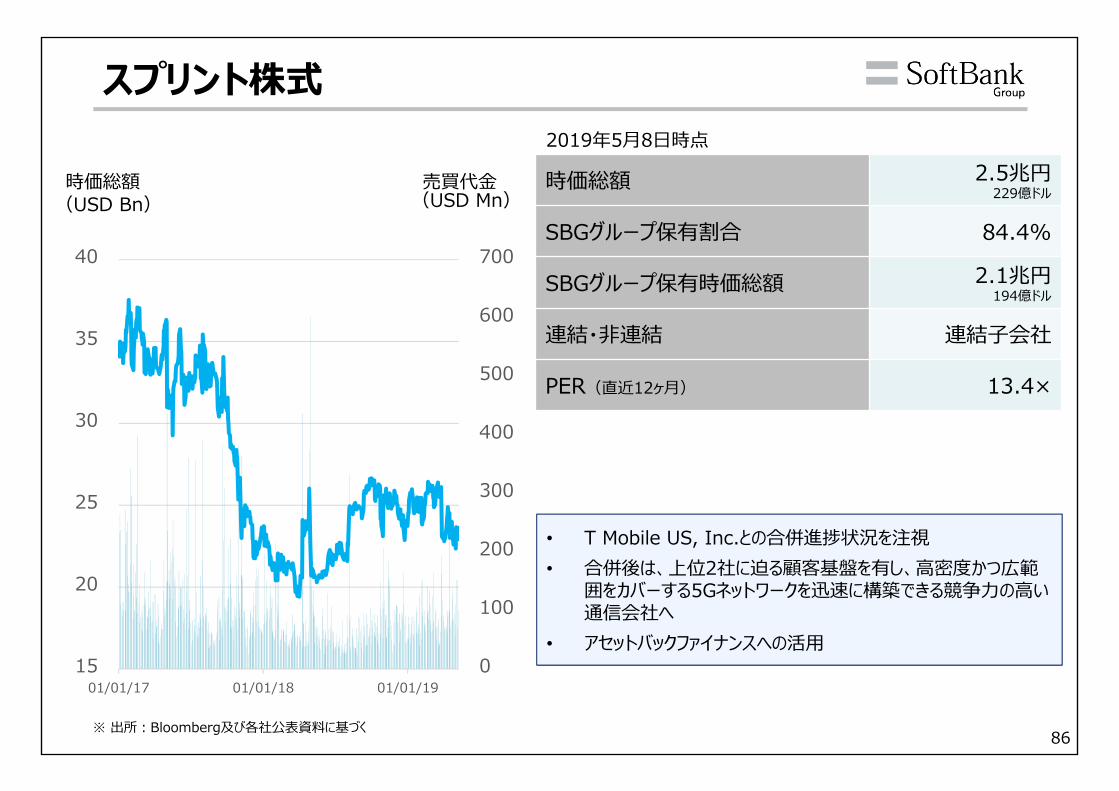
時価総額 2.5兆円229億ドル
SBGグループ保有割合 84.4%
SBGグループ保有時価総額 2.1兆円194億ドル
連結・⾮連結 連結⼦会社
PER(直近12ヶ⽉) 13.4×
2019年5⽉8⽇時点
スプリント株式
時価総額(USD Bn) (USD Mn)
売買代⾦
• T Mobile US, Inc.との合併進捗状況を注視• 合併後は、上位2社に迫る顧客基盤を有し、⾼密度かつ広範
囲をカバーする5Gネットワークを迅速に構築できる競争⼒の⾼い通信会社へ
• アセットバックファイナンスへの活⽤
※ 出所︓Bloomberg及び各社公表資料に基づく
0
100
200
300
400
500
600
700
15
20
25
30
35
40
01/01/17 01/01/18 01/01/19
87
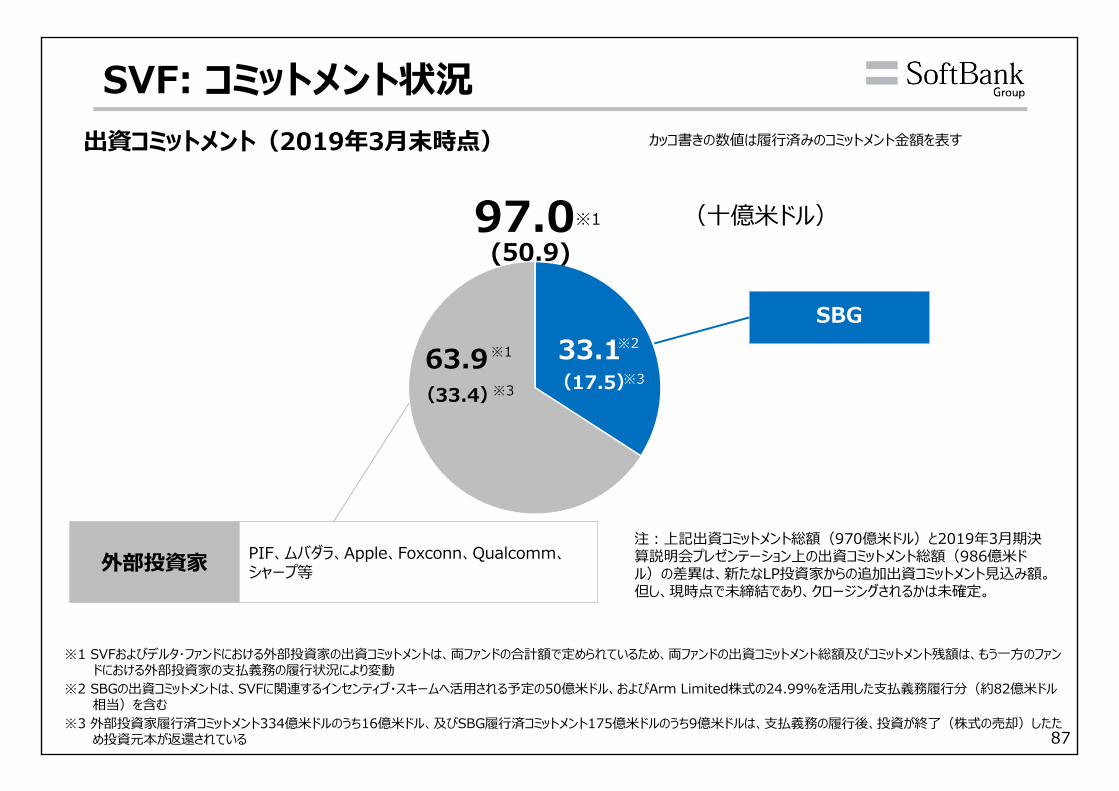
SVF: コミットメント状況
(8.0)
外部投資家 PIF、ムバダラ、Apple、Foxconn、Qualcomm、シャープ等
SBG
(⼗億⽶ドル)
33.163.9(33.4) (17.5)
(50.9)97.0※1
※1 ※2
※3※3
出資コミットメント(2019年3⽉末時点) カッコ書きの数値は履⾏済みのコミットメント⾦額を表す
注︓上記出資コミットメント総額(970億⽶ドル)と2019年3⽉期決算説明会プレゼンテーション上の出資コミットメント総額(986億⽶ドル)の差異は、新たなLP投資家からの追加出資コミットメント⾒込み額。但し、現時点で未締結であり、クロージングされるかは未確定。
※1 SVFおよびデルタ・ファンドにおける外部投資家の出資コミットメントは、両ファンドの合計額で定められているため、両ファンドの出資コミットメント総額及びコミットメント残額は、もう⼀⽅のファンドにおける外部投資家の⽀払義務の履⾏状況により変動
※2 SBGの出資コミットメントは、SVFに関連するインセンティブ・スキームへ活⽤される予定の50億⽶ドル、およびArm Limited株式の24.99%を活⽤した⽀払義務履⾏分(約82億⽶ドル相当)を含む
※3 外部投資家履⾏済コミットメント334億⽶ドルのうち16億⽶ドル、及びSBG履⾏済コミットメント175億⽶ドルのうち9億⽶ドルは、⽀払義務の履⾏後、投資が終了(株式の売却)したため投資元本が返還されている
88
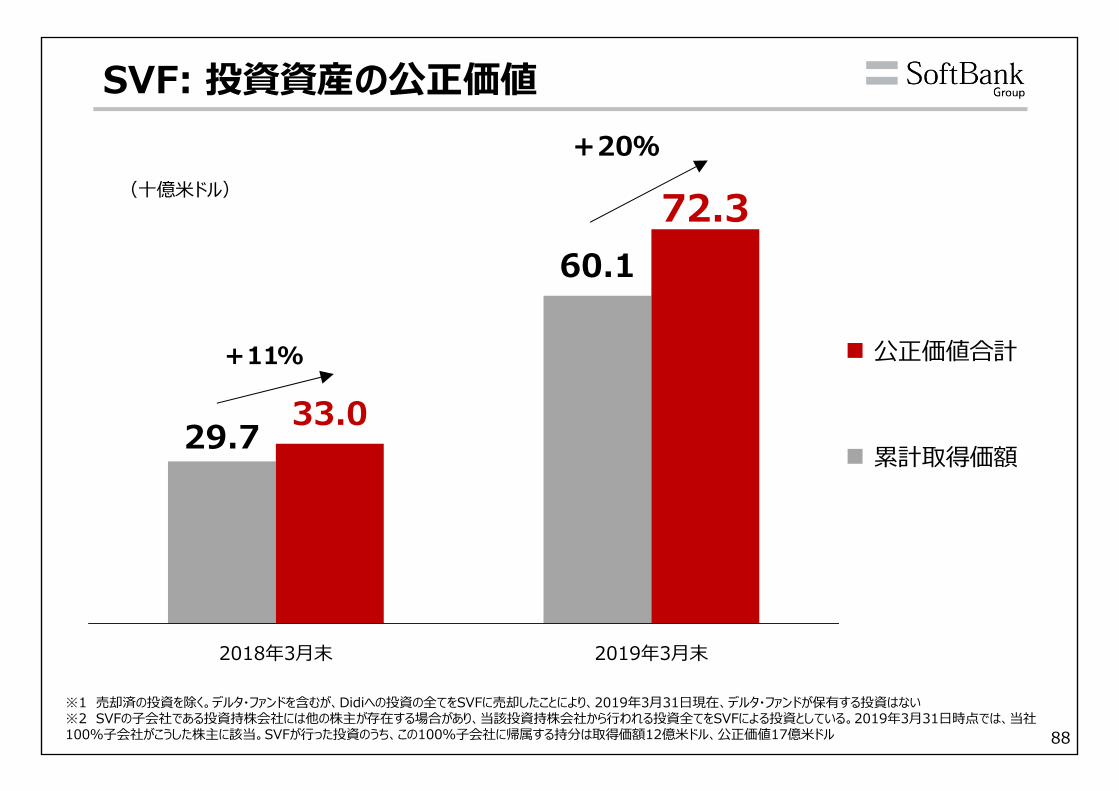
SVF: 投資資産の公正価値
29.7
60.1
33.0
72.3
2018年3⽉末 2019年3⽉末
公正価値合計
累計取得価額
(⼗億⽶ドル)
+11%
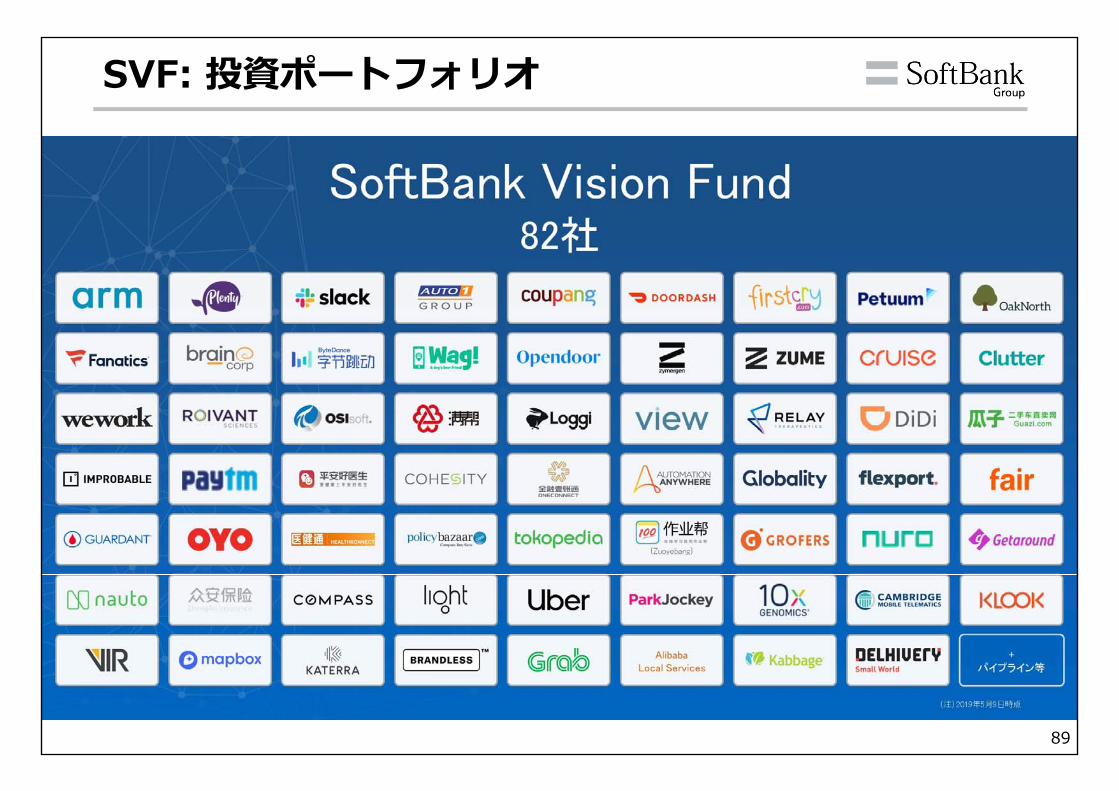
+20%
※1 売却済の投資を除く。デルタ・ファンドを含むが、Didiへの投資の全てをSVFに売却したことにより、2019年3⽉31⽇現在、デルタ・ファンドが保有する投資はない※2 SVFの⼦会社である投資持株会社には他の株主が存在する場合があり、当該投資持株会社から⾏われる投資全てをSVFによる投資としている。2019年3⽉31⽇時点では、当社100%⼦会社がこうした株主に該当。SVFが⾏った投資のうち、この100%⼦会社に帰属する持分は取得価額12億⽶ドル、公正価値17億⽶ドル
89
(8.0) (8.0)
SVF: 投資ポートフォリオ
90
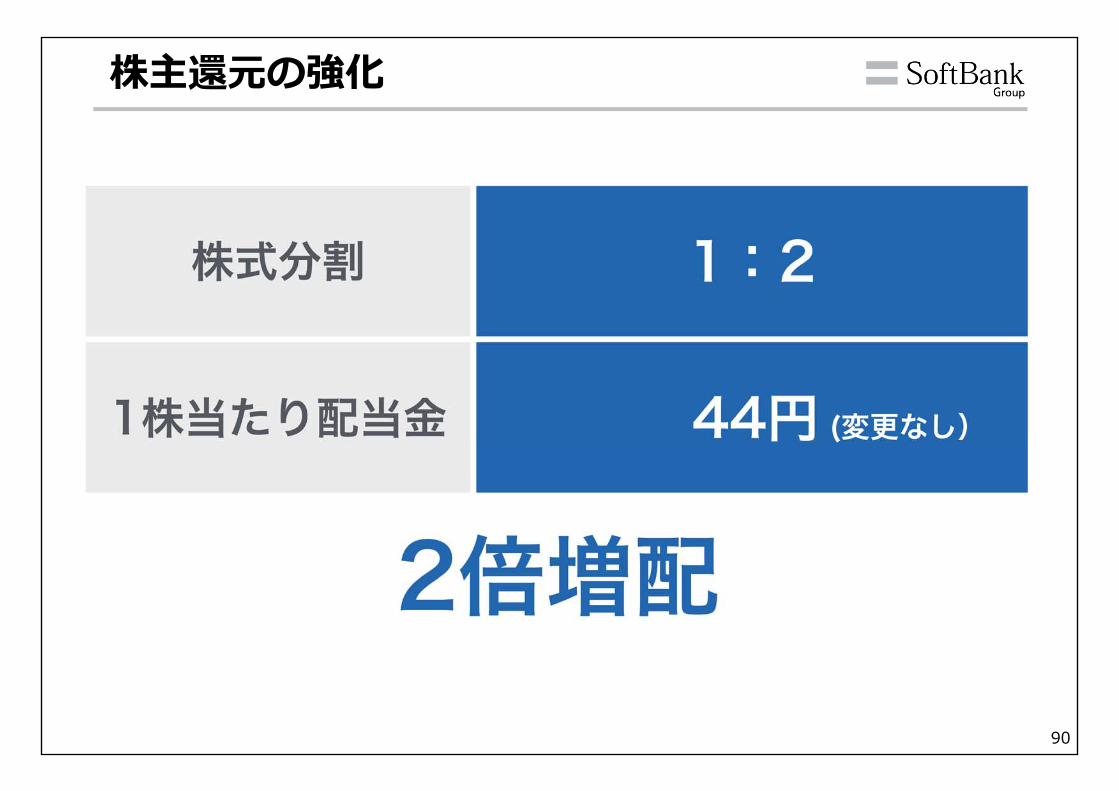
株主還元の強化
91
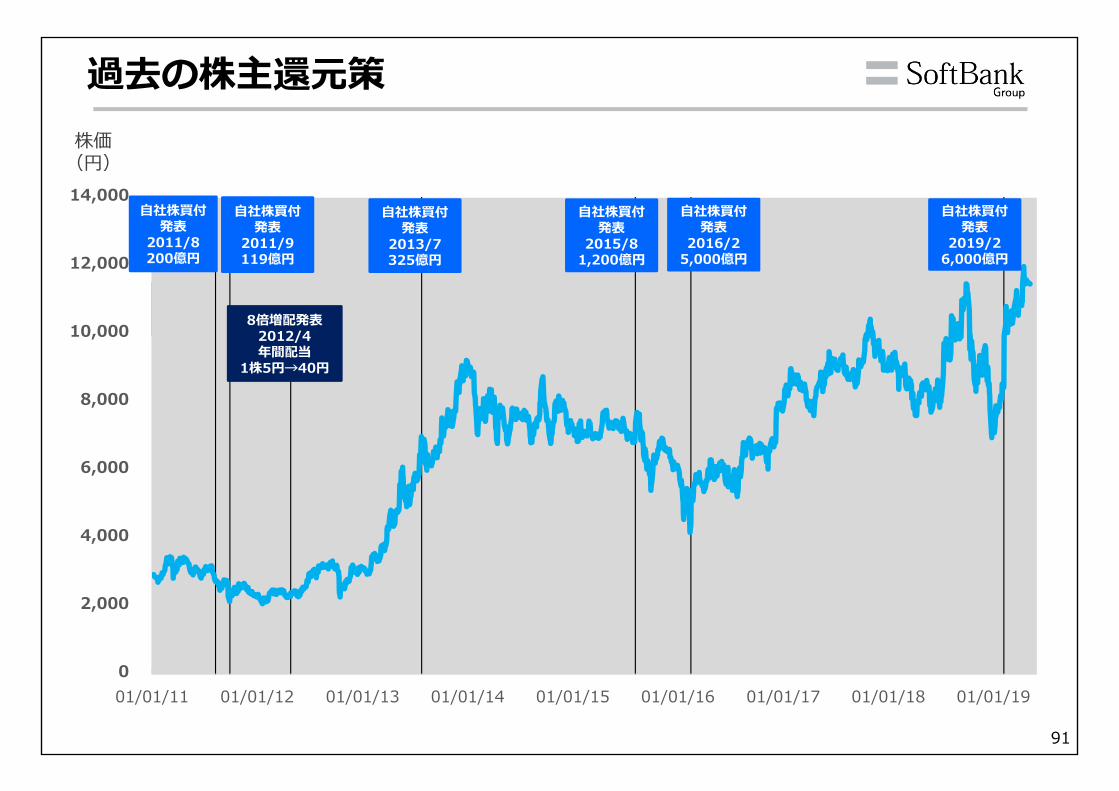
過去の株主還元策株価
(円)
0
2,000
4,000
6,000
8,000
10,000
12,000
14,000
01/01/11 01/01/12 01/01/13 01/01/14 01/01/15 01/01/16 01/01/17 01/01/18 01/01/19
⾃社株買付発表
2011/8200億円
⾃社株買付発表
2011/9119億円
⾃社株買付発表
2013/7325億円
⾃社株買付発表
2015/81,200億円
⾃社株買付発表
2016/25,000億円
⾃社株買付発表
2019/26,000億円
8倍増配発表2012/4年間配当
1株5円→40円
92
4
5
6
7
8
9
10
11
12
13
14
'03 '04 '05 '06 '07 '08 '09 '10 '11 '12 '13 '14 '15 '16 '17 '18 '19
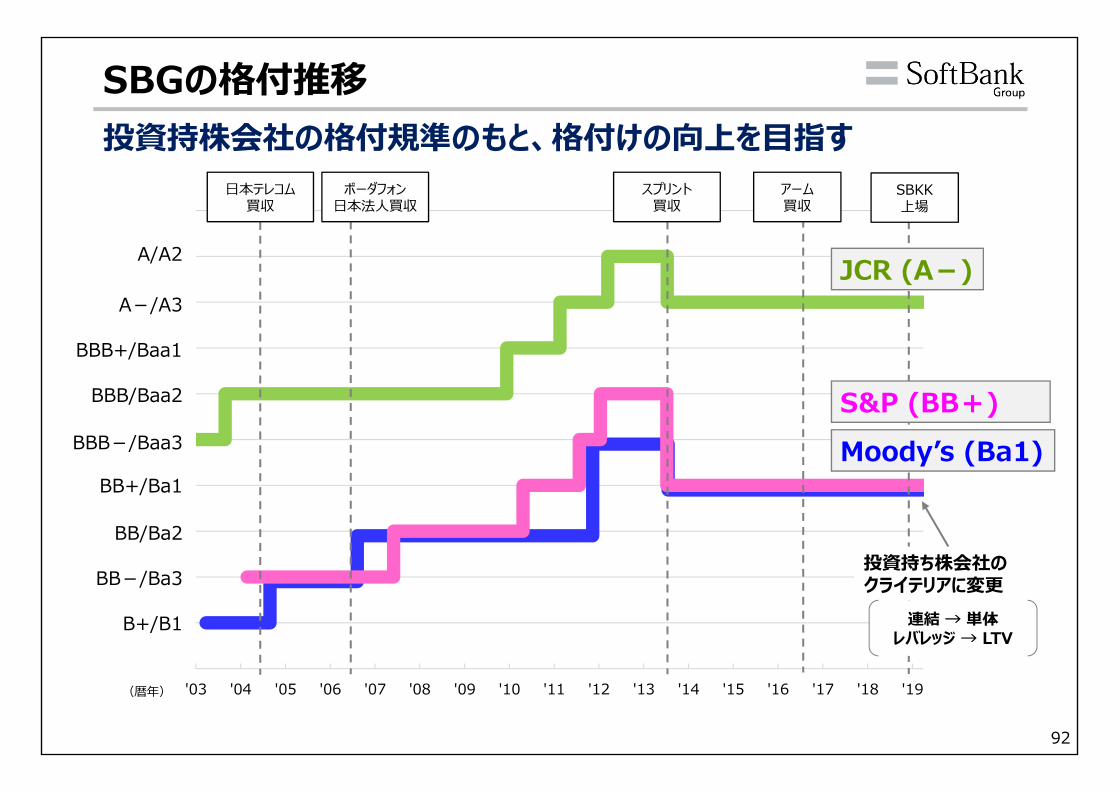
SBGの格付推移
(暦年)
A/A2
A-/A3
BBB+/Baa1
BBB/Baa2
BBB-/Baa3
BB+/Ba1
BB/Ba2
BB-/Ba3
B+/B1
投資持株会社の格付規準のもと、格付けの向上を⽬指す⽇本テレコム
買収ボーダフォン
⽇本法⼈買収スプリント
買収アーム買収
SBKK上場
JCR (A-)
S&P (BB+)Moodyʼs (Ba1)
投資持ち株会社のクライテリアに変更
連結 → 単体レバレッジ → LTV
93
(8.0) (8.0)個⼈向け社債について
94
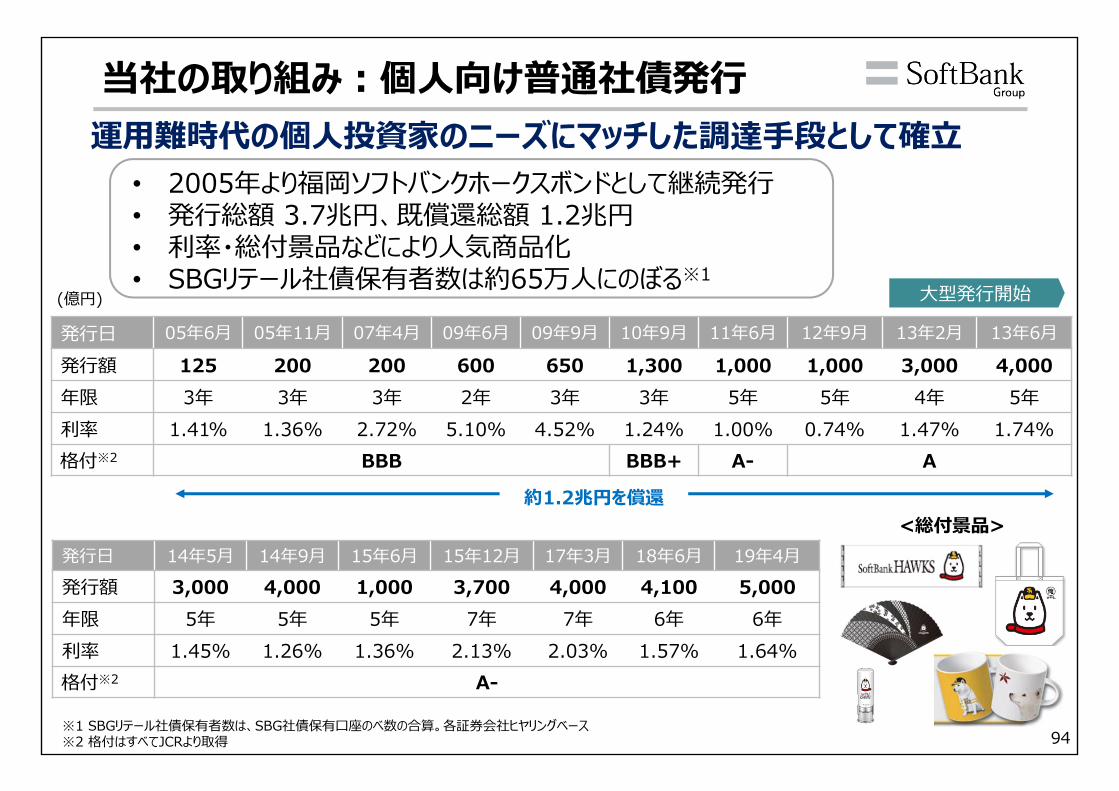
発⾏⽇ 14年5⽉ 14年9⽉ 15年6⽉ 15年12⽉ 17年3⽉ 18年6⽉ 19年4⽉発⾏額 3,000 4,000 1,000 3,700 4,000 4,100 5,000年限 5年 5年 5年 7年 7年 6年 6年利率 1.45% 1.26% 1.36% 2.13% 2.03% 1.57% 1.64%格付※2 A-
発⾏⽇ 05年6⽉ 05年11⽉ 07年4⽉ 09年6⽉ 09年9⽉ 10年9⽉ 11年6⽉ 12年9⽉ 13年2⽉ 13年6⽉
発⾏額 125 200 200 600 650 1,300 1,000 1,000 3,000 4,000年限 3年 3年 3年 2年 3年 3年 5年 5年 4年 5年利率 1.41% 1.36% 2.72% 5.10% 4.52% 1.24% 1.00% 0.74% 1.47% 1.74%格付※2 BBB BBB+ A- A
• 2005年より福岡ソフトバンクホークスボンドとして継続発⾏• 発⾏総額 3.7兆円、既償還総額 1.2兆円• 利率・総付景品などにより⼈気商品化• SBGリテール社債保有者数は約65万⼈にのぼる※1
当社の取り組み︓個⼈向け普通社債発⾏
⼤型発⾏開始
<総付景品>
(億円)
※1 SBGリテール社債保有者数は、SBG社債保有⼝座のべ数の合算。各証券会社ヒヤリングベース※2 格付はすべてJCRより取得
運⽤難時代の個⼈投資家のニーズにマッチした調達⼿段として確⽴
約1.2兆円を償還
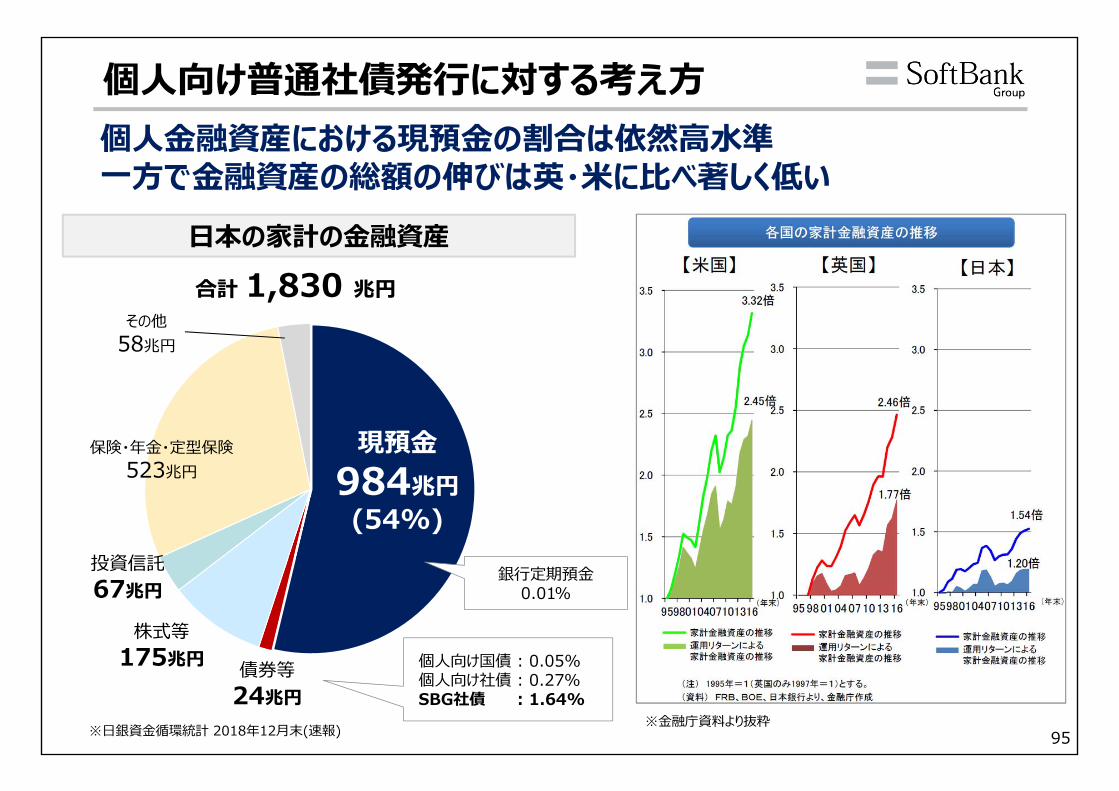
95
個⼈向け普通社債発⾏に対する考え⽅
現預⾦984兆円(54%)
合計 1,830 兆円
債券等24兆円
投資信託67兆円
株式等175兆円
その他58兆円
保険・年⾦・定型保険523兆円
個⼈⾦融資産における現預⾦の割合は依然⾼⽔準⼀⽅で⾦融資産の総額の伸びは英・⽶に⽐べ著しく低い
※⽇銀資⾦循環統計 2018年12⽉末(速報)
⽇本の家計の⾦融資産
銀⾏定期預⾦0.01%
個⼈向け国債 : 0.05%個⼈向け社債 : 0.27%SBG社債 : 1.64%
※⾦融庁資料より抜粋
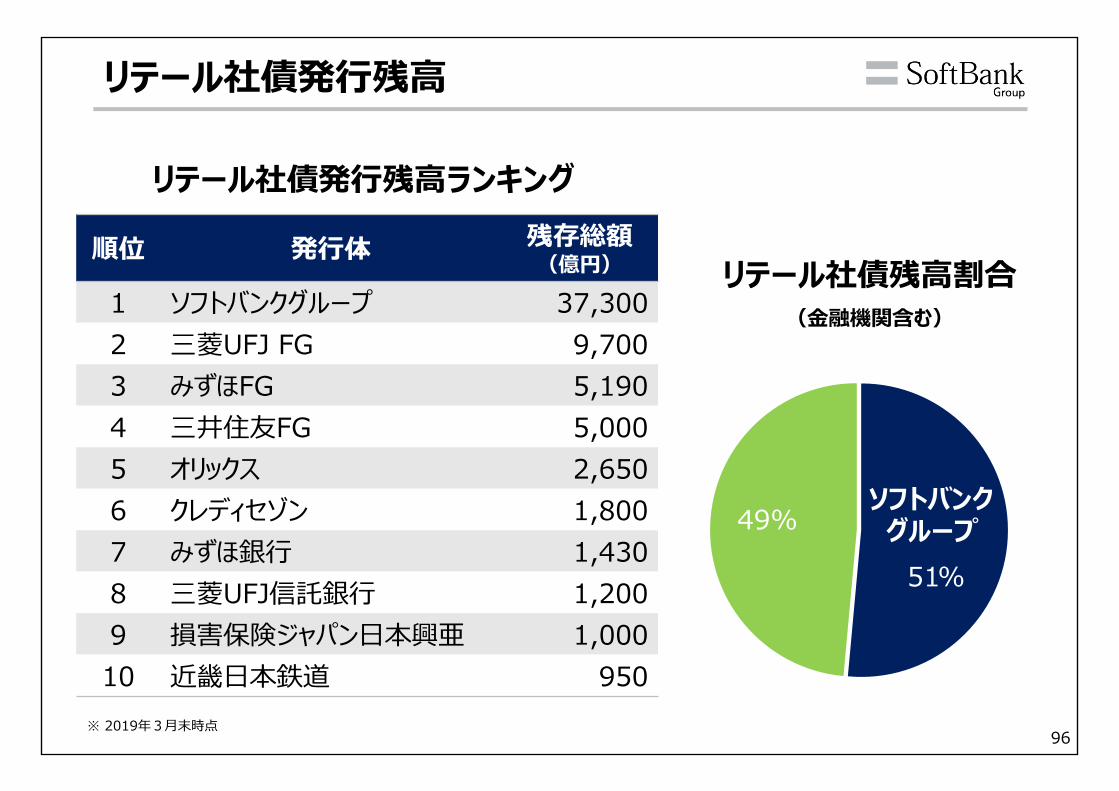
96
リテール社債発⾏残⾼
順位 発⾏体 残存総額(億円)
1 ソフトバンクグループ 37,3002 三菱UFJ FG 9,7003 みずほFG 5,1904 三井住友FG 5,0005 オリックス 2,6506 クレディセゾン 1,8007 みずほ銀⾏ 1,4308 三菱UFJ信託銀⾏ 1,2009 損害保険ジャパン⽇本興亜 1,00010 近畿⽇本鉄道 950
※ 2019年3⽉末時点
51%
49%
リテール社債残⾼割合(⾦融機関含む)
リテール社債発⾏残⾼ランキング
ソフトバンクグループ
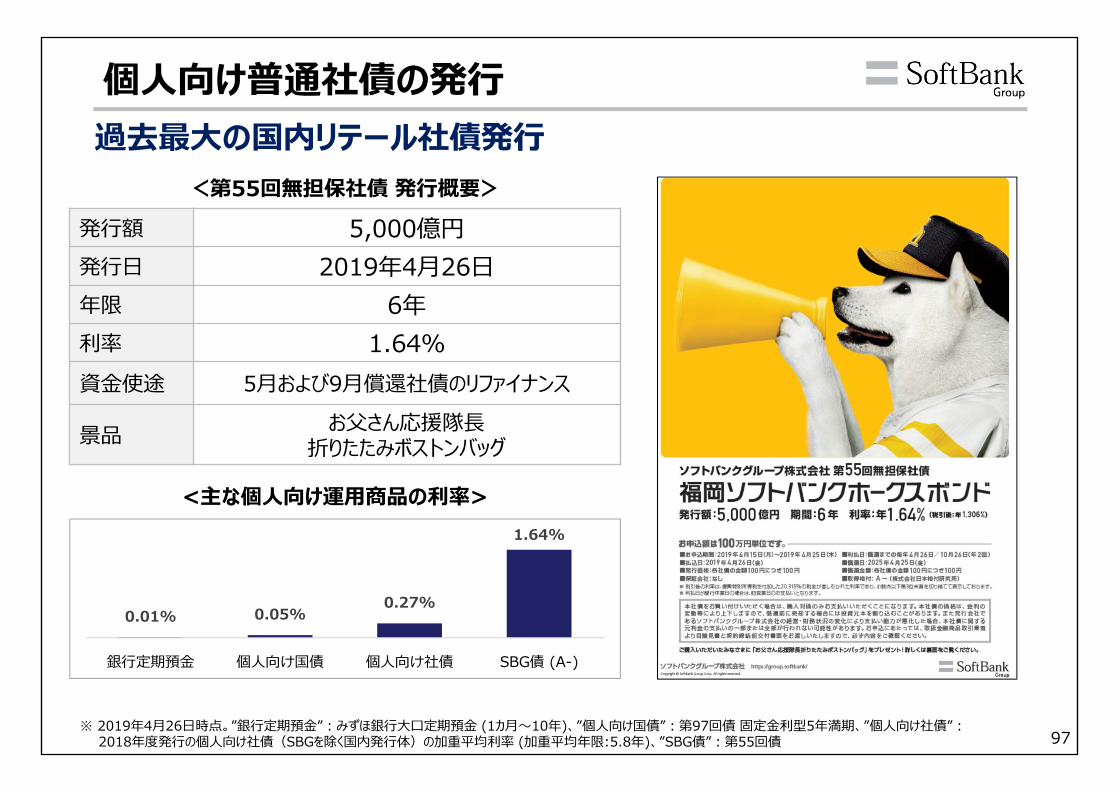
97
<第55回無担保社債 発⾏概要>発⾏額 5,000億円発⾏⽇ 2019年4⽉26⽇年限 6年利率 1.64%資⾦使途 5⽉および9⽉償還社債のリファイナンス
景品 お⽗さん応援隊⻑折りたたみボストンバッグ
過去最⼤の国内リテール社債発⾏個⼈向け普通社債の発⾏
0.01% 0.05%0.27%
1.64%
銀⾏定期預⾦ 個⼈向け国債 個⼈向け社債 SBG債 (A-)
<主な個⼈向け運⽤商品の利率>
※ 2019年4⽉26⽇時点。”銀⾏定期預⾦”︓みずほ銀⾏⼤⼝定期預⾦ (1カ⽉〜10年)、”個⼈向け国債”︓第97回債 固定⾦利型5年満期、”個⼈向け社債”︓2018年度発⾏の個⼈向け社債(SBGを除く国内発⾏体)の加重平均利率 (加重平均年限:5.8年)、”SBG債”︓第55回債
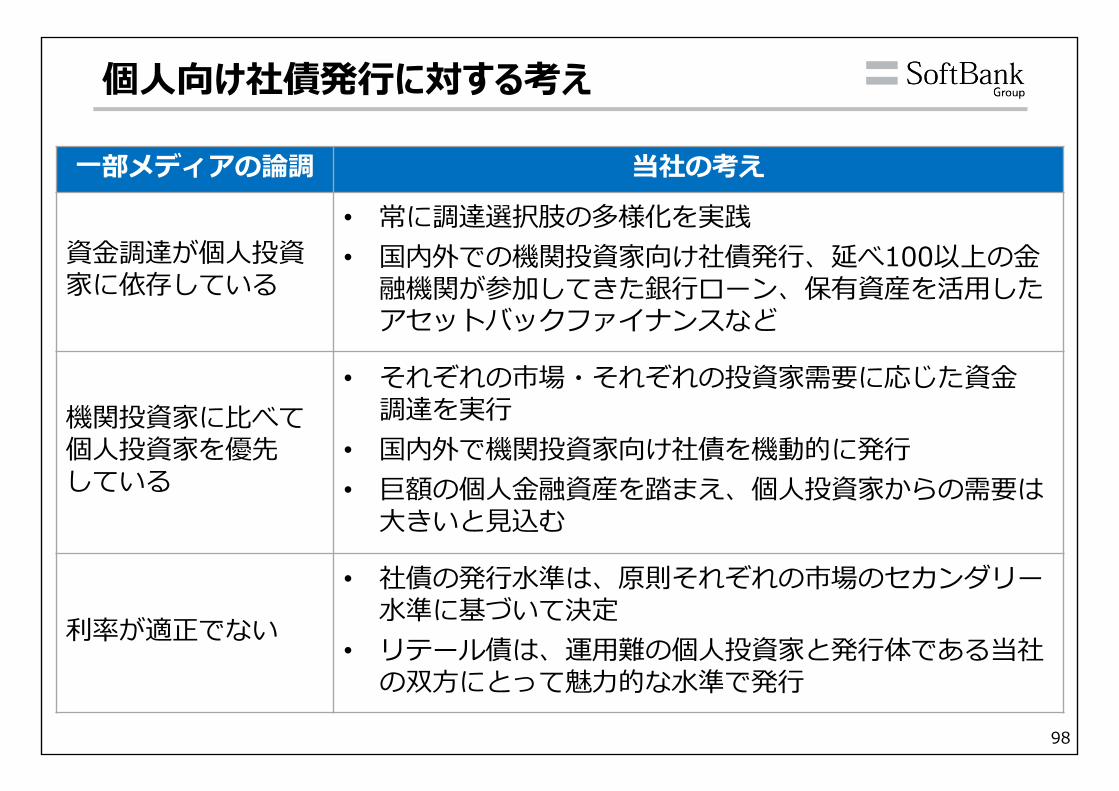
98
個⼈向け社債発⾏に対する考え
⼀部メディアの論調 当社の考え
資⾦調達が個⼈投資家に依存している
• 常に調達選択肢の多様化を実践• 国内外での機関投資家向け社債発⾏、延べ100以上の⾦
融機関が参加してきた銀⾏ローン、保有資産を活⽤したアセットバックファイナンスなど
機関投資家に⽐べて個⼈投資家を優先している
• それぞれの市場・それぞれの投資家需要に応じた資⾦調達を実⾏
• 国内外で機関投資家向け社債を機動的に発⾏• 巨額の個⼈⾦融資産を踏まえ、個⼈投資家からの需要は
⼤きいと⾒込む
利率が適正でない
• 社債の発⾏⽔準は、原則それぞれの市場のセカンダリー⽔準に基づいて決定
• リテール債は、運⽤難の個⼈投資家と発⾏体である当社の双⽅にとって魅⼒的な⽔準で発⾏

99
Appendix
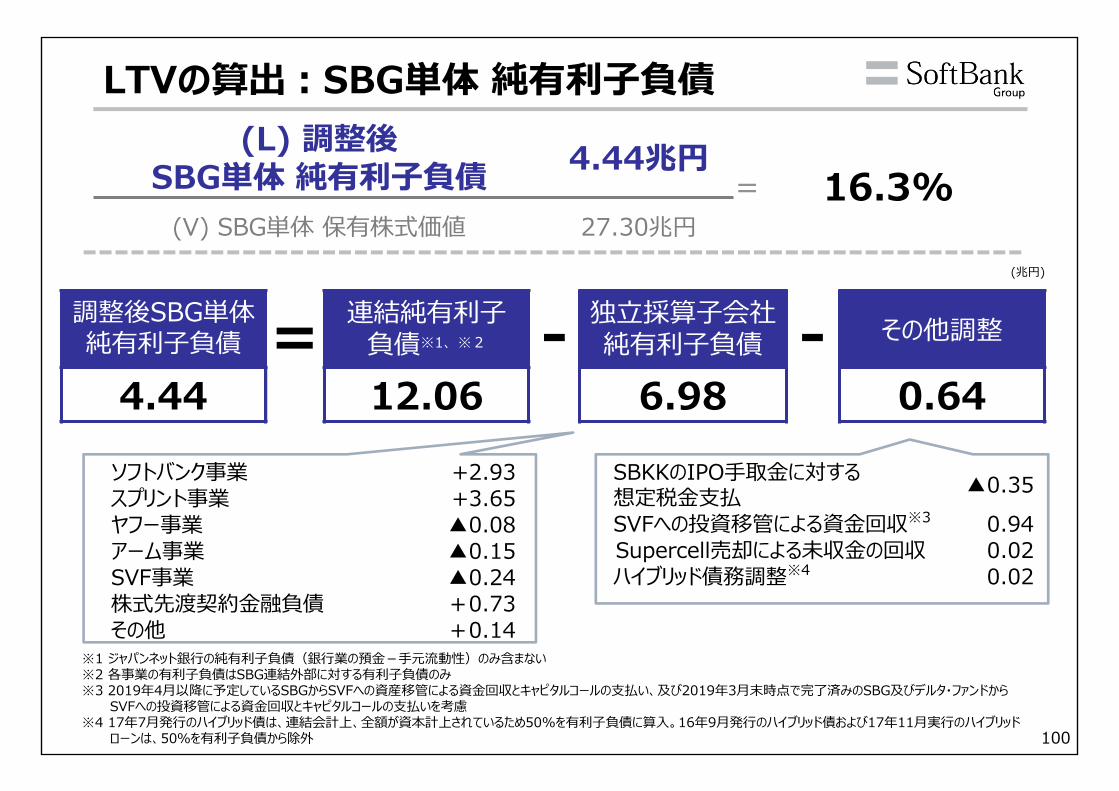
100
(L) 調整後SBG単体 純有利⼦負債 4.44兆円
= 16.3%(V) SBG単体 保有株式価値 27.30兆円
LTVの算出︓SBG単体 純有利⼦負債
ソフトバンク事業 +2.93スプリント事業 +3.65ヤフー事業 ▲0.08アーム事業 ▲0.15SVF事業 ▲0.24株式先渡契約⾦融負債 +0.73その他 +0.14
(兆円)
= - -3.6
SBKKのIPO⼿取⾦に対する想定税⾦⽀払 ▲0.35SVFへの投資移管による資⾦回収※3 0.94Supercell売却による未収⾦の回収 0.02ハイブリッド債務調整※4 0.02
調整後SBG単体純有利⼦負債
4.44
連結純有利⼦負債※1、※2
12.06
独⽴採算⼦会社純有利⼦負債
6.98その他調整
0.64
※1 ジャパンネット銀⾏の純有利⼦負債(銀⾏業の預⾦-⼿元流動性)のみ含まない※2 各事業の有利⼦負債はSBG連結外部に対する有利⼦負債のみ※3 2019年4⽉以降に予定しているSBGからSVFへの資産移管による資⾦回収とキャピタルコールの⽀払い、及び2019年3⽉末時点で完了済みのSBG及びデルタ・ファンドから
SVFへの投資移管による資⾦回収とキャピタルコールの⽀払いを考慮※4 17年7⽉発⾏のハイブリッド債は、連結会計上、全額が資本計上されているため50%を有利⼦負債に算⼊。16年9⽉発⾏のハイブリッド債および17年11⽉実⾏のハイブリッド
ローンは、50%を有利⼦負債から除外
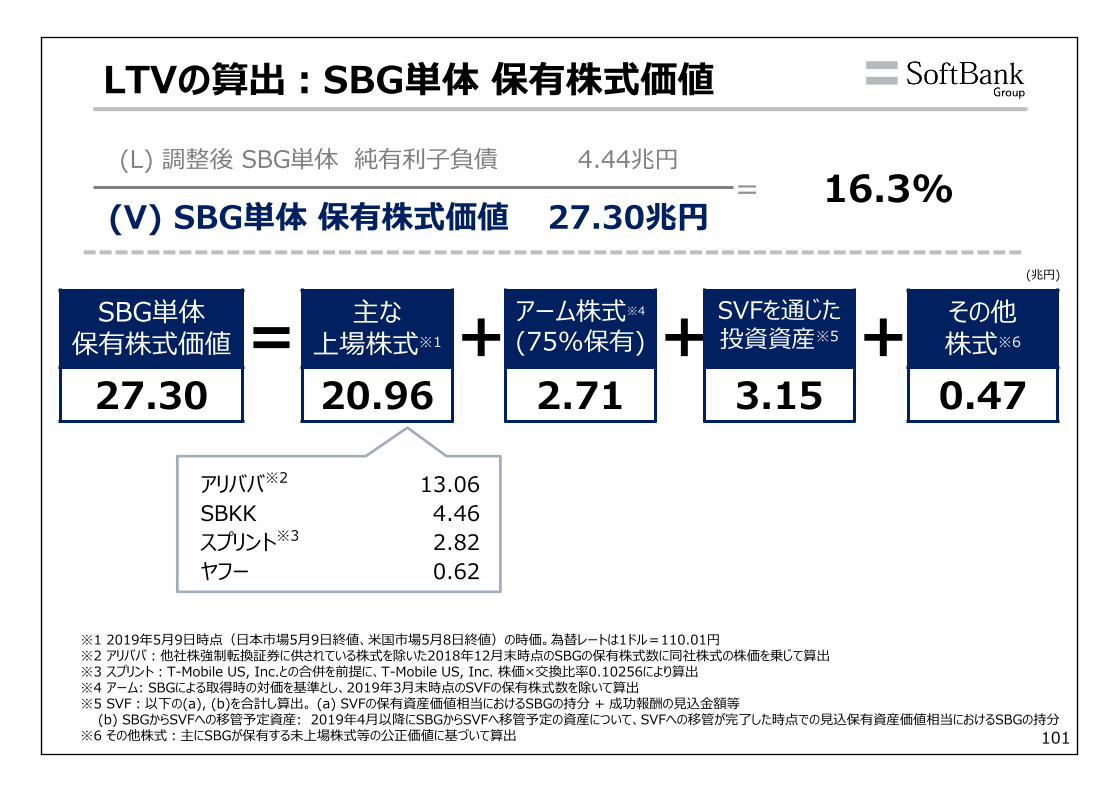
101
LTVの算出︓SBG単体 保有株式価値
= +
(L) 調整後 SBG単体 純有利⼦負債 4.44兆円= 16.3%
(V) SBG単体 保有株式価値 27.30兆円
アリババ※2 13.06SBKK 4.46スプリント※3 2.82ヤフー 0.62
(兆円)
SBG単体保有株式価値
27.30
主な上場株式※1
20.96+アーム株式※4
(75%保有)
2.71+SVFを通じた
投資資産※5
3.15
その他株式※6
0.47
※1 2019年5⽉9⽇時点(⽇本市場5⽉9⽇終値、⽶国市場5⽉8⽇終値)の時価。為替レートは1ドル=110.01円※2 アリババ︓他社株強制転換証券に供されている株式を除いた2018年12⽉末時点のSBGの保有株式数に同社株式の株価を乗じて算出※3 スプリント︓T-Mobile US, Inc.との合併を前提に、T-Mobile US, Inc. 株価×交換⽐率0.10256により算出※4 アーム: SBGによる取得時の対価を基準とし、2019年3⽉末時点のSVFの保有株式数を除いて算出※5 SVF︓以下の(a), (b)を合計し算出。 (a) SVFの保有資産価値相当におけるSBGの持分 + 成功報酬の⾒込⾦額等
(b) SBGからSVFへの移管予定資産: 2019年4⽉以降にSBGからSVFへ移管予定の資産について、SVFへの移管が完了した時点での⾒込保有資産価値相当におけるSBGの持分※6 その他株式︓主にSBGが保有する未上場株式等の公正価値に基づいて算出
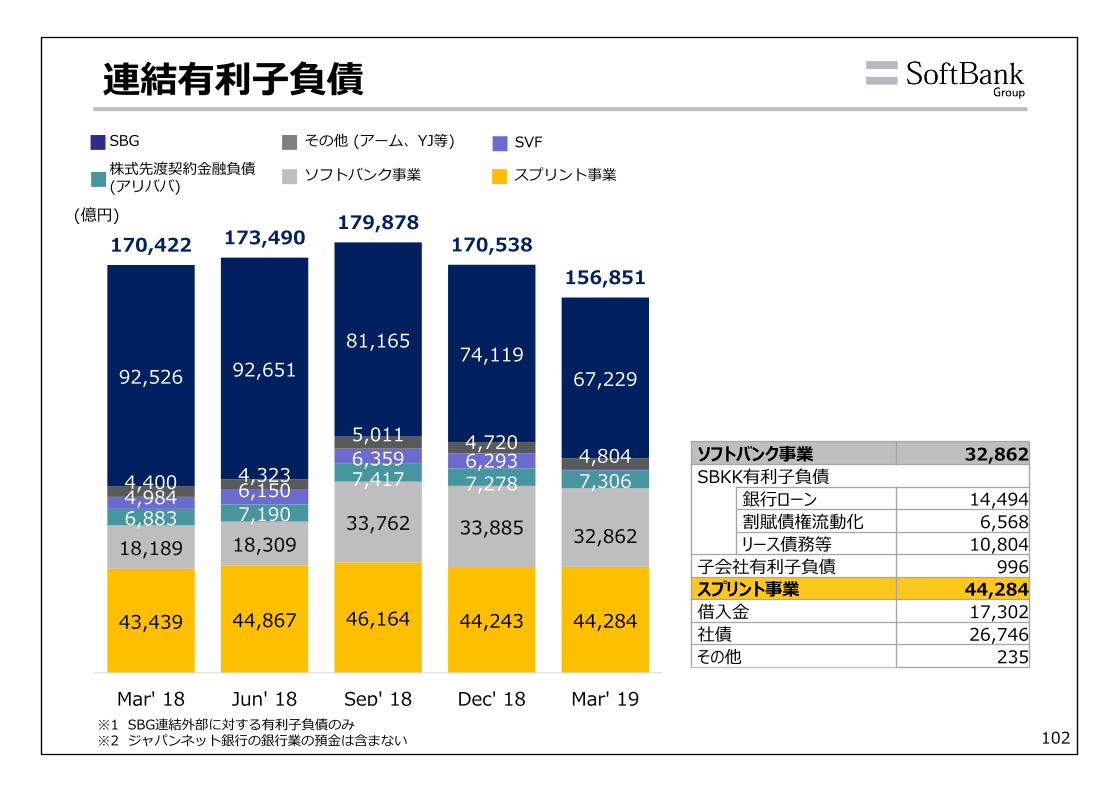
102
43,439 44,867 46,164 44,243 44,284
18,189 18,30933,762 33,885 32,862
6,883 7,190
7,417 7,278 7,3064,984 6,150
6,359 6,2934,400 4,323
5,011 4,720 4,804
92,526 92,65181,165 74,119
67,229
170,422 173,490179,878
170,538156,851
Mar' 18 Jun' 18 Sep' 18 Dec' 18 Mar' 19
スプリント事業ソフトバンク事業
連結有利⼦負債
(億円)
※1 SBG連結外部に対する有利⼦負債のみ※2 ジャパンネット銀⾏の銀⾏業の預⾦は含まない
SVFSBG その他 (アーム、YJ等)
株式先渡契約⾦融負債(アリババ)
ソフトバンク事業 32,862SBKK有利⼦負債
銀⾏ローン 14,494割賦債権流動化 6,568リース債務等 10,804
⼦会社有利⼦負債 996スプリント事業 44,284借⼊⾦ 17,302社債 26,746その他 235
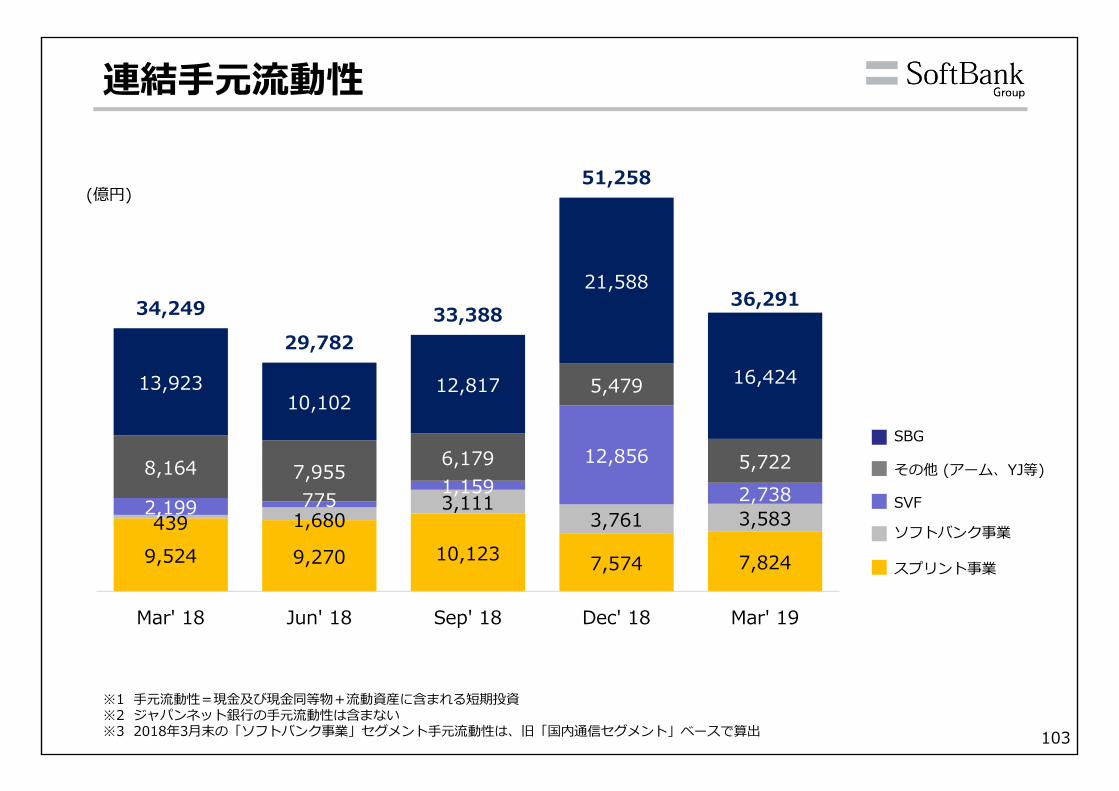
103
連結⼿元流動性
※1 ⼿元流動性=現⾦及び現⾦同等物+流動資産に含まれる短期投資※2 ジャパンネット銀⾏の⼿元流動性は含まない※3 2018年3⽉末の「ソフトバンク事業」セグメント⼿元流動性は、旧「国内通信セグメント」ベースで算出
(億円)
スプリント事業
ソフトバンク事業
SVF
SBG
その他 (アーム、YJ等)
9,524 9,270 10,123 7,574 7,824
439 1,6803,111
3,761 3,5832,199 775 1,15912,856
2,7388,164 7,955 6,179
5,479
5,722
13,92310,102
12,817
21,588
16,424
34,24929,782
33,388
51,258
36,291
Mar' 18 Jun' 18 Sep' 18 Dec' 18 Mar' 19
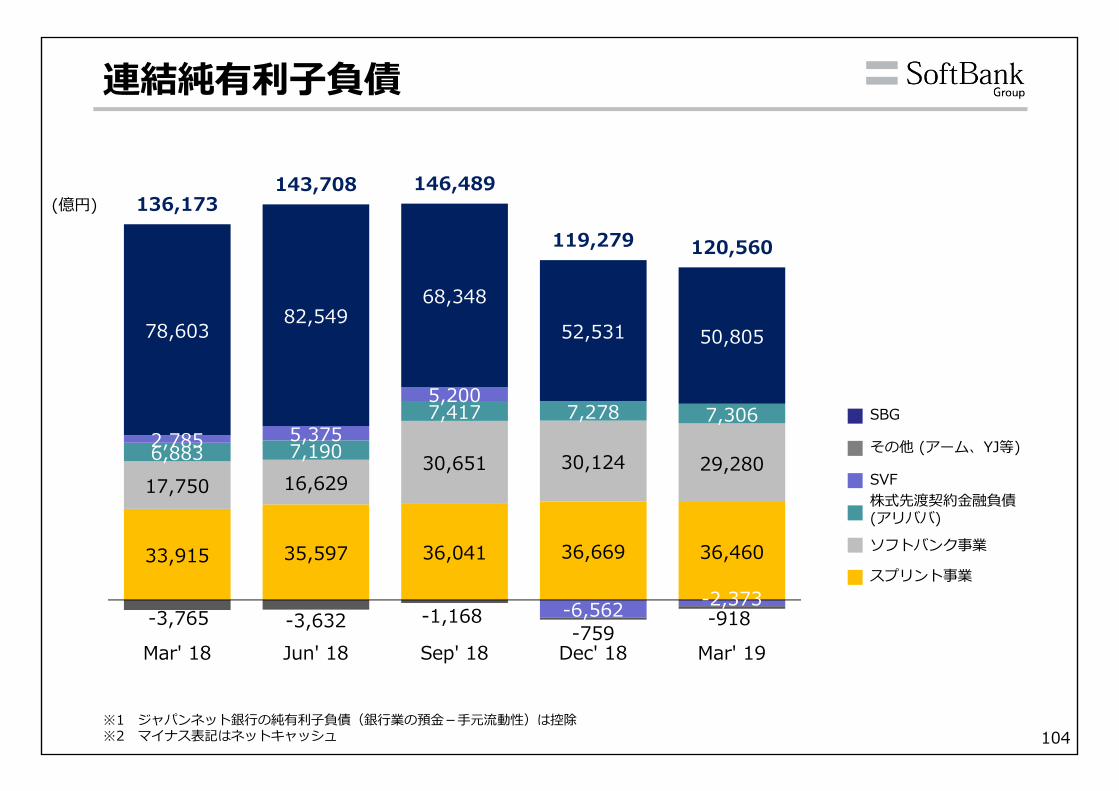
104
連結純有利⼦負債
(億円)
※1 ジャパンネット銀⾏の純有利⼦負債(銀⾏業の預⾦-⼿元流動性)は控除※2 マイナス表記はネットキャッシュ
スプリント事業
ソフトバンク事業
SVF
SBG
その他 (アーム、YJ等)
株式先渡契約⾦融負債(アリババ)
33,915 35,597 36,041 36,669 36,460
17,750 16,62930,651 30,124 29,2806,883 7,190
7,417 7,278 7,3062,785 5,375
5,200
-6,562 -2,373-3,765 -3,632 -1,168
-759-918
78,60382,549
68,348
52,531 50,805
136,173143,708 146,489
119,279 120,560
Mar' 18 Jun' 18 Sep' 18 Dec' 18 Mar' 19