Embed Size (px)
Citation preview
C&C Group plc | Year ended 28 February 2014 Page 1
RESULTS FOR THE YEAR ENDED 28 FEBRUARY 2014 Dublin, London, 20 May 2014: C&C Group plc (‘C&C’ or the 'Group’), a leading manufacturer, marketer and distributor of branded cider, beer, wine and soft drinks announces results for the year ended 28 February 2014.
FY2014 % change
Net Revenue €620.2m +30.0% EBITDA
(i) €150.7m +10.6%
Operating profit(ii)
€126.7m +10.6% Free cash flow*
(iii)
€78.5m
+31.5%
Free cash flow*/EBITDA (% conversion) 52% Basic Earnings per Share (EPS) 24.7 cent -9.2% Adjusted diluted EPS
(iv) 29.5 cent +5.7%
Dividend per share 10.0 cent +14.3% Net debt/EBITDA
(v) 0.99x
* before cash outflow for exceptional items
FY2014 Highlights
FY2014 operating profit(ii)
growth of 10.6% to €126.7 million in line with stated guidance. This outcome represents a solid performance with double-digit operating profit growth from four of the Group’s five reporting segments.
C&C recorded a particularly strong performance in Ireland and Scotland. The acquisition of Gleeson and
the investment in Wallaces Express represented significant steps toward the development of customer centric, multi-beverage business models in these markets.
The evolution of the business model in core markets contributed positively to the performance of the
Group’s brands. In ROI, C&C ciders improved market share(vii)
, grew volume and increased revenue for the first time in seven years. In Scotland and Northern Ireland, Tennent’s and our portfolio of brands continued to deliver growth in the Independent Free Trade, achieving impressive market share, revenue growth and volume gains.
Cider UK performance stabilised in the second half of the year. The cider category has commoditised
and focus remains on developing and maintaining profitable positions in a competitive market.
The international business as a whole continues to develop with operating profit up 68% in FY2014 (on a constant currency basis
(vi).
In the US, extensive wholesaler consolidation and business integration concluded successfully during
the year. Increased investment and new entrants fuelled high growth in the cider category but C&C volume growth was disappointingly behind the category. However, C&C remains confident in the prospects for its portfolio of authentic cider brands in the US market.
We are pleased with progress in innovation and new product development: Caledonia Best ale,
Heverlee hand crafted premium Belgian lager, Tennent’s Beer aged in Whisky Oak and Tennent’s Stout have delivered growth. We also recently launched Montano Italian cider and in Ireland, Bulmers is launching Clonmel 1650, a new premium Irish lager.
C&C has strong underlying cash generative capability. Net debt/EBITDA
(v) at the year-end was less than
1.0x despite an unusually high level of cash investment in acquisitions and expansion. The latter including a new cidery in Vermont and new craft breweries in Clonmel and Glasgow.
For note references please see page 14

C&C Group plc | Year ended 28 February 2014 Page 2
C&C’s proposed final dividend is 5.7 cent per share, representing full year dividend growth of 14.3%
compared with last year. The increase reflects the Group’s strong balance sheet, underlying cash generation capability and commitment to deliver value for shareholders.
For note references please see page 14
C&C Group plc | Year ended 28 February 2014 Page 3
Stephen Glancey, C&C Group CEO, commented: “FY2014 is our fifth successive year of earnings growth and our full year outcome represents a robust performance with continued progress against all financial measures. This performance was delivered while managing the change associated with the integration of recent acquisitions in Ireland, Scotland and the US. Despite investing just over €80 million of capital during the year, our balance sheet remains strong with net debt/EBITDA of less than 1.0x at the year end. Balance sheet strength, strong cash generation capability and resilient core markets will sustain a progressive dividend stream with full year dividend growth of 14.3%. The cornerstone of our strategy is maintaining strong domestic brand market combinations. FY2014 marked continued progress towards this objective with the development of a customer focused, multi-beverage model in Scotland and Ireland. This includes an expanded and well-invested brand portfolio and enhanced sales force capability. In Scotland we are pleased with progress on Caledonia and Heverlee and in Ireland we are optimistic on the prospects for our new Irish lager, Clonmel 1650. Macro conditions in Ireland and the UK are gradually improving and our businesses are well positioned to benefit from improved consumer sentiment in these key markets. In the UK, the broader cider market remains competitive and commoditised. We are focused on building a portfolio of authentic, traditional high quality ciders targeting the premium, and craft segments of the market. In the US, the combined impact of integration, increased competition and distributor consolidation materially impacted our performance. While we have re-based our own short term expectations of growth, the market remains both attractive and dynamic. With integration behind us, we are focused on a range of commercial and marketing initiatives to improve operating performance. Longer term, our investment in the new cidery in Vermont reflects our commitment to the US and the absolute authenticity of our product. We are passionate about the quality of our beers and ciders. Our credentials were recently confirmed with wins of first, second and third places in both of the hard cider award categories at the World Expo of Beer in the US. In England we were awarded a number of medals for Newton Vale and Chaplin & Cork’s cider at the Shepton Mallet Cider Mill. We believe there are a number of factors which define our business. These factors sustain our belief in C&C’s ability to perform and its future prospects. A resilient, multi-beverage customer-centric model in Ireland and Scotland provides us with a strong and sustainable earning and free cash flow base. This, coupled with our balance sheet strength, allows us to capitalise on the opportunities represented by higher growth international markets through participation and exports. C&C believes that the fundamentals of its core markets and its position within those markets support continued earnings growth. For the current financial year, the objective is to deliver mid-single digit operating profit growth”
C&C Group plc | Year ended 28 February 2014 Page 4
About C&C Group plc C&C Group plc is a manufacturer, marketer and distributor of branded cider and beer. The Group manufactures Bulmers, the leading Irish cider brand, Magners, the premium international cider brand, Gaymers cider and the Shepton Mallet Cider Mill range of English ciders and the Tennent's beer brand. C&C Group also owns Woodchuck and Hornsby’s, two of the leading craft cider brands in the United States. The Group’s Irish wholesaling subsidiary, Gleeson Group, manufactures Tipperary Water and Finches soft drinks. The Group also distributes a number of beer brands in Scotland, Ireland and Northern Ireland, primarily for Anheuser-Busch Inbev, and owns Wallaces Express a Scottish drinks wholesaler. Note regarding forward-looking statements This announcement includes forward-looking statements, including statements concerning current expectations about future financial performance and economic and market conditions which C&C believe are reasonable. However, these statements are neither promises nor guarantees, but are subject to risks and uncertainties, including those factors discussed on pages 15 to 16 that could cause actual results to differ materially from those anticipated. Conference Call Details - Analysts & Institutional Investors C&C Group Plc will host a presentation for analysts and institutional investors, today, 20 May 2014, at 08.30am BST (03.30am ET) at Davy, Level 13, Dashwood House, 69 Old Broad Street, London EC2M 1QS. Live presentation and Q&A session also available via conference call on: Ireland +353 1 696 8154 UK & Europe +44 203 139 4830 USA +1 718 873 9077 Pin Code: 29019320# Conference Call Details - Media Management will host a newswire conference call today at 07.30 BST which can be accessed using the dial-in details below. Ireland +353 1 696 8154 UK & Europe +44 203 139 4830 Pin Code: 50581429# Management will also host a conference call for media today at 10.45 BST which can also be accessed using the dial-in details below. Ireland +353 1 696 8154 UK & Europe +44 203 139 4830 Pin Code: 15818757# For all conference call replay numbers, please contact FTI Consulting. Investors & Analysts: Mark Kenny/Jonathan Neilan | FTI Consulting | Tel: +353 1 663 3686, Email:
C&C Group plc | Year ended 28 February 2014 Page 5
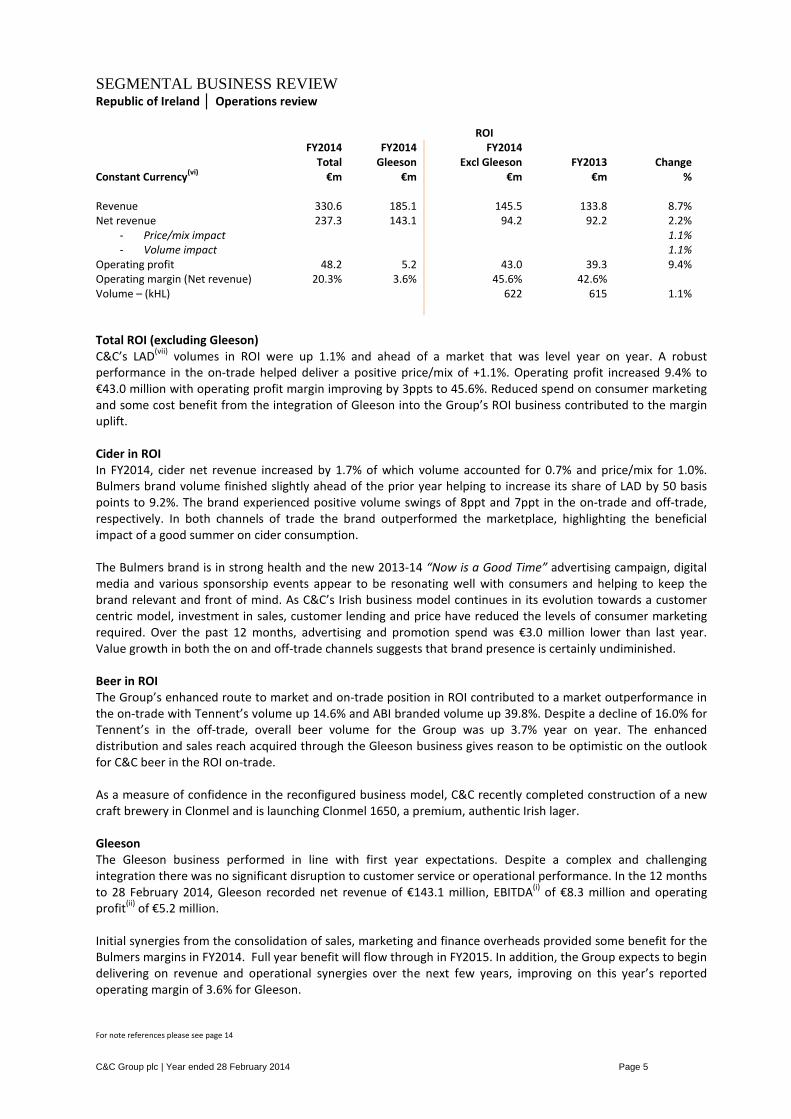
SEGMENTAL BUSINESS REVIEW Republic of Ireland │ Operations review ROI
Constant Currency(vi)
FY2014 Total
€m
FY2014 Gleeson
€m
FY2014 Excl Gleeson
€m FY2013
€m Change
% Revenue 330.6 185.1 145.5 133.8 8.7% Net revenue 237.3 143.1 94.2 92.2 2.2%
- Price/mix impact 1.1% - Volume impact 1.1%
Operating profit 48.2 5.2 43.0 39.3 9.4% Operating margin (Net revenue) 20.3% 3.6% 45.6% 42.6% Volume – (kHL) 622 615 1.1%
Total ROI (excluding Gleeson) C&C’s LAD
(vii) volumes in ROI were up 1.1% and ahead of a market that was level year on year. A robust
performance in the on-trade helped deliver a positive price/mix of +1.1%. Operating profit increased 9.4% to €43.0 million with operating profit margin improving by 3ppts to 45.6%. Reduced spend on consumer marketing and some cost benefit from the integration of Gleeson into the Group’s ROI business contributed to the margin uplift. Cider in ROI In FY2014, cider net revenue increased by 1.7% of which volume accounted for 0.7% and price/mix for 1.0%. Bulmers brand volume finished slightly ahead of the prior year helping to increase its share of LAD by 50 basis points to 9.2%. The brand experienced positive volume swings of 8ppt and 7ppt in the on-trade and off-trade, respectively. In both channels of trade the brand outperformed the marketplace, highlighting the beneficial impact of a good summer on cider consumption. The Bulmers brand is in strong health and the new 2013-14 “Now is a Good Time” advertising campaign, digital media and various sponsorship events appear to be resonating well with consumers and helping to keep the brand relevant and front of mind. As C&C’s Irish business model continues in its evolution towards a customer centric model, investment in sales, customer lending and price have reduced the levels of consumer marketing required. Over the past 12 months, advertising and promotion spend was €3.0 million lower than last year. Value growth in both the on and off-trade channels suggests that brand presence is certainly undiminished. Beer in ROI The Group’s enhanced route to market and on-trade position in ROI contributed to a market outperformance in the on-trade with Tennent’s volume up 14.6% and ABI branded volume up 39.8%. Despite a decline of 16.0% for Tennent’s in the off-trade, overall beer volume for the Group was up 3.7% year on year. The enhanced distribution and sales reach acquired through the Gleeson business gives reason to be optimistic on the outlook for C&C beer in the ROI on-trade. As a measure of confidence in the reconfigured business model, C&C recently completed construction of a new craft brewery in Clonmel and is launching Clonmel 1650, a premium, authentic Irish lager. Gleeson The Gleeson business performed in line with first year expectations. Despite a complex and challenging integration there was no significant disruption to customer service or operational performance. In the 12 months to 28 February 2014, Gleeson recorded net revenue of €143.1 million, EBITDA
(i) of €8.3 million and operating
profit(ii)
of €5.2 million. Initial synergies from the consolidation of sales, marketing and finance overheads provided some benefit for the Bulmers margins in FY2014. Full year benefit will flow through in FY2015. In addition, the Group expects to begin delivering on revenue and operational synergies over the next few years, improving on this year’s reported operating margin of 3.6% for Gleeson. For note references please see page 14
C&C Group plc | Year ended 28 February 2014 Page 6
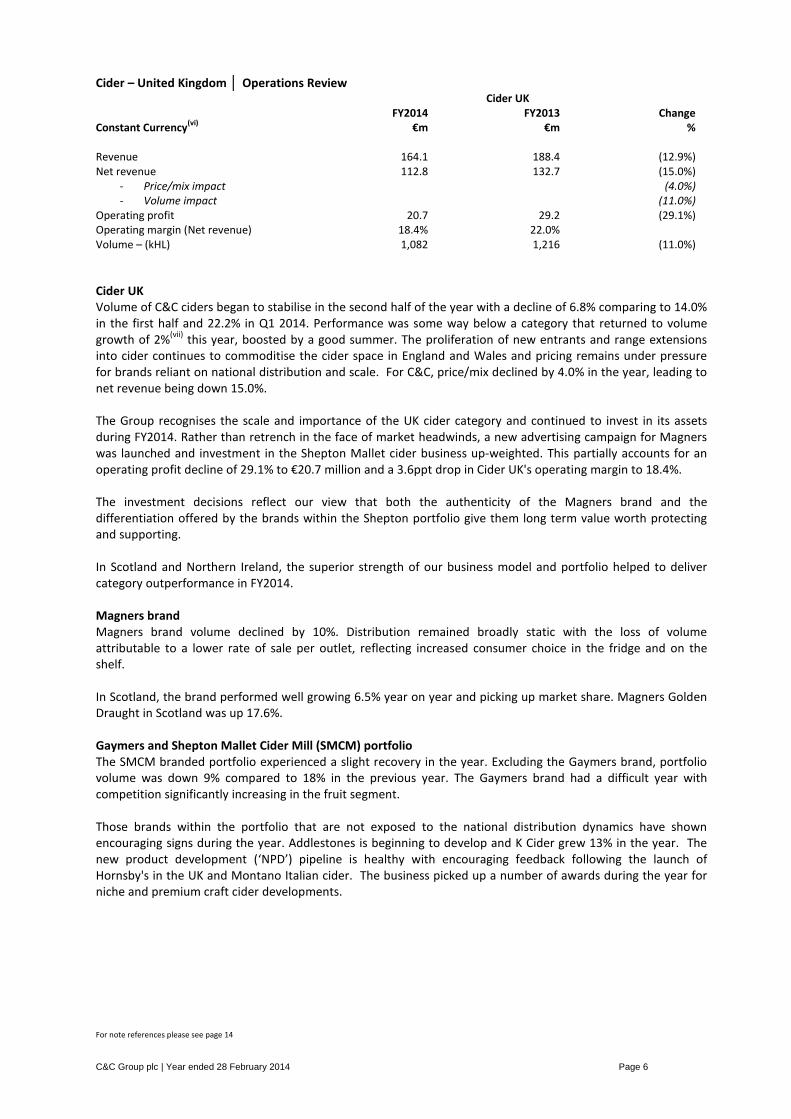
Cider – United Kingdom │ Operations Review Cider UK
Constant Currency(vi)
FY2014
€m FY2013
€m Change
% Revenue 164.1 188.4 (12.9%) Net revenue 112.8 132.7 (15.0%)
- Price/mix impact (4.0%) - Volume impact (11.0%)
Operating profit 20.7 29.2 (29.1%) Operating margin (Net revenue) 18.4% 22.0% Volume – (kHL) 1,082 1,216 (11.0%)
Cider UK Volume of C&C ciders began to stabilise in the second half of the year with a decline of 6.8% comparing to 14.0% in the first half and 22.2% in Q1 2014. Performance was some way below a category that returned to volume growth of 2%
(vii) this year, boosted by a good summer. The proliferation of new entrants and range extensions
into cider continues to commoditise the cider space in England and Wales and pricing remains under pressure for brands reliant on national distribution and scale. For C&C, price/mix declined by 4.0% in the year, leading to net revenue being down 15.0%. The Group recognises the scale and importance of the UK cider category and continued to invest in its assets during FY2014. Rather than retrench in the face of market headwinds, a new advertising campaign for Magners was launched and investment in the Shepton Mallet cider business up-weighted. This partially accounts for an operating profit decline of 29.1% to €20.7 million and a 3.6ppt drop in Cider UK's operating margin to 18.4%. The investment decisions reflect our view that both the authenticity of the Magners brand and the differentiation offered by the brands within the Shepton portfolio give them long term value worth protecting and supporting. In Scotland and Northern Ireland, the superior strength of our business model and portfolio helped to deliver category outperformance in FY2014. Magners brand Magners brand volume declined by 10%. Distribution remained broadly static with the loss of volume attributable to a lower rate of sale per outlet, reflecting increased consumer choice in the fridge and on the shelf. In Scotland, the brand performed well growing 6.5% year on year and picking up market share. Magners Golden Draught in Scotland was up 17.6%. Gaymers and Shepton Mallet Cider Mill (SMCM) portfolio The SMCM branded portfolio experienced a slight recovery in the year. Excluding the Gaymers brand, portfolio volume was down 9% compared to 18% in the previous year. The Gaymers brand had a difficult year with competition significantly increasing in the fruit segment. Those brands within the portfolio that are not exposed to the national distribution dynamics have shown encouraging signs during the year. Addlestones is beginning to develop and K Cider grew 13% in the year. The new product development (‘NPD’) pipeline is healthy with encouraging feedback following the launch of Hornsby's in the UK and Montano Italian cider. The business picked up a number of awards during the year for niche and premium craft cider developments. For note references please see page 14
C&C Group plc | Year ended 28 February 2014 Page 7
Tennent’s UK │ Operations Review Tennent’s UK
Constant Currency(vi)
FY2014
€m FY2013
€m Change
% Revenue 216.2 220.5 (2.0%) Net revenue 103.6 104.7 (1.1%)
- Price/mix impact 0.5% - Volume impact (1.6%)
Operating profit 34.6 29.1 18.9% Operating margin (Net revenue) 33.4% 27.8% Volume – (kHL) 1,273 1,294 (1.6%)
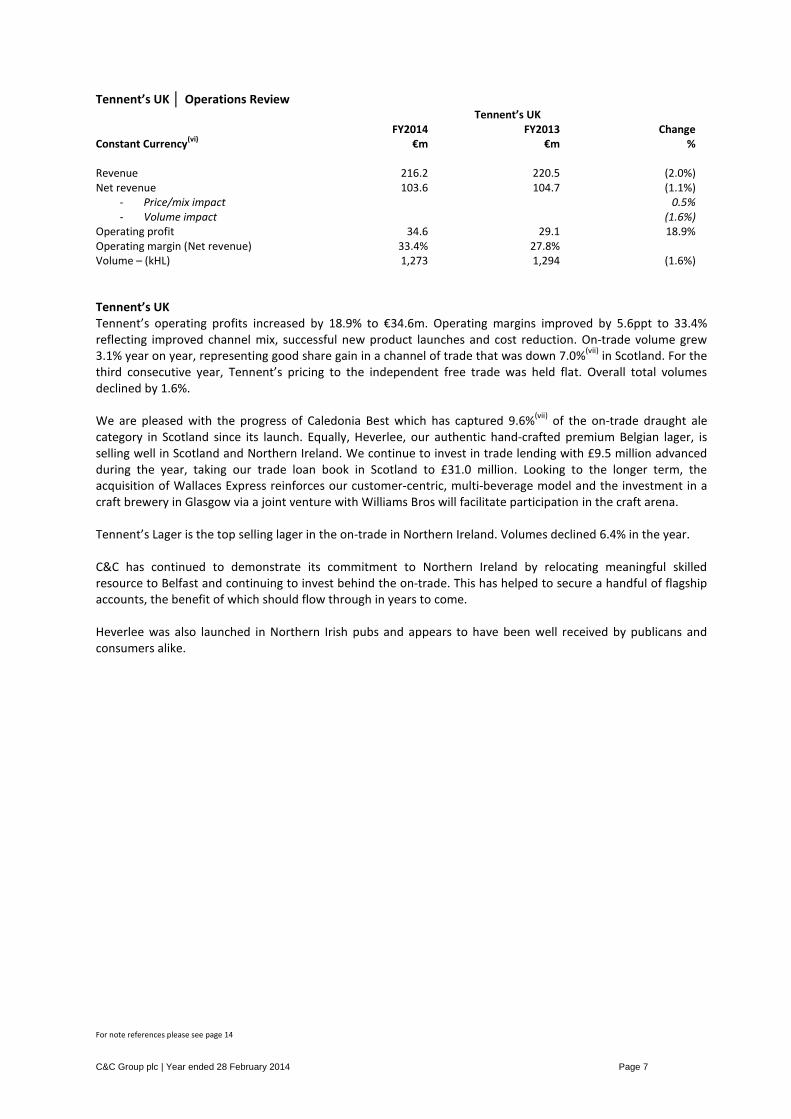
Tennent’s UK Tennent’s operating profits increased by 18.9% to €34.6m. Operating margins improved by 5.6ppt to 33.4% reflecting improved channel mix, successful new product launches and cost reduction. On-trade volume grew 3.1% year on year, representing good share gain in a channel of trade that was down 7.0%
(vii) in Scotland. For the
third consecutive year, Tennent’s pricing to the independent free trade was held flat. Overall total volumes declined by 1.6%. We are pleased with the progress of Caledonia Best which has captured 9.6%
(vii) of the on-trade draught ale
category in Scotland since its launch. Equally, Heverlee, our authentic hand-crafted premium Belgian lager, is selling well in Scotland and Northern Ireland. We continue to invest in trade lending with £9.5 million advanced during the year, taking our trade loan book in Scotland to £31.0 million. Looking to the longer term, the acquisition of Wallaces Express reinforces our customer-centric, multi-beverage model and the investment in a craft brewery in Glasgow via a joint venture with Williams Bros will facilitate participation in the craft arena. Tennent’s Lager is the top selling lager in the on-trade in Northern Ireland. Volumes declined 6.4% in the year. C&C has continued to demonstrate its commitment to Northern Ireland by relocating meaningful skilled resource to Belfast and continuing to invest behind the on-trade. This has helped to secure a handful of flagship accounts, the benefit of which should flow through in years to come. Heverlee was also launched in Northern Irish pubs and appears to have been well received by publicans and consumers alike. For note references please see page 14
C&C Group plc | Year ended 28 February 2014 Page 8
International │ Operations Review International
Constant Currency(vi)
FY2014
€m FY2013
€m Change
% Revenue 79.9 47.2 69.3% Net revenue 77.1 46.6 65.5%
- Price/mix impact (1.7%) - Volume impact 67.2%
Operating profit 16.0 9.5 68.4% Operating margin (Net revenue) 20.8% 20.4% Volume – (kHL) 545 326 67.2%
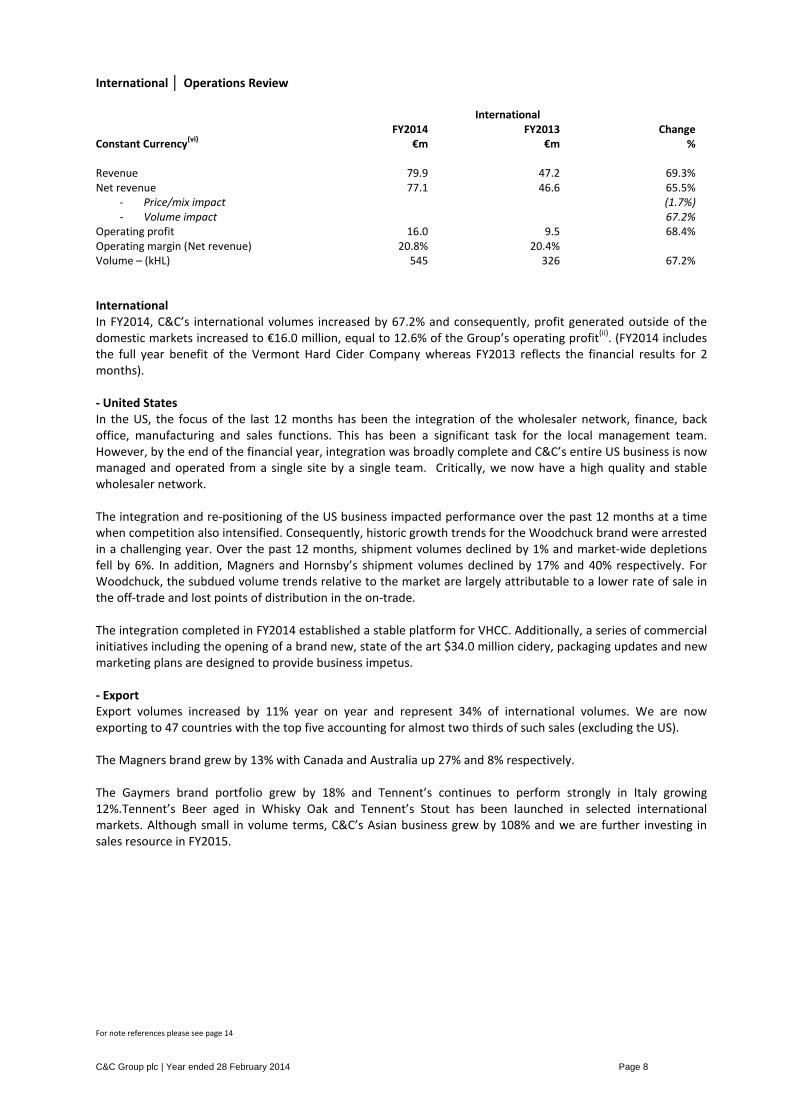
International In FY2014, C&C’s international volumes increased by 67.2% and consequently, profit generated outside of the domestic markets increased to €16.0 million, equal to 12.6% of the Group’s operating profit
(ii). (FY2014 includes
the full year benefit of the Vermont Hard Cider Company whereas FY2013 reflects the financial results for 2 months). - United States In the US, the focus of the last 12 months has been the integration of the wholesaler network, finance, back office, manufacturing and sales functions. This has been a significant task for the local management team. However, by the end of the financial year, integration was broadly complete and C&C’s entire US business is now managed and operated from a single site by a single team. Critically, we now have a high quality and stable wholesaler network. The integration and re-positioning of the US business impacted performance over the past 12 months at a time when competition also intensified. Consequently, historic growth trends for the Woodchuck brand were arrested in a challenging year. Over the past 12 months, shipment volumes declined by 1% and market-wide depletions fell by 6%. In addition, Magners and Hornsby’s shipment volumes declined by 17% and 40% respectively. For Woodchuck, the subdued volume trends relative to the market are largely attributable to a lower rate of sale in the off-trade and lost points of distribution in the on-trade. The integration completed in FY2014 established a stable platform for VHCC. Additionally, a series of commercial initiatives including the opening of a brand new, state of the art $34.0 million cidery, packaging updates and new marketing plans are designed to provide business impetus. - Export Export volumes increased by 11% year on year and represent 34% of international volumes. We are now exporting to 47 countries with the top five accounting for almost two thirds of such sales (excluding the US). The Magners brand grew by 13% with Canada and Australia up 27% and 8% respectively. The Gaymers brand portfolio grew by 18% and Tennent’s continues to perform strongly in Italy growing 12%.Tennent’s Beer aged in Whisky Oak and Tennent’s Stout has been launched in selected international markets. Although small in volume terms, C&C’s Asian business grew by 108% and we are further investing in sales resource in FY2015. For note references please see page 14
C&C Group plc | Year ended 28 February 2014 Page 9
Third Party Brands UK │ Operations Review Third Party Brands UK
Constant Currency(vi)
FY2014
€m FY2013
€m Change
% Revenue 122.1 112.2 8.8% Net revenue 89.4 86.7 3.1%
- Price/mix impact (7.6%) - Volume impact 10.7%
Operating profit 7.2 4.9 46.9% Operating margin (Net revenue) 8.1% 5.7% Volume – (kHL) 964 871 10.7%
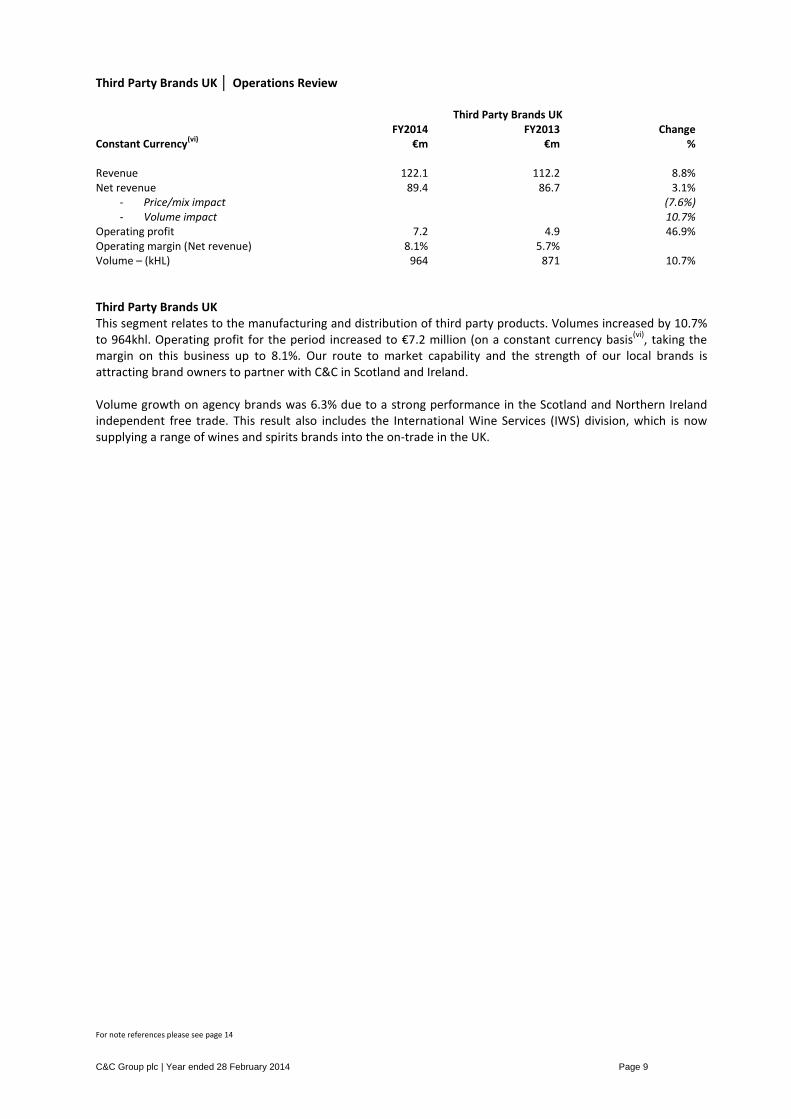
Third Party Brands UK This segment relates to the manufacturing and distribution of third party products. Volumes increased by 10.7% to 964khl. Operating profit for the period increased to €7.2 million (on a constant currency basis
(vi), taking the
margin on this business up to 8.1%. Our route to market capability and the strength of our local brands is attracting brand owners to partner with C&C in Scotland and Ireland. Volume growth on agency brands was 6.3% due to a strong performance in the Scotland and Northern Ireland independent free trade. This result also includes the International Wine Services (IWS) division, which is now supplying a range of wines and spirits brands into the on-trade in the UK. For note references please see page 14
C&C Group plc | Year ended 28 February 2014 Page 10
FINANCE REVIEW
Year ended
28 February
2014
€m
Year ended
28 February
2013
(restated)
€m
CC(vi) Year
ended
28 February
2013
€m
Change
%
CC -
Change
%
Net revenue 620.2 476.9 462.9 30.0% 34.0%
Operating profit(ii) 126.7 114.6 112.0 10.6% 13.1%
Net finance costs (11.0) (4.9)
Share of equity accounted investees’ profit after tax 0.5 -
Profit before tax 116.2 109.7
Income tax expense (15.1) (16.0)
Effective tax rate* 13.1% 14.6%
Profit for the year attributable to equity shareholders(ii) 101.1 93.7
Adjusted diluted EPS(iv) 29.5 cent 27.9 cent 5.7%
Dividend per Share 10.0 cent 8.75 cent 14.3%
Dividend payout ratio 33.9% 31.4%
* the effective tax rate is calculated based on the profit before tax excluding the Group’s share of equity accounted investees’ profit after tax
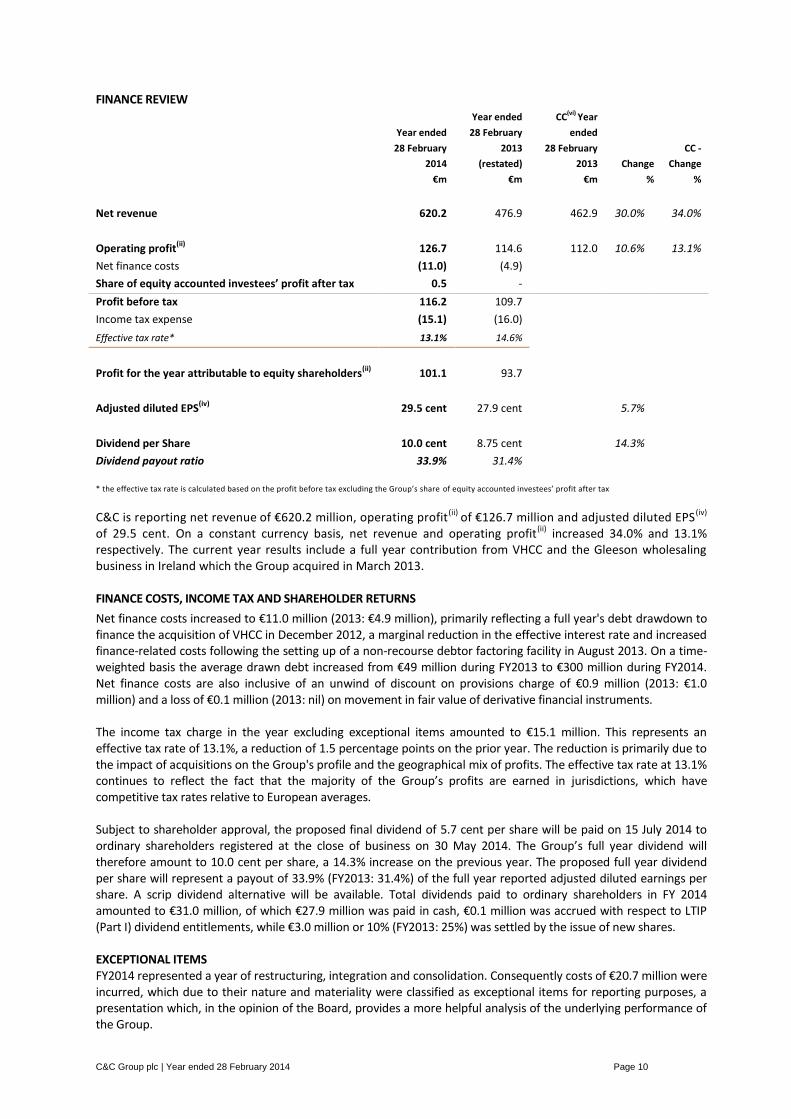
C&C is reporting net revenue of €620.2 million, operating profit(ii) of €126.7 million and adjusted diluted EPS(iv) of 29.5 cent. On a constant currency basis, net revenue and operating profit(ii) increased 34.0% and 13.1% respectively. The current year results include a full year contribution from VHCC and the Gleeson wholesaling business in Ireland which the Group acquired in March 2013. FINANCE COSTS, INCOME TAX AND SHAREHOLDER RETURNS
Net finance costs increased to €11.0 million (2013: €4.9 million), primarily reflecting a full year's debt drawdown to finance the acquisition of VHCC in December 2012, a marginal reduction in the effective interest rate and increased finance-related costs following the setting up of a non-recourse debtor factoring facility in August 2013. On a time-weighted basis the average drawn debt increased from €49 million during FY2013 to €300 million during FY2014. Net finance costs are also inclusive of an unwind of discount on provisions charge of €0.9 million (2013: €1.0 million) and a loss of €0.1 million (2013: nil) on movement in fair value of derivative financial instruments. The income tax charge in the year excluding exceptional items amounted to €15.1 million. This represents an effective tax rate of 13.1%, a reduction of 1.5 percentage points on the prior year. The reduction is primarily due to the impact of acquisitions on the Group's profile and the geographical mix of profits. The effective tax rate at 13.1% continues to reflect the fact that the majority of the Group’s profits are earned in jurisdictions, which have competitive tax rates relative to European averages. Subject to shareholder approval, the proposed final dividend of 5.7 cent per share will be paid on 15 July 2014 to ordinary shareholders registered at the close of business on 30 May 2014. The Group’s full year dividend will therefore amount to 10.0 cent per share, a 14.3% increase on the previous year. The proposed full year dividend per share will represent a payout of 33.9% (FY2013: 31.4%) of the full year reported adjusted diluted earnings per share. A scrip dividend alternative will be available. Total dividends paid to ordinary shareholders in FY 2014 amounted to €31.0 million, of which €27.9 million was paid in cash, €0.1 million was accrued with respect to LTIP (Part I) dividend entitlements, while €3.0 million or 10% (FY2013: 25%) was settled by the issue of new shares. EXCEPTIONAL ITEMS FY2014 represented a year of restructuring, integration and consolidation. Consequently costs of €20.7 million were incurred, which due to their nature and materiality were classified as exceptional items for reporting purposes, a presentation which, in the opinion of the Board, provides a more helpful analysis of the underlying performance of the Group.
C&C Group plc | Year ended 28 February 2014 Page 11
The items which were classified as exceptional include:- (a) Restructuring costs of €6.1 million: comprising severance and other initiatives arising from the integration of the Group’s Irish businesses following the current year acquisition of the Gleeson group and from cost cutting initiatives at the Group's manufacturing facilities resulted in an exceptional charge before tax of €6.7 million (2013: €1.2 million). This charge is reduced by a defined benefit pension scheme curtailment gain of €0.6 million due to the reduction in headcount numbers and the reclassification of these employees from active to deferred members. A curtailment gain arises where the value of the pension benefit of a deferred member is less than that of an active member.
(b) Acquisition-related costs of €1.1 million: comprising costs primarily attributed to the acquisition of the Gleeson group.
(c) Integration costs including write-off of redundant legacy IT assets of €5.6 million: primarily relating to the integration of the acquired Gleeson and VHCC businesses with the Group’s existing business and the resulting streamlining of its IT requirements leading to the write-off of IT assets no longer required.
(d) Redeployment of a bottling line incurring costs of €7.4 million: during the financial year a bottling line was redeployed from the Group's cider manufacturing facility in Clonmel to its cider manufacturing facility in Shepton Mallet, Somerset. Costs of €6.6 million were incurred in this regard. As a result of this deployment an existing PET line with a value of €0.8 million in Shepton Mallet became redundant and was written off.
(e) Other costs of €0.5 million include costs incurred in relation to the upgrading of the Group's listing on the Official List of the UK Listing Authority from a standard listing to a premium listing offset by the release of an excess onerous lease provision.
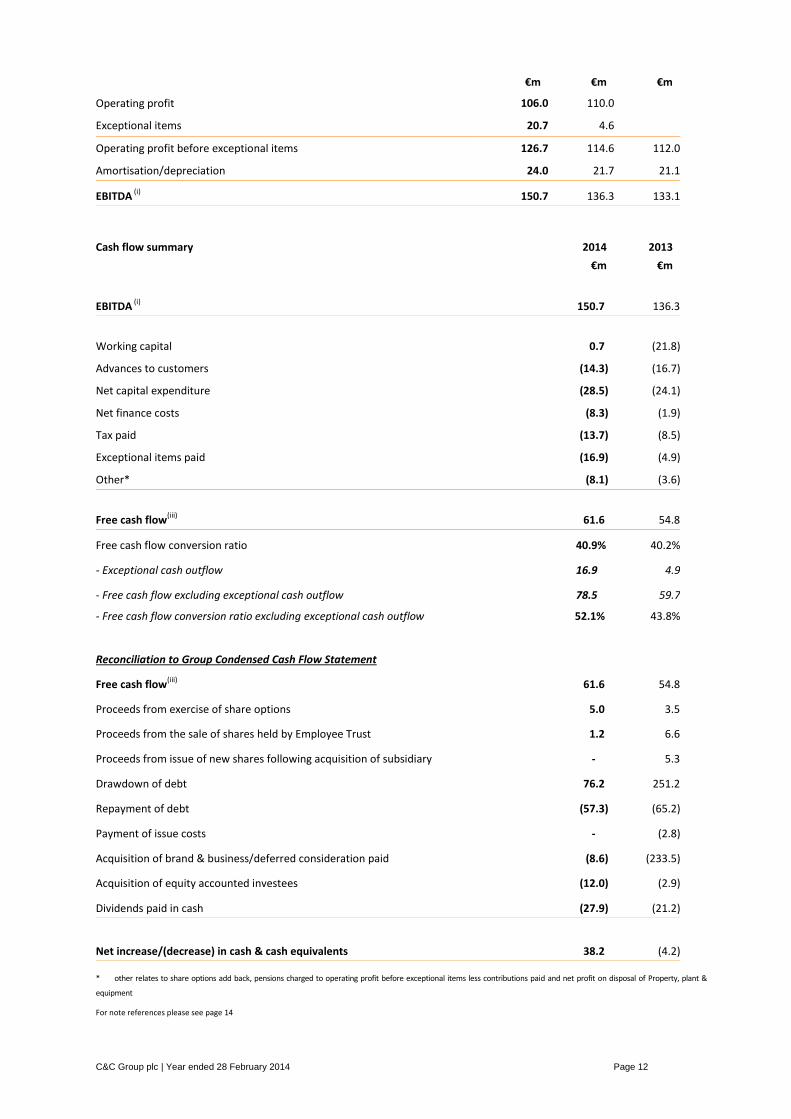
BALANCE SHEET STRENGTH, DEBT MANAGEMENT AND CASHFLOW GENERATION Balance sheet strength provides the Group with the financial flexibility to pursue its strategic objectives. The Group has a committed €350.0 million multi-currency five year syndicated revolving facility and is permitted under the terms of the agreement to have additional indebtedness to a maximum value of €150.0 million, giving the Group total debt capacity of €500.0 million. The debt facility matures on 28 February 2017. As at 28 February 2014 net debt(viii) was €145.2 million reflecting a net debt: EBITDA(v) ratio of less than 1.0x. Total assets reported by the Group were €1,380.5 million at 28 February 2014 (2013: €1,200.3 million). The Group’s portfolio of market leading brands and related goodwill is valued at €718.9 million, representing approximately 52% of total assets (2013: €705.8 million). Brand values and goodwill are assessed for impairment on an annual basis by comparing the carrying value of the assets with their recoverable amounts using value in use computations. Sensitivity analysis was performed on these calculations whereby the underlying assumptions (net revenue, operating profit, discount and terminal growth rates) were each negatively adjusted by 1 percentage point. Applying these individual assumptions, while holding all other assumptions constant, to the value in use computations did not indicate an impairment of the Group’s goodwill or brands. Cash generation Management reviews the Group’s cash generating performance by measuring the conversion of EBITDA to Free Cash Flow as we consider that this metric best highlights the underlying cash generating performance of the continuing business. The Group's performance during the year resulted in an EBITDA to Free Cash Flow conversion ratio of 40.9% (2013: 40.2%). The cash flow performance was adversely impacted by a number of factors including costs associated with integrating acquired businesses and restructuring existing businesses to reflect the new business model in Ireland, consulting and other costs directly related to the acquisition of businesses, increased financing costs, trade lending and capital expenditure. In addition taxation payments increased in line with an increased level of UK taxable profits and the expiration of UK accelerated capital allowances. A reconciliation of EBITDA to operating profit and a summary cash flow statement are set out on page 12. Reconciliation of EBITDA(i) to Operating profit(ii) 2014 2013 2013 CC(vi)
C&C Group plc | Year ended 28 February 2014 Page 12
€m €m €m
Operating profit 106.0 110.0
Exceptional items 20.7 4.6
Operating profit before exceptional items 126.7 114.6 112.0
Amortisation/depreciation 24.0 21.7 21.1
EBITDA (i) 150.7 136.3 133.1
Cash flow summary 2014 2013
€m €m
EBITDA (i) 150.7 136.3
Working capital 0.7 (21.8)
Advances to customers (14.3) (16.7)
Net capital expenditure (28.5) (24.1)
Net finance costs (8.3) (1.9)
Tax paid (13.7) (8.5)
Exceptional items paid (16.9) (4.9)
Other* (8.1) (3.6)
Free cash flow(iii) 61.6 54.8
Free cash flow conversion ratio 40.9% 40.2%
- Exceptional cash outflow 16.9 4.9
- Free cash flow excluding exceptional cash outflow 78.5 59.7
- Free cash flow conversion ratio excluding exceptional cash outflow 52.1% 43.8%
Reconciliation to Group Condensed Cash Flow Statement
Free cash flow(iii) 61.6 54.8
Proceeds from exercise of share options 5.0 3.5
Proceeds from the sale of shares held by Employee Trust 1.2 6.6
Proceeds from issue of new shares following acquisition of subsidiary - 5.3
Drawdown of debt 76.2 251.2
Repayment of debt (57.3) (65.2)
Payment of issue costs - (2.8)
Acquisition of brand & business/deferred consideration paid (8.6) (233.5)
Acquisition of equity accounted investees (12.0) (2.9)
Dividends paid in cash (27.9) (21.2)
Net increase/(decrease) in cash & cash equivalents 38.2 (4.2)
* other relates to share options add back, pensions charged to operating profit before exceptional items less contributions paid and net profit on disposal of Property, plant &
equipment
For note references please see page 14
C&C Group plc | Year ended 28 February 2014 Page 13
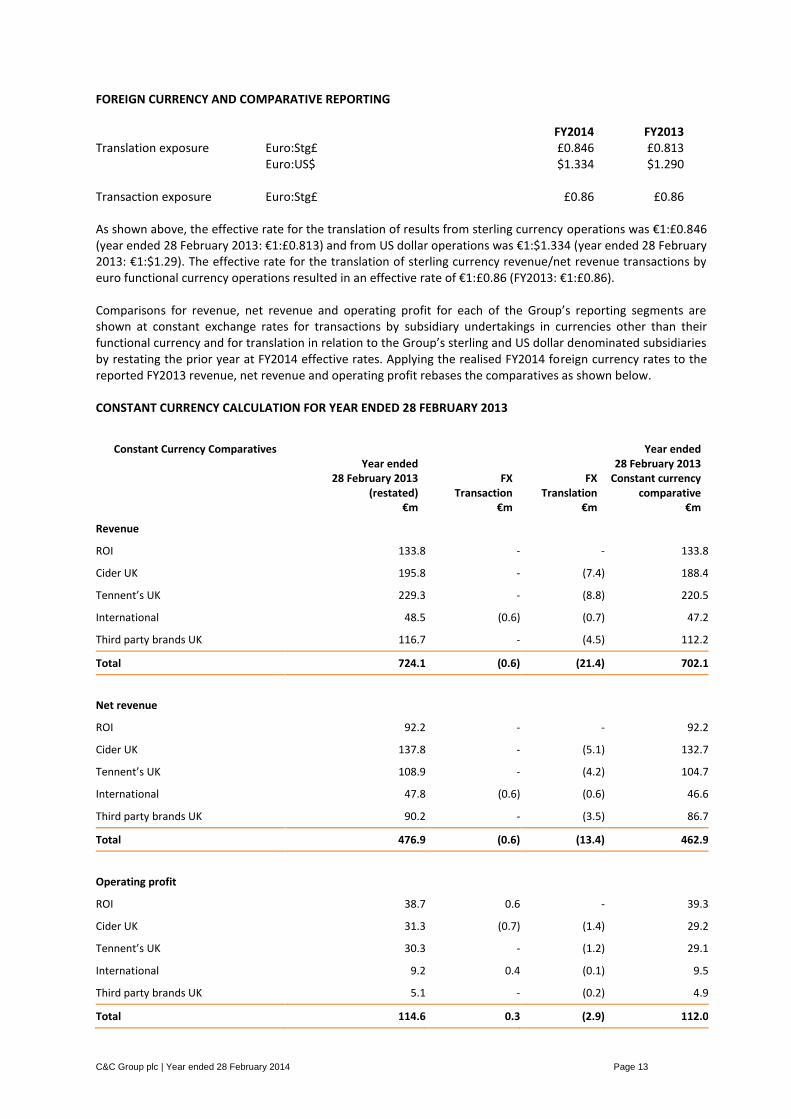
FOREIGN CURRENCY AND COMPARATIVE REPORTING FY2014 FY2013 Translation exposure Euro:Stg£ £0.846 £0.813 Euro:US$ $1.334 $1.290 Transaction exposure Euro:Stg£ £0.86 £0.86 As shown above, the effective rate for the translation of results from sterling currency operations was €1:£0.846 (year ended 28 February 2013: €1:£0.813) and from US dollar operations was €1:$1.334 (year ended 28 February 2013: €1:$1.29). The effective rate for the translation of sterling currency revenue/net revenue transactions by euro functional currency operations resulted in an effective rate of €1:£0.86 (FY2013: €1:£0.86). Comparisons for revenue, net revenue and operating profit for each of the Group’s reporting segments are shown at constant exchange rates for transactions by subsidiary undertakings in currencies other than their functional currency and for translation in relation to the Group’s sterling and US dollar denominated subsidiaries by restating the prior year at FY2014 effective rates. Applying the realised FY2014 foreign currency rates to the reported FY2013 revenue, net revenue and operating profit rebases the comparatives as shown below. CONSTANT CURRENCY CALCULATION FOR YEAR ENDED 28 FEBRUARY 2013
Constant Currency Comparatives Year ended
28 February 2013 (restated)
FX
Transaction
FX
Translation
Year ended 28 February 2013
Constant currency comparative
€m €m €m €m
Revenue
ROI 133.8 - - 133.8
Cider UK 195.8 - (7.4) 188.4
Tennent’s UK 229.3 - (8.8) 220.5
International 48.5 (0.6) (0.7) 47.2
Third party brands UK 116.7 - (4.5) 112.2
Total 724.1 (0.6) (21.4) 702.1
Net revenue
ROI 92.2 - - 92.2
Cider UK 137.8 - (5.1) 132.7
Tennent’s UK 108.9 - (4.2) 104.7
International 47.8 (0.6) (0.6) 46.6
Third party brands UK 90.2 - (3.5) 86.7
Total 476.9 (0.6) (13.4) 462.9
Operating profit
ROI 38.7 0.6 - 39.3
Cider UK 31.3 (0.7) (1.4) 29.2
Tennent’s UK 30.3 - (1.2) 29.1
International 9.2 0.4 (0.1) 9.5
Third party brands UK 5.1 - (0.2) 4.9
Total 114.6 0.3 (2.9) 112.0
C&C Group plc | Year ended 28 February 2014 Page 14
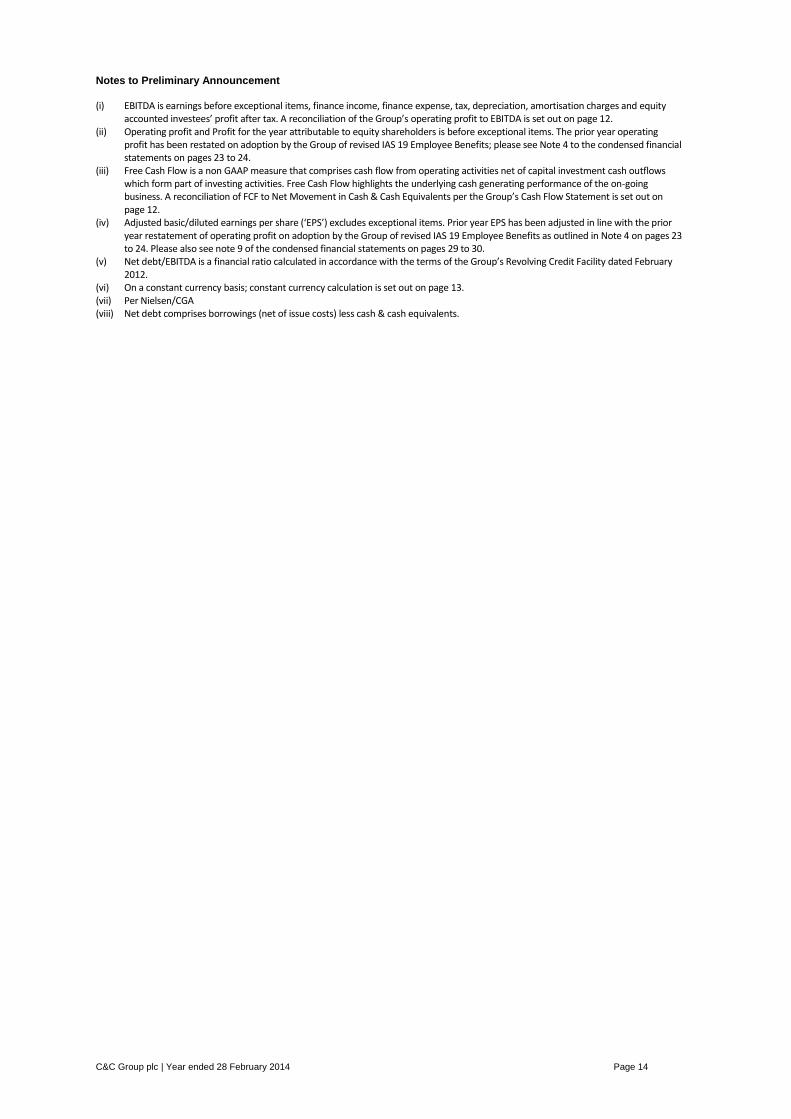
Notes to Preliminary Announcement
(i) EBITDA is earnings before exceptional items, finance income, finance expense, tax, depreciation, amortisation charges and equity accounted investees’ profit after tax. A reconciliation of the Group’s operating profit to EBITDA is set out on page 12.
(ii) Operating profit and Profit for the year attributable to equity shareholders is before exceptional items. The prior year operating profit has been restated on adoption by the Group of revised IAS 19 Employee Benefits; please see Note 4 to the condensed financial statements on pages 23 to 24.
(iii) Free Cash Flow is a non GAAP measure that comprises cash flow from operating activities net of capital investment cash outflows which form part of investing activities. Free Cash Flow highlights the underlying cash generating performance of the on-going business. A reconciliation of FCF to Net Movement in Cash & Cash Equivalents per the Group’s Cash Flow Statement is set out on page 12.
(iv) Adjusted basic/diluted earnings per share (‘EPS’) excludes exceptional items. Prior year EPS has been adjusted in line with the prior year restatement of operating profit on adoption by the Group of revised IAS 19 Employee Benefits as outlined in Note 4 on pages 23 to 24. Please also see note 9 of the condensed financial statements on pages 29 to 30.
(v) Net debt/EBITDA is a financial ratio calculated in accordance with the terms of the Group’s Revolving Credit Facility dated February 2012.
(vi) On a constant currency basis; constant currency calculation is set out on page 13. (vii) Per Nielsen/CGA (viii) Net debt comprises borrowings (net of issue costs) less cash & cash equivalents.
C&C Group plc | Year ended 28 February 2014 Page 15
PRINCIPAL RISKS AND UNCERTAINTIES Under Irish company law (Statutory Instrument 116/2005 European Communities (International Financial Reporting Standards and Miscellaneous Amendments) Regulations 2005), the Group and the Company are required to give a description of the principal risks and uncertainties which they face. The principal risks and uncertainties faced by the Group’s businesses are set out below. The Group considers that currently the most significant risks to its results and operations over the short term are (a) strategic failures, (b) levels of competition in Great Britain and the United States and (c) failure to attract and retain high-performing employees. The forthcoming vote on Scottish independence creates a period of uncertainty. Risks and uncertainties relating to strategic goals The Group’s strategy is to focus upon earnings growth through organic growth, acquisitions and joint ventures and entry into new markets. These opportunities may not materialise or deliver the benefits or synergies expected and may present new management risks and social and compliance risks. The Group seeks to mitigate these risks through due diligence, careful investment and continuing monitoring and management post-acquisition. Risks and uncertainties relating to revenue and profits The GB off-trade and increasingly the GB on-trade continues to be highly competitive, driven by consumer pressure, customer buying power and the launch of heavily-invested competing products. The Group seeks to mitigate the impact on volumes and margins through developing its multi-beverage brand portfolio and seeking cost efficiencies. The US cider market has also become highly competitive. The Group is responding through brand investment and strengthening its distributor network. Consumer preference may change, new competing brands may be launched and competitors may increase their marketing or change their pricing policies. The Group has a programme of brand investment, innovation and product diversification to maintain and enhance the relevance of its products in the market. Seasonal fluctuations in demand, especially an unseasonably bad summer in Ireland or the UK, could materially affect demand for the Group’s cider products. Geographical diversification is helping to mitigate this risk. Customers, particularly in the on-trade where the Group has exposure through advances to customers, may experience financial difficulties. The Group monitors the level of its exposure carefully. Risks and uncertainties relating to costs and production Input costs may be subject to volatility and inflation and the continuity of supply of raw materials may be affected by the weather and other factors. The Group seeks to mitigate some of these risks through long term or fixed price supply agreements. The Group does not seek to hedge its exposure to commodity prices by entering into derivative financial instruments. Circumstances such as the loss of a production or storage facility or disruptions to its supply chains or critical IT systems may interrupt the supply of the Group’s products. The Group seeks to mitigate the operational impact of such an event by the availability of multiple production facilities, fire safety standards and disaster recovery protocols, and the financial impact of such an event through business interruption and other insurances. Financial risks and uncertainties The Group’s reporting currency is the euro but it transacts in foreign currencies and consolidates the results of non-euro reporting foreign operations. Fluctuations in value between the euro and these currencies may affect the Group’s revenues, costs and operating profits. The Group seeks to mitigate currency and interest rate risks, where appropriate, through hedging and structured financial contracts to hedge a portion of its foreign currency transaction exposure and to fix a portion of its variable rate interest exposure. The Group seeks to partially manage foreign currency translation risk in relation to its US dollar subsidiaries through borrowings denominated in US dollar which are designated as a net investment hedge. It has not entered into structured financial contracts to hedge its translation exposure on its foreign acquisitions. The solvency of the Group’s defined benefit pension schemes may be affected by a fall in the value of their investments, market and interest rate volatility and other economic and demographic factors. Each of these factors may require the Group to increase its contribution levels. The Group seeks to mitigate this risk by continuous monitoring, taking professional advice on the optimisation of asset returns within agreed acceptable risk tolerances
C&C Group plc | Year ended 28 February 2014 Page 16
and implementing liability-management initiatives such as the reduction in member contractual benefits approved by the Pensions Board in February 2012. Fiscal, regulatory and political risks and uncertainties The Group may be adversely affected by changes in excise duty or taxation on cider and beer in Ireland, the UK, the US and other territories. The Group is not able to materially mitigate this risk, which is outside its control. The Group may be adversely affected by changes in government regulations affecting alcohol pricing, sponsorship or advertising, and product types. Within the context of supporting responsible drinking initiatives, the Group supports the work of its trade associations to present the industry’s case to government. In September 2014 a referendum is to be held in Scotland as to its continued membership of the UK. At the date of this report the outcome cannot be predicted. Were the vote to go in favour of independence, a further period of uncertainty would occur. Significant issues would arise including currency, tax rates, investment and membership of the EU. The economic implications for the Group cannot yet be quantified, but are likely to be mixed. A lengthy period of uncertainty would be unhelpful for forward investment. The Group is carefully monitoring the debate on relevant issues and will formulate its strategy accordingly. Liability-related risks and uncertainties The Group’s operations are subject to extensive regulation, including stringent environmental, health and safety and food safety laws and regulations and competition law. Legislative non-compliance or adverse ethical practices could lead to prosecutions and damage to the reputation of the Group and its brands. The Group has in place a permanent legal and compliance monitoring and training function and an extensive programme of corporate responsibility. The Group is vulnerable to contamination of its products or base raw materials, whether accidental, natural or malicious. Contamination could result in a recall of the Group’s products, damage to brand image and civil or criminal liability. The Group has established protocols and procedures for incident management and product recall and mitigates the financial impact by appropriate insurance cover. Fraud, corruption and theft against the Group whether by employees, business partners or third parties are risks, particularly as the Group develops internationally. The Group maintains appropriate internal controls and procedures to guard against economic crime and imposes appropriate monitoring and controls on subsidiary management. Employment-related risks and uncertainties The Group’s continued success is dependent on the skills and experience of its executive Directors and other high-performing personnel, including those in newly acquired businesses, and could be affected by their loss or the inability to recruit or retain them. The Group seeks to mitigate this risk through appropriate remuneration policies and succession planning. Whilst relations with employees are generally good, work stoppages or other industrial action could have a material adverse effect on the Group. The Group seeks to ensure good employee relations through engagement and dialogue.
C&C Group plc | Year ended 28 February 2014 Page 17
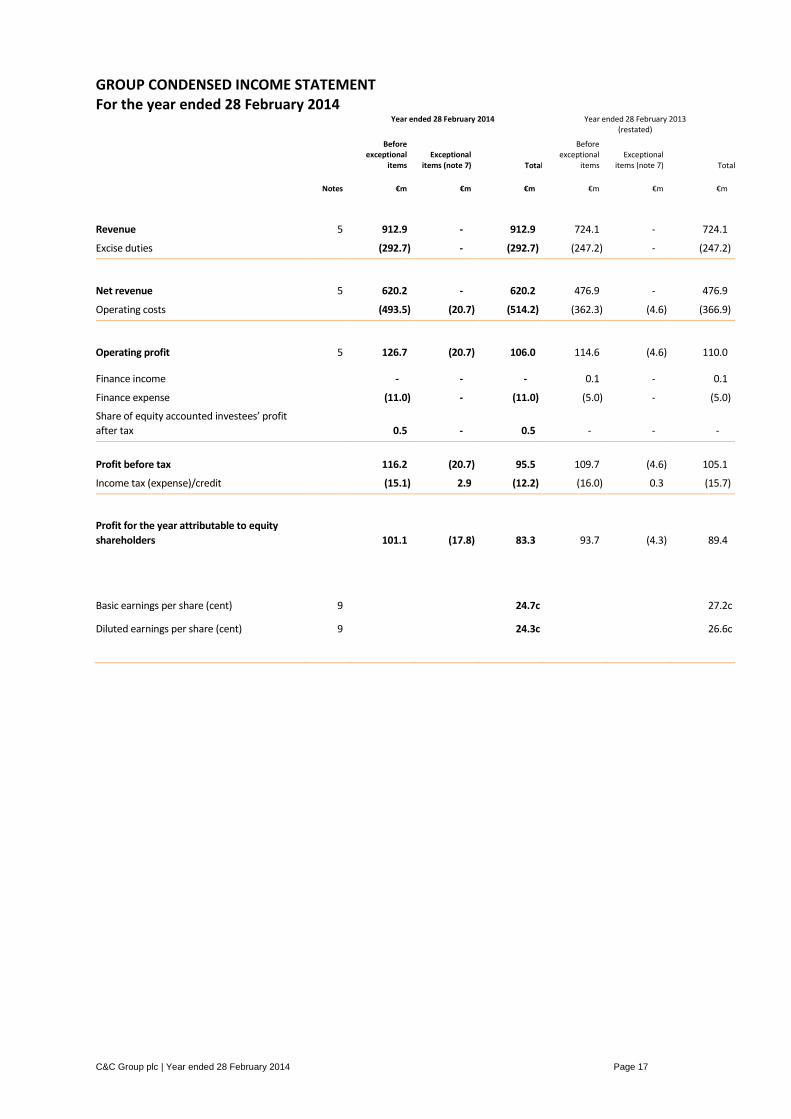
GROUP CONDENSED INCOME STATEMENT For the year ended 28 February 2014
Year ended 28 February 2014
Year ended 28 February 2013
(restated)
Before
exceptional items
Exceptional items (note 7) Total
Before exceptional
items Exceptional
items (note 7) Total
Notes €m €m €m €m €m €m
Revenue 5 912.9 - 912.9 724.1 - 724.1
Excise duties (292.7) - (292.7) (247.2) - (247.2)
Net revenue 5 620.2 - 620.2 476.9 - 476.9
Operating costs
(493.5) (20.7) (514.2) (362.3) (4.6) (366.9)
Operating profit 5 126.7 (20.7) 106.0 114.6 (4.6) 110.0
Finance income - - - 0.1 - 0.1
Finance expense (11.0) - (11.0) (5.0) - (5.0)
Share of equity accounted investees’ profit
after tax 0.5 - 0.5 - - -
Profit before tax 116.2 (20.7) 95.5 109.7 (4.6) 105.1
Income tax (expense)/credit (15.1) 2.9 (12.2) (16.0) 0.3 (15.7)
Profit for the year attributable to equity
shareholders 101.1 (17.8) 83.3 93.7 (4.3) 89.4
Basic earnings per share (cent) 9 24.7c 27.2c
Diluted earnings per share (cent) 9 24.3c 26.6c
C&C Group plc | Year ended 28 February 2014 Page 18
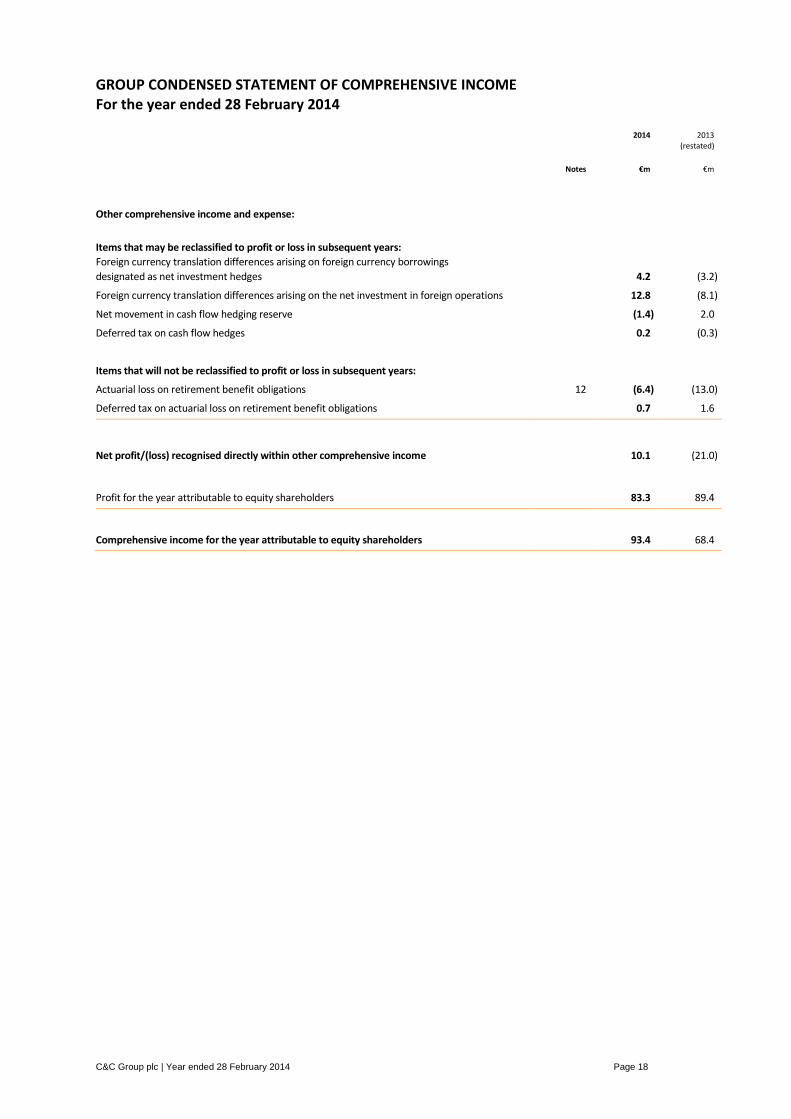
GROUP CONDENSED STATEMENT OF COMPREHENSIVE INCOME For the year ended 28 February 2014
2014
2013
(restated)
Notes €m €m
Other comprehensive income and expense:
Items that may be reclassified to profit or loss in subsequent years:
Foreign currency translation differences arising on foreign currency borrowings
designated as net investment hedges 4.2 (3.2)
Foreign currency translation differences arising on the net investment in foreign operations 12.8 (8.1)
Net movement in cash flow hedging reserve (1.4) 2.0
Deferred tax on cash flow hedges 0.2 (0.3)
Items that will not be reclassified to profit or loss in subsequent years:
Actuarial loss on retirement benefit obligations 12 (6.4) (13.0)
Deferred tax on actuarial loss on retirement benefit obligations 0.7 1.6
Net profit/(loss) recognised directly within other comprehensive income 10.1 (21.0)
Profit for the year attributable to equity shareholders 83.3 89.4
Comprehensive income for the year attributable to equity shareholders 93.4 68.4
C&C Group plc | Year ended 28 February 2014 Page 19
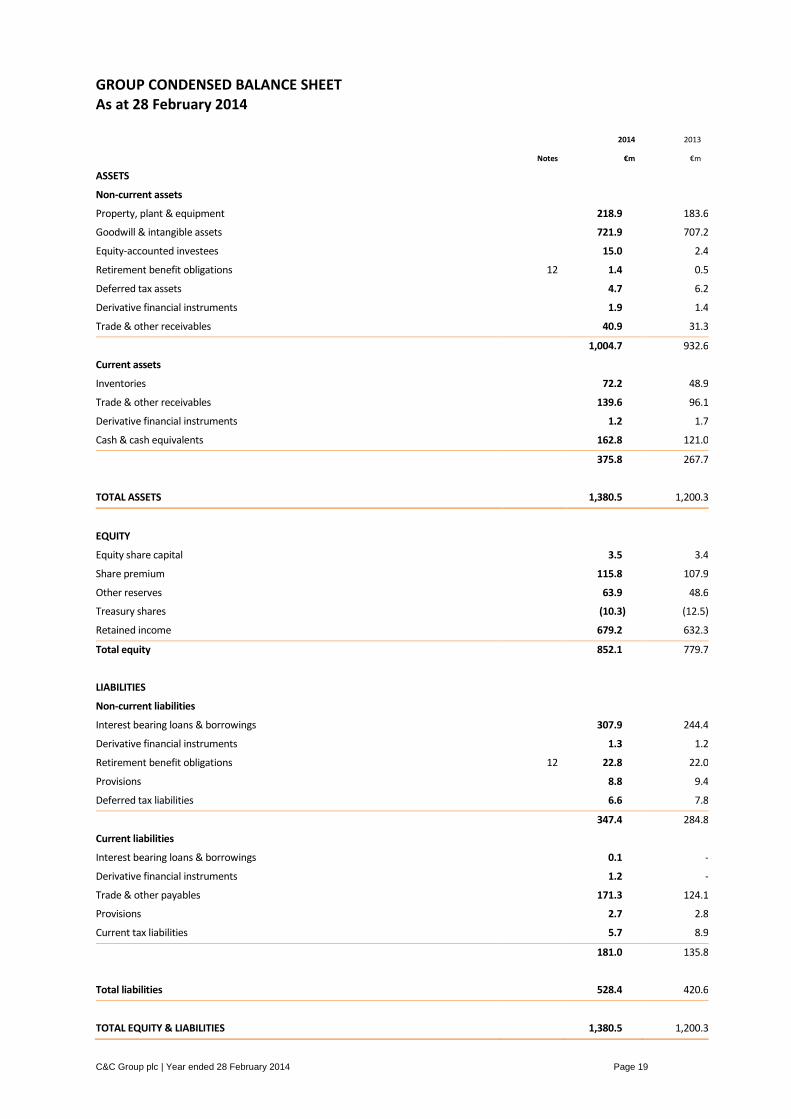
GROUP CONDENSED BALANCE SHEET As at 28 February 2014
2014 2013
Notes €m €m
ASSETS
Non-current assets
Property, plant & equipment 218.9 183.6
Goodwill & intangible assets 721.9 707.2
Equity-accounted investees 15.0 2.4
Retirement benefit obligations 12 1.4 0.5
Deferred tax assets 4.7 6.2
Derivative financial instruments 1.9 1.4
Trade & other receivables 40.9 31.3
1,004.7 932.6
Current assets
Inventories 72.2 48.9
Trade & other receivables 139.6 96.1
Derivative financial instruments 1.2 1.7
Cash & cash equivalents 162.8 121.0
375.8 267.7
TOTAL ASSETS 1,380.5 1,200.3
EQUITY
Equity share capital 3.5 3.4
Share premium 115.8 107.9
Other reserves 63.9 48.6
Treasury shares (10.3) (12.5)
Retained income 679.2 632.3
Total equity 852.1 779.7
LIABILITIES
Non-current liabilities
Interest bearing loans & borrowings 307.9 244.4
Derivative financial instruments 1.3 1.2
Retirement benefit obligations 12 22.8 22.0
Provisions 8.8 9.4
Deferred tax liabilities 6.6 7.8
347.4 284.8
Current liabilities
Interest bearing loans & borrowings 0.1 -
Derivative financial instruments 1.2 -
Trade & other payables 171.3 124.1
Provisions 2.7 2.8
Current tax liabilities 5.7 8.9
181.0 135.8
Total liabilities 528.4 420.6
TOTAL EQUITY & LIABILITIES 1,380.5 1,200.3
C&C Group plc | Year ended 28 February 2014 Page 20
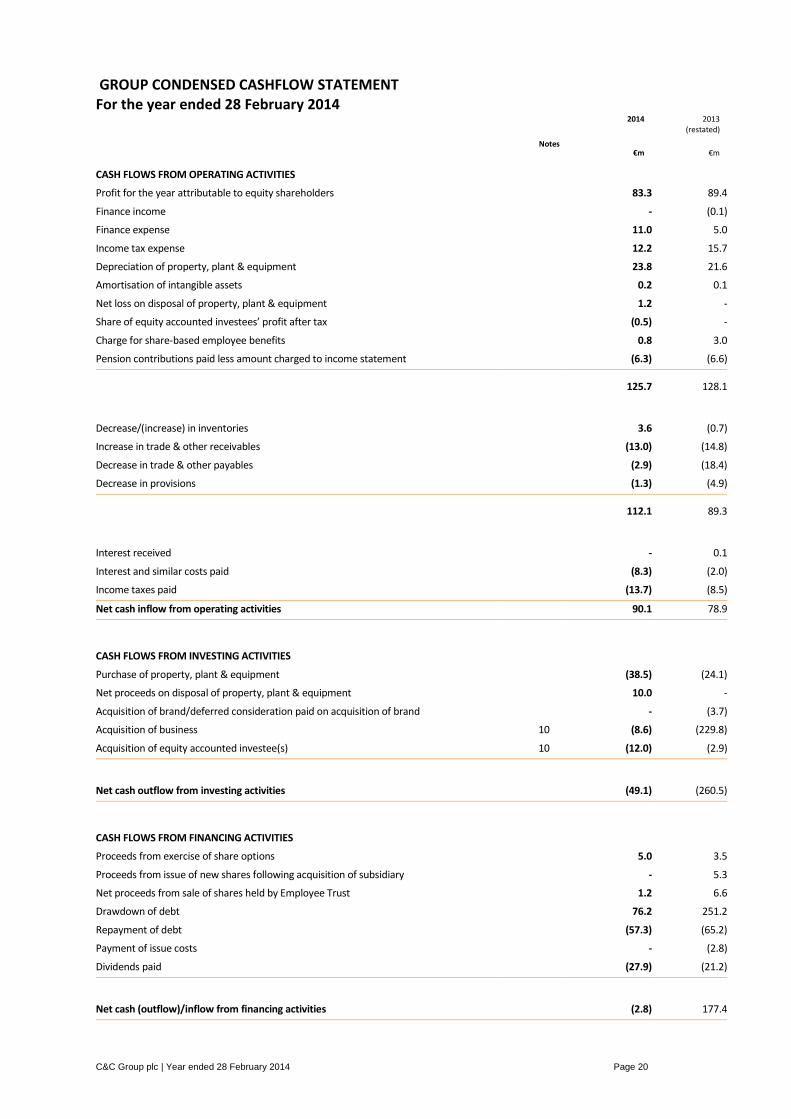
GROUP CONDENSED CASHFLOW STATEMENT For the year ended 28 February 2014
2014
2013
(restated)
Notes €m €m
CASH FLOWS FROM OPERATING ACTIVITIES Profit for the year attributable to equity shareholders 83.3 89.4
Finance income - (0.1)
Finance expense 11.0 5.0
Income tax expense 12.2 15.7
Depreciation of property, plant & equipment 23.8 21.6
Amortisation of intangible assets 0.2 0.1
Net loss on disposal of property, plant & equipment 1.2 -
Share of equity accounted investees’ profit after tax (0.5) -
Charge for share-based employee benefits 0.8 3.0
Pension contributions paid less amount charged to income statement (6.3) (6.6)
125.7 128.1
Decrease/(increase) in inventories 3.6 (0.7)
Increase in trade & other receivables (13.0) (14.8)
Decrease in trade & other payables (2.9) (18.4)
Decrease in provisions (1.3) (4.9)
112.1 89.3
Interest received - 0.1
Interest and similar costs paid (8.3) (2.0)
Income taxes paid (13.7) (8.5)
Net cash inflow from operating activities 90.1 78.9
CASH FLOWS FROM INVESTING ACTIVITIES Purchase of property, plant & equipment (38.5) (24.1)
Net proceeds on disposal of property, plant & equipment 10.0 -
Acquisition of brand/deferred consideration paid on acquisition of brand - (3.7)
Acquisition of business 10 (8.6) (229.8)
Acquisition of equity accounted investee(s) 10 (12.0) (2.9)
Net cash outflow from investing activities (49.1) (260.5)
CASH FLOWS FROM FINANCING ACTIVITIES Proceeds from exercise of share options 5.0 3.5
Proceeds from issue of new shares following acquisition of subsidiary - 5.3
Net proceeds from sale of shares held by Employee Trust 1.2 6.6
Drawdown of debt 76.2 251.2
Repayment of debt (57.3) (65.2)
Payment of issue costs - (2.8)
Dividends paid (27.9) (21.2)
Net cash (outflow)/inflow from financing activities (2.8) 177.4
C&C Group plc | Year ended 28 February 2014 Page 21
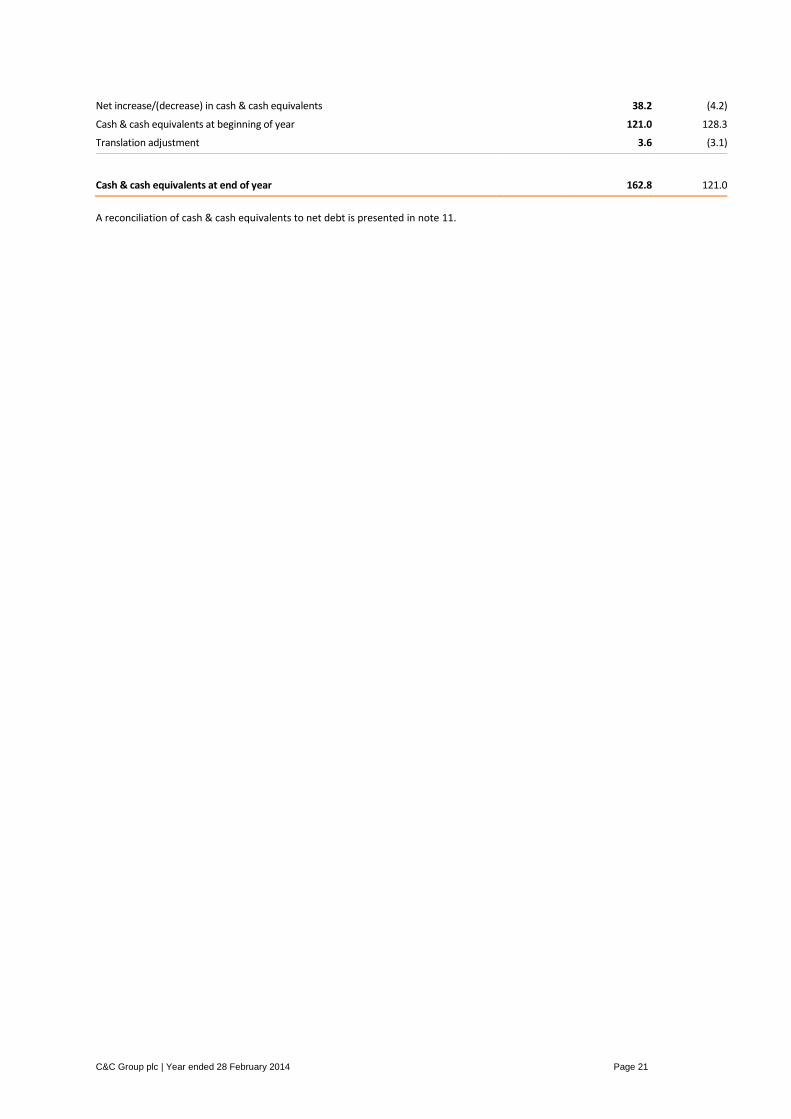
Net increase/(decrease) in cash & cash equivalents 38.2 (4.2)
Cash & cash equivalents at beginning of year 121.0 128.3
Translation adjustment 3.6 (3.1)
Cash & cash equivalents at end of year 162.8 121.0
A reconciliation of cash & cash equivalents to net debt is presented in note 11.
C&C Group plc | Year ended 28 February 2014 Page 22
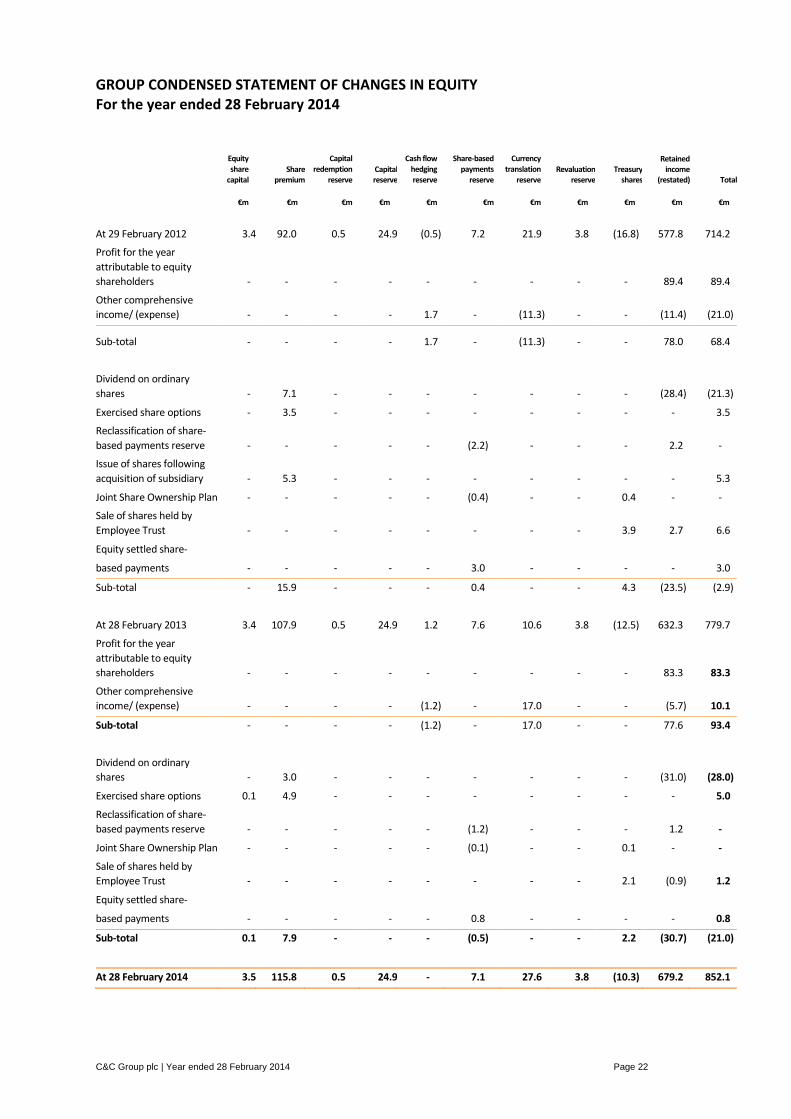
GROUP CONDENSED STATEMENT OF CHANGES IN EQUITY For the year ended 28 February 2014
Equity share
capital Share
premium
Capital redemption
reserve Capital reserve
Cash flow hedging reserve
Share-based payments
reserve
Currency translation
reserve Revaluation
reserve Treasury
shares
Retained income
(restated) Total
€m €m €m €m €m €m €m €m €m €m €m
At 29 February 2012 3.4 92.0 0.5 24.9 (0.5) 7.2 21.9 3.8 (16.8) 577.8 714.2
Profit for the year
attributable to equity
shareholders - - - - - - - - - 89.4 89.4
Other comprehensive
income/ (expense) - - - - 1.7 - (11.3) - - (11.4) (21.0)
Sub-total - - - - 1.7 - (11.3) - - 78.0 68.4
Dividend on ordinary
shares - 7.1 - - - - - - - (28.4) (21.3)
Exercised share options - 3.5 - - - - - - - - 3.5
Reclassification of share-
based payments reserve - - - - - (2.2) - - - 2.2 -
Issue of shares following
acquisition of subsidiary - 5.3 - - - - - - - - 5.3
Joint Share Ownership Plan - - - - - (0.4) - - 0.4 - -
Sale of shares held by
Employee Trust - - - - - - - - 3.9 2.7 6.6
Equity settled share-
based payments - - - - - 3.0 - - - - 3.0
Sub-total - 15.9 - - - 0.4 - - 4.3 (23.5) (2.9)
At 28 February 2013 3.4 107.9 0.5 24.9 1.2 7.6 10.6 3.8 (12.5) 632.3 779.7
Profit for the year
attributable to equity
shareholders - - - - - - - - - 83.3 83.3
Other comprehensive
income/ (expense) - - - - (1.2) - 17.0 - - (5.7) 10.1
Sub-total - - - - (1.2) - 17.0 - - 77.6 93.4
Dividend on ordinary
shares - 3.0 - - - - - - - (31.0) (28.0)
Exercised share options 0.1 4.9 - - - - - - - - 5.0
Reclassification of share-
based payments reserve - - - - - (1.2) - - - 1.2 -
Joint Share Ownership Plan - - - - - (0.1) - - 0.1 - -
Sale of shares held by
Employee Trust - - - - - - - - 2.1 (0.9) 1.2
Equity settled share-
based payments - - - - - 0.8 - - - - 0.8
Sub-total 0.1 7.9 - - - (0.5) - - 2.2 (30.7) (21.0)
At 28 February 2014 3.5 115.8 0.5 24.9 - 7.1 27.6 3.8 (10.3) 679.2 852.1
C&C Group plc | Year ended 28 February 2014 Page 23
NOTES TO THE PRELIMINARY ANNOUNCEMENT 1. BASIS OF PREPARATION
The financial information presented in this report has been prepared in accordance with the Listing Rules of the Irish Stock Exchange and the UK Listing Authority and the accounting policies that the Group has adopted under International Financial Reporting Standards (IFRS) as approved by the European Union and issued by the International Accounting Standards Board (IASB) for the financial year ended 28 February 2014.
2. STATUTORY ACCOUNTS
The financial information prepared in accordance with IFRSs as adopted by the European Union included in this report does not comprise “full group accounts” within the meaning of Regulation 40(1) of the European Communities (Companies: Group Accounts) Regulations, 1992 of Ireland insofar as such group accounts would have to comply with the disclosure and other requirements of those Regulations. Full statutory accounts for the year ended 28 February 2014 prepared in accordance with IFRS, upon which the auditors have given an unqualified report, have not yet been filed with the Registrar of Companies. Full accounts for the year ended 28 February 2013, prepared in accordance with IFRS and containing an unqualified audit report have been delivered to the Registrar of Companies. The information included has been extracted from the Group’s financial statements, which have been approved by the Board of Directors on 20 May 2014.
3. REPORTING CURRENCY
The Group's financial statements are presented in euro millions to one decimal place. The results of the Group's subsidiaries with non-euro functional currencies have been translated into euro at average exchange rates for the year with the related balance sheets consolidated using the closing rate at the balance sheet date. Foreign currency movements arising on restatement of the results and opening net assets of non-euro functional currency companies at closing rates are recognised in the Currency Translation Reserve via the Statement of Comprehensive Income, together with currency movements arising on foreign currency borrowings designated as net investment hedges and currency movements arising on retranslation of the Group's long term sterling and US dollar intra group loans which are considered quasi equity in nature and part of the Group’s net investment in its foreign operations. The exchange rates used in translating sterling and US dollar balance sheet and income statement amounts were as follows:- 2014 2013 Balance Sheet (closing rate): Euro:Stg£ £0.821 £0.867 Income Statement (average rate): Euro:Stg£ £0.846 £0.813 Balance Sheet (closing rate): Euro:US$ $1.370 $1.315 Income Statement (average rate): Euro:US$ $1.334 $1.290
4. PRIOR YEAR ADJUSTMENT
The Group has applied the revised accounting standard IAS 19 Employee Benefits in the current financial year. This affects the accounting for defined benefit pension schemes. Under the revised standard, the interest on scheme assets is accounted for using the same discount rate as is used in measuring scheme obligations as part of the income statement charge, net interest on net defined liability. The prior year comparative figures have been restated as though this revision had also been applied in the prior year. The implementation of IAS19 revised Employee Benefits had no impact on total Comprehensive income for the year attributable to equity shareholders for the year ended 28 February 2013, but it did increase the Profit for the
C&C Group plc | Year ended 28 February 2014 Page 24
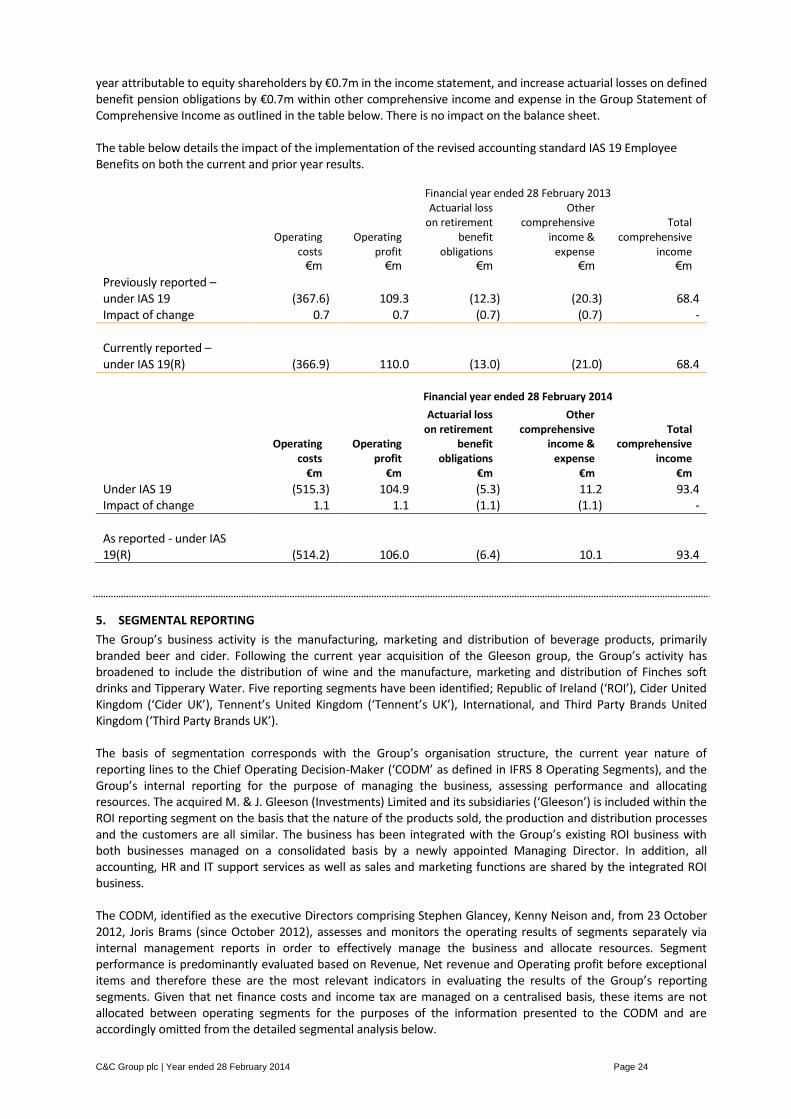
year attributable to equity shareholders by €0.7m in the income statement, and increase actuarial losses on defined benefit pension obligations by €0.7m within other comprehensive income and expense in the Group Statement of Comprehensive Income as outlined in the table below. There is no impact on the balance sheet. The table below details the impact of the implementation of the revised accounting standard IAS 19 Employee Benefits on both the current and prior year results.
Financial year ended 28 February 2013
Operating
costs Operating
profit
Actuarial loss on retirement
benefit obligations
Other comprehensive
income & expense
Total comprehensive
income
€m €m €m €m €m
Previously reported – under IAS 19 (367.6) 109.3 (12.3) (20.3) 68.4 Impact of change 0.7 0.7 (0.7) (0.7) -
Currently reported – under IAS 19(R) (366.9) 110.0 (13.0) (21.0) 68.4
Financial year ended 28 February 2014
Operating
costs Operating
profit
Actuarial loss on retirement
benefit obligations
Other comprehensive
income & expense
Total comprehensive
income €m €m €m €m €m
Under IAS 19 (515.3) 104.9 (5.3) 11.2 93.4 Impact of change 1.1 1.1 (1.1) (1.1) -
As reported - under IAS 19(R) (514.2) 106.0 (6.4) 10.1 93.4
5. SEGMENTAL REPORTING
The Group’s business activity is the manufacturing, marketing and distribution of beverage products, primarily branded beer and cider. Following the current year acquisition of the Gleeson group, the Group’s activity has broadened to include the distribution of wine and the manufacture, marketing and distribution of Finches soft drinks and Tipperary Water. Five reporting segments have been identified; Republic of Ireland (‘ROI’), Cider United Kingdom (‘Cider UK’), Tennent’s United Kingdom (‘Tennent’s UK’), International, and Third Party Brands United Kingdom (‘Third Party Brands UK’). The basis of segmentation corresponds with the Group’s organisation structure, the current year nature of reporting lines to the Chief Operating Decision-Maker (‘CODM’ as defined in IFRS 8 Operating Segments), and the Group’s internal reporting for the purpose of managing the business, assessing performance and allocating resources. The acquired M. & J. Gleeson (Investments) Limited and its subsidiaries (‘Gleeson’) is included within the ROI reporting segment on the basis that the nature of the products sold, the production and distribution processes and the customers are all similar. The business has been integrated with the Group’s existing ROI business with both businesses managed on a consolidated basis by a newly appointed Managing Director. In addition, all accounting, HR and IT support services as well as sales and marketing functions are shared by the integrated ROI business. The CODM, identified as the executive Directors comprising Stephen Glancey, Kenny Neison and, from 23 October 2012, Joris Brams (since October 2012), assesses and monitors the operating results of segments separately via internal management reports in order to effectively manage the business and allocate resources. Segment performance is predominantly evaluated based on Revenue, Net revenue and Operating profit before exceptional items and therefore these are the most relevant indicators in evaluating the results of the Group’s reporting segments. Given that net finance costs and income tax are managed on a centralised basis, these items are not allocated between operating segments for the purposes of the information presented to the CODM and are accordingly omitted from the detailed segmental analysis below.
C&C Group plc | Year ended 28 February 2014 Page 25
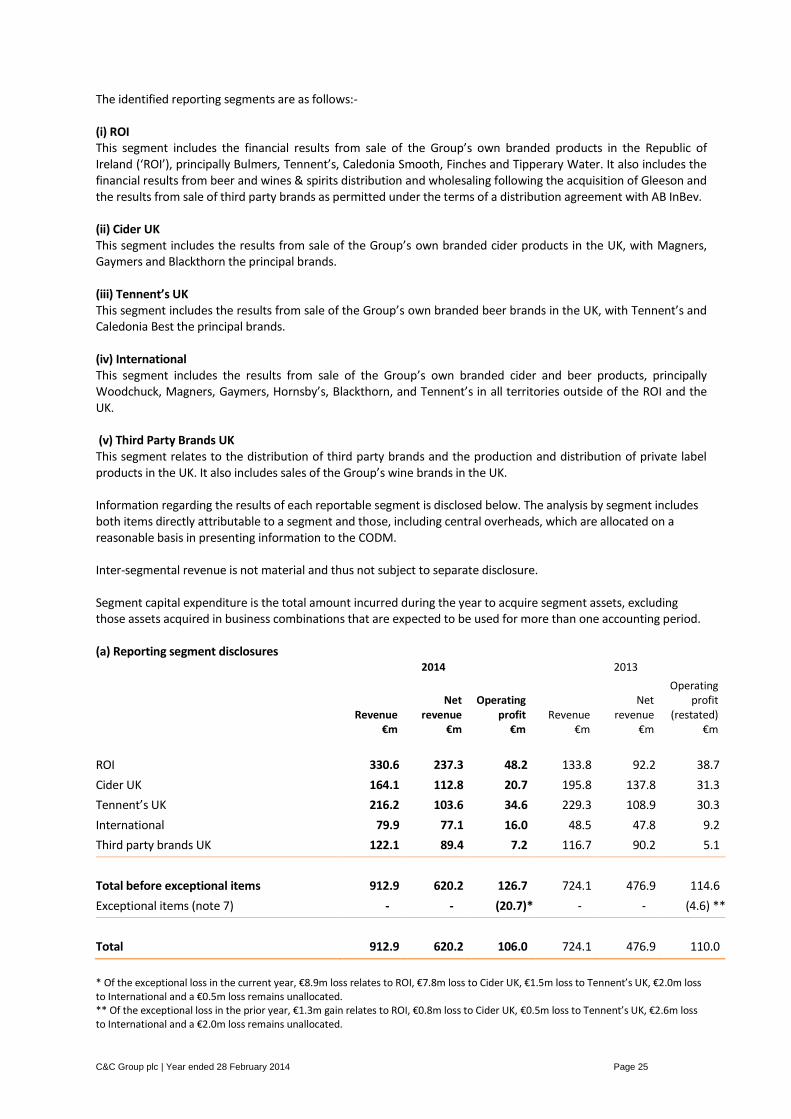
The identified reporting segments are as follows:- (i) ROI This segment includes the financial results from sale of the Group’s own branded products in the Republic of Ireland (‘ROI’), principally Bulmers, Tennent’s, Caledonia Smooth, Finches and Tipperary Water. It also includes the financial results from beer and wines & spirits distribution and wholesaling following the acquisition of Gleeson and the results from sale of third party brands as permitted under the terms of a distribution agreement with AB InBev. (ii) Cider UK This segment includes the results from sale of the Group’s own branded cider products in the UK, with Magners, Gaymers and Blackthorn the principal brands. (iii) Tennent’s UK This segment includes the results from sale of the Group’s own branded beer brands in the UK, with Tennent’s and Caledonia Best the principal brands. (iv) International This segment includes the results from sale of the Group’s own branded cider and beer products, principally Woodchuck, Magners, Gaymers, Hornsby’s, Blackthorn, and Tennent’s in all territories outside of the ROI and the UK. (v) Third Party Brands UK This segment relates to the distribution of third party brands and the production and distribution of private label products in the UK. It also includes sales of the Group’s wine brands in the UK. Information regarding the results of each reportable segment is disclosed below. The analysis by segment includes both items directly attributable to a segment and those, including central overheads, which are allocated on a reasonable basis in presenting information to the CODM. Inter-segmental revenue is not material and thus not subject to separate disclosure. Segment capital expenditure is the total amount incurred during the year to acquire segment assets, excluding those assets acquired in business combinations that are expected to be used for more than one accounting period. (a) Reporting segment disclosures 2014 2013
Revenue
€m
Net revenue
€m
Operating profit
€m Revenue
€m
Net revenue
€m
Operating profit
(restated) €m
ROI 330.6 237.3 48.2 133.8 92.2 38.7
Cider UK 164.1 112.8 20.7 195.8 137.8 31.3
Tennent’s UK 216.2 103.6 34.6 229.3 108.9 30.3
International 79.9 77.1 16.0 48.5 47.8 9.2
Third party brands UK 122.1 89.4 7.2 116.7 90.2 5.1
Total before exceptional items 912.9 620.2 126.7 724.1 476.9 114.6
Exceptional items (note 7) - - (20.7)* - - (4.6) **
Total 912.9 620.2 106.0 724.1 476.9 110.0
* Of the exceptional loss in the current year, €8.9m loss relates to ROI, €7.8m loss to Cider UK, €1.5m loss to Tennent’s UK, €2.0m loss to International and a €0.5m loss remains unallocated. ** Of the exceptional loss in the prior year, €1.3m gain relates to ROI, €0.8m loss to Cider UK, €0.5m loss to Tennent’s UK, €2.6m loss to International and a €2.0m loss remains unallocated.
C&C Group plc | Year ended 28 February 2014 Page 26
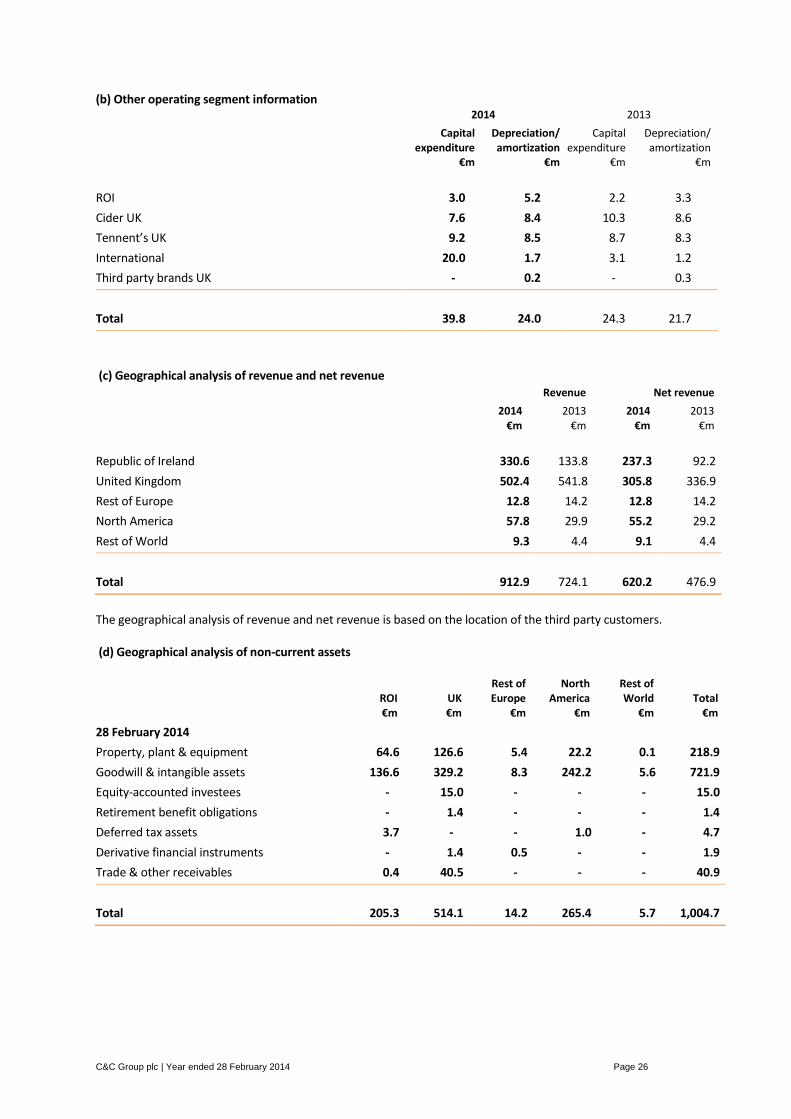
(b) Other operating segment information 2014 2013
Capital expenditure
€m
Depreciation/ amortization
€m
Capital expenditure
€m
Depreciation/ amortization
€m
ROI 3.0 5.2 2.2 3.3
Cider UK 7.6 8.4 10.3 8.6
Tennent’s UK 9.2 8.5 8.7 8.3
International 20.0 1.7 3.1 1.2
Third party brands UK - 0.2 - 0.3
Total 39.8 24.0 24.3 21.7
(c) Geographical analysis of revenue and net revenue Revenue Net revenue
2014
€m 2013
€m 2014
€m 2013
€m
Republic of Ireland 330.6 133.8 237.3 92.2
United Kingdom 502.4 541.8 305.8 336.9
Rest of Europe 12.8 14.2 12.8 14.2
North America 57.8 29.9 55.2 29.2
Rest of World 9.3 4.4 9.1 4.4
Total 912.9 724.1 620.2 476.9
The geographical analysis of revenue and net revenue is based on the location of the third party customers. (d) Geographical analysis of non-current assets
ROI €m
UK €m
Rest of Europe
€m
North America
€m
Rest of World
€m Total
€m
28 February 2014
Property, plant & equipment 64.6 126.6 5.4 22.2 0.1 218.9
Goodwill & intangible assets 136.6 329.2 8.3 242.2 5.6 721.9
Equity-accounted investees - 15.0 - - - 15.0
Retirement benefit obligations - 1.4 - - - 1.4
Deferred tax assets 3.7 - - 1.0 - 4.7
Derivative financial instruments - 1.4 0.5 - - 1.9
Trade & other receivables 0.4 40.5 - - - 40.9
Total 205.3 514.1 14.2 265.4 5.7 1,004.7
C&C Group plc | Year ended 28 February 2014 Page 27
ROI €m
UK €m
Rest of Europe
€m
North America
€m
Rest of World
€m Total
€m
28 February 2013
Property, plant & equipment 54.1 123.9 - 5.6 - 183.6
Goodwill & intangible assets 120.3 322.8 7.1 251.4 5.6 707.2
Equity-accounted investees - 2.4 - - - 2.4
Retirement benefit obligations - 0.5 - - - 0.5
Deferred tax assets 5.2 - - 1.0 - 6.2
Derivative financial instruments - 1.4 - - - 1.4
Trade & other receivables 0.5 30.8 - - - 31.3
Total 180.1 481.8 7.1 258.0 5.6 932.6
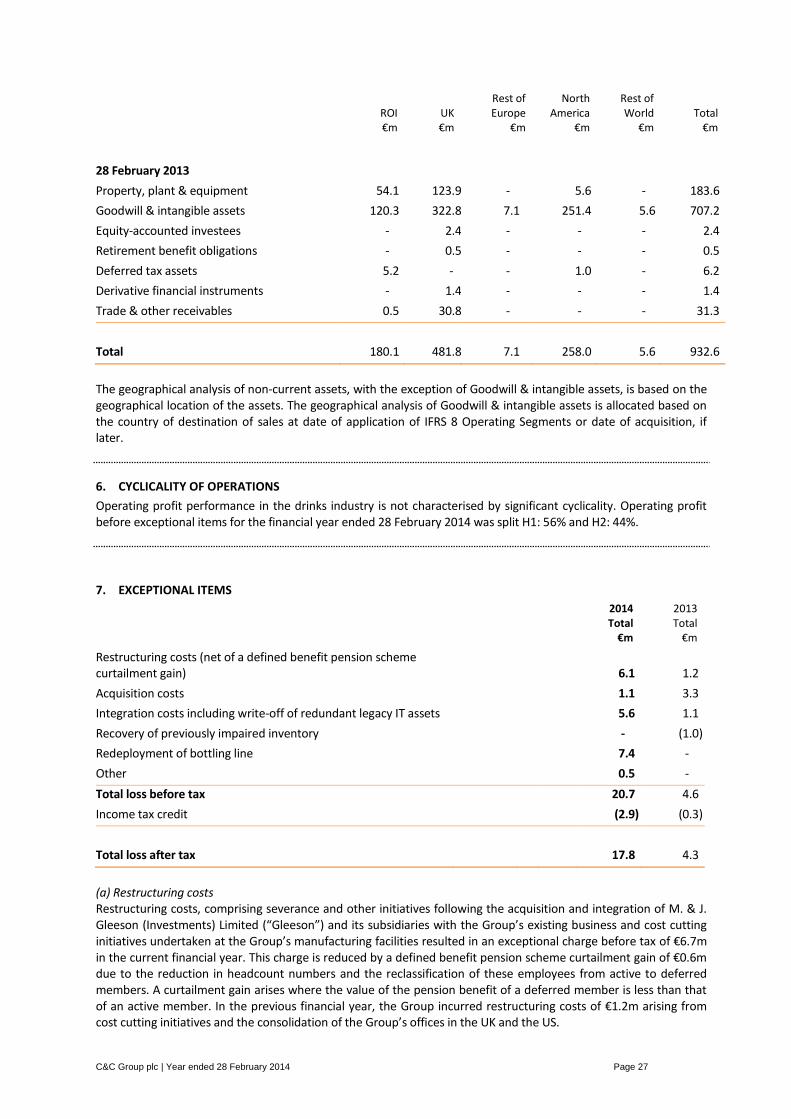
The geographical analysis of non-current assets, with the exception of Goodwill & intangible assets, is based on the geographical location of the assets. The geographical analysis of Goodwill & intangible assets is allocated based on the country of destination of sales at date of application of IFRS 8 Operating Segments or date of acquisition, if later.
6. CYCLICALITY OF OPERATIONS
Operating profit performance in the drinks industry is not characterised by significant cyclicality. Operating profit before exceptional items for the financial year ended 28 February 2014 was split H1: 56% and H2: 44%.
7. EXCEPTIONAL ITEMS
2014 Total
€m
2013 Total
€m
Restructuring costs (net of a defined benefit pension scheme curtailment gain)
6.1 1.2
Acquisition costs 1.1 3.3
Integration costs including write-off of redundant legacy IT assets 5.6 1.1
Recovery of previously impaired inventory - (1.0)
Redeployment of bottling line 7.4 -
Other 0.5 -
Total loss before tax 20.7 4.6
Income tax credit (2.9) (0.3)
Total loss after tax 17.8 4.3
(a) Restructuring costs Restructuring costs, comprising severance and other initiatives following the acquisition and integration of M. & J. Gleeson (Investments) Limited (“Gleeson”) and its subsidiaries with the Group’s existing business and cost cutting initiatives undertaken at the Group’s manufacturing facilities resulted in an exceptional charge before tax of €6.7m in the current financial year. This charge is reduced by a defined benefit pension scheme curtailment gain of €0.6m due to the reduction in headcount numbers and the reclassification of these employees from active to deferred members. A curtailment gain arises where the value of the pension benefit of a deferred member is less than that of an active member. In the previous financial year, the Group incurred restructuring costs of €1.2m arising from cost cutting initiatives and the consolidation of the Group’s offices in the UK and the US.
C&C Group plc | Year ended 28 February 2014 Page 28
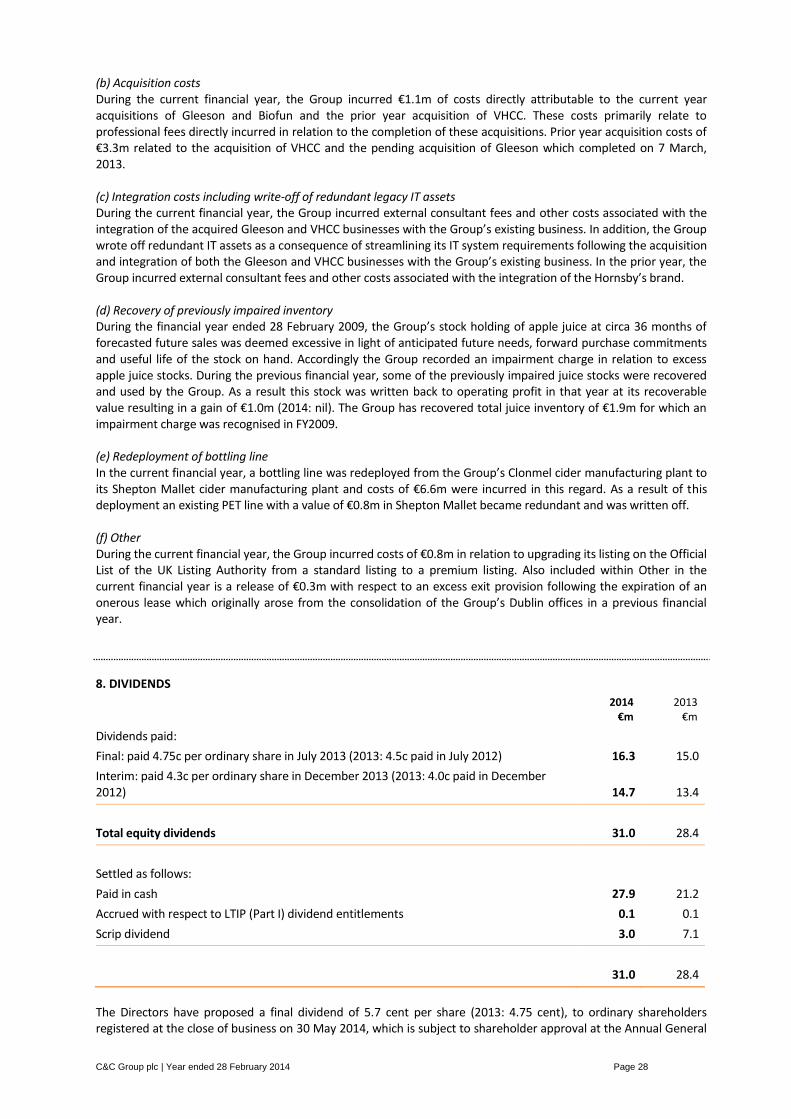
(b) Acquisition costs During the current financial year, the Group incurred €1.1m of costs directly attributable to the current year acquisitions of Gleeson and Biofun and the prior year acquisition of VHCC. These costs primarily relate to professional fees directly incurred in relation to the completion of these acquisitions. Prior year acquisition costs of €3.3m related to the acquisition of VHCC and the pending acquisition of Gleeson which completed on 7 March, 2013. (c) Integration costs including write-off of redundant legacy IT assets During the current financial year, the Group incurred external consultant fees and other costs associated with the integration of the acquired Gleeson and VHCC businesses with the Group’s existing business. In addition, the Group wrote off redundant IT assets as a consequence of streamlining its IT system requirements following the acquisition and integration of both the Gleeson and VHCC businesses with the Group’s existing business. In the prior year, the Group incurred external consultant fees and other costs associated with the integration of the Hornsby’s brand. (d) Recovery of previously impaired inventory During the financial year ended 28 February 2009, the Group’s stock holding of apple juice at circa 36 months of forecasted future sales was deemed excessive in light of anticipated future needs, forward purchase commitments and useful life of the stock on hand. Accordingly the Group recorded an impairment charge in relation to excess apple juice stocks. During the previous financial year, some of the previously impaired juice stocks were recovered and used by the Group. As a result this stock was written back to operating profit in that year at its recoverable value resulting in a gain of €1.0m (2014: nil). The Group has recovered total juice inventory of €1.9m for which an impairment charge was recognised in FY2009. (e) Redeployment of bottling line In the current financial year, a bottling line was redeployed from the Group’s Clonmel cider manufacturing plant to its Shepton Mallet cider manufacturing plant and costs of €6.6m were incurred in this regard. As a result of this deployment an existing PET line with a value of €0.8m in Shepton Mallet became redundant and was written off. (f) Other During the current financial year, the Group incurred costs of €0.8m in relation to upgrading its listing on the Official List of the UK Listing Authority from a standard listing to a premium listing. Also included within Other in the current financial year is a release of €0.3m with respect to an excess exit provision following the expiration of an onerous lease which originally arose from the consolidation of the Group’s Dublin offices in a previous financial year.
8. DIVIDENDS
2014
€m 2013
€m
Dividends paid:
Final: paid 4.75c per ordinary share in July 2013 (2013: 4.5c paid in July 2012) 16.3 15.0
Interim: paid 4.3c per ordinary share in December 2013 (2013: 4.0c paid in December 2012) 14.7 13.4
Total equity dividends 31.0 28.4
Settled as follows:
Paid in cash 27.9 21.2
Accrued with respect to LTIP (Part I) dividend entitlements 0.1 0.1
Scrip dividend 3.0 7.1
31.0 28.4
The Directors have proposed a final dividend of 5.7 cent per share (2013: 4.75 cent), to ordinary shareholders registered at the close of business on 30 May 2014, which is subject to shareholder approval at the Annual General
C&C Group plc | Year ended 28 February 2014 Page 29
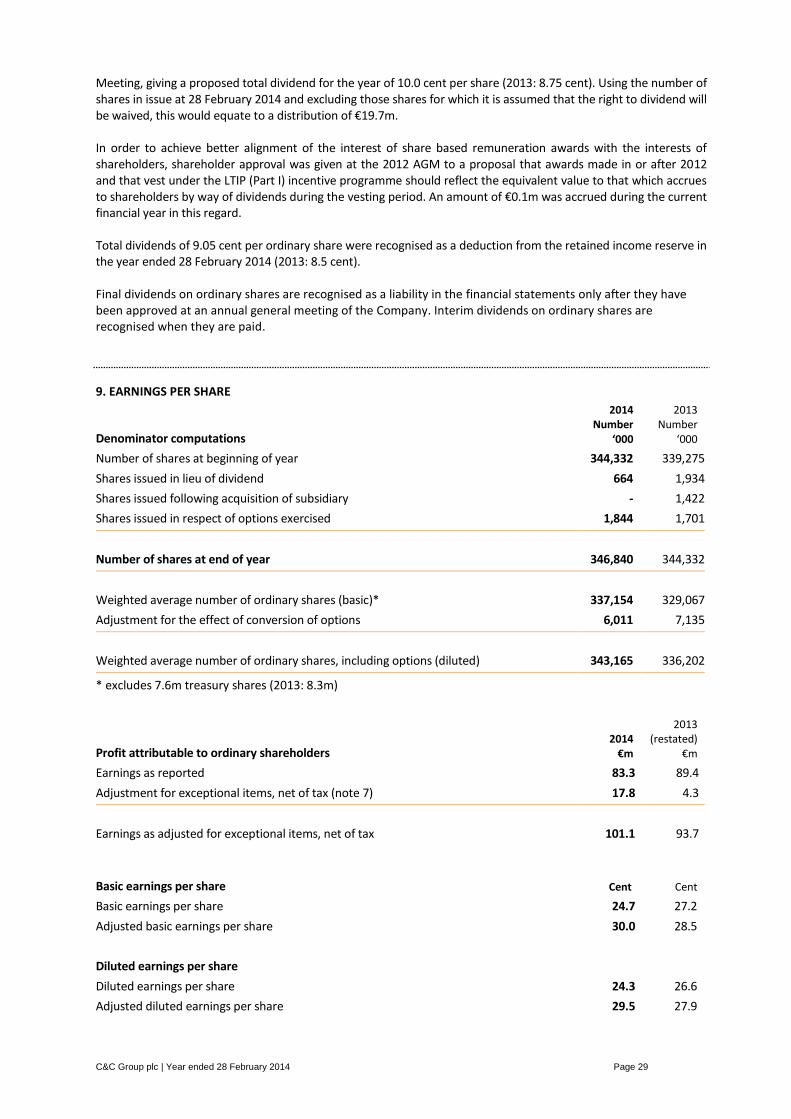
Meeting, giving a proposed total dividend for the year of 10.0 cent per share (2013: 8.75 cent). Using the number of shares in issue at 28 February 2014 and excluding those shares for which it is assumed that the right to dividend will be waived, this would equate to a distribution of €19.7m. In order to achieve better alignment of the interest of share based remuneration awards with the interests of shareholders, shareholder approval was given at the 2012 AGM to a proposal that awards made in or after 2012 and that vest under the LTIP (Part I) incentive programme should reflect the equivalent value to that which accrues to shareholders by way of dividends during the vesting period. An amount of €0.1m was accrued during the current financial year in this regard. Total dividends of 9.05 cent per ordinary share were recognised as a deduction from the retained income reserve in the year ended 28 February 2014 (2013: 8.5 cent). Final dividends on ordinary shares are recognised as a liability in the financial statements only after they have been approved at an annual general meeting of the Company. Interim dividends on ordinary shares are recognised when they are paid.
9. EARNINGS PER SHARE
Denominator computations
2014 Number
‘000
2013 Number
‘000
Number of shares at beginning of year 344,332 339,275
Shares issued in lieu of dividend 664 1,934
Shares issued following acquisition of subsidiary - 1,422
Shares issued in respect of options exercised 1,844 1,701
Number of shares at end of year 346,840 344,332
Weighted average number of ordinary shares (basic)* 337,154 329,067
Adjustment for the effect of conversion of options 6,011 7,135
Weighted average number of ordinary shares, including options (diluted) 343,165 336,202
* excludes 7.6m treasury shares (2013: 8.3m)
Profit attributable to ordinary shareholders 2014
€m
2013 (restated)
€m
Earnings as reported 83.3 89.4
Adjustment for exceptional items, net of tax (note 7) 17.8 4.3
Earnings as adjusted for exceptional items, net of tax 101.1 93.7
Basic earnings per share Cent Cent
Basic earnings per share 24.7 27.2
Adjusted basic earnings per share 30.0 28.5
Diluted earnings per share
Diluted earnings per share 24.3 26.6
Adjusted diluted earnings per share 29.5 27.9
C&C Group plc | Year ended 28 February 2014 Page 30
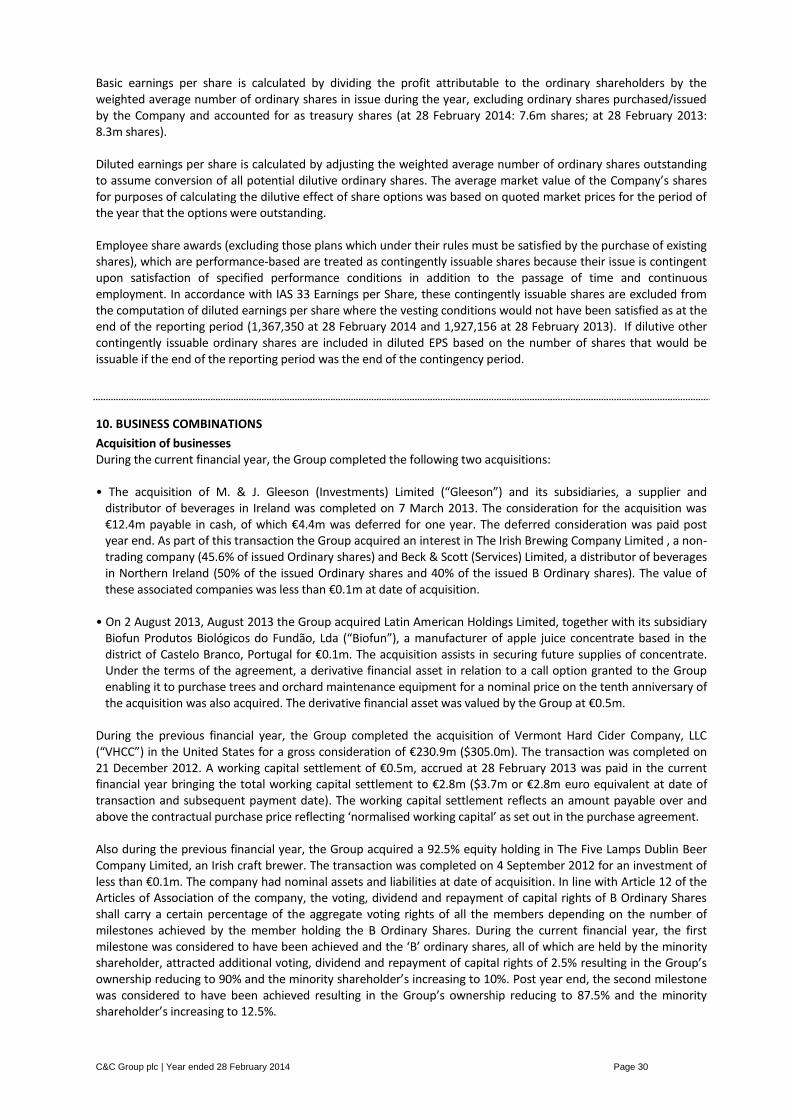
Basic earnings per share is calculated by dividing the profit attributable to the ordinary shareholders by the weighted average number of ordinary shares in issue during the year, excluding ordinary shares purchased/issued by the Company and accounted for as treasury shares (at 28 February 2014: 7.6m shares; at 28 February 2013: 8.3m shares). Diluted earnings per share is calculated by adjusting the weighted average number of ordinary shares outstanding to assume conversion of all potential dilutive ordinary shares. The average market value of the Company’s shares for purposes of calculating the dilutive effect of share options was based on quoted market prices for the period of the year that the options were outstanding. Employee share awards (excluding those plans which under their rules must be satisfied by the purchase of existing shares), which are performance-based are treated as contingently issuable shares because their issue is contingent upon satisfaction of specified performance conditions in addition to the passage of time and continuous employment. In accordance with IAS 33 Earnings per Share, these contingently issuable shares are excluded from the computation of diluted earnings per share where the vesting conditions would not have been satisfied as at the end of the reporting period (1,367,350 at 28 February 2014 and 1,927,156 at 28 February 2013). If dilutive other contingently issuable ordinary shares are included in diluted EPS based on the number of shares that would be issuable if the end of the reporting period was the end of the contingency period.
10. BUSINESS COMBINATIONS
Acquisition of businesses During the current financial year, the Group completed the following two acquisitions: • The acquisition of M. & J. Gleeson (Investments) Limited (“Gleeson”) and its subsidiaries, a supplier and
distributor of beverages in Ireland was completed on 7 March 2013. The consideration for the acquisition was €12.4m payable in cash, of which €4.4m was deferred for one year. The deferred consideration was paid post year end. As part of this transaction the Group acquired an interest in The Irish Brewing Company Limited , a non-trading company (45.6% of issued Ordinary shares) and Beck & Scott (Services) Limited, a distributor of beverages in Northern Ireland (50% of the issued Ordinary shares and 40% of the issued B Ordinary shares). The value of these associated companies was less than €0.1m at date of acquisition.
• On 2 August 2013, August 2013 the Group acquired Latin American Holdings Limited, together with its subsidiary
Biofun Produtos Biológicos do Fundão, Lda (“Biofun”), a manufacturer of apple juice concentrate based in the district of Castelo Branco, Portugal for €0.1m. The acquisition assists in securing future supplies of concentrate. Under the terms of the agreement, a derivative financial asset in relation to a call option granted to the Group enabling it to purchase trees and orchard maintenance equipment for a nominal price on the tenth anniversary of the acquisition was also acquired. The derivative financial asset was valued by the Group at €0.5m.
During the previous financial year, the Group completed the acquisition of Vermont Hard Cider Company, LLC (“VHCC”) in the United States for a gross consideration of €230.9m ($305.0m). The transaction was completed on 21 December 2012. A working capital settlement of €0.5m, accrued at 28 February 2013 was paid in the current financial year bringing the total working capital settlement to €2.8m ($3.7m or €2.8m euro equivalent at date of transaction and subsequent payment date). The working capital settlement reflects an amount payable over and above the contractual purchase price reflecting ‘normalised working capital’ as set out in the purchase agreement. Also during the previous financial year, the Group acquired a 92.5% equity holding in The Five Lamps Dublin Beer Company Limited, an Irish craft brewer. The transaction was completed on 4 September 2012 for an investment of less than €0.1m. The company had nominal assets and liabilities at date of acquisition. In line with Article 12 of the Articles of Association of the company, the voting, dividend and repayment of capital rights of B Ordinary Shares shall carry a certain percentage of the aggregate voting rights of all the members depending on the number of milestones achieved by the member holding the B Ordinary Shares. During the current financial year, the first milestone was considered to have been achieved and the ‘B’ ordinary shares, all of which are held by the minority shareholder, attracted additional voting, dividend and repayment of capital rights of 2.5% resulting in the Group’s ownership reducing to 90% and the minority shareholder’s increasing to 10%. Post year end, the second milestone was considered to have been achieved resulting in the Group’s ownership reducing to 87.5% and the minority shareholder’s increasing to 12.5%.
C&C Group plc | Year ended 28 February 2014 Page 31
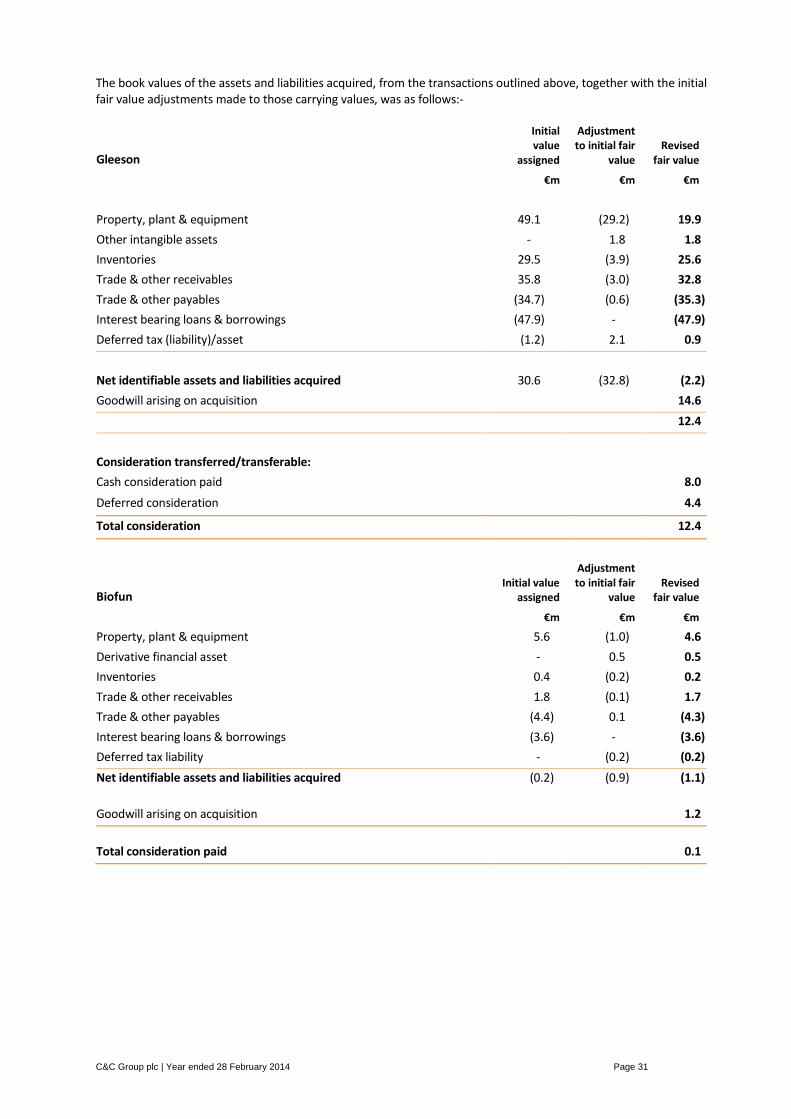
The book values of the assets and liabilities acquired, from the transactions outlined above, together with the initial fair value adjustments made to those carrying values, was as follows:-
Gleeson
Initial value
assigned
Adjustment to initial fair
value Revised
fair value
€m €m €m
Property, plant & equipment 49.1 (29.2) 19.9
Other intangible assets - 1.8 1.8
Inventories 29.5 (3.9) 25.6
Trade & other receivables 35.8 (3.0) 32.8
Trade & other payables (34.7) (0.6) (35.3)
Interest bearing loans & borrowings (47.9) - (47.9)
Deferred tax (liability)/asset (1.2) 2.1 0.9
Net identifiable assets and liabilities acquired 30.6 (32.8) (2.2)
Goodwill arising on acquisition 14.6
12.4
Consideration transferred/transferable:
Cash consideration paid 8.0
Deferred consideration 4.4
Total consideration 12.4
Biofun
Initial value assigned
Adjustment to initial fair
value Revised
fair value
€m €m €m
Property, plant & equipment 5.6 (1.0) 4.6
Derivative financial asset - 0.5 0.5
Inventories 0.4 (0.2) 0.2
Trade & other receivables 1.8 (0.1) 1.7
Trade & other payables (4.4) 0.1 (4.3)
Interest bearing loans & borrowings (3.6) - (3.6)
Deferred tax liability - (0.2) (0.2)
Net identifiable assets and liabilities acquired (0.2) (0.9) (1.1)
Goodwill arising on acquisition 1.2
Total consideration paid 0.1
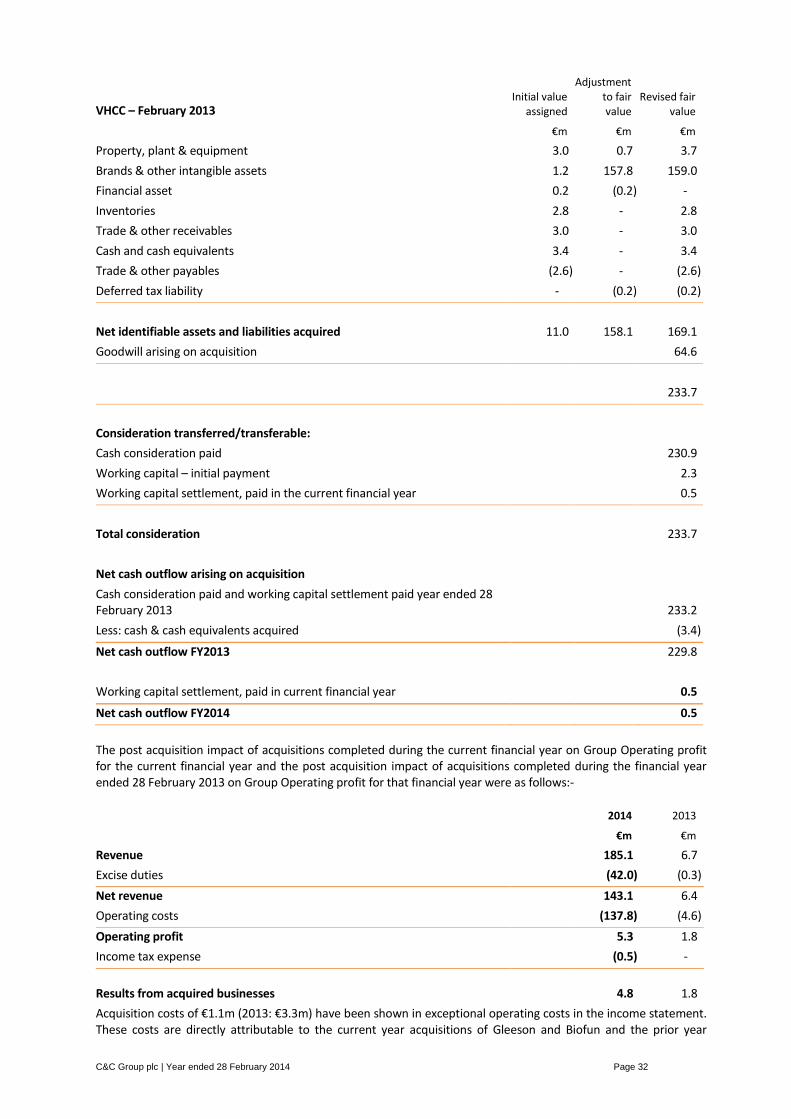
C&C Group plc | Year ended 28 February 2014 Page 32
VHCC – February 2013 Initial value
assigned
Adjustment to fair value
Revised fair value
€m €m €m
Property, plant & equipment 3.0 0.7 3.7
Brands & other intangible assets 1.2 157.8 159.0
Financial asset 0.2 (0.2) -
Inventories 2.8 - 2.8
Trade & other receivables 3.0 - 3.0
Cash and cash equivalents 3.4 - 3.4
Trade & other payables (2.6) - (2.6)
Deferred tax liability - (0.2) (0.2)
Net identifiable assets and liabilities acquired 11.0 158.1 169.1
Goodwill arising on acquisition 64.6
233.7
Consideration transferred/transferable:
Cash consideration paid 230.9
Working capital – initial payment 2.3
Working capital settlement, paid in the current financial year 0.5
Total consideration 233.7
Net cash outflow arising on acquisition
Cash consideration paid and working capital settlement paid year ended 28 February 2013 233.2
Less: cash & cash equivalents acquired (3.4)
Net cash outflow FY2013 229.8
Working capital settlement, paid in current financial year 0.5
Net cash outflow FY2014 0.5
The post acquisition impact of acquisitions completed during the current financial year on Group Operating profit for the current financial year and the post acquisition impact of acquisitions completed during the financial year ended 28 February 2013 on Group Operating profit for that financial year were as follows:- 2014 2013
€m €m
Revenue 185.1 6.7
Excise duties (42.0) (0.3)
Net revenue 143.1 6.4
Operating costs (137.8) (4.6)
Operating profit 5.3 1.8
Income tax expense (0.5) -
Results from acquired businesses 4.8 1.8
Acquisition costs of €1.1m (2013: €3.3m) have been shown in exceptional operating costs in the income statement. These costs are directly attributable to the current year acquisitions of Gleeson and Biofun and the prior year
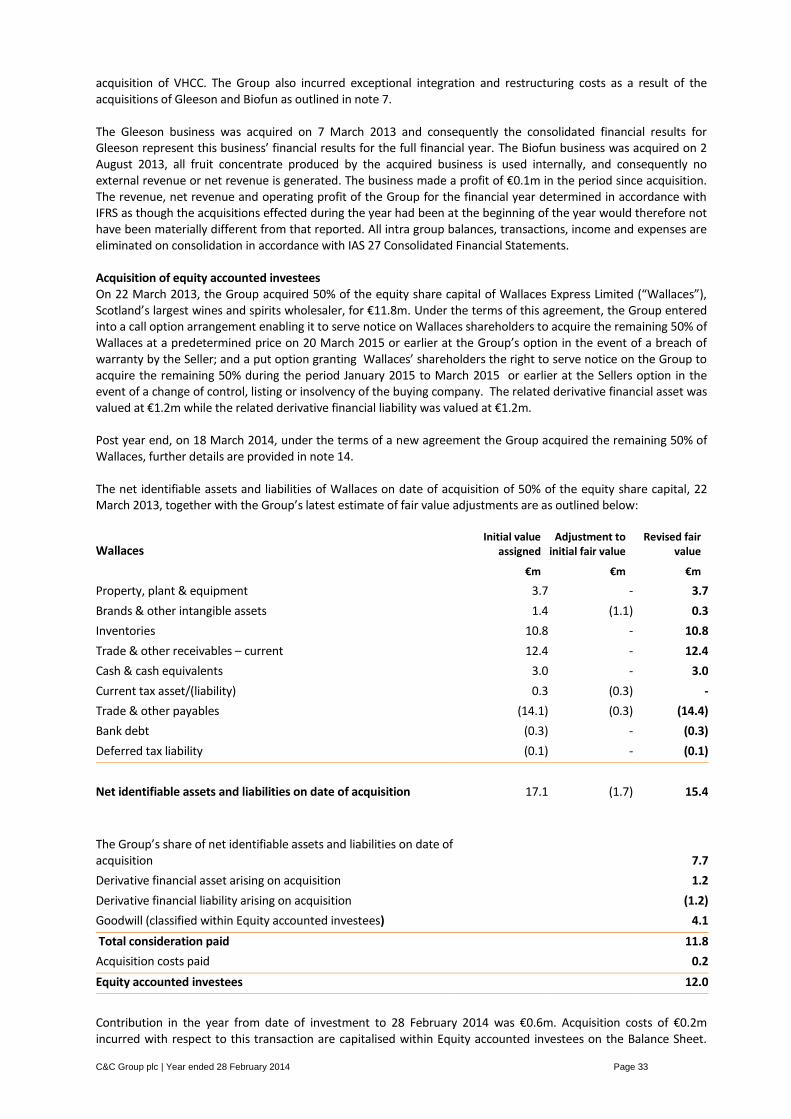
C&C Group plc | Year ended 28 February 2014 Page 33
acquisition of VHCC. The Group also incurred exceptional integration and restructuring costs as a result of the acquisitions of Gleeson and Biofun as outlined in note 7. The Gleeson business was acquired on 7 March 2013 and consequently the consolidated financial results for Gleeson represent this business’ financial results for the full financial year. The Biofun business was acquired on 2 August 2013, all fruit concentrate produced by the acquired business is used internally, and consequently no external revenue or net revenue is generated. The business made a profit of €0.1m in the period since acquisition. The revenue, net revenue and operating profit of the Group for the financial year determined in accordance with IFRS as though the acquisitions effected during the year had been at the beginning of the year would therefore not have been materially different from that reported. All intra group balances, transactions, income and expenses are eliminated on consolidation in accordance with IAS 27 Consolidated Financial Statements. Acquisition of equity accounted investees On 22 March 2013, the Group acquired 50% of the equity share capital of Wallaces Express Limited (“Wallaces”), Scotland’s largest wines and spirits wholesaler, for €11.8m. Under the terms of this agreement, the Group entered into a call option arrangement enabling it to serve notice on Wallaces shareholders to acquire the remaining 50% of Wallaces at a predetermined price on 20 March 2015 or earlier at the Group’s option in the event of a breach of warranty by the Seller; and a put option granting Wallaces’ shareholders the right to serve notice on the Group to acquire the remaining 50% during the period January 2015 to March 2015 or earlier at the Sellers option in the event of a change of control, listing or insolvency of the buying company. The related derivative financial asset was valued at €1.2m while the related derivative financial liability was valued at €1.2m. Post year end, on 18 March 2014, under the terms of a new agreement the Group acquired the remaining 50% of Wallaces, further details are provided in note 14. The net identifiable assets and liabilities of Wallaces on date of acquisition of 50% of the equity share capital, 22 March 2013, together with the Group’s latest estimate of fair value adjustments are as outlined below:
Wallaces Initial value
assigned Adjustment to
initial fair value Revised fair
value
€m €m €m
Property, plant & equipment 3.7 - 3.7
Brands & other intangible assets 1.4 (1.1) 0.3
Inventories 10.8 - 10.8
Trade & other receivables – current 12.4 - 12.4
Cash & cash equivalents 3.0 - 3.0
Current tax asset/(liability) 0.3 (0.3) -
Trade & other payables (14.1) (0.3) (14.4)
Bank debt (0.3) - (0.3)
Deferred tax liability (0.1) - (0.1)
Net identifiable assets and liabilities on date of acquisition 17.1 (1.7) 15.4
The Group’s share of net identifiable assets and liabilities on date of acquisition 7.7
Derivative financial asset arising on acquisition 1.2
Derivative financial liability arising on acquisition (1.2)
Goodwill (classified within Equity accounted investees) 4.1
Total consideration paid 11.8
Acquisition costs paid 0.2
Equity accounted investees 12.0
Contribution in the year from date of investment to 28 February 2014 was €0.6m. Acquisition costs of €0.2m incurred with respect to this transaction are capitalised within Equity accounted investees on the Balance Sheet.

C&C Group plc | Year ended 28 February 2014 Page 34
The total carrying value of the investment at 28 February 2014 was €12.6m. During the previous financial year, the Group also acquired a 25% equity investment in Maclay Group plc, a leading independent Scottish operator of managed public houses for €2.5m. The business primarily includes the operation of 15 wholly owned managed houses and 11 managed houses owned by two separate Enterprise Investment Schemes. The total carrying value of the investment, excluding related derivative financial instruments, at 28 February 2014 was €2.0m (2013: €1.9m). In addition, during the financial year ended 28 February 2013, the Group invested €0.4m in a joint venture with Maclay Group plc in Thistle Pub Company Limited. The total carrying value of this investment, excluding related derivative financial instruments, at 28 February 2014 was €0.4m (2013: €0.5m).
11. ANALYSIS OF NET DEBT
1 March
2013 Translation adjustment
Debt arising on
acquisition Cash flow Non-cash
changes
28 February
2014
€m €m €m €m €m €m
Group
Interest bearing loans & borrowings 244.4 (7.3) 51.5 18.9 0.5 308.0
Cash & cash equivalents (121.0) (3.6) - (38.2) - (162.8)
123.4 (10.9) 51.5 (19.3) 0.5 145.2
1 March 2012
Translation adjustment
Debt arising on
acquisition Cash flow Non-cash
changes
28 February
2013
€m €m €m €m €m €m
Group
Interest bearing loans & borrowings 60.0 0.6 - 183.2 0.6 244.4
Cash & cash equivalents (128.3) 3.1 - 4.2 - (121.0)
(68.3)
3.7
- 187.4 0.6 123.4
Interest bearing loans & borrowings at 28 February 2014 are net of unamortised issue costs. The value of unamortised issue costs at 28 February 2014 was €1.7m (2013: €2.2m). The non-cash change to the Group’s interest bearing loans & borrowings relates to the amortisation of issue costs in the year. Debt on acquisition In the current financial year, the Group acquired debt of €47.9m on acquisition of Gleeson (€22.6m relating to a term loan and €25.3m relating to a full recourse trade debtor factoring arrangement); the term loan was repaid immediately post closing of the transaction. The trade debtor factoring arrangement was repaid in full and cancelled on 30 June 2013; the outstanding balance on acquisition with respect to this arrangement was €25.3m and this increased to €31.2m, before being settled in full by the Group. In addition, the Group acquired debt of €3.6m on the acquisition of Biofun, of which €3.5m was repaid during the financial year with the remaining outstanding debt of €0.1m classified within current liabilities. The outstanding debt as at 28 February 2014 was fully repaid and cancelled on 21 March 2014. Borrowing facilities The Group manages its borrowing ability by entering into committed loan facility agreements. In February 2012, the Group entered into a committed €250.0m multi-currency five year syndicated revolving loan facility with seven banks, namely Bank of Ireland, Bank of Scotland, Barclays Bank, Danske Bank, HSBC, Rabobank, and Ulster Bank, repayable in a single instalment on 28 February 2017. The facility agreement provided for a further
C&C Group plc | Year ended 28 February 2014 Page 35
€100.0m in the form of an uncommitted accordion facility which the Group successfully negotiated with the banks as committed in December 2012. The facility agreement permits the Group to avail of further financial indebtedness, excluding working capital and guarantee facilities, to a maximum value of €150.0m, subject to agreeing the terms and conditions with the lenders. Consequently the Group is permitted under the terms of the agreement, to have debt capacity of €500.0m of which €309.6m was drawn at 28 February 2014 (2013: €246.6m was drawn). Under the terms of the agreement, the Group must pay a commitment fee based on 40% of the applicable margin on undrawn committed amounts and variable interest on drawn amounts based on variable Euribor/Libor interest rates plus a margin, the level of which is dependent on the net debt:EBITDA ratio, plus a utilisation fee, the level of which is dependent on percentage utilisation. The Group may select an interest period of one, two, three or six months. There were no repayments under the Group’s committed loan facility agreement in the current year. During the previous financial year, the Group, using surplus cash resources, repaid and cancelled all funds (€60.0m) drawn under its maturing 2007 euro facility, it also repaid €5.2m ($7.0m) in January 2013 under its 2012 multi-currency facility. All non-current bank loans are guaranteed by a number of the Group’s subsidiary undertakings. The facility agreement allows the early repayment of debt without incurring additional charges or penalties. All non current bank loans are repayable in full on change of control of the Group. The Group’s multi-currency debt facility incorporates two financial covenants: • Interest cover: The ratio of EBITDA to net interest for a period of 12 months ending on each half year date will not
be less than 3.5:1 • Net debt/EBITDA: The ratio of net debt on each half year date to EBITDA for a period of 12 months ending on a
half year date will not exceed 3.5:1 At year-end the Group had net debt of €145.2m, with a Net debt/ EBITDA ratio of 0.99:1 calculated in accordance with the terms of the Group’s revolving credit facility agreement.
12. RETIREMENT BENEFIT OBLIGATIONS
The Group operates a number of defined benefit pension schemes for certain employees, past and present, in the Republic of Ireland (ROI) and in the United Kingdom (UK), all of which provide pension benefits based on final salary and the assets of which are held in separate trustee administered funds. The Group closed its defined benefit pension schemes to new members in April 2007 and only provides defined contribution pension schemes for employees joining the Group since that date. The Group provides permanent health insurance cover for the benefit of certain employees and separately charges this to the income statement. The defined benefit pension scheme assets are held in separate trustee administered funds to meet long-term pension liabilities to past and present employees. The trustees of the funds are required to act in the best interest of the funds’ beneficiaries. The appointment of trustees to the funds is determined by the schemes’ trust documentation. The Group has a policy in relation to its principal staff pension fund that members of the fund should nominate half of all fund trustees. There are no active members remaining in the Executive defined benefit pension scheme (2013: no active members). There are 80 active members (representing < 10% of total membership) in the ROI Staff defined benefit pension scheme (2013: 106 active members) and 5 active members in the UK scheme (2013: 8 active members). The Group’s ROI defined benefit pension reform programme concluded during the financial year ended 29 February 2012 with the Pensions Board issuing a directive under Section 50 of the Pensions Act 1990 to remove the mandatory pension increase rule, which guaranteed 3% per annum increase to certain pensions in payment, and to replace it with guaranteed pension increases of 2% per annum for each year 2012 to 2014 and thereafter for all future pension increases to be awarded on a discretionary basis.
Actuarial valuations – funding requirements Independent actuarial valuations of the defined benefit pension schemes are carried out on a triennial basis using the attained age method. The most recent actuarial valuations of the ROI schemes were carried out with an effective date of 1 January 2012 while the most recent actuarial valuation of the UK scheme was 31
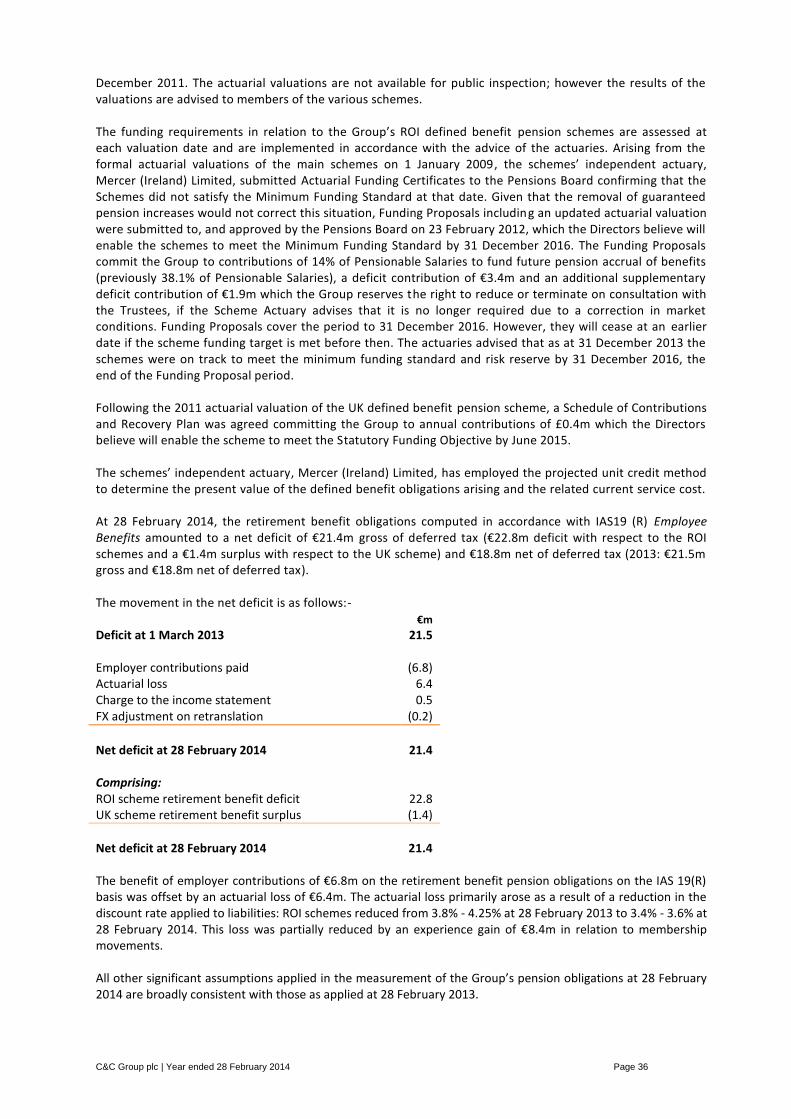
C&C Group plc | Year ended 28 February 2014 Page 36
December 2011. The actuarial valuations are not available for public inspection; however the results of the valuations are advised to members of the various schemes. The funding requirements in relation to the Group’s ROI defined benefit pension schemes are assessed at each valuation date and are implemented in accordance with the advice of the actuaries. Arising from the formal actuarial valuations of the main schemes on 1 January 2009, the schemes’ independent actuary, Mercer (Ireland) Limited, submitted Actuarial Funding Certificates to the Pensions Board confirming that the Schemes did not satisfy the Minimum Funding Standard at that date. Given that the removal of guaranteed pension increases would not correct this situation, Funding Proposals including an updated actuarial valuation were submitted to, and approved by the Pensions Board on 23 February 2012, which the Directors believe will enable the schemes to meet the Minimum Funding Standard by 31 December 2016. The Funding Proposals commit the Group to contributions of 14% of Pensionable Salaries to fund future pension accrual of benefits (previously 38.1% of Pensionable Salaries), a deficit contribution of €3.4m and an additional supplementary deficit contribution of €1.9m which the Group reserves the right to reduce or terminate on consultation with the Trustees, if the Scheme Actuary advises that it is no longer required due to a correction in market conditions. Funding Proposals cover the period to 31 December 2016. However, they will cease at an earlier date if the scheme funding target is met before then. The actuaries advised that as at 31 December 2013 the schemes were on track to meet the minimum funding standard and risk reserve by 31 December 2016, the end of the Funding Proposal period. Following the 2011 actuarial valuation of the UK defined benefit pension scheme, a Schedule of Contributions and Recovery Plan was agreed committing the Group to annual contributions of £0.4m which the Directors believe will enable the scheme to meet the Statutory Funding Objective by June 2015. The schemes’ independent actuary, Mercer (Ireland) Limited, has employed the projected unit credit method to determine the present value of the defined benefit obligations arising and the related current service cost. At 28 February 2014, the retirement benefit obligations computed in accordance with IAS19 (R) Employee Benefits amounted to a net deficit of €21.4m gross of deferred tax (€22.8m deficit with respect to the ROI schemes and a €1.4m surplus with respect to the UK scheme) and €18.8m net of deferred tax (2013: €21.5m gross and €18.8m net of deferred tax). The movement in the net deficit is as follows:- €m Deficit at 1 March 2013 21.5 Employer contributions paid (6.8)
Actuarial loss 6.4 Charge to the income statement 0.5 FX adjustment on retranslation (0.2)
Net deficit at 28 February 2014 21.4
Comprising:
ROI scheme retirement benefit deficit 22.8 UK scheme retirement benefit surplus (1.4)
Net deficit at 28 February 2014 21.4
The benefit of employer contributions of €6.8m on the retirement benefit pension obligations on the IAS 19(R) basis was offset by an actuarial loss of €6.4m. The actuarial loss primarily arose as a result of a reduction in the discount rate applied to liabilities: ROI schemes reduced from 3.8% - 4.25% at 28 February 2013 to 3.4% - 3.6% at 28 February 2014. This loss was partially reduced by an experience gain of €8.4m in relation to membership movements. All other significant assumptions applied in the measurement of the Group’s pension obligations at 28 February 2014 are broadly consistent with those as applied at 28 February 2013.
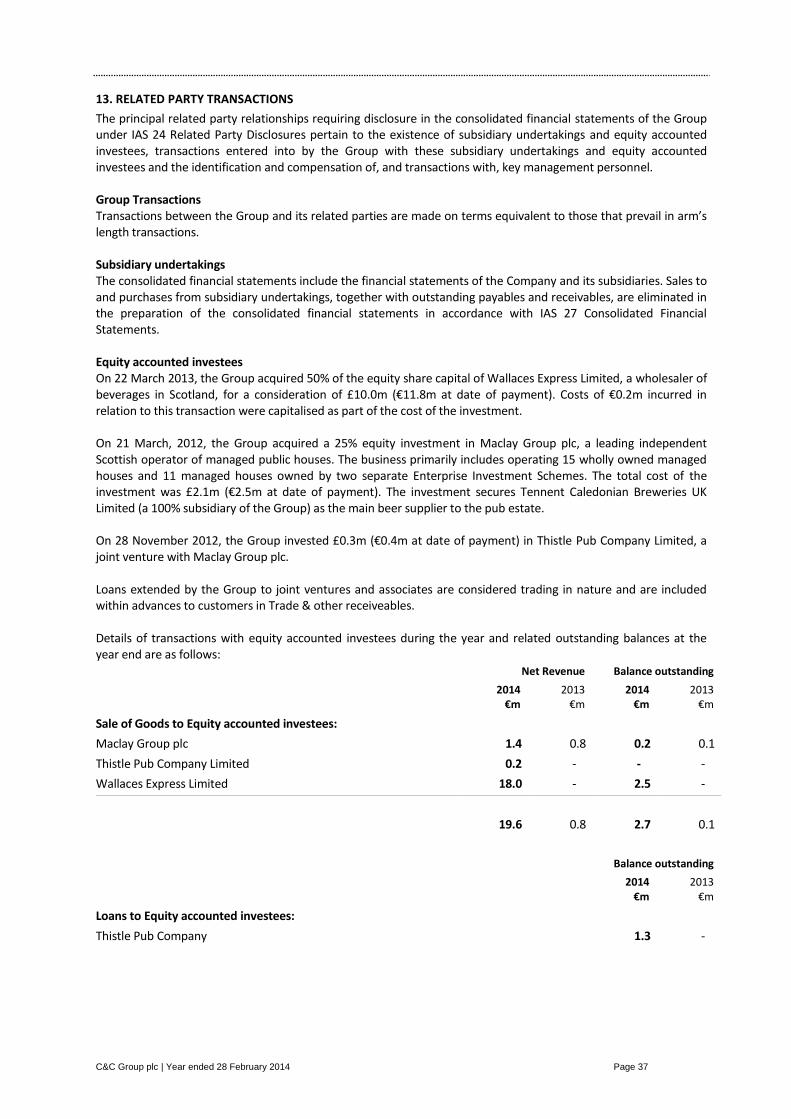
C&C Group plc | Year ended 28 February 2014 Page 37
13. RELATED PARTY TRANSACTIONS
The principal related party relationships requiring disclosure in the consolidated financial statements of the Group under IAS 24 Related Party Disclosures pertain to the existence of subsidiary undertakings and equity accounted investees, transactions entered into by the Group with these subsidiary undertakings and equity accounted investees and the identification and compensation of, and transactions with, key management personnel. Group Transactions Transactions between the Group and its related parties are made on terms equivalent to those that prevail in arm’s length transactions. Subsidiary undertakings The consolidated financial statements include the financial statements of the Company and its subsidiaries. Sales to and purchases from subsidiary undertakings, together with outstanding payables and receivables, are eliminated in the preparation of the consolidated financial statements in accordance with IAS 27 Consolidated Financial Statements. Equity accounted investees On 22 March 2013, the Group acquired 50% of the equity share capital of Wallaces Express Limited, a wholesaler of beverages in Scotland, for a consideration of £10.0m (€11.8m at date of payment). Costs of €0.2m incurred in relation to this transaction were capitalised as part of the cost of the investment. On 21 March, 2012, the Group acquired a 25% equity investment in Maclay Group plc, a leading independent Scottish operator of managed public houses. The business primarily includes operating 15 wholly owned managed houses and 11 managed houses owned by two separate Enterprise Investment Schemes. The total cost of the investment was £2.1m (€2.5m at date of payment). The investment secures Tennent Caledonian Breweries UK Limited (a 100% subsidiary of the Group) as the main beer supplier to the pub estate. On 28 November 2012, the Group invested £0.3m (€0.4m at date of payment) in Thistle Pub Company Limited, a joint venture with Maclay Group plc. Loans extended by the Group to joint ventures and associates are considered trading in nature and are included within advances to customers in Trade & other receiveables. Details of transactions with equity accounted investees during the year and related outstanding balances at the year end are as follows: Net Revenue Balance outstanding
2014
€m 2013
€m 2014
€m 2013
€m
Sale of Goods to Equity accounted investees:
Maclay Group plc 1.4 0.8 0.2 0.1
Thistle Pub Company Limited 0.2 - - -
Wallaces Express Limited 18.0 - 2.5 -
19.6 0.8 2.7 0.1
Balance outstanding
2014
€m 2013
€m
Loans to Equity accounted investees:
Thistle Pub Company 1.3 -
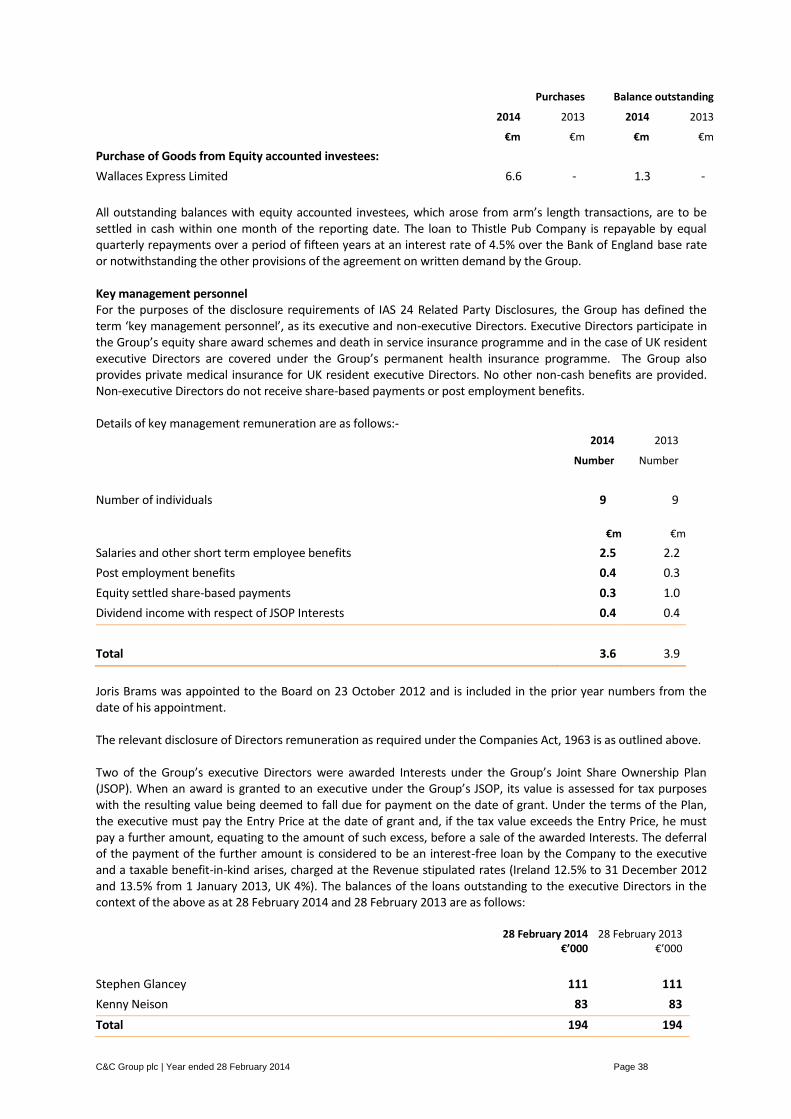
C&C Group plc | Year ended 28 February 2014 Page 38
Purchases Balance outstanding
2014 2013 2014 2013
€m €m €m €m
Purchase of Goods from Equity accounted investees:
Wallaces Express Limited 6.6 - 1.3 -
All outstanding balances with equity accounted investees, which arose from arm’s length transactions, are to be settled in cash within one month of the reporting date. The loan to Thistle Pub Company is repayable by equal quarterly repayments over a period of fifteen years at an interest rate of 4.5% over the Bank of England base rate or notwithstanding the other provisions of the agreement on written demand by the Group. Key management personnel For the purposes of the disclosure requirements of IAS 24 Related Party Disclosures, the Group has defined the term ‘key management personnel’, as its executive and non-executive Directors. Executive Directors participate in the Group’s equity share award schemes and death in service insurance programme and in the case of UK resident executive Directors are covered under the Group’s permanent health insurance programme. The Group also provides private medical insurance for UK resident executive Directors. No other non-cash benefits are provided. Non-executive Directors do not receive share-based payments or post employment benefits. Details of key management remuneration are as follows:- 2014 2013
Number Number
Number of individuals 9 9
€m €m
Salaries and other short term employee benefits 2.5 2.2
Post employment benefits 0.4 0.3
Equity settled share-based payments 0.3 1.0
Dividend income with respect of JSOP Interests 0.4 0.4
Total 3.6 3.9
Joris Brams was appointed to the Board on 23 October 2012 and is included in the prior year numbers from the date of his appointment. The relevant disclosure of Directors remuneration as required under the Companies Act, 1963 is as outlined above. Two of the Group’s executive Directors were awarded Interests under the Group’s Joint Share Ownership Plan (JSOP). When an award is granted to an executive under the Group’s JSOP, its value is assessed for tax purposes with the resulting value being deemed to fall due for payment on the date of grant. Under the terms of the Plan, the executive must pay the Entry Price at the date of grant and, if the tax value exceeds the Entry Price, he must pay a further amount, equating to the amount of such excess, before a sale of the awarded Interests. The deferral of the payment of the further amount is considered to be an interest-free loan by the Company to the executive and a taxable benefit-in-kind arises, charged at the Revenue stipulated rates (Ireland 12.5% to 31 December 2012 and 13.5% from 1 January 2013, UK 4%). The balances of the loans outstanding to the executive Directors in the context of the above as at 28 February 2014 and 28 February 2013 are as follows:
28 February 2014
€’000 28 February 2013
€’000
Stephen Glancey 111 111
Kenny Neison 83 83
Total 194 194

C&C Group plc | Year ended 28 February 2014 Page 39
The loans fall due for repayment prior to the sale of their awarded Interests.
14. POST BALANCE SHEET EVENT
Acquisition of remaining shares in Wallaces Express Limited On 18 March 2014, the Group announced it acquired the remaining 50% equity share capital of Wallaces Express Limited, a wholesaler of beverages in Scotland. This purchase follows the acquisition of a 50% stake in the business in March 2013. The consideration for the acquisition of the remaining 50% was £10.0m (€12.0m euro equivalent at date of acquisition). The assets and liabilities of Wallaces Express Limited, on 18 March 2014, date of acquisition were as follows:- Wallaces
Book value €m
Property, plant & equipment 3.9
Brands & other intangible assets 0.3
Inventories 10.5
Trade & other receivables – current 9.4
Cash and cash equivalents 3.4
Trade & other payables (10.7)
Current tax liabilities (0.1)
Net identifiable assets and liabilities on date of acquisition 16.7
Total consideration paid to acquire remaining 50% 12.0
The preliminary assessment of the financial position of Wallaces as at 18 March 2014 indicates that no fair value adjustments are required.